1
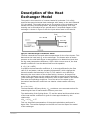
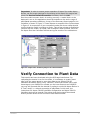
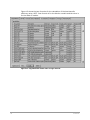
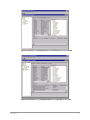
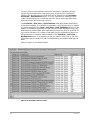
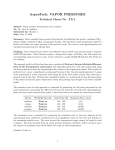
Aspen OnLine Tutorial Version Number: V7.3 March 2011 Copyright (c) 2001-2011 by Aspen Technology, Inc. All rights reserved. Aspen OnLine®, Aspen Plus®, Aspen CIM-IO Interfaces™, Aspen InfoPlus.21®, IP.21™, aspenONE, the aspen leaf logo and Plantelligence and Enterprise Optimization are trademarks or registered trademarks of Aspen Technology, Inc., Burlington, MA. All other brand and product names are trademarks or registered trademarks of their respective companies. This document is intended as a guide to using AspenTech's software. This documentation contains AspenTech proprietary and confidential information and may not be disclosed, used, or copied without the prior consent of AspenTech or as set forth in the applicable license agreement. Users are solely responsible for the proper use of the software and the application of the results obtained. Although AspenTech has tested the software and reviewed the documentation, the sole warranty for the software may be found in the applicable license agreement between AspenTech and the user. ASPENTECH MAKES NO WARRANTY OR REPRESENTATION, EITHER EXPRESSED OR IMPLIED, WITH RESPECT TO THIS DOCUMENTATION, ITS QUALITY, PERFORMANCE, MERCHANTABILITY, OR FITNESS FOR A PARTICULAR PURPOSE. Aspen Technology, Inc. 200 Wheeler Road Burlington, MA 01803-5501 USA Phone: (1) (781) 221-6400 Toll Free: (1) (888) 996-7100 URL: http://www.aspentech.com Contents List of Figures and Tables........................................................................................v 1 Tutorial Overview ................................................................................................1 Introduction ....................................................................................................2 Description of the Heat Exchanger Model ............................................................3 Dual Objective On-line Project ...........................................................................4 Software Requirements.....................................................................................4 Step-by-Step Instructions .................................................................................4 Pictures of the Aspen OnLine Screens .................................................................5 Technical Support ............................................................................................5 2 Project Initialization ...........................................................................................6 Initialization Steps............................................................................................6 Load Model and Verify Operation Under Aspen Plus ..............................................6 Verify Connection to Plant Data..........................................................................7 3 Create a New Project.........................................................................................10 Steps to Create a New Project ......................................................................... 10 4 Configure the Engine Data.................................................................................14 Configuration Steps ........................................................................................ 14 Model Structure and Solution Strategy .............................................................. 14 Summary of Model Inputs and Outputs ............................................................. 15 Starting Engine Configuration .......................................................................... 17 Selecting Plant Tags in Tag Browser ................................................................. 17 Define Plant and Internal Application Tags Manually ........................................... 19 Define the Heat Transfer Efficiency Tag and Specify its Write-back to IMS ............. 20 Connect the heatxn1 and heatxn2 Models ......................................................... 24 Link Model Variables to Tags............................................................................ 25 Identifying the Correct Model Variable .............................................................. 28 Define Unit Conversion Factors ........................................................................ 28 Define Model Variable Properties ...................................................................... 29 Configure Data Validation................................................................................ 31 Configure Steady State Detection..................................................................... 32 Configure Initialization Form ............................................................................ 33 Configure CIMIO Connection............................................................................ 34 Configure Automatic Execution of Model Calculations .......................................... 34 5 The Graphical User Interface.............................................................................36 Steps to Build a GUI ....................................................................................... 36 Initialize the Graphical User Interface ............................................................... 36 Using the Graphics Library Diagrams ................................................................ 38 Contents iii Import Diagram and Add Process Lines ............................................................. 38 Add Labels to Drawing .................................................................................... 40 Add Tags to Drawing ...................................................................................... 41 Add Control Buttons to the Drawing.................................................................. 42 The Completed Heatx1 GUI ............................................................................. 43 Creating the What-if GUI (Heatx2) ................................................................... 44 6 Running the Application ....................................................................................45 Application Execution...................................................................................... 45 Results of OnLine Model Calculations ................................................................ 47 iv Contents List of Figures and Tables Figure 1: The Three Major System Elements........................................................2 Figure 2: Heat Exchanger with Known Values ......................................................3 Figure 3: Aspen Plus Summary Report for the Preheater .......................................7 Figure 4: Initial Aspen CIM-IO Interfaces test screen ............................................9 Figure 5: Aspen OnLine Project Manager window................................................ 11 Figure 6: Blank Project Creation Form............................................................... 11 Figure 7: Completed Project Creation Form ....................................................... 12 Figure 8: Aspen OnLine Project Manager screen with new project listed ................ 12 Table 1: Model Input and Output Variables ........................................................ 16 Figure 9: Aspen Tag Browser after finding heat exchanger variable tags in IP.21 ... 19 Figure 10: Tag Definition sheet after plant tags transferred ................................. 19 Figure 11: Tag Definition sheet after all tags entered.......................................... 22 Figure 12: Formula sheet with UEFF calculation shown........................................ 23 Table 2 Tag Names and Model Variable Names................................................... 25 Figure 13: Variable-Tag Mapping sheet before mapping is performed ................... 27 Figure 14: Variable-Tag Mapping sheet after mapping is performed ...................... 27 Figure 15: Units Conversion | Specifications sheet.............................................. 29 Figure 16: Variables default values................................................................... 30 Figure 17: Data Validation sheet ...................................................................... 31 Figure 18: Tags | Grid View | SS Detection sheet ............................................... 32 Figure 19: Tags | Grid View | Initialization sheet ................................................ 33 Figure 20: Tags | Grid View | CIM-IO sheet ....................................................... 34 Figure 21:Completed Models | model name | Schedule sheet for heatxn1.bkp ....... 35 Figure 22: Blank user GUI form displayed in Aspen OnLine Client window ............. 37 Figure 23: Completed Heat Exchanger Monitor Diagram in the GUI Builder............ 43 Figure 24: Completed Heat Exchanger What-if Diagram in the GUI Builder ............ 44 Figure 25: Heat Exchanger Monitor GUI with Results .......................................... 47 Figure 26: Heat Exchanger What-if GUI with Results........................................... 48 Contents v 1 Tutorial Overview Contents 1 Introduction The user is strongly urged to practice with this tutorial before attempting to implement an on-line application. The time spent in practice will be well rewarded when it comes time to implement an actual on-line model. The objective of this tutorial is to take the user step-by-step through the implementation of an on-line model so that each step of the implementation is clearly understood. There are three major connected elements that must function properly. As shown in Figure 1, these include: the plant Information Management System (IMS) or Distributed Control System (DCS) the engineering model the Aspen OnLine system A s pen O nLin e P lan t D ata M o del Figure 1: The Three Major System Elements The first step in the implementation is to make sure that the connection to the plant data is working properly. The second step is to make sure the model is working correctly. The third step involves configuring Aspen OnLine to support an on-line model. The steps for setting up an Aspen OnLine application include: Creating the on-line project Configuring the engine Developing the graphical user interface Testing Placing the system on line The above tasks can be performed using Aspen OnLine client programs either remotely or locally. In this tutorial one computer will serve as both the client and the server. The operating system for the Aspen OnLine server and client must be Windows NT 4.0 SP6 or Win2K with SP2. In this tutorial Windows NT will be the operating system for both Aspen OnLine client and server. 2 Contents Description of the Heat Exchanger Model The model in this tutorial is of a steam-heated oil preheater. It is a fully specified two-pass horizontal heat exchanger with steam on the shell side and oil in the tubes. The model acts as an on-line monitor of the preheater heat transfer efficiency and fouling factor. By tracking these factors over time, cleaning can be scheduled on an optimal basis. A simplified diagram of the exchanger is shown in Figure 2 with the input values used in this tutorial. Figure 2: Heat Exchanger with Known Values The flow rate and the inlet and outlet temperatures for the oil are known. This determines the heat load, Q, on the exchanger. The known value of steam pressure on the shell side allows its temperature to be determined, and thus the log mean temperature difference, LMTD. With a known area A, the heat transfer coefficient U can be determined from the equation U = Q / (A * LMTD) In practice the heat transfer coefficient, U, is strongly affected by the flow rate of oil and steam, and the operating temperature, which changes the thermal transfer characteristics of the oil. This makes it very difficult to determine the true extent of the surface fouling. However, an Aspen Plus model of the exchanger can be used to calculate an actual and a theoretical (clean exchanger) heat transfer coefficient, both of them based on the actual flow rates and operating conditions. From the ratio of the actual to the theoretical heat transfer coefficient one obtains a heat transfer efficiency factor, Ueff = Uact / Utheo The heat transfer efficiency factor, Ueff, provides a more accurate method for measuring the loss of heat transfer efficiency over time. The relationship of the fouling factor, FF, and the actual and theoretical values of the heat transfer coefficient is given to close approximation by the relationship 1/Uact = 1/ Utheo + FF This is a simplified representation of the actual calculations performed in Aspen Plus. The values displayed on the GUI are from the Aspen Plus model of the exchanger. Contents 3 Dual Objective On-line Project This tutorial will demonstrate the use of an Aspen OnLine project to accomplish two application objectives. In its primary use, as a plant equipment monitor, values of heat transfer efficiency and fouling factor will be calculated periodically. This provides a measure of the deterioration in heat exchanger performance and enables better decisions as to when to take corrective maintenance action. Values of heat transfer efficiency calculated by Aspen OnLine in the equipment monitoring mode will be sent to the plant IMS and stored there for trending and further analysis. The project will also be used to perform evaluations (what-if analysis) of the changes in steam demand caused by varying cold oil inlet temperatures. This what-if application also illustrates the procedure for entering user values at run-time via the graphical user interface. Taking this idea further, it can be seen that an on-line project can be developed to address multiple needs or opportunities to improve plant operations. Some representative types of Aspen OnLine applications are described in the Aspen OnLine User Guide. Software Requirements The process models are developed with Aspen Plus. Aspen OnLine is not used to develop the process models; rather Aspen OnLine uses a fully developed Aspen Plus model and places it “on-line” with actual plant data. Aspen Plus needs to be installed in the same computer as the Aspen OnLine server. This tutorial requires this software: Aspen Plus 2004.1 or later Aspen OnLine 2004 or later Aspen Process Explorer 3.1 or later from Aspen Manufacturing Suite (recommended but optional) Microsoft Excel 2000 or later In this tutorial Aspen InfoPlus 21 (IP.21) is the plant IMS and Aspen CIM-IO Interfaces is the interface between the server and the plant IMS. The Aspen Process Explorer is optional; it permits easy transfer of tag information from IP.21 to Aspen OnLine. However, this tag information can be entered manually if Process Explorer is not available. In addition, Microsoft Excel 2000 is needed. The operating system is Windows 2000 or later. Step-by-Step Instructions The instructions in this tutorial provide step-by-step instructions showing how the heat exchanger problem is defined and placed on-line. There are three columns in each table. The column on the left describes the action of the user. The column in the middle shows the title of the active display that 4 Contents should appear if the user has taken the correct action. This column shows a new display title only when the active display changes. The column on the right describes the results of the action. Characters and words shown in bold are either read from or written to the screen. Pictures of the Aspen OnLine Screens Many figures are included in this tutorial to show Aspen OnLine screen sequences and how each screen should appear if properly configured. Some of the data the user will introduce in the development of the on-line heat exchanger project will be provided from these figures. Technical Support AspenTech customers with a valid license and software maintenance agreement can register to access the online AspenTech Support Center at: http://support.aspentech.com This Web support site allows you to: Access current product documentation Search for tech tips, solutions and frequently asked questions (FAQs) Search for and download application examples Search for and download service packs and product updates Submit and track technical issues Send suggestions Report product defects Review lists of known deficiencies and defects Registered users can also subscribe to our Technical Support e-Bulletins. These e-Bulletins are used to alert users to important technical support information such as: Technical advisories Product updates and releases Customer support is also available by phone, fax, and email. The most up-todate contact information is available at the AspenTech Support Center at http://support.aspentech.com. Contents 5 2 Project Initialization Initialization Steps Project initialization involves the steps that need to be performed before development activities begin. These steps include: Testing the model using Aspen Plus User Interface Verifying that the connection to plant data is operational Creating the Project After the project is created there are three additional steps to complete. These include: Project specifications required by Aspen OnLine engine program Configuring the Graphical User Interface Testing the Project These steps are described in detail in the following sections. Load Model and Verify Operation Under Aspen Plus An Aspen OnLine project can make use of multiple models with each model being used to fulfill a different objective. This tutorial requires only a single model. However, to illustrate how two models can be used, two copies of the same model will be used, one for each of the two objectives of this example application. There is a Documentation subdirectory in the directory where Aspen OnLine is installed. Copy heatxn1.bkp from the Documentation directory to any temporary model test folder. Open the heatxn1.bkp file using Aspen Plus User Interface. If the model cannot be successfully loaded, there is a problem with Aspen Plus that needs to be corrected before proceeding. When you load the file, Aspen Plus may display the Connect to Engine dialog box. In most cases, the default option to run the Aspen Plus engine on the Local PC is correct. 6 Contents Important: In order to ensure proper operation of Aspen Plus under Aspen OnLine, set the proper settings for connecting to the Aspen Plus engine and select the Save as Default Connection checkbox, then click OK. Run the model to ensure that it is working correctly. A model that is to be deployed in an on-line application should be tested over the entire range of anticipated operating conditions. A copy of the Summary Report page for the Preheater is shown in Figure 3. These outputs correspond to the inputs shown in Figure 2. A comparison of your computed results with these values should confirm that the model is working correctly. Take a few minutes to familiarize yourself with the model, its inputs, and its outputs. When finished, exit from the Aspen Plus User Interface without saving the results of the calculations. Figure 3: Aspen Plus Summary Report for the Preheater Verify Connection to Plant Data This tutorial has been developed using the DCS tags listed below. For replicating the tutorial in an on-line mode, it is necessary to create “plant tags” with the same names in your plant data server (Aspen CIM-IO Interfaces accessible IMS or DCS). However, should you choose not to add these tags to your IMS/DCS or should you not have access to an IMS/DCS you may still proceed with the tutorial by opting to work with Aspen OnLine in a “Test” mode, i.e. without connecting to plant data. In this case, the instructions for Aspen CIM-IO Interfaces configuration and Aspen CIM-IO Interfaces test can be ignored. The values given below would be entered directly as test values in the CIM-IO form as described later. Contents 7 For simplicity, the values for the tags below can be entered in the IMS/DCS as static values. Tag Value Units HX-F-101 500 gpm HX-T-101 100 F HX-T-102 200 F HX-P-401 100 psig HX-P-301 75 psig Once the plant tags have been created, test access to them using Aspen CIMIO Interfaces. Aspen CIM-IO Interfaces is the AspenTech software interface to the plant IMS and has been loaded along with Aspen OnLine. It transfers information between the Aspen OnLine Engine in the Aspen OnLine server computer and the plant IMS in the IMS server computer. Use the Aspen CIMIO Interfaces test function to make sure that this interface is operating correctly, and that IP.21 is running. The device, node, and service names used in this tutorial are for an IP.21 system on the AspenTech network. The Plant Tags used in this heat exchanger example are in this server. Logical Device Name: IOSETCIM200 Node Name for the IMS server: LIH1 Services: CIMIOSETCIM_200 CIMIOSETCIMH_200 The names in your system could be different. Consult with your System Manager to determine what names to use. The following table provides a step-by-step list of instructions to test access to plant data from an IP.21 system. You will need to refer to the respective Aspen CIM-IO Interfaces device interface manual for other systems. The first screen is shown in Figure 4. The objective of the test is to verify that a communication link to the plant data source has been established. A GET successful message at the end of this test indicates that the connection to the plant data is working correctly. If the test fails, then verify that both the IP.21 and Aspen OnLine machines have been properly configured. Refer to the Aspen OnLine User Manual section on Configuration, or consult the Information Management Systems manager at your site. Verify Connection to Plant Data Button Sequence Title of Active Screen Result Click Start button on Status bar. Desktop Activates workstation menu Point to Programs | AspenTech | Advanced Process Control & Optimization | Aspen Cim-IO Interfaces and click Test API. CIM-IO Test Press a key to make your selection: Enter 9 8 Please enter logical device name[]: Contents Button Sequence Title of Active Screen Result Enter IOSETCIM200 Please enter unit number[]: Enter 1 Please enter number of tags[]: Enter 1 Please enter priority <1=HIGHEST 9=LOWEST>[]: Enter 1 Please enter timeout in seconds[]: Enter 1 Please select access type[]: Enter 1 Please enter list id[]: Enter 1 Please select tagname entry option[]: Enter 1 Please enter tagname 1: Enter HX-F-101 Please select data type for tag ‘HX-F-101’: Enter 1 Please select device data type for tag ‘HX-F-101’ Press RETURN for default: Press Return (or Enter) GET successful Tagname: hx-f-101 Type: REAL Device Data Type: REAL Value= 500.000000 Timestamp: Wed 16 14:27:59 1998 Status is no status Facility=19 Driver Status= 0 Please press RETURN to continue… Press Return (or Enter) Enter x Press a key to make your selection: Desktop Figure 4: Initial Aspen CIM-IO Interfaces test screen Contents 9 3 Create a New Project Steps to Create a New Project Once the process model and connection to plant data source have been tested, the on-line project can be created. The project creation step in Aspen OnLine will set up the file-structure for the project as well as an blank project database, config.mdb, in which configuration information can be entered at the time of project development. Three sub-folders will be created in the chosen project folder. Aspen OnLine Project Manager program is used to manage Aspen OnLine projects including project creation. The following table provides a list of steps to follow to create a project. Create New Aspen OnLine Project Button Sequence Title of Active Screen Result Start | Programs | AspenTech | Aspen Engineering Suite | Aspen OnLine <version> | Project Manager Aspen OnLine <version> Project Manager Aspen OnLine <version> Project Manager window Type the server computer name (for example, aeschem2) in the Computer field and then press Enter Click Create Create and Register buttons are enabled Create project on aeschem2 Create project on aeschem2 dialog box appears, where aeschem2 is the server computer name used. By default, Create a blank project option is selected. Type new project name: Heatx Heatx is the project name Specify new project location by clicking corresponding Browse button or by typing: d:\apowork The new location is a folder where the new project will be created. Do not use a backslash ( \ ) at the end of the name. Click Create Click Close to close Aspen OnLine Project Manager window 10 Aspen OnLine <version> Project Manager The new Aspen OnLine project has been created. Aspen OnLine project Manager window is closed Contents Figure 5: Aspen OnLine Project Manager window Figure 6: Blank Project Creation Form Contents 11 Figure 7: Completed Project Creation Form Figure 8: Aspen OnLine Project Manager screen with new project listed Based on the information provided during the project creation step, Aspen OnLine creates the following directory structure and creates a blank database. The Engine Configuration database is actually a set of structured files and is 12 Contents identified by the project name. The GUI Configuration database is a file named Heatx.GDB. These files are placed in the Engine and GUI folders respectively. Directory Structure Files [D:]___ | apowork | Heatx Config.mdb | Hist | OffLine | OnLine At this point, all three folders within the Heatx directory are empty. Config.mdb is a blank database that will be used to hold all project configuration information. Project specifications needed by Aspen OnLine engine program and end-user GUI configuration are stored in this database. Furthermore, all clients of this project share this database during run-time. Copy the heatxn1.bkp and heatxn2.bkp file from the Documentation directory to the OffLine sub-folder in the HeatX directory; heatxn1.bkp will be used as the monitoring model and heatxn2.bkp will be used as the What-if model. When the new project is created, the on-line project structure is created. Configuration information must be provided to develop the project into a fullblown on-line application. Contents 13 4 Configure the Engine Data Configuration Steps Configuring the Engine involves defining the process models and the plant data to be used, linking of model input and output variables to application tag names, and providing information for the analysis and validation of data, and for any other calculations that are to be performed by the on-line application. Plant tags whose values are input to the model are used in Aspen OnLine with the same names as specified in the plant IMS/DCS. Model output variables must be associated with tags whose names are specified by the user. Configuring the engine data consists of three steps. The first step involves identifying plant tag names and generating tag names for the variables that represent model input and output. The next step involves identifying and linking the Aspen Plus model variables to the tag names. The last step involves providing all the additional data validation and analysis information as well as application control information. Model Structure and Solution Strategy Some understanding of the model structure and solution strategy is needed before we can link tag names to model variables. The model consists of three blocks: the preheater, a steam valve, and a duplicator block, which is merely a modeling artifact that is used to specify the oil temperature at the outlet of the preheater. Design Spec 1 is used to vary the steam flow so that the heat exchanger duty matches the change in enthalpy of the oil. Design Spec 2 varies the oil-side fouling factor until the calculated exchanger area matches the specified area. Most of the tag-to-model variable links are conventional. Two links need further explanation. The plant exit oil temperature tag is linked to the dummy duplicator inlet stream, XS1. This is because in this model, Aspen Plus will not permit the direct specification of the oil outlet temperature. The calculated fouling factor is obtained as output from Design Spec 2, and must be linked to the fouling factor tag. 14 Contents Summary of Model Inputs and Outputs The model input and output variables are described in Table 1. This tutorial illustrates the use of plant tag values and an internal application tag value (operator what-if input value) as inputs to process models and the use of internal application tags to display and manipulate model results. When plant tag values are used as inputs to the model, the tag names used in Aspen OnLine must be identical to the names used in IP.21. Internal application tags can have any user-specified names. Both models in this tutorial use the same sources of plant values. In addition, the What-if model also has a tag for operator entry of the inlet oil temperature. When an on-line project uses multiple models, it is recommended that internal application tags associated with model output values be unique to each model. In this tutorial, the internal application tags associated with the What-if model are identified with the prefix HXWI while the output values from the monitor model are identified with the prefix HX. There are three Aspen OnLine tag types shown in this table. The DCS tags refer to the plant tags in IP.21 whose values are used as inputs to the on-line application. Local GUI (or local) tags are internal application tags that are used internally in the on-line application to manage data transfers and present results in the GUI; the values of these tags can be different for different users depending upon the values provided as inputs to model calculations. Aspen OnLine can be used to create mathematical functions of tag values and compute the function values. The computed function values are stored in Formula tags. Contents 15 Model Input/ Output Tag Name Description Tag Type Input HX-F-101 Oil Flowrate DCS Input HX-T-101 Oil Inlet Temperature DCS Input HX-T-102 Oil Outlet Temperature DCS Input HX-P-401 Steam Header Pressure DCS Input HX-P-301 Exchanger Steam Pressure In DCS Output HX-UACT Actual Heat Transfer Coefficient Local GUI Output HX-UCLEAN Clean Exchanger U Local GUI Output HX-UEFF U Efficiency Formula Output HX-FOULFCTR Oil Side Fouling Factor Local GUI Output HX-T-301-CALC Shell Side Temperature Local GUI Output HX-F-401-CALC Calculated Steam Flow Local GUI HXWI-T-101-INPUT WIF Oil Inlet Temperature Entry Local GUI Output HXWI-UACT WIF Actual Heat Transfer Coefficient Local GUI Output HXWI-UCLEAN WIF Clean Exchanger U Local GUI Output HXWI-UEFF WIF U Efficiency Formula Output HXWI-FOULFCTR WIF Oil Side Fouling Factor Local GUI Output HXWI-T-301-CALC WIF Shell Side Temperature Local GUI Output HXWI-F-401-CALC WIF Calculated Steam Flow Table 1: Model Input and Output Variables Monitor Outputs What If Input Input What If Outputs 16 Local GUI Contents Starting Engine Configuration The blank database that has been created for the Heatx project must now be provided enough information to develop it into a useful on-line application. To start project configuration: 1 Click the Windows Start button, then Programs | AspenTech | Aspen Engineering Suite | Aspen OnLine <version> | Client GUI. The Aspen OnLine main window and Aspen OnLine Startup dialog box are displayed. Select the appropriate Server name and Project name. Project password is blank by default. (Use the Aspen OnLine Project Manager program to set or change the project password.) 2 Click OK to close the Startup dialog box. The Aspen OnLine Control Panel appears. The Control Panel is used at run-time and can be closed during project configuration. 3 Click Data Browser command on the Data menu (or click Data browser button on the toolbar) to bring up the Aspen OnLine Data Browser. The Data Browser is used for project configuration and you can open several data browsers at the same time. Selecting Plant Tags in Tag Browser Open a Data browser and navigate to the Tags | Grid View | Tag Definition sheet. Note that there are some tags defined already. These are signal tags and are used during run-time. Therefore, they can be ignored during project configuration. In this tutorial, the plant tags for use in the heat exchanger project are dragged and dropped from IP.21 into the Tag Definition sheet of the Engine Configuration interface using the Tag Browser component of Aspen Process Explorer. This is only available if Aspen Process Explorer is installed on the Aspen OnLine server PC. If the DCS (plant) tags needed for this tutorial are not created in IP.21 or if Process Explorer is not installed in this PC, these tags cannot be dragged and dropped into the Tag Definition form. In these cases, enter the tags manually as described in the Define Plant and Internal Application Tags Manually section, and specify them as DCS tags. Contents 17 Define Plant Variable Tags Using the Tag Browser Button Sequence Title of Active Screen Start | Programs | AspenTech | Aspen Engineering Suite | Aspen OnLine <version> | Client GUI if Client GUI has not already started Aspen OnLine Startup dialog box Select server name from the list. Aspen OnLine – Heatx on aeschem2 Select project name from the list. Result Aspen OnLine main window with Control Panel becomes active. Aeschem2 represents the server machine name. Click OK Click Close on the Control Panel Control Panel closes Click Data Browser button on the toolbar Data Browser A Data Browser is displayed In the Data Browser, expand Tags node and then, under Tags node, click Grid View node Tags Grid View – Data Browser Tag Definition sheet is displayed Click Tag Browser Aspen Tag Browser Ready to search for tags Type HX* in Tag Name box and click Execute All heat exchanger tags created in IP.21 for this project are displayed. Select the first five tags. (Click top variable then shiftclick fifth tag.) Five tags highlighted Drag and drop five selected tags onto Tag Definition sheet Select CIM-IO Device Transfer inhibited and data entry screen appears For CIMIO Device enter IOSETCIM200 Aspen Tag Browser Variable tags still highlighted Drag and drop five selected tags onto Tag Definition sheet Tag Definition Form Five tags now displayed in Tag Definition sheet. Note that Aspen OnLine now provides a built-in engineering unit system. If a unit string used in IMS (e.g., IP.21) does not match in the Aspen OnLine unit system, then a dialog box will popup and request you to manually find a match. Create a new unit type and units if necessary. Close Tag Browser Tags Grid View – Data Browser For CIMIO Source enter DVBL Click OK 18 Contents Figure 9: Aspen Tag Browser after finding heat exchanger variable tags in IP.21 Figure 10: Tag Definition sheet after plant tags transferred Define Plant and Internal Application Tags Manually The user must manually enter all non-plant, internal application tags in the Tag Definition sheet. Plant tags must also be entered manually when a DCS or a non-AspenTech IMS is used, Process Explorer is not available, or when this tutorial is being used without connecting to a plant data server. The following procedure used to enter internal application tags is also applicable to plant tags. Plant variables are designated DCS, whereas the internal Contents 19 application variables are designated Manual, Formula, Local GUI, Average, SSD and Signal. Tags associated with on-screen data entry boxes must also be defined. These are designated Local GUI variables. One of the useful features of the Tag Definition display is the ability to click a column heading to instantly sort the table alphanumerically. Columns can also be resized by using standard Windows techniques. Use the New button to insert a new tag name into the Tag Definition sheet. Enter a full definition of the tag that is being added, including its units, tag type and whether this tag value is to be sent back to and stored in the plant IMS. The default tag type is Local GUI and by default no tag values will be stored in the IMS. In this tutorial, only the value of the tag HX-UEFF associated with the calculated heat transfer efficiency will be sent as output to IMS. The tags to be created and the information to be entered for each of these tags are shown in Figure 11 (in the following section of this chapter). Define Plant and Internal Application Tags Manually Button Sequence Title of Active Screen Open a Data Browser in the Aspen OnLine Client GUI and navigate to the Tags | Grid View | Tag Definition sheet. Tags Grid View – Data Browser Click New Add New Tag Specify Tag name, Description, Units type, Source units, Display units, and Tag type and select required option for Output to IMS. Click Add Next Tag. Continue until all tags are entered as shown in Figure 11. Click Quit. Result User-specified information entered and display reset for new entry. Data type should be Float. Tags Grid View – Data Browser All tag definitions entered. Define the Heat Transfer Efficiency Tag and Specify its Write-back to IMS The heat transfer efficiency value that is calculated by Aspen OnLine in the Monitor module of this example will be used as the indicator of the heat exchanger performance status. This value will be stored in the IMS for trending and further analysis to determine when the heat exchanger should be cleaned to maintain its efficiency at optimal levels. Aspen OnLine provides the ability to define a value to be calculated from a mathematical function of any combination of project tags and store the calculated value in a Formula tag. Any valid Excel expression may be used. 20 Contents This provides Aspen OnLine with a very powerful capability. In the case of the heat exchanger model, the heat transfer efficiency is determined by the ratio of UACT to UCLEAN. This requires that the UEFF be defined as a Formula tag. The value of any internal application tag (any tag other than a DCS tag) can be sent back to IMS and stored for further analysis. The Output to IMS attribute of an internal application tag should be set to Yes in the Tag Definition sheet to enable its value to be sent back and stored in the plant IMS. In this tutorial, the calculated values of the HX-UEFF tag will be stored in the IMS. To accomplish this, a tag should be created in the IMS (IP.21 in the case of this tutorial) with an identical name, that is, HX-UEFF and an initial value should be given to it. Thus, a tag named HX-UEFF is created in the IP.21 server in LIH1 and an initial value of 0.70 is given to this tag to denote 70% efficiency. An Aspen OnLine tag value is sent to the IMS only after the successful completion of scheduled or automatic, unattended model calculations. The value of a tag that is specified as a write-back tag will not be stored in the IMS after on-demand calculations. Unless information is provided in the Models | Scheduling sheet for automated model execution, the write-back action will not be implemented. Define the Write-back Tag Button Sequence Title of Active Screen Result Select Tags | Grid View | Tag Definition sheet. Tags Grid View – Data Browser Tag Definition sheet is displayed Click New. Add New Tag Tag name entry dialog box displayed Enter HX-UEFF for the Tag name, Heat Transfer Coefficient Efficiency for the Description, Contents for Units type, Fraction for the Source units, and Percent for the Display units. The new exchanger heat transfer efficiency value defined. For the Tag type select Formula. Establishes HX-UEFF as a computed variable. For Output to IMS select Yes. Establishes HX-UEFF as a write-back tag whose values will be stored in the IMS. Click Add Next Tag. Click Quit. Tags Grid View – Data Browser Tag Definition sheet is displayed Select the Formula tab. Tags Grid View – Data Browser HX-UEFF shown in the Tag name column Follow the syntax shown in the example and type [HX-UACT]/[HXUCLEAN] under Formula. Repeat entire sequence for the What-if model. Formula completed. Typing the left square bracket produces a drop-down list of all project tags. Tags Grid View – Data Browser HXWI-UEFF defined Figure 11 shows the Tag Definition sheet after all tags for both the monitoring and the What-if modules have been entered. Contents 21 Figure 12 shows the two formulas for the calculation of the heat transfer efficiency value, UEFF. One formula is for the Monitor module and the other is for the What-if module. Figure 11: Tag Definition sheet after all tags entered 22 Contents Figure 12: Formula sheet with UEFF calculation shown Contents 23 Connect the heatxn1 and heatxn2 Models A model is connected to Aspen OnLine with a simple sequence. More than one model can be connected by using this sequence repeatedly. Connect the heatxn1 and heatxn2 Models Button Sequence Title of Active Screen Result Select Models | Model Selector sheet. Models – Data Browser Models | Model Selector sheet is displayed. Click New. Open File-open dialog box displayed Browse into OffLine folder Found at D:\apowork\Heatx\OffLine\heatxn1.bkp Click Open. Models – Data Browser heatxn1.bkp appears on the Model Selector sheet Expand Models node in the tree view on the left and then click heatxn1.bkp node Models heatxn1.bkp – Data Browser Models | heatxn1.bkp | Specifications sheet is displayed. Click Offline to online. Offline to online Offline to online dialog box is displayed Click Start. Select the Data validation required checkbox. Variable list for this model is generated and Offline to online dialog box is closed. Models heatxn1.bkp – Data Browser Aspen OnLine checks to see that the plant data used as inputs to the application are within specified ranges. Inputs for the data validation and steady state detection will be specified later. Models – Data Browser heatxn2 connected Leave the Steady-state detection required checkbox cleared. Repeat this entire sequence for the What-if model. 24 Contents Link Model Variables to Tags Use the list of tag names and model variables given in Table 2 in the following manner. A list of all the project tag names appears at the left of the Models | model name | Variable-Tag Mapping sheet, and the model variable tree is displayed on the right. The tag that is to be associated with a model variable should be identified before searching the model variable tree for the variable name. Be sure not to confuse model input and output variables in the tree. Once the model variable name has been exposed in the variable tree, a link with the appropriate project tag is established by clicking and dragging the tag name onto the variable name and dropping it. Model Tag Name Model Variable Name HEATXN1 HX-UCLEAN ROOT.DATA.BLOCKS.PREHEATER.OUTPUT.HX_UAVC HEATXN1 HX-UACT ROOT.DATA.BLOCKS.PREHEATER.OUTPUT.HX_UAVD HEATXN1 HX-P-301 ROOT.DATA.BLOCKS.VALVE.INPUT.P_OUT HEATXN1 HX-FOULFCTR ROOT.DATA.CONVERGENCE.CONVERGENCE.$OLVER02. OUTPUT.VAR_VAL.1 HEATXN1 HX-T-301-CALC ROOT.DATA.STREAMS.CNDNSATE.OUTPUT.TEMP_OUT.MIXED HEATXN1 HX-T-101 ROOT.DATA.STREAMS.COLDOIL.INPUT.TEMP.MIXED HEATXN1 HX-F-101 ROOT.DATA.STREAMS.COLDOIL.INPUT.TOTFLOW.MIXED HEATXN1 HX-P-401 ROOT.DATA.STREAMS.STEAM.INPUT.PRES.MIXED HEATXN1 HX-F-401-CALC ROOT.DATA.STREAMS.STEAM.OUTPUT.MASSFLMX.MIXED HEATXN1 HX-T-102 ROOT.DATA.STREAMS.XS1.INPUT.TEMP.MIXED HEATXN2 HXWI-UCLEAN ROOT.DATA.BLOCKS.PREHEATER.OUTPUT.HX_UAVC HEATXN2 HXWI-UACT ROOT.DATA.BLOCKS.PREHEATER.OUTPUT.HX_UAVD HEATXN2 HX-P-301 ROOT.DATA.BLOCKS.VALVE.INPUT.P_OUT HEATXN2 HXWI-FOULFCTR ROOT.DATA.CONVERGENCE.CONVERGENCE.$OLVER02. OUTPUT.VAR_VAL.1 HEATXN2 HXWI-T-301CALC ROOT.DATA.STREAMS.CNDNSATE.OUTPUT.TEMP_OUT.MIXED HEATXN2 HX-T-101 ROOT.DATA.STREAMS.COLDOIL.INPUT.TEMP.MIXED HEATXN2 HX-F-101 ROOT.DATA.STREAMS.COLDOIL.INPUT.TOTFLOW.MIXED HEATXN2 HX-P-401 ROOT.DATA.STREAMS.STEAM.INPUT.PRES.MIXED HEATXN2 HXWI-F-401CALC ROOT.DATA.STREAMS.STEAM.OUTPUT.MASSFLMX.MIXED HEATXN2 HX-T-102 ROOT.DATA.STREAMS.XS1.INPUT.TEMP.MIXED Table 2 Tag Names and Model Variable Names Contents 25 Linking Model Variables to Tags Button Sequence Title of Active Screen Open the Models | heatxn1.bkp | Variable-Tag Mapping sheet in the Data Browser. Models heatxn1.bkp – Data Browser Result To link tag HX-UCLEAN to the clean exchanger U, first locate HXUCLEAN in the All tags frame. Then click, in turn: Root, Data, Blocks, PREHEATER, Output in the Model variable tree. Tree expands. Search tree for HX-UAVC. Preheater model clean heat transfer coefficient. Click and hold the mouse button on HX-UCLEAN in the All tags frame. Drag and drop it onto HX_UAVC label in the Model variable tree. Tag links for model variable Select the Target option. Click OK. Model variable information is displayed. Ensure that the units type of the variable and the units type of the linked tag match. Otherwise, units conversion will fail. Average input value over field dims. If this had been an input to a model variable, filter time in minutes could have been entered. Models heatxn1.bkp – Data Browser HX-UCLEAN label attached to tree. Both model variable and tag name displayed in Mapping summary display at the bottom of this sheet. Repeat for all heatxn1 model variables. All heatxn1 links complete. Repeat for all heatxn2 model variables. All heatxn2 links complete. The Variable-Tag Mapping sheet before mapping is shown in Figure 13. In Figure 14 the Variable-Tag Mapping sheet is shown with all linkages established. 26 Contents Figure 13: Variable-Tag Mapping sheet before mapping is performed Figure 14: Variable-Tag Mapping sheet after mapping is performed Contents 27 Identifying the Correct Model Variable After successfully running the Aspen Plus model independent of Aspen OnLine from the Aspen Plus user interface, identify the variables for which inputs will be provided via Aspen OnLine and variables from which results will be obtained and displayed via Aspen OnLine. Locate them and their current values in the various input and results forms of the Aspen Plus user interface. Aspen OnLine establishes links based on the full Aspen Plus variable name. Aspen Plus organizes its variable names in a tree structure that is accessible through the Variable Explorer either from the Tools menu or from its toolbar icon. Aspen OnLine uses the same tree structure at configuration time to establish on-line links. To understand the variable structure of a given model, open the Variable Explorer and locate each variable that is to be connected. If you are unsure if you have located the correct variable, check the value displayed by the Variable Explorer with the value given in the input or results form of the Aspen Plus user interface to confirm your selection. An alternative method for identifying the correct variable name is to locate it on the Aspen Plus interface, copy the variable and then paste-link it into an Excel spreadsheet. The formula line will give the complete name of the variable. Define Unit Conversion Factors Plant tag units, model variable units, and display units used in Aspen OnLine project screens for a particular variable may all differ. However, source units and display units of a tag and corresponding linked model variables must share the same units type in order for unit conversion to work properly at run-time. Aspen OnLine provides a built-in unit system. Custom units types and units can be added to the system for specific projects. Custom units types and units can also be added during variable-tag mapping, or using the Units Conversion | Specifications sheet. Although Aspen OnLine's built-in units system is sufficient to cover all units needed, the following steps show how a custom units type and new units can be created. 28 Contents Define Units Conversion Factors Button Sequence Title of Active Screen Result Open the Units Conversion | Specifications sheet in the Data Browser. Units Conversion – Data Browser Available units types are listed on the left and corresponding units for a selected units type is displayed on the right. Click the New button on the left. Create Units Type Create Units Type is displayed Enter Magnetic induction and then click OK. Units Conversion – Data Browser Create Units Type is closed and the new units type is added to the Units type list and is selected. A new unit is created for this new type. Rename New units in the grid to mT. Creation of new units type and new units is complete. Figure 15 shows the newly-created units type and units. Figure 15: Units Conversion | Specifications sheet Define Model Variable Properties Sheets on the Variables | Grid View form can be used to specify model variable properties. If the Units type and Units are Dimensionless and Unitless respectively because the variable did not have units in the Aspen Plus Contents 29 context (such as mass fractions and other composition variables) and the project tag associated with it has units (such as percent for composition values), the desired units type and units can be entered on the Variables | Grid View | Specifications sheet. It is very important to make sure that model variables and their linked tags have the same units type. Otherwise, units conversion will fail during run-time. The Variables | Grid View | Specifications sheet also allows specification of variable criticality. If a variable is marked as critical and its value is outside the limits specified in the Tags | Grid View | Data Validation sheet or if the quality of the data is deemed to be bad, then the model calculations will not be allowed to proceed. Bad data replacement criteria can also be specified for non-critical variables. For instance, bad data may be replaced with either the last good value or a default value entered on the Variables | Grid View | Backup Data sheet, or a sequence of the two may be tried, that is, the last good value may be tried first, and if unsatisfactory, the default value may be used. Refer to Figure 16 for default values. Figure 16: Variables default values 30 Contents Configure Data Validation Data validation can be specified using the Tags | Grid View | Data Validation sheet. Both input and output variables can be subjected to gross error detection by providing upper and/or lower limit values. If a tag value is outside of its validity limits while the linked model variable is marked as critical, then model calculations will not be allowed to proceed. If the tag is not associated with a critical variable and the clamping option has been selected (by checking Clamp at lower limit and/or Clamp at upper limit), the value will be clamped, replaced by the limit value being exceeded. If the clamping occurred on input values, the model calculations will proceed with the clamped value. If clamping occurred on model output values, the clamped values will be displayed. If a tag has validity limits specified but does not have the clamping option active and is not associated with a critical variable, then calculations will proceed with the out-of-bounds value and only a warning will be recorded in the Event Log. For data validation to be performed with a model execution, the Data validation required checkbox should be selected for that model on the Models | model name | Specifications sheet. A clamped variable can be identified on the GUI by using the conditional display feature to specify that the background color of the display field should change if the data is clamped. This is an example of the Aspen OnLine GUI Conditional Display feature. Refer to Figure 17 for upper and lower limits on the variables. Figure 17: Data Validation sheet Contents 31 Configure Steady State Detection The plant must be close to steady-state operation in order to achieve accurate results from Aspen Plus, a steady state simulator. Steady state is determined by monitoring one or more key plant tags. The data for a plant tag selected as a steady state indicator is processed through two filters; one with a short time constant, and the other with a long time constant. The data covers a fixed period of time, usually an hour or two. The largest deviation between the two sets of filtered values is compared to a limit. If the limit is exceeded, then the plant is deemed not to be operating under steady-state conditions. To test for trending data the difference between the starting and ending values of the heavy filter variable are compared to a limit. If the difference exceeds the limit, the process is deemed to be trending. The heat exchanger example being used in this tutorial uses constant values for the IMS tags. Therefore, steady state detection has not been enforced. Nevertheless, refer to Figure 18 in completing the SS Detection sheet. Steady state detection may be turned on or off using the Steady state detection required checkbox in the Models | model name | Specifications sheet. Figure 18: Tags | Grid View | SS Detection sheet 32 Contents Configure Initialization Form The What-if application of the Heat Exchanger example is configured to permit users to supply the value of one model input variable at run time on the project screen. This variable is the oil inlet temperature. Aspen OnLine provides a means for automatically loading the current plant value as a default and then allowing this value to be modified by user input. In the Tags | Grid View | Initialization sheet shown in Figure 19, the Init tag column provides a list of all tags. Clicking the desired name will cause it to be entered in the Init tag column. Refer to Figure 19 to locate the variable requiring initialization. Figure 19: Tags | Grid View | Initialization sheet Contents 33 Configure CIMIO Connection The completed CIM-IO sheet is shown below. This information must be provided to establish communications with the plant IMS/DCS. You must specify the CIM-IO device from the list. In the case of this tutorial, the CIMIO device is IOSETCIM200. If you are performing this tutorial without connecting to an IMS or DCS, do not specify CIM-IO device and CIM-IO source information. Enter test values as shown in the Test Values column. Also, set the Test value status to Good (the default is Bad). Figure 20: Tags | Grid View | CIM-IO sheet Configure Automatic Execution of Model Calculations Information provided in the Schedule sheet will be used by Aspen OnLine to execute unattended (user interaction not required) model calculations at specified times and/or intervals during a day. Aspen OnLine can write-back the values of chosen internal application tags to IMS only after the successful completion of scheduled calculations. On-demand calculations will not cause write-back. The heat transfer efficiency value (tag HX-UEFF value) calculated by the Monitor module in Aspen OnLine has already been configured to be written back to IMS. The heat transfer efficiency value stored in the IMS once a day is sufficient for the purpose of monitoring the exchanger performance. However, to illustrate the use of the scheduling feature of Aspen OnLine, a combination of fixed interval scheduling and fixed time scheduling will be configured. The time inputs described below are only an example; any other time schedule can be configured for the unattended calculations. The completed Schedule form is shown in Figure 21. 34 Contents Configure Scheduling of Unattended Model Calculations Button Sequence Title of Active Screen Result Open the Models | heatxn1.bkp | Schedule sheet in the Data Browser. Models heatxn1.bkp – Data Browser Enable fixed-time schedule box and Enable fixed-interval schedule box are blank Select the Enable fixedinterval schedule checkbox. Enter 4 for Interval and enter 30 in the If scheduled run fails, retry after __ min(s) field. Model heatxn1.bkp will be executed every 4 minutes starting midnight every day. Model calculations will be retried 30 minutes after a calculation failure (due to data validation and/or steady state detection errors or other errors) When repeating this step for heatxn2.bkp, enter 00:02 in the Start every day at field as well. Select the Enable fixedtime schedule checkbox and enter 1 for Number of fixed-time runs. Enter 10:00 (10:02 for heatxn2.bkp) in the time input box in the Fixed time schedule frame. Number of fixed-time runs is now 1. A time input box appears in the Fixed time schedule frame. Schedule sheet The heatxn1.bkp model will be automatically executed at 10:00 AM every day. Note: any desired time input may be used. To specify a single digit hour, enter a 0 as the first digit. For example, 6:00 PM should be entered as 06:00 PM. Repeat the above steps for heatxn2.bkp with changes as noted. Figure 21:Completed Models | model name | Schedule sheet for heatxn1.bkp Contents 35 5 The Graphical User Interface Steps to Build a GUI The graphical user interface (GUI) is constructed in two main steps. The first step involves developing diagrams of the key pieces of equipment that are to be displayed, if they are not already in the Graphics Library of Aspen OnLine. The second step involves transfer of these diagrams to the GUI where the appropriate lines, labels, text display boxes, and control buttons are added. The instructions that follow apply to the Heat Exchanger Monitor module. Construction of the GUI for the What-if module is done the same way with two exceptions. These will be discussed in a separate section. Initialize the Graphical User Interface Begin by creating a blank GUI form using the following steps. Initialize the Graphical User Interface Button Sequence Title of Active Screen Result Open a Data Browser and click the User GUI folder User GUI – Data Browser User GUI | Specifications sheet appears. Click New. New Form Enter Heatx1 as the title of the new form and then click OK. Heatx1 [design] New Form dialog box is closed and a blank new user GUI form is created and displayed The first time you create a form, a blank GUI Builder form will appear as shown in Figure 22. 36 Contents Figure 22: Blank user GUI form displayed in Aspen OnLine Client window Contents 37 Using the Graphics Library Diagrams There is a library of common process equipment diagrams that can be imported into the GUI when building a process flow diagram. The library consists of diagram meta files (.wmf). The library is located in the Graphics Library folder in the Aspen OnLine installation directory. When a diagram is imported into the GUI, it may be resized as needed. However, diagrams cannot be flipped or rotated. For this reason a few diagrams are shown as left-and-right or horizontal-and-vertical pairs. A set of arrows is also included that may be used to indicate a feed or discharge flow. In addition to the meta files, there is a complete collection of PowerPoint (.ppt) equipment diagrams in the library. As needed, you may modify these diagrams, or create entirely new PowerPoint images. PowerPoint images may be copied and pasted into the GUI. In addition to PowerPoint, many other picture or graphics files can be loaded on the picture object of the Aspen OnLine GUI. Even photographs can be used. Import Diagram and Add Process Lines The diagram of the heat exchanger can be imported from the Aspen OnLine Graphics Library. To do this, in the GUI construction form, open a new image box, import the specified diagram, and paste the diagram in the image box. Relocate the box by dragging it to the desired location with the mouse pointer and then resize by using the sizing handles. Refer to Figure 23 as a guide. Process lines can only be run from one image to another. In the case of a feed or discharge line, if a feed or discharge arrow is not used, then an empty image box must be created. The line can then connect the equipment piece to the empty image box to produce a feed or discharge line. The empty image box can then be moved to the next location, or deleted. Feed or discharge arrows included in the diagram serve as the second image. 38 Contents Transfer Heat Exchanger Picture and Add Lines Button Sequence Title of Active Screen Result Open the Heatx1 [design] GUI form window. Heatx1 [design] The form is blank. Click Tools menu | Add Image and click to place the image box With the image box highlighted, click Tools | Load Picture. An image box is added to the form. Open Locate the Graphics Library folder in the Aspen OnLine installation directory. File selection dialog box appears. List of diagram files is displayed. Set File Type to Metafiles(*.wmf). Select Horizontal 2Pass Exchngr_Left.wmf and click Open. Heatx1 [design] Exchanger diagram is inserted into image box. Move and resize the image if necessary Heat exchanger diagram is properly sized and located. Repeat above to size and locate the steam flow control valve, Valve_Automatic1.wmf. Steam valve properly sized and located Click Tools | Add Image. Place it at the starting point for the Cold oil line. Empty image box added to form. Click Tools | Add Line. Click and hold the mouse button on the empty image box. Drag horizontally to the pipe bend location, then release the button. Click and drag again to the bottom oil flange on the heat exchanger. Double click to release. Green line with yellow arrows connects empty image box with bottom nozzle on heat exchanger. Click empty image box. Empty image box selected. Either drag to a new location, or click Edit | Delete. Empty image box moved or deleted. To relocate line, click and drag out a box around all elements of the pipe to select it. All elements of line are highlighted. Click on any part of selected line and drag to new location. Line relocated. Repeat the steps above for the hot oil line, the inlet steam line, and the condensate line. Valve to preheater line does not require empty image box. Refer to Figure 23 as a guide. Heat exchanger has two inlet lines, two outlet lines, and a steam flow control valve with an inlet and outlet stream. Contents 39 Add Labels to Drawing Labels are easily added to the GUI as illustrated by the following sequence of steps. To build a bulletin board with multiple labels, first create a label box. The label box is then resized to contain all of the labels to be added. Additional label boxes and tags are placed on top of the large label box. Position and size as required. Add Labels to Drawing Button Sequence Title of Active Screen Result Open Heatx1 [design] GUI form window. Heatx1 [design] Heat exchanger diagram displayed. Click Tools | Add Label. Label function selected. Move mouse pointer to location for label and click. Label box appears and is highlighted. Click right mouse button on the highlighted label box and select Properties. Click Properties from the menu. Label Properties dialog box appears. Click Text box and type desired text. Label Properties Form completed. Click OK. Heatx1 [design] Diagram now has label. Click and drag label to desired location Label properly positioned. Repeat the steps above for all labels. Refer to Figure 23 as a guide. Diagram completely labeled. Click File | Save Project. Drawing saved. 40 Contents Add Tags to Drawing Data associated with tags can easily be displayed on the GUI. However, the tags must have first been defined during the Engine configuration stage. Recall that the Monitor module has output variable tags with the prefix HX-. The What-if module uses HXWI- as the prefix. Add Plant and Local Tags to Drawing Button Sequence Title of Active Screen Result Open Heatx1 [design] GUI form window. Heatx1 [design] Heat exchanger diagram with labels displayed. Click Tools | Add Tag. Tag Browse Tag Browse window appears on diagram Click down-arrow next to Tag Name box. List of tag names appears Click desired tag name. Name transfers to Tag Name box Click Display Tag. Heatx1 [design] Text box appears at top left of diagram with units displayed to the right. Right-click text box again. Click Number Format from the menu. Number Format Number format dialog box appears. Enter format information in the form bbb#.0 where b is a space, # the number, and the zero is a placeholder for the decimal portion of the number. Click OK. Click File | Save Project. Contents This is the same format nomenclature used by Microsoft Excel. Heatx1 [design] Tag name data box with units is displayed. Drawing saved. 41 Add Control Buttons to the Drawing Control buttons must be added to the GUI. This is how the application and model execution are controlled. Control buttons can be setup to run the model, switch to another display screen, read log files, initialize data entry values, etc. Read Log File buttons should be added when setting up the GUI because they are helpful in better understanding the on-line application, the process model, and the process itself. Adding Buttons to the Drawing Button Sequence Title of Active Screen Result Open Heatx1 [design] GUI form window. Heatx1 [design] Heat exchanger diagram with labels displayed. Click Tools | Add Button. Blank text box appears at pointer. Move box to desired location and click. Button appears. Right click the new button. Click Properties from the menu. Button Properties Button Function scroll appears. Click Button Function down arrow. Select Run Model from the menu. Button caption box filled with Run Model, Number of models set at 1, and Model 1 Name box is blank. Edit the Button caption. Run Model becomes Run HX Model. Click Model 1 Name box downarrow. Model name appears. Select model name and click OK. Heatx1 [design] Button shown with label. Repeat these steps to add Read Event Log, Read Run Log, Exit with Save, and Go to What If buttons. All buttons added to diagram. Click File | Save Form. Drawing saved and GUI configuration is complete. Close the Heatx1 [design] form. 42 User GUI – Data Browser User GUI | specifications sheet is displayed. Contents The Completed Heatx1 GUI The completed Heatx1 GUI is shown in Figure 23. All of the elements seen on the diagram were created using the GUI Builder with the exception of the exchanger and the valve, which were imported from the Graphics Library. Figure 23: Completed Heat Exchanger Monitor Diagram in the GUI Builder Contents 43 Creating the What-if GUI (Heatx2) The GUI for the What-if model is identical to the Heatx1 GUI with two exceptions. First, one data entry tag must be added to the diagram for the oil inlet temperature. This box is added to the diagram in the same manner as all of the other data boxes. It represents the input variable that was defined on the Tag Definition form, HXWI-T-101-INPUT. This tag was linked to the What-if model, instead of the plant input variable tag HX-T-101, as was the case with the Monitoring model, Heatx1. The second difference involves the addition of a data initialization button. In the Initialization form the tag HXWI-T-101-INPUT is initialized by HX-T-101. However, the initialization can occur only when the Init Data button is clicked. The completed Heatx2 GUI is shown in Figure 24. Figure 24: Completed Heat Exchanger What-if Diagram in the GUI Builder 44 Contents 6 Running the Application Application Execution At this point, we have made all necessary specifications for this sample project to run. If this project needs to run in test mode (without connecting to plant IMS), you should disable the Aspen CIM-IO Interfaces connection. Open a Data Browser and go to the Setup | Specifications | CIM-IO sheet. Select the Disable CIM-IO check box. Close all Data Browsers and all user GUI forms in design mode. Then, follow the instructions below. Run Model Button Sequence Title of Active Screen Result Click View menu | Control Panel command. Control Panel Control Panel is displayed in Aspen OnLine Client GUI window. On Status sheet, in steady-state detection frame, click Load. Steady-state detection program is loaded and some command buttons are enabled. Click Start in same frame. Steady-state detection program starts. In Aspen OnLine engine frame, click Load. Aspen OnLine engine program is loaded. Click Start in same frame. Aspen OnLine engine program starts. Click Engine tab in Control Panel. Note that heatxn1.bkp and heatxn2.bkp run every 4 minutes alternately. These are scheduled runs. Click Run-Time User GUI tab in Control Panel. User GUI forms are listed in the list view. These are run-time forms. The Session option is Engine watch. Select Interactive option. Now the Session option is Interactive.. Double-click the Heatx1 form. Contents Heatx1 [run] Displays the run-time Heatx1 GUI. 45 Button Sequence Title of Active Screen Result Click Run HX Model. heatxn1.bkp is running Three messages in turn are displayed: Analyzing data … Initializing model … Model is running … heatxn1.bkp is running Message is: Model is running Click Read Event Log. EventLog.log - notepad Should be clear of messages. Click Read Run Log. RunLog1.log - notepad Should list the values of the input and output variables displayed on the GUI. Click Go to What If. Heatx2 [run] Displays the run-time Heatx2 GUI. Message disappears. Click Init Data. Current values of inlet temperature, 100 F, fills the input data boxes. Click Run Model. Should produce results identical to those obtained for Heatx1. Enter 85 for the Cold oil temperature. Click Run Model. Results should match those shown in Figure 26. Click Status tab in Control Panel and click Unload in Steady-state detection frame. Control Panel Run-time user GUI forms are closed and steadystate detection program and Aspen OnLine engine program are stopped and unloaded. Click File menu | Exit command. Desktop Congratulations! You have successfully completed your first on-line model application. 46 Contents Results of OnLine Model Calculations Figures 25 and 26 display the results for the Monitoring model and the Whatif model, respectively. Figure 25: Heat Exchanger Monitor GUI with Results Contents 47 Figure 26: Heat Exchanger What-if GUI with Results 48 Contents