1
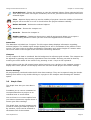
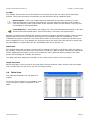
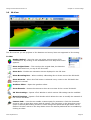
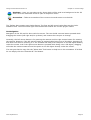
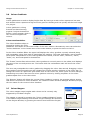
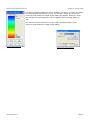
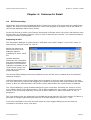
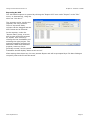
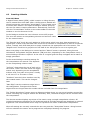
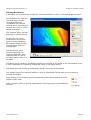
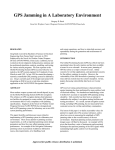
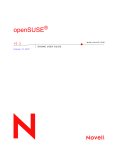
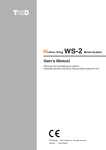
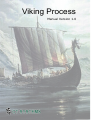
Viking Process
Manual Version 1.0
Viking Process Manual Version 1.0
COPYRIGHT
The copyright for this manual belongs to CT Systems, The Netherlands. Nothing from this manual
may be copied or published without written permission from CT Systems.
The purpose of this manual is to give the users of the Viking software information on the use of this
software.
This manual may not be considered as a document with which CT Systems could have any
responsibility, legal liability or contractual obligations.
www.ctsystems.eu
Page 2
Viking Process Manual Version 1.0
WARNING
Data processing is a critical part of a project and should only be performed by experienced
hydrographic surveyors and/or engineers. While the Viking Software is a highly useful tool, it should
never be relied upon as the only means calculation and processing. It is prudent to use more than
one proven instrument and more than one accepted method in support of critical decisions.
The Viking software is a precision instrument. When there are interferences in the radio signals, the
position on the chart may not match with the real position. With the CT Systems software you can
make corrections regarding position, if there is a point from which the coordinates are known.
Viking Software is provided "as is" without warranty of any kind, either expressed or implied.
www.ctsystems.eu
Page 3
Viking Process Manual Version 1.0
TABLE OF CONTENTS
Chapter 1: Introduction.......................................................................................................6
1.1 About Viking Process .................................................................................................6
Hardware & Software Requirements...........................................................................6
1.2 About This Manual.....................................................................................................6
Chapter 2: Software Installation............................................................................................7
2.1 Installation...............................................................................................................7
2.2 Security Hardware Key...............................................................................................7
WARNING...............................................................................................................7
2.3 Initial Start Up..........................................................................................................7
Chapter 3: General Usage....................................................................................................8
3.1 Main Screen..............................................................................................................8
Child Windows........................................................................................................8
Tool Window...........................................................................................................8
3.2 2D View....................................................................................................................9
Toolbar...................................................................................................................9
Status Bar............................................................................................................10
Viewport...............................................................................................................10
Render Settings.....................................................................................................10
3.3 Graph View.............................................................................................................10
Toolbar.................................................................................................................11
Status Bar............................................................................................................11
Graph Overview.....................................................................................................11
3.4 Table View...............................................................................................................11
3.5 3D View..................................................................................................................12
Toolbar.................................................................................................................12
3D Navigation.......................................................................................................13
3.6 Colour Gradients......................................................................................................14
Usage..................................................................................................................14
Colour Gradient Editor............................................................................................14
3.7 Colour Mapper.........................................................................................................14
Chapter 4: Features In Detail..............................................................................................16
4.1 XYZ Processing........................................................................................................16
Importing An XYZ..................................................................................................16
Exporting An XYZ...................................................................................................17
4.2 Creating A Matrix.....................................................................................................18
From XYZ Data......................................................................................................18
Defining Boundaries...............................................................................................19
4.3 Exporting A Matrix...................................................................................................20
Export Matrix Window............................................................................................20
Matrix Export Formats............................................................................................20
Chapter 5: Troubleshooting.................................................................................................21
5.1 Troubleshooting.......................................................................................................21
HASP Key Not Recognized ......................................................................................21
www.ctsystems.eu
Page 4
Viking Process Manual Version 1.0
Glossary Of Terms............................................................................................................22
User Manual Revision History.............................................................................................23
Alphabetical Index............................................................................................................24
www.ctsystems.eu
Page 5
Viking Process Manual Version 1.0
Chapter 1: Introduction
Chapter 1: Introduction
1.1 About Viking Process
Viking Process is a powerful software suite designed from the ground up for data pre- and post
processing. Viking Process is a stand alone solution for post processing of hydrographic survey data
and in effect a pre processing tool for the preparation of DTM data for the Viking Dredge software.
Hardware & Software Requirements
In order to use Viking the following requirements should at a minimum be matched:
•
•
•
•
•
•
•
A Microsoft Windows compatible PC
Microsoft Windows XP
1 Gigabyte free disk space
512 Mega bytes RAM
Pentium IV processor
Screen resolution of 1024 x 768 pixels
One free USB port
1.2 About This Manual
This manual is intended as a well documented guide for installation, set up and use of Viking
Process. Using the alphabetical index features and settings can easily be looked up.
We recommend reading this manual fully in order to get acquainted with the workings of Viking
Process.
www.ctsystems.eu
Page 6
Viking Process Manual Version 1.0
Chapter 2: Software Installation
Chapter 2: Software Installation
2.1 Installation
Viking Process is supplied on a standard CD-ROM which contains an installation program, a digital
PDF version of this manual and a number of useful and directly related utilities.
In order to install Viking Process on a PC the file 'setup.exe' located on the installation CD needs to
be executed. After reading and confirming with the user agreement Viking will be installed onto your
PC.
The setup routine will also install necessary software from the Microsoft Visual Studio package to
support the 3rd party Navionics charting routines.
The interfacing services to the HASP key will also be auto executed and installed on the PC.
2.2 Security Hardware Key
The Viking Process software package is protected by a HASP USB security key. In order to run Viking
Process a HASP key supplied by CT Systems needs to be inserted into a functioning USB port of the
computer.
The HASP key will also contain digital keys for various special functions in the Viking Process
software.
WARNING
In case of a loss of the HASP key the replacement of this
key requires a full re-purchase of the licensed software!
2.3 Initial Start Up
After having installed Viking Process onto your PC, and having inserted the HASP key into a fully
functioning USB port, Viking is ready to get started.
Viking Process can be started by clicking the newly created short cut from the Windows Start Menu
or from the new short cut icon on the Desktop.
After having started Viking Process for the first time a new sub directory called 'CT Systems' will be
created in the current users 'Application Directory'. Here Viking will store it's settings in it's own
separate directory.
www.ctsystems.eu
Page 7
Viking Process Manual Version 1.0
Chapter 3: General usage
Chapter 3: General Usage
3.1 Main Screen
C hild Windows
Tool Window
Main screen of Viking Process
Viking Process is based on the Multiple Document Interface (MDI). MDI is an application which acts
as a container for child windows.
Child Windows
All child windows inside Viking Process can be adjusted in size and positioned anywhere inside Viking
Process, with handy window snap functionality to easily line up multiple child windows.
Besides child windows Viking Process has two other types of windows: Dialogue Windows and Tool
Windows.
Tool Window
A Tool Window is a small floating window where general additional settings are displayed.
www.ctsystems.eu
Page 8
Viking Process Manual Version 1.0
Chapter 3: General usage
3.2 2D View
Toolbar
Viewport
Statusbar
Top view (or 2D view) window showing a (partially selected) raw survey track
The 2D View shows a top view representation of all projects currently loaded. With it you can view,
select, edit and modify data. The window consists of a Toolbar, Viewport and a Statusbar.
Toolbar
Hand – This enables the user to pan the viewport, simply click and drag anywhere in the
viewport with the Hand Tool button selected to pan.
Select – With select enabled the user can draw a selection. Any
selectable object inside the selection is selected. By pressing the
right mouse button when drawing a selection results in the
selection being cancelled.
By right clicking on the select Tool button the user can define the
type of selection. A rectangular selection and a freehand
selection are available.
Select button dropdown
Zoom – Allows the user to define a zoom window, simply click the left mouse button and
draw anywhere in the viewport until the desired zoom window is obtained. After releasing
the left mouse button, the viewport adjusts to the specified zoom window. Clicking the right
mouse button while a zoom window is being made will cancel the zoom window.
Ruler – With the Ruler Tool button selected the user can click and drag a line in the
viewport. In the right region of the Statusbar the length of the line is displayed.
Extends all – Adjusts the viewport to include all visible objects. Be careful, when 2 or more
visible projects are very far apart from each other, extends all will zoom out trying to fit
both projects in the same viewport. The result could be that neither project is visible since
both are drawn very small due to the extreme size of the viewport.
www.ctsystems.eu
Page 9
Viking Process Manual Version 1.0
Chapter 3: General usage
Zoom Selected – Zooms the viewport to view the selected objects. Zoom selected will only
work when more than one object is selected, else it will just centre the viewport around the
selected object.
View – Opens a Popup menu to set the visibility of projects. Here the visibility of individual
project can be turned on or off. A check before the project indicates visibility.
Delete Selected – Deletes the selected objects.
Zoom Out – Zooms the viewport out.
Zoom In – Zooms the viewport in.
Render Settings – Displays a Popup menu with all projects and allows you to open a
render setting window in which you can control the appearances of the data.
Status Bar
The Statusbar is divided into 3 regions. The left region always displays information regarding
selected objects. The middle region always displays the X and Y coordinates of the position of the
mouse. The right region is dynamic and displays information such as the height of a matrix under
the mouse cursor or the length of the ruler when measuring distances.
Viewport
In the viewport all data is visualised. On the background a reference grid is drawn. The viewport can
be adjusted by panning and zooming operations from the toolbar. Zooming can also be done by
scrolling the scroll-wheel of the mouse or by pressing + and – keys on the keyboard.
Double clicking with the left mouse button while hovering over a project in the viewport causes a
Popup menu to be opened. In the Popup menu the user can access project and render settings.
Render Settings
All projects being rendered inside the 2D View have settings. They can be opened using the Render
Settings Tool button or by double clicking on a project in the viewport and choosing the “Render”
option.
3.3 Graph View
The Graph View lets you view data in
time.
It enables you to remove unwanted or
corrupted data from a project on an
individual axis or sensor basis.
You could use it to remove spikes from
your data or determine regions where a
sensor gave false readings.
The Graph View currently supports two
modes of viewing the data. By Value or
By Variance, which can be selected in
the bottom-left of the window.
www.ctsystems.eu
Graph view of the Z axis of a XYZ ASCII file
Page 10
Viking Process Manual Version 1.0
Chapter 3: General usage
Toolbar
The Toolbar shares most of the Tool buttons from the 2D View, like the Hand, Select and Zoom
buttons. They share the same functionality and will therefore not be explained again.
Select Spikes – This runs a spike detection algorithm on the data. Resulting in every
detected spike being selected. Afterwards a user can examine each spike and exclude it
from the selection. After examination all the selected spikes can be deleted. Currently this
functionality is not implemented.
Level Selection – Interpolates new heights for every selected data point based on the first
and the last selected data point. This functionality is currently not implemented.
Besides Tool buttons the Toolbar also contains controls for project and data visibility. These controls
appear right next to the Tool buttons and consist of a ComboBox and four CheckBoxes. In the
ComboBox a project is selected. The Check Boxes define if the project is visible and whether each
axis is displayed or not. It is possible for projects to have less than three axis defined in which case
the CheckBoxes corresponding with the unavailable axis will be greyed out.
Status Bar
The Graphs Status bar contains a Combo Box for setting the Graph's view mode, either By Value or
By Variance. These modes define the unit of the vertical axis. With By Value selected the data points
will be displayed horizontally in time and vertically by value. Whereas with By Variance the data
points will be displayed vertically by variance.
The Status bar also displays the position of the mouse when it hovers over the Graph.
Graph Overview
Below the graph is an overview of the total data currently selected. When zooming into the Graph
this overview lets you see where you are currently viewing.
3.4 Table View
The Table View displays the raw data of a
project.
In the top of the window is a ComboBox. With
it you set which project is displayed in the
table.
Table view displaying raw XYZ data in a column view
www.ctsystems.eu
Page 11
Viking Process Manual Version 1.0
Chapter 3: General usage
3.5 3D View
3D View of a survey matrix
The 3D View lets you see projects in 3D. Matrices and survey lines are supported in 3D viewing.
Toolbar
Render Method – Here the user can select various types of 3D
visualisations. By clicking on the downward arrow a drop down menu
appears.
Show Original Data – This overlays the original data, the data the
model was build from, on top of the 3D model.
Show Axis – Enables an orientation device displayed in the 3D View.
Show Bounding Box – When enabled, a Bounding Box is drawn around the 3D Model.
Show Normals – When this Tool button is selected every vertex in the 3D Model also
displays it's normal.
Gradient Editor – Opens the gradient editor.
Zoom Extends – Resets the camera to show an overview of the current 3D Model.
3D View Settings – Opens a Tool Window in which various 3D settings can be modified.
Material Settings – Opens a Tool Window which allows the user to modify the material of
the current 3D Model.
Camera Path – Lets the user enable a camera path for animation. Click the downward
arrow to open a drop down menu with all options. The first entry in the drop down menu
opens a camera path setting window in which things like speed and target offset can be
defined. All other entries in the drop down menu are camera paths and can be enabled by
clicking on them.
www.ctsystems.eu
Page 12
Viking Process Manual Version 1.0
Chapter 3: General usage
Skydome – Here you can select a sky dome which will be used as a background in the 3D
View. Click the downward arrow to open a drop down menu.
Screenshot – Takes a screenshot of the current view and stores it to the disk.
The Toolbar also contains two Combo Boxes. The first and left-most Combo Box sets the Color
Gradient used. The second and right-most Combo Box selects the current project visible.
3D Navigation
Navigation in the 3D world is done with the mouse. The user holds a mouse button pressed while
dragging the mouse (left-right and/or up-down) and causes the view port to change.
Generally, the left mouse button is for panning the camera and the right mouse button for rotating
the camera. However, if the left mouse button is pressed while being over a 3D object, dragging up
and down will result in zooming in or out towards and away from the point on the 3D object directly
under the mouse. And if the right mouse button is pressed while being over a 3D object, dragging
will make the camera rotate around the point on the 3D object directly under the mouse.
If a user gets lost he may click the “Show Axis” Tool button to help him in his orientation. If all fails
he can simply click the “Extends All” Tool button.
www.ctsystems.eu
Page 13
Viking Process Manual Version 1.0
Chapter 3: General usage
3.6 Colour Gradients
Usage
Colour gradients are used to display height data. By having a certain colour represent a low area
and another colour represent a high area one gets nice shading and can quickly tell the local height
of a project.
Colour gradients in Viking
Process are shared among
projects. Projects themselves
define a colour mapper which in
turn connects heights with
colours.
Colour Gradient Editor
Colour gradient editor window
The Colour Gradient editor is
opened by clicking the “Edit
Gradients” Tool button on the main toolbar of the main window. Alternatively users can select the
“Colour Gradients” in the Create menu of the main window, or press the short cut Ctrl-G.
In the Colour Gradient Editor the upper half displays the colour gradient currently selected along
with intractable colour dots used to manipulate the gradient. The lower half shows a set of buttons
which allow manipulations on the colour gradient as a whole, such as “New”, “Remove”, “Save”,
“Undo”, etc, and most speak for themselves.
The “Preset” Combo Box selects which colour gradient is currently active in the editor, and displays
the name of the currently active one. The button with the exclamation mark will invert the colour
gradient.
The user may manipulate the colour gradient by dragging the colour dots around. Dragging a colour
dot outside of the horizontal zone and releasing the mouse results in deletion of the colour dot. To
change the colour at a particular spot double click on the colour dot, which opens a Colour Dialogue.
Introducing new colour dots into the colour gradient is done by clicking anywhere in the colour
gradient apart from on the colour dots.
The 'Remove' button will delete the current Colour Gradient, however, the program always asserts
that there is at least one Colour Gradient. The 'Rename' button shows a Dialogue Window querying
the new name for the current Colour Gradient.
3.7 Colour Mapper
The colour mapper maps heights with colours and is currently only
supported by the Matrix Project.
The mapper is opened by pressing the “Colour Gradient Mapping” button
in the Matrix Project Settings Tool window. Project Settings are accessed
via the Project Window, by pressing the second icon behind the Project.
Project
Settings
Access to the project
settings
www.ctsystems.eu
Page 14
Viking Process Manual Version 1.0
Chapter 3: General usage
The Colour Mapper draws the Colour Gradient currently in use by the Matrix
and displays two Edit Boxes, a 'Low' and a 'High'. These are set to the
minimum and maximum height of the Matrix by default. However, users
can change this and the Matrix will be updated after pressing 'Apply' or
'Ok'.
The 'Reset' buttons sets the 'Low' and 'High' Edit Boxes back to the
minimum and maximum height of the Matrix.
Colour gradient mapper
www.ctsystems.eu
Access to the colour mapper
Page 15
Viking Process Manual Version 1.0
Chapter 4: Features in detail
Chapter 4: Features In Detail
4.1 XYZ Processing
Importing a XYZ is done from RAW ASCII files. These files contain XYZ values and are possibly timetagged. The format of these RAW ASCII files varies from program to program, but all are based on
the Comma Separated Value (CSV) format.
In the CSV format an entire row of data is ended with a carriage return (an enter) and between each
column there is a delimiter character, which in CSV is obviously the 'comma'. The values themselves
might be enclosed by quotations.
Importing An XYZ
The XYZ Import Dialogue is opened by the “XYZ Data” item under “Import” in the “File” menu, or
alternatively, using the short-cut “Ctrl-X”.
Before the Dialogue is
opened however a File
Dialogue appears,
prompting to select a XYZ
file.
Possible delimiter
characters are recognized
and those available will be
displayed in the Delimiter
Character ComboBox in the
“XYZ Format” group. The
users job is to select the
proper delimiter.
XYZ Import window
The Preview Table displays a few lines loaded from the XYZ file and is updated when the delimiter
character changes.
Columns themselves in the Preview Table can be dragged in case the order of columns is not right.
The user does this by clicking-and-dragging the column to the proper place and releasing the mouse
button. A blue line indicates where the column will be placed when the mouse button is released.
The “Import Settings” group contains settings for input conversion. Generally the values in a XYZ
are in Meters which is the default setting. The Z offset enables the user to add a constant to the Z
values in the XYZ during importing. The invert Z option flips the Z, where 4 becomes -4 and -4
becomes 4.
Two Time stamp types are supported, the HH:MM:SS format and the Unix Time format. The latter is
generally an integer representing the amount of seconds lapsed since January 1, 1970.
If no time is available in the XYZ, the XYZ values are time-tagged starting from zero and are
increased 1 second for every new value.
www.ctsystems.eu
Page 16
Viking Process Manual Version 1.0
Chapter 4: Features in detail
Exporting An XYZ
The XYZ ASCII exporter is opened by clicking the “Export XYZ” item under “Export” in the “File”
menu, or alternatively, using the
short-cut “Ctrl-Alt-X”.
The exporter works just like the
importer, but only inverted.
There is a preview Table,
columns can be dragged and the
XYZ format can be selected.
In the exporter, under the
“Source Data” group, a source
XYZ project should be selected
for export. This is done by
clicking the first ComboBox and
selecting the right project. The
exporter supports exporting XY
data and Z data from different
XYZ ASCII Export options
projects, however, this is
generally unused, so the second
ComboBox should display “Same as XY source”.
After settings have been set, the user presses Export and will be prompted by a File Save Dialogue
to specify where the file will be saved.
www.ctsystems.eu
Page 17
Viking Process Manual Version 1.0
Chapter 4: Features in detail
4.2 Creating A Matrix
From XYZ Data
A Digital Terrain Model (DTM), called a matrix in Viking Process,
can be created from XYZ data. After a XYZ project is loaded into
Viking Process the user selects “Work Matrix” in the Create menu
from the main window. This opens a Dialogue window querying
the user for matrix creation parameters. Alternatively users can
click the “Create Matrix” button on the main toolbar of the main
window or use the shortcut Ctrl-M.
In the Dialogue window the user selects a source XYZ project.
The user also selects an interpolating scheme and enters a name
for the created matrix.
Matrix interpolation method selection
The “Regular Grid” check box only applies to XYZ projects which have their data positioned in a
regular grid. If that is the case and if the check box is selected no interpolation is used to create the
matrix, instead, each XYZ data point is simply copied into the appropriate cell of the matrix. The
“Regular Grid” check box is greyed out if the data of the XYZ project is not on a regular grid.
When everything in the Dialogue is entered and the “Select” button is pressed, Viking Process
calculates a Triangulated Irregular Network (TIN) and then, depending on the interpolation used, a
second dialogue window is opened. In the case of a regular grid this step is skipped and a matrix is
simply generated.
In the second dialogue window settings for
the interpolation are entered. This depends
on the interpolating scheme used.
“Cell size” determines the size of each cell in
the matrix. Lower cell sizes result in a bigger
matrix and, depending on the interpolation
scheme used, may take a long time. Usually
a cell size of 1 to 30 meter is used.
“Gradient” sets the Colour Gradient used by
the created matrix. This can be changed
later.
Matrix creation options
“Max Edge” sets the maximum edge limit in
the triangulation. Triangles which haves
edges which are longer than this number will be excluded from the interpolation.
The “Define Boundaries” button opens a dialogue window where you can set a boundary around the
matrix excluding any triangles outside the boundary. Also, individual triangles can be excluded from
the interpolation.
The Preview window displays a preview of the matrix using a simple interpolation scheme. All
included triangles are displayed in full brightness and all excluded triangles are displayed in reduced
brightness. The results shown herein may not represent the matrix created after interpolation.
When all settings are correctly entered the user can press the “Interpolate” button. Viking Process
will now calculate the matrix and a progress bar is displayed showing it's progress.
www.ctsystems.eu
Page 18
Viking Process Manual Version 1.0
Chapter 4: Features in detail
Defining Boundaries
A boundary can be defined by clicking the “Define Boundaries” button in the interpolation window.
In this window the user can
click and drag lines and
rectangles which will
(in)validate the triangles
beneath them, depending on
whether the “Cut” or “Glue”
option is selected.
The viewport works just like
any other in Viking Process.
In the right side of the
window there are several
options grouped together:
Boundaries, Edges, Border,
Triangle Select Tool and
Original Data.
The Boundaries group
handles importing and
exporting boundary data,
importing DXF for use as
boundary and an auto-find
boundary.
Boundary selection for the matrix creation routine
The Edges group contains a ComboBox toggling the visibility of the edges of the triangulation. Also,
a Color-ComboBox is included to change the colour of the edges drawn.
The Border group is merely for displaying a border around the triangulation.
The Triangle Select Tool specifies whether a Line or a Rectangle will be used in the cutting and
glueing of triangles.
Right clicking in the viewport opens a Popup Menu with similar options as in the
toolbar. Useful when
After a manual cutting or glueing operation the panning operator is automatically
selected.
www.ctsystems.eu
Page 19
Viking Process Manual Version 1.0
Chapter 4: Features in detail
4.3 Exporting A Matrix
Export Matrix Window
The Export Matrix window is
opened by selecting the “Export
Matrix” item under “Export” in the
“File” menu, or alternatively, by
using the short-cut “Ctrl-Alt-X”.
Matrix Export Formats
Currently two export formats are in
use: solids to an AutoCAD DXF, and
a Viking Matrix File directly usable
by Viking Navigation.
Exporting a matrix
The export format is selected by the ComboBox next to “Export Format”.
www.ctsystems.eu
Page 20
Viking Process Manual Version 1.0
Chapter 5: Troubleshooting
Chapter 5: Troubleshooting
5.1 Troubleshooting
HASP Key Not Recognized
Please check the following:
−
−
−
Check if the USB port is functioning
If used, check USB Cables and USB Hub
Execute 'HASP Reinstall' program located in Viking's sub directory in the Windows Start Menu
www.ctsystems.eu
Page 21
Viking User Manual Version 1.0
Glossary Of Terms
DXF - Drawing eXchange Format, is a CAD file format developed by Autodesk. It is
used for interchanging vectorized drawings between software products.
USB - Universal Serial Bus, a hardware standard used all over the IT industry. Used
for connecting all sorts of peripherals. A five volt power is also incorporated
into the USB interface.
VCT - Viking Chart file format. Used by Viking to store it's vectorized chart in
binary form.
VMX - Viking Matrix file format. Used by Viking to store 3D DTM matrix data.
VTK - Viking Track file format. Used to store the tracked locations of the vessel in a
binary file format.
www.ctsystems.eu
Page 22
Viking Process Manual Version 1.0
Chapter 5: Troubleshooting
User Manual Revision History
Version 1.0 – 10 March 2010 Initial release
www.ctsystems.eu
Page 23
Viking User Manual Version 1.0
Alphabetical Index
2
2D View..................................................9
3
3D Navigation........................................13
3D View.................................................12
3D View Settings....................................12
A
About......................................................6
ASCII Files.............................................16
B
Boundaries.......................................18, 19
C
Camera Path..........................................12
Cell Size................................................18
Child Windows..........................................8
Colour Gradients.....................................14
Colour Mapper........................................14
Copyright................................................2
CSV......................................................16
D
Digital Terrain Model................................18
DTM......................................................18
DXF.......................................................20
E
Export...................................................20
Exporting...............................................17
Exporting A Matrix..................................20
M
Main Screen.............................................8
Matrix Project.........................................14
Max Edge...............................................18
MDI........................................................8
N
Navionics.................................................7
R
Rectangle...............................................19
Remove.................................................10
Render Method.......................................12
Render Settings......................................10
Requirements...........................................6
Revision.................................................23
Ruler.......................................................9
S
Screen Resolution.....................................6
Screenshot.............................................13
Select.....................................................9
Skydome...............................................13
Spikes..............................................10, 11
T
Table.....................................................11
Time Stamp...........................................16
TIN.......................................................18
Tool Window............................................8
Triangle.................................................19
Troubleshooting......................................21
F
U
G
V
Formats.................................................20
Gradient................................................18
Gradient Editor.......................................14
Graph View............................................10
H
HASP Key...........................................7, 21
I
Installation..............................................7
Interpolate.............................................18
L
Length....................................................9
USB........................................................6
VCT.......................................................22
Viewport................................................10
Viking Process..........................................6
VMX......................................................22
VTK.......................................................22
W
WARNING............................................3, 7
Windows..................................................8
X
XYZ Processing.......................................16
Z
Zoom......................................................9
www.ctsystems.eu
Page 24