1
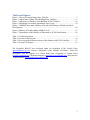
The Republic of Seychelles
A User Manual to the BOOST Expenditure Database
World Bank and Government of Seychelles
January 2013
1
Contents
Tables and Figures .................................................................................................................. 3
1. Introduction ........................................................................................................................ 4
2. Structure of the Seychelles BOOST ................................................................................... 6
2.1 Particularities of the Seychelles BOOST ..................................................................... 9
3. How the database was built .............................................................................................. 10
3.1. Problems found in the raw data from a programming perspective ........................... 10
3.2. How the database was structured for coding purposes .............................................. 11
3.3. Codifying the ECON variables .................................................................................. 16
3.4. A word about the variables PROJECT1, and SOURCE_FIN1 & 2 .......................... 21
4. How to use the Seychelles BOOST database. Some examples ........................................ 23
4.1. Example 1. Trend Analysis by Ministry................................................................... 24
4.2. Example 2. Looking at a specific sector of activity .................................................. 25
4.3. Example 3. Identifying the Investment Budget ......................................................... 28
4.4. Example 4. IMF versus National ............................................................................... 29
2
Tables and Figures
Figure 1. Mayor of Victoria budget lines, 2004-09 ................................................................ 7
Figure 2. Appeareance of Data After Building Basic Variables .......................................... 13
Figure 3. Appearance of Database After Building ECON Variables ................................... 18
Figure 4. Examining Government Expenditure across years ............................................... 24
Figure 5. ADMIN2 units under 'Ministry of Health' and 'Ministry of Health and Social
Development' ........................................................................................................................ 26
Figure 6. Ministry of Health, adding ADMIN3 level ........................................................... 27
Figure 7. Expenditures of the Ministry of Education by ECON classification .................... 28
Table 1. Variable description ................................................................................................. 7
Table 2. Sections of the raw data .......................................................................................... 14
Table 3. How to map the different sections of the database with ECON variables ............. 17
Table 4. Section II. Examples............................................................................................... 19
The Seychelles BOOST was developed under the leadership of Mr. Patrick Payet
([email protected]), Deputy Comptroller at the Ministry of Finance, Trade and
Investment, with the support of a World Bank team comprising of Sawkut Rojid
([email protected]), Massimo Mastruzzi ([email protected]), and Francisco
Vazquez-Ahued ([email protected]).
3
1. Introduction
The importance of timely and concise budget analysis to ensure an effective and efficient
use of the budget has become increasingly clear over the years. Good public expenditure
management (PEM) not only requires solid budget formulation and execution processes, it
is equally crucial that budgets are monitored and spending is analyzed. Regular feedback
allows decision makers to make sure that the budget delivers goods and services in an
efficient and cost-effective manner.
Countries are under pressure to improve efficiency in the composition of public sector
absorption as the demand for public spending efficiency is increasing from stakeholders,
moreso during the crisis periods. The World Bank has developed a simple new knowledge
product to meet this demand. The underlying data tool is called “BOOST”.
BOOST is a client-friendly, easy access Microsoft Excel-based public expenditure data
analysis tool. BOOST covers all funds in the Budget, whether from tax revenues, internally
generated funds or donor financed. BOOST collects and stores multi-year data from all
budgetary finance sources in a single standard format. It takes data directly from the
Government’s Treasury accounting system, using a full set of Treasury accounting codes
for each expenditure item expressed in the client’s Chart of Accounts. Sub-components of
the code are then used to classify planned budget, revised budget and expenditure data for
each item of spending by:
• level of Government (central or local Government),
• administrative unit (a budget management center, typically a Ministry, Department,
Agency, university, hospital, a school in some cases),
• economic classification (using GFS-related or country-specific codes),
• functional classification (sector and sub-sector COFOG-related or country-specific
codes),
• program classification,
• by financing source (budget revenues, domestic or foreign borrowing, etc.),
• by performance code (objective, target, output or program, MTEF code, etc).
The BOOST for Seychelles has been created as part of the Public Expenditure Review
(PER) exercise in 2012/13. The Seychelles’ BOOST is part of the global BOOST
initiative. The initiative started in 2010 and as of September 2012, BOOST data bases had
been created for more than twenty countries The Seychelles BOOST is the first one to
include revenue and financing (i.e., bonds emissions and sale of assets to be included
below the line) data.
The development of the Seychelles BOOST started in March 2012 with a preliminary
exploration of the data and was followed by various draft versions which were
reconciliated with the data available in publicly available documents, including the fiscal
table presented in the IMF’s last EEF report. Multiple workshops have been held across
Government to validate the data and to obtain feedback on the user friendliness of the
Seychelles BOOST. The Government of the Seychelles intends to update the database
4
regularly in coordination with the World Bank, as new data becomes available. The
Government of Seychelles also intends to provide the BOOST in the public domain for
transparency purpose as well as to initiate and facilitae research using the data. The
BOOST will be helpful in opening new avenues of analysis and providing answers to
important questions regarding the efficiency, equity, and effectiveness of spending.
To ensure sustainability of the project, the World Bank has provided training to
government officers from the Ministry of Finance, Ministry of Education, Ministry of
Health and the statistical Office. This user manual is a tool which will facilitate updates in
the future as new data becomes available, assist in undertaking data queries, and will help
in building capacity to a wider audience by the staffs who have been trained.
The manual is organized as follows:
•
•
•
Part II outlines the structure of the Seychelles budget.
Part III outlines how the database was built using Excel.
Part IV explains how to use the Seychelles BOOST with an Excel pivot table.
.
5
2. Structure of the Seychelles BOOST
The Seychelles BOOST includes expenditures and revenue executed by different agencies
of the central government. The data is disaggregated in four levels of administrative
classification, seven levels of economic classification, source of funding (only for projects
for the development budget), and project (only for centralized payments, projects of the
development budget, and debt items). The database includes two types of economic
classification. The first one, which ends with the suffix “_IMF”, allows users to replicate
the expenditure side of the IMF fiscal tables. The second one, which ends with the suffix
“_NATIONAL”, allows users to reproduce fiscal tables according to the national fiscal
accounting. There are basically two sources of differences between the IMF and the fiscal
tables:
• The recapitalizations of state-owned and private companies, which are accounted
for as transfers in the national system and as equity investments by the IMF.
•
The expenditures of the autonomous government authorities. Prior to the
restructuring of 2008, the treasury systems only recorded transfers to the
autonomous government authorities. Prior to 2008, users can only see, for instance,
the transfer of the central government to, for instance, the Office of the Mayor of
Victoria, or the National Bureau of Statistics. As a result of the restructuring,
autonomous government authorities are now compelled to register their
expenditures in the treasury system, just like any other government agency. Starting
in 2009, users can see the detailed expenditure breakdown of the Office of the
Mayor of Victoria, or the National Bureau of Statistics. In order to keep continuity
in the time series, the IMF continues to classify these expenditures as “transfers to
autonomous government authorities.” To facilitate comparisons with IMF fiscal
documents, the ECON variables ending with the suffix “_IMF” allow identifying
the expenditures of the autonomous government authorities as transfers. In order to
reflect the better recording of fiscal expenditures, the variables with the suffix
“_NATIONAL” enable the user to see the detail of the autonomous government
authorities.
The second point deserves a detailed explanation. In the past, the Seychelles Government
just registered the transfer as one single line and didn’t keep track of the expenditures. After
a series of administrative reforms, however, autonomous government authorities are now
compulsed to register their expenditures in the treasury systems. Figure 1 shows that,
between 2004 and 2008, there is one budget line for “Mayor of Victoria” but, from 2009
onwards, the average number of lines for this ADMIN unit rises to 30. In order to keep
continuity across years, the IMF keeps reporting these expenditures as transfers, even if it is
possible to see the detailed spending of the autonomous government authorities for recent
years.
The _IMF variables aim to preserve that continuity. The _NATIONAL variables present
the traditional breakdown by ECON classification (21 Compensation of employees; 22 Use
6
of Goods and Services, etc). For the years prior to 2009, the _NATIONAL variables
register those expenditures as 22 Use of Goods and Services.
Figure 1. Mayor of Victoria budget lines, 2004-09
For comparison purposes, Table 1 classifies the variables of BOOST-Seychelles and their
description.
Table 1. Variable description
Global BOOST
Variable
Description
Budgetary Divisions
Year
Above or below the
line
budtype
econ0_imf
econ1_imf
econ2_imf
Year
Variable used to identify budget lines that need to be included
above or below the line
Recurrent or Development budget
Revenue, Expenditure, or Changes in Net Worth, according to
IMF fiscal table
First level of economic classification, according to IMF fiscal
table
Second level of economic classification, according to IMF fiscal
7
econ3_imf
econ4_imf
econ5_imf
econ6_imf
econ0_national
econ1_ national
econ2_ national
econ3_ national
econ4_ national
econ5_ national
econ6_ national
source_fin1
source_fin2
project1
table
Third level of economic classification, according to IMF fiscal
table
Fourth level of economic classification, according to IMF fiscal
table
Fifth level of economic classification, according to IMF fiscal
table
Sixth level of economic classification, according to IMF fiscal
table
Revenue, Expenditure, or Changes in Net Worth, according to
National fiscal table
First level of economic classification, according to National
fiscal table
Second level of economic classification, according to National
fiscal table
Third level of economic classification, according to National
fiscal table
Fourth level of economic classification, according to National
fiscal table
Fifth level of economic classification, according to National
fiscal table
Sixth level of economic classification, according to National
fiscal table
Source of Funding: first level
Source of Funding: second level
Identifies:
-Projects in the development budget
-Beneficiaries of bail-outs in the “bail out budget” (chapters 54
to 60 of the budget)
-Beneficiaries of debt payments
-Takes value NA otherwise
Administrative Divisions
admin1
admin2
admin3
admin4
First level of the Administrative classification
Second level of the Administrative classification
Third level of the Administrative classification
Fourth level of the Administrative classification
Expenditure amounts
Debit budgeted
Credit budgeted
Debit executed
Credit executed
Debit budgeted amounts (available only from 2009 onwards)
Credit budgeted amounts (available only from 2009 onwards)
Debit executed amounts
Credit executed amounts
8
2.1 Particularities of the Seychelles BOOST
Compared with other BOOST datasets, the Seychelles BOOST presents a number of
particularities:
• Inclusion of revenues and financing data.
• The possibility to replicate the expenditure side of the IMF fiscal tables.
• The database uses the GFSM 2001 classification.
• The inclusion of expenditures that are not recorded in the treasury systems, such as
the equity investments of SEYPEC.
• The main limitations of BOOST-Seychelles are:
o The programmed expenditure and revenue amounts are included from 2009
onwards.
o The in-kind contributions to the Development Budget are included from
2009 onwards.
o The database contains no functional classification because it is not used by
the Seychelles’ authorities for the moment. It should be mentioned,
however, that the Seychelles authorities have plans to introduce the COFOG
classification progressively since 2013, when the Development Budget will
be classified according to this method.
o The constant changes in the administrative chart of accounts make timeseries analysis complicated and not as straightforward as in other BOOST
databases. There are plans to set a new chart of accounts, with clear ADMIN
classifications that last for a long period of time, in 2013.
o Given the loss of institutional memory within the Government of Seychelles,
it was not possible to identify some donors to the development budget for
the period between 2004 and 2006.
o Given the loss of institutional memory within the Government of Seychelles,
only 2011 was fully reconciled with the IMF fiscal table.
In future versions of the Seychelles BOOST (some of) these particularities may be
addressed:
• Backwards compatibility of the ADMIN classification. When the new ADMIN
chart of accounts becomes available, it will be necessary to map the old ADMIN
codes with the new ones. This exercise will have many limitations, as some
ADMIN units have disappeared over the last years, or have been merged with other
ones.
9
3. How the database was built
The Seychelles database was built manually at great cost. Contrary to other databases,
which were built using STATA do files or Excel macros, the Seychelles database had to be
done by looking at the data on a line-by-line basis.
This section is divided in four parts. The first part describes the main obstacles found by the
team from a programming and coding perspective. The second part, describes how the
database was structured to facilitate coding in Excel. The third part will describe how the
coding of the ECON classification was done. Last, the fourth part will be devoted to
variables PROJECT1, and SOURCE_FIN1 and 2.
3.1. Problems found in the raw data from a programming perspective
Constant changes in the ADMIN chart of accounts.
Example: between 2004 and 2011, the Ministry in charge of Environment has changed its
name and administrative functions three times. Between 2004 and 2006 it was called
“Ministry of Environment and Natural Resources”; between 2007 and 2010, its name
changed to “Ministry of Environment, Natural Resources and Transport”, and in 2011, it
became the “Ministry of Home Affairs, Environment, and Transport,” when it absorbed the
Department of Internal Affairs, up until that moment an independent unit. The changes of
names are the easy part to deal with. The problem, from a programming perspective, was
that the changes obviously brought with them changes in the administrative structure of the
Ministry. Between 2004 and 2006, the Division of Nature and Conservation was at the
ADMIN2 level; in 2007, it became an ADMIN3 under the Environment division, and
became a deconcentrated organ in 2011. Code recycling was equally a problem. In 2004,
for instance, code 02-40 represented the FTC division in the Ministry of Environment and
Natural Resources. In 2009 and 2010, 02-40 represented the Department of Agriculture and
Fisheries within the Natural Resources Division of the Ministry of Environment, Natural
Resources and Transport.
Code recycling in the debt and centralized payments budgets.
Code recycling was particularly prevalent in the debt payments budget, particularly after
the defaults. In 2004, code 23-10-8941 represented interest payments to a bond expiring
that year. Between 2005, after the first restructuring, and 2007, that same code represented
interest payments to a diferent bond.
Centralized payments showed a different problem. Between 2004 and 2008, codes 21-XXXXXX represented the budget of the constitutional appointees (Ombudsman, National
Assembly, and others). From 2009 onwards, codes 21-XX-XXXX started representing
centralized payments.
The fact that the imputation codes in the revenue side changed from year to year,
which prevented the use of automatic codes.
10
Example: In the raw data, revenues derived from selling video cassette stickers are
represented by 5 different codes:
Year
2004
2005
2005
2006
2009
2010
Account
ID
86-18-5001
86-09-2001
86-18-5001
86-09-2001
86-14-7303
86-14-7303
Account Description
MEP:VIDEO CASETTE STICKERS
MOHSS.VIDEO CASSETTE STICKERS
MEP:VIDEO CASETTE STICKERS
AF:DITTC:VIDEO CASSETTE STICKERS
MND:VIDEO CASSETTE STICKERS
FC.MND.VIDEO CASSETTE STICKERS
These issues pushed the team to proceed to reconcile and codify the data manually. The
Seychellois government has made tremendous efforts to have a more stable nomenclature,
and it is likely that the introduction of the new chart of accounts makes the process to
update the BOOST database more straightforward in the future.
3.2. How the database was structured for coding purposes
The steps performed to build the database are: 1
1. Create a new Excel file with the following variables:
• YEAR
• Account ID
• Account Description
• Debit Executed
• Credit Executed
• Debit Budgeted
• Credit Budgeted
• ADMIN1
• ADMIN2
• ADMIN3
• ADMIN4
• Ministry
• Division
• Four Digits
• BUDTYPE
• Above and below the line
• ECON0_IMF
• ECON1_IMF
1
This part of the manual describes only the process to create the database for 2011. Given the problems
described above, particularly the ones pertaining to code recycling, the process could not be automatized for
the previous years. It should be mentionted, however, that the procedures followed by the team were very
similar for the years 2004-10.
11
•
•
•
•
•
•
•
•
•
•
•
•
•
•
•
ECON2_IMF
ECON3_IMF
ECON4_IMF
ECON5_IMF
ECON6_IMF
ECON0_NATIONAL
ECON1_NATIONAL
ECON2_NATIONAL
ECON3_NATIONAL
ECON4_NATIONAL
ECON5_NATIONAL
ECON6_NATIONAL
PROJECT1
SOURCE_FIN1
SOURCE_FIN2
2. Copy, from the original file provided by the authorities, the values included in columns
YEAR, Account ID, Account Description, Debit Executed, Credit Executed, Debit
Budgeted, Credit Budgeted, and ADMIN1 through 4. Given the problems with the chart
of accounts described above, variables ADMIN1 through 4 are ad hoc variables created
by the authorities at the explicit request of the BOOST Team.
3. The variables that will guide your work will be “Ministry”, “Division”, and “Four
digits”. 2 The first thing to do is to break down the ACCOUNT ID variable into these
three elements, so that we can manage the database. To do that, we need to do that:
3.1. In cell L2, in variable “Ministry”. type the following formula =LEFT(B2, 2). Then
drag until the end of the column.
3.2. In cell M1, create a variable named “Division”. In cell M2 type the following
formula =LEFT(B2,5). Then drag until the end of the column.
3.3. In cell N1, create a variable named “4 digits”. In cell N2 type the following
formula =RIGHT(B2,4).
You have now three variables that will allow you to manipulate the database and know
where you are in the database. Assuming you didn’t make any modifications to the file,
it should look like this:
2
As it will be explained below, the names “Ministry” and “Division” do not necessarily stand for ministries
or admin divisions, but using these denominations are useful to guide our work.
12
Figure 2. Appeareance of Data After Building Basic Variables
4. For purposes of coding, the Seychellois database is composed, grosso modo, of ten
parts:
I.
The expenditures of line ministries and constitutional appointees. In variable
Ministry, these are contained in the cells with values ranging from 01 to 20.
II.
Centralized payments of high-level officials salaries and goods and services,
included in the cells whose variable division takes the values of 21-00 or 2101
III.
Social programs and transfers to the autonomous authorities and parastatals.
These are contained in the remaining rows where “Ministry” is equal to 21,
and all of the lines with code equal to 22.
IV.
Debt payments, contained in the cells with values 23 and 24.
V.
Grants, contained in the cells with value 25
VI.
The execution of development projects, contained in the cells with values 26
– 50.
VII.
The bail-outs of state-owned and private companies, included in cells with
values 54 and 55.
VIII.
The financing part, contained in the cells with values 61 – 80.
IX.
The revenue part, contained in the cells with values 81 – 92.
X.
The end of year balances and the receipts from privatizations, contained in
the cells with values 93 – 99.
13
We will break up the database later on in these ten parts, and the vlookups to be used will
depend a lot on what part of the database you are looking at. Table 2 summarizes the 10
sections of the database, and provides an indication on the classification by budget type and
the line items that need to be included above or below the line.
Table 2. Sections of the raw data
Number
I
II
III
Name of section
Expenditures of line
ministries and
constitutional
appointees
Centralized payments
How to identify it
Ministry equals to 01-20
Budtype
Recurrent
Budget
Above or below the line
Above the line
Division equals to 21-00
and 21-01
*Division equals to 2102 and above,
*Ministry equals to 22
Recurrent
Budget
Recurrent
Budget
Above the line
Ministry equals to 23 -24
Recurrent
Budget
*Both:
-Interest payments (division
equals to 23-10 and 24-10)
go above the line
-Principal payments
(division equals to 23-20 and
24-20) go below the line
-Administrative costs of debt
restructuring (Account ID
equals 24-20-000) goes
above the line
*Both:
-Development Fund
(Account ID equals 25-00000) goes “stock”
-Everything else, goes above
the line
Above the line
IV
Social Programs and
transfers to
autonomous
authorities and
parastatals
Debt payments
V
Grants received
Ministry equals to 25
Developm
ent Grants
VI
Execution of grants
received
Bail-outs
Ministry equals to 26-50
Financing, imprest,
and suspense
accounts
Revenue
Ministry equals to 61-80
Developm
ent Grants
Recurrent
Budget
Recurrent
Budget
Privatization receipts
and cash balances at
the end of the year
Ministry equals to 93-99
VII
VIII
IX
X
Ministry equals to 54-60
Ministry equals to 81-92
Recurrent
Budget
Recurrent
Budget
Above the line
Above the line
Below the line
Above the line
Either Stock or Below the
line (privatization receipts
are included above the line
for some years, but given
loss of institutional memory,
we couldn’t retrieve that
information)
14
5. Break down the database in the ten sections described above. To do that, insert five
lines between each section, and copy and paste the headers of row 1 at the beginning of
every section.
6. The first thing to do is to determine what part of the budget is financed through grants,
and what part is financed through the recurrent budget. With the exception of sections 5
(Grants, for which Ministry is equal to 25) and 6 (Execution of development budgets,
for which Ministry is equal to 26 – 50), everything else is financed by the recurrent
budget. Under variable “BUDTYPE”, write “Recurrent Budget” for all the sections of
the database, with the exception of sections 5 and 5, for which you will write “Grants.”
7. We now need to identify what goes above and below the line. This is an extremely
important part in the process of creating the database and needs to be done carefully.
This is how you need to fill the column:
7.1. In sections 1 to 3 ( “line ministries spending”, “centralized payments of salaries
and goods and services”, and “transfers to autonomous and parastatals”), just type
“Above the line”.
7.2. In section “Debt payments, apply the following VLOOKUP:
=VLOOKUP(M5503,Sheet2!$E$2:$F$5,2,FALSE) You are basically sending
principal payments (codes 23-20 and 24-20 )below the line, and interest payments
(codes 23-10 and 24-10) above the line) 3.
7.3. In the section “grants” (cells where Ministry is equal to 25), Write “Stock” the row
corresponding to code 25-00-000, and “Above the line” for all the other lines of
data.
7.4. In the section for the execution of development projects, contained in the cells with
values 26 – 50, type “Above the line”.
7.5. In the financing part and balances part (cells with values 61 – 80 and 93 – 99),
write “below the line”.
7.6. In the part for revenues (cells with values 81 – 92), write “Above the line”.
7.7. In the part for privatization proceeds and end-of-year balances (cells where
“Ministry” is equal to 93-99), write “Below the line”
8. The next thing to do is to identify the ADMIN units in the database. For sections 1 – 3,
we will rely on the information provided by the Government. For the rest of the
sections, this is what we need to do:
8.1. Section 4 (Debt payments). Write “Public Debt Payments”in ADMIN1 and fill
with NA the other ADMIN variables.
3
WARNING: THIS CODE WILL SEND THE ADMINISTRATIVE COSTS OF DEBT
RESTRUCTURING (Account ID equals to 24-20-000) BELOW THE LINE. YOU WILL NEED TO
CORRECT THIS PROBLEM MANUALLY (I.E., WRITE “Above the line in the row where Account
ID equals to 24-00-000).
15
8.2. Section 5 (Grants received). Write “Development Funds Receipts” in ADMIN1 and
fill with NA the other ADMIN variables.
8.3. Section 6 (Execution of Investment projects).
8.3.1. Modify the formula for variable “Ministry” to =MID(B5693,7,2) and drag
until the end of the section.
8.3.2. Apply the following VLOOKUP in ADMIN1:
=vlookup(L5693,Sheet2!$I$2:$J$20,2,FALSO) 4
8.3.3. It is possible to identify the ADMIN2 for some investment projects. This has
to be done after reviewing carefully the CAPEX files.
8.4. Section 7 (Bail-outs). Write “Ministry of Finance and Trade” in ADMIN1 and fill
with NA the other ADMIN variables.
8.5. Section 8 (Finanincing). As this part of the database goes below the line, just type
NA in all the ADMIN variables.
8.6. Section 9 (Revenue).
8.6.1. Modify the formula for variable “Ministry” to =MID(B6845,7,2) and drag
until the end of the section.
8.6.2. Apply the following VLOOKUP in ADMIN1:
=vlookup(L6845,Sheet2!$I$2:$J$20,2,FALSO)
8.6.3. Beware: You will need to change manually the cells for which the
VLOOKUP retrieves “Ministry of Finance”. Instead, you will need to allocate
these lines to the Seychelles Revenue Commission as follows:
ADMIN1
Autonomous Government Authorities
ADMIN2
Category 2:
Regulatory Bodies
ADMIN3
Seychelles Revenue
Commission
8.7. Section 10 (cash balances and privatization proceeds). As this part of the database
goes below the line, just type NA in all the ADMIN variables.
3.3. Codifying the ECON variables
9. As it was mentioned before, the Seychelles database includes two sets of ECON
variables. The first set, which includes the suffix _IMF at the end, allows users to
reproduce the IMF fiscal tables. This set of variables considers the expenditures of
autonomous bodies as transfers. The second set, which includes the suffix
_NATIONAL at the end, allows to identify the spending of the autonomous agencies at
the item level. Both sets of ECON variables use the GFSM 2001 classification. In fact,
The _IMF and _NATIONAL classification is basically the same with the exception of
sections 2 (“centralized payments”), 3 (“transfers to autonomous authorities and
4
BEWARE: This VLOOKUP will give you some #N/A cells. These will correspond to
investment projects executed by the constitutional appointees. You will need to find out
which manually in the CAPEX files. Also, some of the projects identified with the Ministry
of Environment were in reality executed by the Seychelles Agricultural Agency, a
parastatal. You will have to check that as well in the CAPEX files.
16
parastatals”), and 7 (“bail-outs). The paragraphs below indicate how to assign econ
codes to all the sections of the database.
10. The introduction of GFSM is a new development in Seychelles. BOOST is the first
attempt to reconcile the old chart of accounts, which had no structure and changed from
year to year, to GFSM. Most of the work was done using VLOOKUPS to link the
original classification with the GFSM nomenclature provided in three files provided by
the
Authorities:
“Bridged_Treasury_GFS(2)”,
“Copy
of
Economic_Classification_ver_17”, and “Copy of Revenue Classification”. The table
below specifies the mapping relation between the different sections of the database and
the three files provided by the authorities.
Table 3. How to map the different sections of the database with ECON variables
Section
Mapped to file
IS _IMF classification
equal to _NATIONAL?
I. Expenditures of line
ministries and constitutional
appointees
Copy of Economic_Classification_ver_17
Yes
II. Centralized payments
None. Done manually
Yes
III. Social Programs and
transfers to autonomous
authorities and parastatals
No
VIII. Financing
*_IMF: Done manually
*_National:
-Done manually for lines with codes 2100 and 21-01
-Bridged_Treasury_GFS(2) for lines with
codes 22
None. VLOOKUPs set up after discussion
with authorities
None. VLOOKUPs set up after discussion
with authorities
None. VLOOKUPs set up after discussion
with authorities
*_IMF: Done manually
*_National: Done manually
Bridged_Treasury_GFS(2)
IX. Revenue
Copy of Revenue Classification
Yes
X. Proceeds from privatization
and balances at the end of the
year
Bridged_Treasury_GFS(2)
Yes
IV. Debt Payments
V. Grants Received
VI. Execution of Development
Projects
VII. Bailouts
Yes
Yes
Yes
No
Yes
17
11. Section I (Expenditures of line ministries and constitutional appointees) was filled out
using VLOOKUPS linking variable “four digits” with the ECON codes provided in the
new chart of accounts. To fill down the _IMF variables, you will need to write the
following VLOOKUPS between Columns Q2 and W2, and drag down:
Q2 =VLOOKUP($N2,Sheet2!$N$3:$U$209,2,FALSE)
R2 =VLOOKUP($N2,Sheet2!$N$3:$U$209,3,FALSE)
S2 =VLOOKUP($N2,Sheet2!$N$3:$U$209,4,FALSE)
T2 =VLOOKUP($N2,Sheet2!$N$3:$U$209,5,FALSE)
U2 =VLOOKUP($N2,Sheet2!$N$3:$U$209,6,FALSE)
V2 =VLOOKUP($N2,Sheet2!$N$3:$U$209,7,FALSE)
W2 =VLOOKUP($N2,Sheet2!$N$3:$U$209,8,FALSE)
After you drag down, your screen should look like this:
Figure 3. Appearance of Database After Building ECON Variables
This line of codes will result in several cells with values “N/A”. The reason for this
is that not all the codes are mapped to GFSM 2001. Some codes starting with 85,
86, and 87 were not mapped to GFSM 2001 because they refer to programs instead
of ECON items. Traditionally, these lines have been reported as expenditures in
goods and services to the IMF. Therefore, the BOOST Team agreed with the
Seychelles authorities, that the database would identify these items as “Other
Goods and Services not reclassifed in the new chart of accounts” in ECON2, and
ECON3 would include the original name of the item. After filling down the
variables with values #N/A with real variable descriptions, copy them to the
_NATIONAL variables.
18
12. Section II needs to be done manually, line by line. Lines for which “Division” is equal
to 21-00 include different compensations to high level officials, including the President
of the Republlic. Lines for which variable variable “Division” is equal to 21-01 include
purchase of goods and services.
12.1.
For lines where division is equal to 21-00, you will need to distinguish
between “wages and salaries” and “compensation and gratuities”. The only way to
do it is looking at variable “Account description”. Descriptions that start with WS
refer to “wages and salaries”; descriptions that start with CGW refer to
“compensations and gratuities”. You need to identify that in variable ECON2, and
variable ECON3 must include the name of the agency. This applies both to the IMF
and NATIONAL variables. The table below should serve as an example:
Table 4. Section II. Examples
Account
ID
Account Description
ADMIN1
21-000101
WS.CAP.PRESIDENTIAL
Centralized
Payments
21
21-00
0101
21-000102
WS.CAP.MINISTERIAL
Centralized
Payments
21
21-00
0102
21-000103
WS.CAP.CONSTITUTIONAL Centralized
APPOINTEES
Payments
21
21-00
0103
21-000104
WS.CAP.ATTORNEY
GENERAL'S
Centralized
Payments
21
21-00
0104
21-000110
CGW.STATE HOUSE
ADMINISTRATION
Centralized
Payments
21
21-00
0110
Ministry Division Four digits
ECON0_IMF ECON1_IMF
21
Compensation
2 Expense
of Employees
21
Compensation
2 Expense
of Employees
21
Compensation
2 Expense
of Employees
21
Compensation
2 Expense
of Employees
21
Compensation
2 Expense
of Employees
ECON2_IMF
ECON3_IMF
Wages and
Salaries
Presidental
Wages and
Salaries
Ministerial
Wages and
Salaries
Constitutional
Apppointees
Wages and
Attorney
Salaries
General
Compensation
and
State House
Gratuities
12.2.
Lines where division is equal to 21-01 refer all to goods and services
centrally purchased. File “Guide” shows how they should be registered in the
database.
13. Section III (lines where Ministry is equal to 21, and “Division” is equal and higher
than 21-02, and lines where Ministry is equal to 22) is the one where the differences
between the IMF and the National classification are located.In the IMF classification,
all of these lines should be classified simply as “Transfers” in ECON1. In ECON2,
however, the following adjustments need to be made:
13.1.
Division = 21 -02 should say “Social Program of Central Government” in
ECON2_IMF. The name of the program (to be retrieved manually from Account
Description) needs to be registered under variable PROJECT1.
13.2.
Division = 21-03 should say “Benefits and Programs of Social Security
Fund” in ECON2_IMF. The name of the program (to be retrieved manually from
Account Description) needs to be registered under variable PROJECT1.
19
13.3.
Ministry = 22 should say “Transfers to public sector from central
government” in ECON3_IMF
13.4.
For the _NATIONAL variables, you will need to do a VLOOKUP to link the
Account ID with the GFS bridge tables provided by the Government (see file
“guide” for more information).
14. In Section IV (debt payments), make a series of VLOOKUPS that identify the
payments to internal and external debt (see file guide for more clarification). Beware of
code 24-20-0000. The VLOOKUP in place in the file identifies this line as a
payment of principal to foreign debt. In reality, this should be classified as a
payment for goods and services in both _IMF and _NATIONAL.
15. In Section V (grants received), type “1 Revenue” under ECON0, and “13 Grants” under
ECON1. Then drag down. Watch out: when you drag down, make sure that you just
copy the cells. The Excel default command is to continue the series (i.e., you will
have 2 Revenue in the second cell, 3 Revenue in the third one, and so on…). You
will need to correct for that; how to do that depends on the version of Excel you
are using.
16. In Section VI of the development budget, type the following:
ECON0 “3 Changes in Net Worth”
ECON1 “31 Non-Financial Assets”
ECON2 “311 Fixed Assets”
ECON3 “3111 Buildings and Infrastructures” 5
Then, drag the formula down. Again, be sure that you are just copying the values, not
continuing the series.
17. Section VII (bailouts) needs to be done manually with the authorities. This part is not
included in any of the three files provided by the authorities.
18. In Section VIII (financing), you will need to do a VLOOKUP to link the Account ID
with the nomenclature of file Bridged_Treasury_GFS(2) (see file “guide” for more
information).
19. In Section IX (revenue), you will need to do a VLOOKUP to link the Account ID with
the nomenclature of file Copy of Revenue Classification (see file “guide” for more
information).
5
A quick overview of the development budget reveals that not all of the projects are physical investments.
Some of them, like the organization of workshops, or the elaboration of bilingual dictionaries, could be
classified as purchases of goods and services. The Seychellois Government is working on an accurate
classification of the projects included in the development budget, which include the introduction of COFOG.
20
20. In Section X (proceeds from privatizations and balances), you will need to do a
VLOOKUP to link the Account ID with the nomenclature of file
Bridged_Treasury_GFS(2) (see file “guide” for more information).
3.4. A word about the variables PROJECT1, and SOURCE_FIN1 & 2
One of the main features of BOOST databases is the inclusion of variables identifying
budget lines by project and source of funding, where available. The Seychelles BOOST
takes advantage of that amazing innovation.
In line with other BOOST databases, variables SOURCE_FIN1 and 2 identify the source of
funding for the investment projects of the development budget (section VI of databases,
lines where Ministry equals 26 – 50). Like other sections of the database, this part was done
manually. The way it was done was the following:
•
•
•
Look for the project name (Account Description) or the amount executed in the
CAPEX files.
With the exception of the lines where variable division is equal to 30-01, Copy
and paste the source of funding as it appears there.
For lines where variable division is equal to 30-01, type “Government of
Seychelles” under SOURCE_FIN1, and “Domestic” under SOURCE_FIN2.
In line with other BOOST databases, and as its name indicates, variable PROJECT1
identifies the investment projects for a given budget line. In addition, this variable identifies
other items of interest in different section of the database, as the table below indicates.
Section of database
What does variable
PROJECT1 identifies in this
section?
I. Expenditures of line ministries
and constitutional appointees
Nothing
II. Centralized payments
Nothing
III. Social Programs and transfers
to autonomous authorities and
parastatals
Social program
For lines where
“Division” is equal to 2102 and 21-03, copy the
contents of cell “Account
Description”
IV. Debt Payments
Bond or loan to which a
Copy the contents of cell
How was the information
retrieved from the
database
21
payment was made
“Account Description”
V. Grants Received
Nothing
VI. Execution of Development
Projects
Name of project
Copy the contents of cell
“Account Description”
and double check with
CAPEX files
VII. Bailouts
Name of enterprise receiving
public money
Copy the contents of cell
Account Description
VIII. Financing
Nothing
IX. Revenue
Nothing
X. Proceeds from privatization and
balances at the end of the year
Nothing
22
4. How to use the Seychelles BOOST database. Some examples
BOOST-Seychelles consists of three Excel spreadsheets: the first one, called “TOC”,
describes the variables of the database. The second one, called “Raw Data”, contains
information at the line level and can be used by experts in budget and Excel to do in-depth
analyses. “Raw Data” also feeds into the sheet “Pivot”, which allows users to do
customized tables using Excel’s Pivot Table functionality.
Most users will only use the Pivot sheet.
A PivotTable report is an interactive way to quickly summarize large
amounts of data. Use a PivotTable report to analyze numerical data in
detail and to answer unanticipated questions about your data. A
PivotTable report is especially designed for:
•
Querying large amounts of data in many user-friendly ways
•
Subtotaling and aggregating numeric data, summarizing data by
categories and subcategories, and creating custom calculations and
formulas.
•
Expanding and collapsing levels of data to focus your results, and
drilling down to details from the summary data for areas of interest to you.
•
Moving rows to columns or columns to rows (or “pivoting”) to see
different summaries of the source data.
•
Filtering, sorting, grouping, and conditionally formatting the most useful
and interesting subset of data to enable you to focus on the information
that you want.
Presenting concise, attractive, and annotated online or printed reports. 6
•
PivotTables are straightforward and easy to use and allow for quick, customizable
analyses of large amounts of data. This section presents several examples of using the
BOOST PivotTable interface to general custom reports. With BOOST, as with many
things in life, the best way to learn is by doing. 7
6
For more information on Excel PivotTables, please consult the help function in Microsoft Excel or this
helpful overview of the Microsoft website: http://office.microsoft.com/en-us/excel-help/overview-ofpivottable-and- pivotchart-reports-HP010177384.aspx.
7
The minimum technical requirements for using BOOST-Seychelles are as follows: (i) a computer with at least 1 GB of
RAM (2 GB preferred); (ii) Microsoft Excel version 2007 or later (or similar database software that allows loading of
files with at least one million lines of data).
23
4.1. Example 1. Trend Analysis by Ministry
Figure 3 below presents an example of time trend analysis at the macro level. It reports
total government expenditures from 2004 to 2011, broken down by the top- level
administrative classification. To generate this PivotTable, value “Above the line” of
variable Above and Below the line is used as a filter; ADMIN1 is placed in the Row Labels
box, Year in the Column Labels box, and the values in the body of the table consist of the
sum of the Debit Executed variable.
Figure 4. Examining Government Expenditure across years
24
4.2. Example 2. Looking at a specific sector of activity
One of the main limitations of this database is that it doesn’t include a functional
classification. If one adds the fact that Ministries and Agencies have been reorganized
several times over the last years, following up the evolution of spending in a given sector
might be complicated. Fortunately, however, some if not most ADMIN units at the lower
levels remained constant. This example will try to analyze the evolution of spending in the
sector of Health, which has gone through two ADMIN changes since 2004: between 2004
and 2005, it was named “Ministry of Health”. Between 2006 and 2010, it was named
“Ministry of Health and Social Development”, when it absorbed the functions of the
Social Development Agency. Last, in 2011, it became Ministry of Health Again, but only
with two ADMIN2 units.
To generate a pivot table that only looks at the expenditures in health, you need to follow
the following steps:
• Value “Above the line” of variable Above and Below the line is used as a first
filter.
• Variable ADMIN1 is used as a second filter, as well. Here, you have to use
“Ministry of Health” and “Ministry of Health and Social Development” as filtering
units.
• Variable ADMIN2 is placed in the Row Labels box.
• Variable Year is placed in the Column Labels box.
• Last, the values in the body of the table consist of the sum of the Debit Executed
variable.
At this point, you will note you have good time series only for “NA”, which runs from
2004 to 2011 and includes the development projects carried out under the flag of the
Ministry, and a relatively decent time series for the Public Health Commission (2004-10).
These two time series are highlighted in yellow below. The reason behind the lack of
information for the other ADMIN2 units is an admninistrative reorganization that took
place in 2008, which created a new agency called “Health Services Agency” and put most
ADMIN2 units under its umbrella. This time series, which runs from 2009 to 2011, is
highglighted in red. The series highlighted in blue corresponds to the units dealing with
social services. Between 2004 and 2008, the functions were divided in three ADMIN2
units (Social Affairs, Social Development, Social Services), which were unified under the
Department of Social Development in 2009. In 2011, the Ministry of Social
Develoopment and Culture was created, taking the functions related to social issues away
from the Ministry of Health definitely.
25
Figure 5. ADMIN2 units under 'Ministry of Health' and 'Ministry of Health and Social Development'
In order to have relatively unified and long time series, it is necessary to introduce the
ADMIN3 variable to the pivot table and do some manual manipulation of the data. Figure
5 shows that most of the units that had ADMIN2 status between 2004 and 2008
(Community Health Care, Corporate Services) are ADMIN3 units under “Health Services
Agency” from 2009 onwards. Unfortunately, these issues are not uncommon in the
database. The Ministry of Health is, in fact, one of the easy cases. The database, therefore,
requires knowledge and experimentation before getting concrete results. It is expected,
however, that, as the new ADMIN chart of accounts becomes available, efforts to produce
unified time series take place.
26
Figure 6. Ministry of Health, adding ADMIN3 level
27
4.3. Example 3. Looking at the ECON classification
The ECON classification of the database is consistent across years and is mapped to
GFSM 2001. A conscious effort carried out by the authorities and the BOOST team was
done to make that happen. Let’s suppose you want to look at the distribution of
expenditures of the Ministry of Education by ECON classification. The next steps explain
you how to do that:
To generate a pivot table that only looks at the expenditures in health, you need to follow
the following steps:
• Value “Above the line” of variable Above and Below the line is used as a first
filter.
• Variable ADMIN1 is placed in the Row Labels box and filters by “Ministry of
Education” (2004-10) and “Ministry of Education, Employment, and Human
Resources” (2011). 8
• The values in the body of the table consist of the sum of the Debit Executed
variable.
• Since we are not looking at autonomous government authorities or bail-outs, you
can use either the _IMF or the _NATIONAL variables. Whatever you decide, you
need to place them in the Row Labels box up until the desired level of detail.
Figure 7. Expenditures of the Ministry of Education by ECON classification
8
Note that, in order to have consistent time series, the ADMIN changes between 2010 and 2011 will push you
to make similar manipulations to the ones done in Example 3.
28
4.4. Example 4. Adding the revenue dimension
The Seychelles BOOST is the first database that includes revenues. The database identifies
what ADMIN units are the ones collecting the revenue and for what concept (taxes, fees,
licences). Let’s suppose you want to compare how much money raised the Ministry of
Health against how much it spent in 2011. To do that, you need to follow these steps:
• Value “Above the line” of variable Above and Below the line is used as a first
filter.
• Use Year as a second filter: select 2011.
• Variable ADMIN1 is placed in the Row Labels box and filters by “Ministry of
Health”. 9
• Variable ECON2_IMF in row box.
• The values in the body of the table consist of the sum of the Debit Executed and
Credit Executed.
• You can insert one or more of the ECON variables to have more detail.
Figure 8. Adding the Revenue Dimension
9
Note that, in order to have consistent time series, the ADMIN changes between 2010 and 2011 will push you
to make similar manipulations to the ones done in Example 3.
29
4.5 Example 5. Looking at debt
Public debt payments have been an important issue in Seychelles. BOOST allows tracking
them easily and in a consistent way. More important, you can even look at what loan or
bond a payment has been made, and whether the payment went to covering interests or
reducing principal. Pre-2009 analysis can be done, but is slightly more complicated. For
illustration purposes, we will do an analysis using 2009-11 data. Let’s suppose we want to
see the detailed debt payments and administrative costs of the debt for these years. There
are two ways to do this.
Method 1.
• Use ADMIN1 as a filter, and filter by “Public Debt Payments”.
• Place variable Year in the Column Labels box.
• Place variables PROJECT1 and Above and below the line in the Row Labels box.
• The values in the body of the table consist of the sum of Debit Executed.
Figure 9. Looking at Debt Payments: Method 1
Method 2.
• Use ADMIN1 as a filter, and filter by “Public Debt Payments”.
• Place variable Year in the Column Labels box.
• Place variables PROJECT1 and ECON1, ECON2, and ECON3 in the Row Labels
box (you can use either _IMF or _NATIONAL).
• The values in the body of the table consist of the sum of Debit Executed.
30
Figure 10. Looking at Debt Payments: Method 2
(users can prove that payments to debt principal are always included below the line)
31