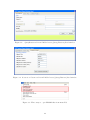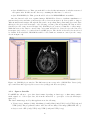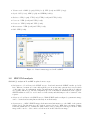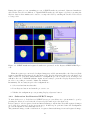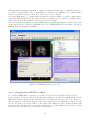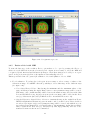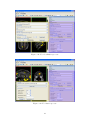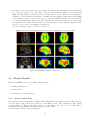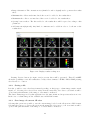
1
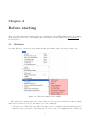
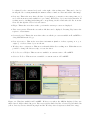
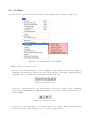
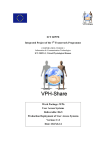
USER MANUAL 1.0
2
Contents
1 What is FocusDET?
2 Before starting
2.1 Windows . . . . .
2.2 Toolbars . . . . . .
2.3 Useful commands .
2.4 Open/Save session
5
.
.
.
.
.
.
.
.
.
.
.
.
.
.
.
.
.
.
.
.
.
.
.
.
.
.
.
.
.
.
.
.
.
.
.
.
.
.
.
.
.
.
.
.
.
.
.
.
.
.
.
.
.
.
.
.
.
.
.
.
.
.
.
.
.
.
.
.
.
.
.
.
.
.
.
.
7
7
9
10
11
3 FocusDET features
3.1 Import Files . . . . . . . . . . . . . . . . . . . . . . . .
3.1.1 PACS server . . . . . . . . . . . . . . . . . . .
3.1.2 Open a DICOM file . . . . . . . . . . . . . . .
3.1.3 Open a data file . . . . . . . . . . . . . . . . .
3.2 SISCOM analisis . . . . . . . . . . . . . . . . . . . . .
3.2.1 Realignment of Ictal-Interictal SPECT images
3.2.2 Subtraction Ictal-Interictal SPECT images . .
3.2.3 Segmentation of MRI . . . . . . . . . . . . . .
3.2.4 Coregistration of SPECT to MRI . . . . . . . .
3.2.5 Fusion of foci with MRI . . . . . . . . . . . . .
3.3 Export Results . . . . . . . . . . . . . . . . . . . . . .
3.3.1 Saving results sheet . . . . . . . . . . . . . . .
3.3.2 Saving a file . . . . . . . . . . . . . . . . . . . .
3.3.3 Save image of current 3D view . . . . . . . . .
.
.
.
.
.
.
.
.
.
.
.
.
.
.
.
.
.
.
.
.
.
.
.
.
.
.
.
.
.
.
.
.
.
.
.
.
.
.
.
.
.
.
.
.
.
.
.
.
.
.
.
.
.
.
.
.
.
.
.
.
.
.
.
.
.
.
.
.
.
.
.
.
.
.
.
.
.
.
.
.
.
.
.
.
.
.
.
.
.
.
.
.
.
.
.
.
.
.
.
.
.
.
.
.
.
.
.
.
.
.
.
.
.
.
.
.
.
.
.
.
.
.
.
.
.
.
.
.
.
.
.
.
.
.
.
.
.
.
.
.
.
.
.
.
.
.
.
.
.
.
.
.
.
.
.
.
.
.
.
.
.
.
.
.
.
.
.
.
.
.
.
.
.
.
.
.
.
.
.
.
.
.
.
.
.
.
.
.
.
.
.
.
.
.
.
.
.
.
.
.
.
.
.
.
.
.
.
.
.
.
.
.
.
.
.
.
.
.
.
.
.
.
.
.
.
.
.
.
.
.
.
.
.
.
.
.
.
.
.
.
.
.
.
.
.
.
.
.
.
.
.
.
13
13
13
13
15
16
17
18
19
20
21
23
23
24
24
.
.
.
.
.
.
.
.
.
.
.
.
.
.
.
.
.
.
.
.
.
.
.
.
.
.
.
.
.
.
.
.
.
.
.
.
.
.
.
.
.
.
.
.
.
.
.
.
.
.
.
.
3
.
.
.
.
.
.
.
.
.
.
.
.
.
.
.
.
.
.
.
.
.
.
.
.
4
Chapter 1
What is FocusDET?
FocusDET is a software package to locate epileptogenic foci in intractable partial epilepsy.
The development of this medical application is based on GIMIAS [1], a workflow oriented framework for the Biomedical imaging and modelling prototypes in the context of the Virtual Physiological
Human (VTK). GIMIAS is an open source framework distributed under BSD license, developed in
C++ and it is based on robust open source libraries such as VTK, ITK, MITK, DCMTK, NETGEN
and TETGEN among others.
The application interface was built under the VPHTk (Virtual Physiological Human Toolkit) project
from CIBER-BBN. Specifically the universities that have participated are: Universitat de Barcelona,
Universidad Politécnica de Madrid and Universitat Pompeu Fabra.
5
6
Chapter 2
Before starting
There are some features importants to know for a friendly use of FocusDET. This features are available
in all applications developed on GIMIAS. More information is also available in www.gimias.org →
Documentation.
2.1
Windows
Selecting Windows option from View menu all windows available will be shown (see figure 2.1).
Figure 2.1: Windows available in FocusDET
The windows are floating and can be placed wherever the user prefers inside the window. Main
windows are described below (see the figure 2.2 to view examples):
• Working area: This is the area where the images can be visualized and the main interaction
functions can be performed on the image (zoom, rotate, pan, etc.). Brightness and contrast can
7
be adjusted by the contrast bar located on the right of the working area. This can be done by
moving the bar or setting manually the numeric values of window center and width of the image.
• Data tree: This is the area where all data objects (images, geometries, series, timepoints, etc.)
are loaded in memory and available for processing. Each data object can render/unrender in
working area by checking/unchecking the corresponding checkbox and unloaded also from the
Data tree through the Unload selected button.
• Helper : This is the area where aids to perform the various processes are displayed.
• Time management: This is the area where 4D data can be displayed. Pressing Play button the
sequence of data starts.
• Command panel : This is the area where there are all the processors available in FocusDET for
doing SISCOM methodology.
• Data information: This is the area where information (number of slices, spacing on x, y, z,
origin,...) of selected data object are shown.
• Working Area configuration: This area works with Multi Slice working area. With this area is
possible to change the direction, flip or rotate the slices.
• Tools Processor Widget: This area is not available on current version of FocusDET.
• Selection Toolbox : This area is not available on current version of FocusDET.
Figure 2.2: Windows available in FocusDET. Working area where the MRI is displayed, Data tree
shaded in red, Helper shaded in green, Time management shaded in blue, Command panel shaded in
yellow, Data information shaded in purple and the Working Area Configuration shaded in orange.
8
2.2
Toolbars
Selecting Toolbars option from View menu all toolbars available will be shown (see figure 2.3).
Figure 2.3: Toolbars available in FocusDET
Main toolbars are described below:
• Layout toolbar: Different ways to sort the working area. On the figure 2.4 from left to right: 1)
Standard four views layout, 2) 2D views on the left and 3D view on the right, 3) Only 2D views,
4) X plane view, 5) Y plane view, 6) Z plane view and 7) 3D view.
Figure 2.4: Layout Toolbar
• Selection toolbar: Interaction tools. On the figure 2.5 from left to right: 1) Place landmark,
2) Show/hide landmark labels, 3) Measure distance between two points and 4) Draw region of
interest (ROI).
Figure 2.5: Selection Toolbar
• Appearance toolbar: Appearance tools. On the figure 2.6 from left to right: 1) Show/hide the
legend of the image, 2) Lookuptable combo box and 3) Opacity slider.
9
Figure 2.6: Appearance Toolbar
• Window toolbar: Management of windows. On the figure 2.7 from left to right: 1) Show/hide
Data tree window, 2) Show/hide Helper window, 3) Show/hide Time management window, 4)
Show/hide Data Entity Information window, 5) Show/hide Working Area Configuration window,
6) Show/hide Tools Processor Widget window, 7) Show/hide AppearanceSuitcase window and
8)Signal viewer window.
Figure 2.7: Window Toolbar
• Working area toolbar: Different working areas. On the figure 2.8 from left to right: 1) Orthoslice
working area, 2) SideBySide working area, 3) Compare Slice working area and 4) Multi Slice
working area.
Figure 2.8: Working Area Toolbar
• MultiRenderWindow toolbar: Displaying tools. On the figure 2.9 from left to right: 1) Fit scene,
2) Link/unlink slices planes, 3) Initialize axis, 4) Lock/unlock slice planes and 5) Show/hide X,Y
and Z planes.
Figure 2.9: Working Area Toolbar
2.3
Useful commands
Mouse and keyboard useful commands are indicated below:
• Mouse useful commands:
– Zoom/Unzoom view: Use the right click on one of the views of the image to zoom/unzoom
moving the mouse forward/backward
– Navigate through slices: Use the scroll button to navigate through the slices of the image.
– Pan on image: Use the center button to pan on image. With this button pressed move the
mouse.
– Enlarge view: Use double click on one of the views (X, Y, Z or 3D) to enlarge the selected
views.
• Keyboard useful commands:
10
– Lock/Unlock Axis: Use ctrl+I to lock or unlock Axis.
– Show/Hide Annotation Cube: Use ctrl+A to show or hide the annotation cube (Left-Right,
Anterior-Posterior or Superior-Inferior indications).
– Show/Hide Corner Annotations: Use ctrl+N to show or hide the corner annotations (Name,
birth date and sex of the patient, modality of the image and slice number and intensity of
the voxel selected)
– Open file: Use ctrl+O to open a data file.
– Save file: Use ctrl+S to save a selected data object.
2.4
Open/Save session
In FocusDET is possible to save the working session, i.e. all the data objects loaded on the Data Tree.
In this way, it is possible recuperate it for another time.
• Select Open session from the menu File to open a previous session saved.
• Select Save current session from the menu File to save the current session. All the data objects
in the Data tree will be saved in the same folder. The Data tree structure will be stored in a
xml file.
11
12
Chapter 3
FocusDET features
This chapter describes the main functionalities available in FocusDET.
3.1
Import Files
Files in FocusDET can be opened in three different ways:
• Connecting to a PACS server
• Opening a DICOM file
• Opening a data file
3.1.1
PACS server
FocusDET allows to open files connecting directly with PACS server of the center. Select Connect to
PACS from the menu File to open PACS Connect/Query/Retrieve/Send window. This window has
three tabs described below:
• QueryRetrieve: This is the tab to search patient studies (see figure 3.1). The search can be done
using Patient name (ej: Micheal Fox or Micheal* ) or Patient ID and pressing Query button. If
the name or ID introduced on the field is correct, it will appear the list of the patient studies.
Selecting one of them and pressing Retrieve button the study will be opened in FocusDET. In
addition, the study will be saved on the specified directory on the field Save to directory for
later use.
• Send To Pacs: This function is not available in this version.
• Connection Params: The connection parameters have to be detailed on this tab (see figure 3.2).
If the query fails, it’s likely that one of these parameters is incorrect. PACS server managers
have the necessary documentation to complete these fields. This process should be done only
once if the values are saved by pressing the button Save Connection Parameters.
3.1.2
Open a DICOM file
FocusDET allows opening DICOM files with DICOM plug-in (see figure 3.4). With this application
the user can browse medical images stored in DICOM format and load 2D, 3D and 4D data. In the
menu File there are three ways to open DICOM files depending on how they have been saved (see
figure 3.3).
• Open DICOM file: This option should be selected if the information of all slices was saved in a
single file.
13
Figure 3.1: QueryRetrive tab from PACS Connect/Query/Retrieve/Send window
Figure 3.2: Connection Params tab from PACS Connect/Query/Retrieve/Send window
Figure 3.3: Three ways to open DICOM files from menu File
14
• Open DICOM directory: This option should be selected if the information of each slice was saved
in separate files. In this case the directory containing the files has to be selected.
• Open DICOMDIR file: This option should be selected if DICOMDIR file is available.
Once the data is loaded, it is organized using a DICOM Tree Viewer to facilitate visualization of
patient, study, series and time point data (see the red area from figure 3.4). It is possible to inspect
different studies and navigate through the slices and corresponding time points using Space and Time
sliders (see the green area from figure 3.4). Selecting one time point and pressing the button Add to
DataList (see the orange area from figure 3.4), DICOM plug-in creates a volumetric or 3D+t image.
With this action, the data is converted into vtk format and added to Data List (see the blue area
from figure 3.4), ready to be rendered in FocusDET plug-in. The checkbox Reorient data is selected
by default. If it is disabled, DICOM files will be loaded without orientation control (see the orange
area from figure 3.4).
Figure 3.4: DICOM plug-in window. The different regions correspond to DICOM Tree Viewer (red),
Space and Time slider (green), Reconstruct data (orange) and Data tree (blue).
3.1.3
Open a data file
FocusDET also allows to open other data formats depending on data’s type: volume image, surface
mesh, signal, etc. Select Open data file from the menu File to open Open a data file window(see
figure 3.5).
The data formats supported by this application are the following:
• Volume image: Analyze (*.hdr), MetaImage (*.mhd), Nifti (*.nii), V3D (*.v3d), VTI (*.vti) and
VTK (*vtk). The program also asks to introduce the modality of the image (MRI, NM, CT,...).
• Surface mesh: STL (*.stl), VTI (*.vti), VTK (*.vtk) and VTP (*.vtp).
15
• Volume mesh: CGNS (*.cgns), VOL (*.vol), VTI (*.vti) and VTP (*.vtp).
• Signal : CSV (*.csv), GDF (*.gdf) and VHDR (*.vhdr).
• Skeleton: STL (*.cgns), VTI (*.vti), VTK (*.vtk) and VTP (*.vtk).
• Point set: VTK (*.vtk) and VTP (*.vtk).
• Countour : VTK (*.vtk) and VTP (*.vtk).
• Measurement: VTK (*.vtk) and VTP (*.vtk).
• ROI : VTK (*.vtk).
Figure 3.5: Data formats supported in FocusDET
3.2
SISCOM analysis
SISCOM [2] analysis in FocusDET is splitted in five steps:
• Realignment of Ictal-Interictal SPECT images: Ictal and interictal SPECT studies probably
have different orientation because although they are from the same patient they weren’t taken
on the same day. A realignment method is implemented using a Local Correlation Coefficient
as a penalty function [3]. On the realignment process, a intensity normalization is also applied.
SPECT masks are added to avoid extra cerebral activity and thus improve the robustness of the
register.
• Subtraction Ictal-Interictal SPECT images: With SPECT studies realigned, a parametric image
can be obtained subtracting Interictal study from Ictal study.
• Segmentation of MRI : SPECT images lack anatomical information, so the MRI of the patient
is introduced. In this first step, the brain is extracted from de MRI data performing a fuzzy
C-Means classification to identify the white matter, and growing the brain region from it. This
image will be used to delete extra-cerebral areas from the Subtraction image.
16
• Coregistration of SPECT to MRI : All SPECT studies (ictal, interictal and subtraction) will be
co-registered with the MRI using a multi-resolution approach using Mutual Information based
algorithms from ITK.
• Fusion of foci with MRI : To locate the epileptogenic focus not all values of the Subtraction
image form part of it. Only positive values represent hyperperfusion areas and besides not all
positive values are meaningful to be part of the foci. On the fusion process, firstly epileptogenic
foci will be isolated hidding the negative and part of the positives values and will be saved in a
new image. This image will be merged with the MRI and in this way the SISCOM Analisis will
be over.
It is necessary to load (in any case described in 3.1) the three files (Ictal and interictal SPECT
studies and MRI) in order to start SISCOM analysis. Select the tab FocusDET to open its functions.
Here are the detailed steps to perform SISCOM analysis.
3.2.1
Realignment of Ictal-Interictal SPECT images
To start Realignment Ictal-Inter-ictal SPECT images process Register options must be open by pressing the Register tab from the Command panel window (see the figure 3.6).
Figure 3.6: Realign SPECT-SPECT process
Firstly, it is necessary to select ictal and interictal images in the right place. The alignment of
this two studies (before realignment process) can be checked by pressing the Display Pre-Alignment
button (this point is optional). This function permits the alternate visualization of ictal and interictal
images with a particular frequency of change. With the slider Speed is possible to vary the frequency
of change on visualization of this two images. It is necessary to press again the Display Pre-Alignment
button in order to stop this process. Then, pressing the Register button this process starts.
17
During the register process, a masking process of SPECT studies is performed. Generated masks are
added in the Data tree as children of original SPECT studies (see the figure 3.7). Before pressing the
Register button, these masks can be saved to a temporal folder by enabling the checkbox Save masks
to temp folder.
Figure 3.7: SPECT masks and registered studies are generated on the Register SPECT-SPECT process.
When the register process is ended, realigned images are added automatically to the Data tree (Ictal
registered and Interictal registered (see the figure 3.7)). Display Alignment button (see the figure 3.6)
will be enabled to perform a visual validation of realignment process. Possible errors on this process
will affect the rest of SISCOM analysis. Again, it is necessary to press the Display Alignment button
in order to stop this process and continue the analysis.
In summary, the necessary steps for the realignment are:
1. Select ictal and interictal studies.
2. Press Register button and wait the process is over.
3. Validate the realignment process pressing Display alignment button.
3.2.2
Subtraction Ictal-Interictal SPECT images
To start Subtraction of Ictal-Interictal SPECT images process Subtraction options must be open by
pressing the Subtraction tab from the Command panel window (see the figure 3.8).
It is necessary to select registered ictal and interictal images only in that cases that registered images
are loaded (not generated on the previous step). If this step is performed after the Realignment
process, the inputs are automatically selected.
The parametric image, result of subtraction of registered interictal image from ictal registered image,
18
is generated by pressing Apply Subtraction button. The operation applied to obtain this images is
described in the equation 3.1.
ISi − IISi
· 100
(3.1)
SI i =
IISi
where SI is the subtraction image, IS is the ictal SPECT and IIS is the interictal SPECT. This
operation is applied to all i pixels of the image.
A new image (Subtraction(I-II)) appears on the Data tree when this process is done (see the figure 3.8).
Positive values of Subtraction image will represent hyperactivation areas and negative values areas
with hypoactivation.
Figure 3.8: Subtraction (Ictal-Interictal) process.
3.2.3
Segmentation of MRI
FocusDET includes a brain extraction tool, which is opened by clicking on the MRI Brain extraction
tab from the Command panel.
At this point of the workflow, the MRI has not been used yet so it is necessary to select the MRI image
on the data input to start segmentation process. Initially, a fuzzy c-means classification is performed,
using the number of classes specified on the corresponding field of options panel. Then, the white
matter class is selected, also taking the desired value from its option field of options. A brain mask
will be grown, starting from the white matter class, depending on the threshold introduced on the
third field of options panel (see the figure 3.9. Neighbour pixels of the initial mask will be added to
19
this mask if their intensity is less than or equal to the threshold value. It is recommended the use of
five classes (selecting number five on field Number of classes), if the MRI has been acquired with a
scanner of 1.5T. If a scanner of 3T is used, it is better to select 3 classes.
As a trick, MRI with good contrast will be segmented selecting 3 number of classes, 2 white matter
class and default threshold. For any other cases, it is recommended to use 4 number of classes, 2 white
matter class and default threshold because it gives the best results.
Once three parameters (Number of classes/White matter class/Threshold) have been introduced, click
on the Apply button to start the segmentation process. A MRI mask is added as a child of the whole
MRI when the segmentation is finished.
Figure 3.9: MRI Brain extraction process.
3.2.4
Coregistration of SPECT to MRI
To open the SPECT-MRI coregistration tool, click on Coregister tab from the Command panel.
It is necessary to select the registered ictal and interictal images, the Subtraction(I-II) image and the
MRI. These images will appear automatically selected if all the previous step were done. If not (i.e.
the user wants to load custom images), some of the input data boxes may appear empty. To run
the process, click on Coregister button of the panel. Once finished, a new coregistered image will
appear added to the Data tree for each functional study set as input (Interictal Coregistered, Ictal
Coregistered and Subtraction Coregistered), see figure 3.10.
20
Figure 3.10: Coregistration process.
3.2.5
Fusion of foci with MRI
To start the last step of the workflow Fusion options have to be open by pressing the Fusion of
Subtraction with MRI tab from the Command panel. Again, it is necessary to select the MRI and
co-registered (ictal, interictal and Subtraction) images, only if these images are loaded (i.e. not generated on the previous steps). If not, the inputs are automatically selected.
This step is divided into two parts: 1)Localization of foci and 2)Fusion of foci to MRI.
1. Foci localization: To isolate the focal region it is necessary to select a range of values of the
Subtraction image. FocusDET offers the possibility to select this range in two different ways
(see figure 3.11):
• User defined Range Values: Introducing the minimum and the maximum values of the
range and then pressing the Apply Range button, a new parametric image will be created.
This image only contains intensity values between the numbers introduced in fields: Min
Percent and Max Percent. As in previous steps, the new image will be added in the Data
tree (eg: Subtraction (10%,50%) if Min Percent = 10 and Max Percent = 50).
• Standard Deviation defined Values: Selection of statistical range is also available in FocusDET. If 1SD(Standard Deviation) option from the combo box and Positive Values checkbox
are selected (see figure 3.11), a new parametric image will be created only with those positive values greater than 1SD (i.e. from 1SD value to the maximum). Again, the new image
will be added in the Data tree (eg: Subtraction (1 SDs, hypeperfusion). The use of two
standard deviation is the most recommended.
21
Figure 3.11: Foci localization process.
Figure 3.12: Foci fusion process.
22
2. Foci fusion: Once the focus is located, the image generated is automatically selected on the field
Foci image (see figure 3.12). The image selected on this field is the image to merge with the
MRI. Selecting Display results button a new working area is opened. This new area permits the
validation of foci localization. It has three columns, the first column contains merge image (MRI
+ Foci image), on the second one, the ictal co-registered SPECT, and the last one, interictal
co-registered SPECT (see figure 3.13). By positioning the pointer in a image view, other views
are updated in accordance with the first one. It is necessary to press again the Display results
button to come back to the standard working area.
To export the merge image see the next section 3.3.
Figure 3.13: Display results working area.
3.3
Export Results
Files in FocusDET can be saved in three different ways:
• Saving results sheet
• Saving a file
• Save image of current 3D view
3.3.1
Saving results sheet
It is possible to save in a 2D image (*.JPEG,*.PNG,*.BMP) the merge image, using the Export results
area (see figure 3.12) from Fusion Subtraction with MRI options. The results sheet will contain
a certain number of slices of the merge image, i.e. the image focus on a color scale with 50% of
transparency and the MRI in black-white scale (see figure 3.14).
It is necessary to fill the export parameters:
23
• Image Orientation: The orientation view (Axial, Coronal or Sagital) used to generate the results
sheet.
• Minimum slice: Slices under introduced slice won’t be added to the results sheet.
• Maximum slice: Slices over introduced slice won’t be added to the results sheet.
• Spacing between slices: The slices added to the results sheet will be spaced according to this
parameter.
• Add annotation(Optional): Any kind of comments can be added in order to be shown on the
results sheet.
Figure 3.14: Display results working area
Pressing Preview button (see figure 3.12) a preview sheet will be generated. Then, FocusDET
allows the possibility to save the results sheet on any of these formats: *.JPEG,*.PNG,*.BMP pressing
Save Results as... button.
3.3.2
Saving a file
It is also possible to save other data formats depending on data’s type: volume image, surface mesh,
signal, etc. Selecting Save selected data entity from the menu File, Save data to file window will be
opened and path and name of the image to save must be indicated.
The data formats supported by this application are the same mentioned in previous subsection 3.1.3.
In the case of volume image is also available save in DICOM format.
3.3.3
Save image of current 3D view
Selecting this option it is possible to save the current image loaded on the 3D view in a PNG format.
Selecting Save image of current 3D view from the menu File, Save image of 3D view window will be
opened. The path and name of the image to be saved must be indicated.
24
Bibliography
[1] Larrabide I, Omedas P, Martelli Y, Planes X, Nieber M, Moya J, Butako C, Camara O, Sebastian
R, De Craene M, Bijnens BH, Frangi AF. GIMIAS: An Open Source Framework for Efficient
Development of Research Tools and Clinical Prototypes. FIMH, 417-426, 2009.
[2] O’Brien TJ, O’Connor MK, Mullan BP, Brinkmann BH, Hanson D, Jack CR, So EL. Subtraction
ictal SPET co-registered to MRI in partial epilepsy: description and tecnical validation of the
method with phantom and patient studies. Nucl Med Commun, 19:31-45, 1998.
[3] Ros D, Espinosa M, Setoain JF, Falcón C, Lomeña FJ, Pavia J. Evaluation of algorithms for the
registration of 99Tcm-HMPAO brain SPET studies. Nucl Med Commun, 20:227-236, 1999.
25