1
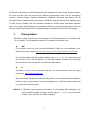
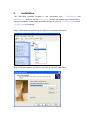
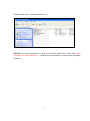
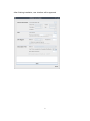
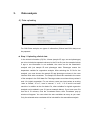
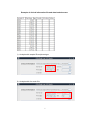
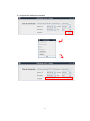
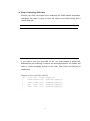
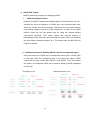
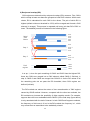
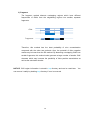
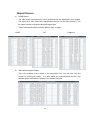
CNVRuler User Manual V1.2 CNVRuler software is freely available with associated files and user manual in our website: http:// www.ircgp.com/CNVRuler/index.html Contact to developer: Yeun-Jun Chung ([email protected]) and Ji-Hong Kim ([email protected]) 1 CNV-Ruler is designed for CNVR based association analysis with user-friendly graphic interface. All forms of major CNV call outputs from different segmentation tools such as Genotyping Console, Genome Studio, Genomic Workbench, BirdSuite, PennCNV and Nexus can be processed without additional converting steps. CNV-Ruler supports defining three different types of CNV regions (CNVRs) and four statistical methods for CNVR based association analysis. Users can analyze CNVR-phenotype associations with their preferable segmentation tools and can test various CNVR definitions and statistical methods suitable for their own study design. 1. Prerequisites CNV-Ruler needs Java Run-time Environment of SUN Microsystems or equivalent (JRE 1.6.0 or higher). For all statistical analyses, R is used as a calculation core. JRE If your system does not have Java Virtual Machine (JVM), you can download it from Oracle’s Java home page (http://www.oracle.com/technetwork/java/javase/downloads/index.html). For checking whether JVM is properly installed, type java –version on a terminal prompt. The version of your JVM will appear if it is correctly installed. Windows users can type the command on the command line window from Start button. R CNV-Ruler needs R for its calculation process. You can download it from its project home page. http://www.r-project.org/ After selecting download mirror site and OS platform, you can download the distribution binaries. If your system doesn’t have the R package on it, CNV-Ruler will prompt it and try to open the R download site. NOTICE: If CNV-Ruler keeps warning that there is no R package after installation, you may add PATH variable manually. Test by typing R –-version on your terminal. Usually, Linux users do not need to change it. 2 2. Installation The CNV-Ruler package consists of two executable files – CNVRuler.bin and CNVRuler.exe – and one text file – readme.txt – which is the change log of version history. Simply uncompress it and select executable by type of your OS – CNVRuler.bin for Linux, CNVRuler.exe for Windows. Step 1) Download compressed zip file. Right click and select Extract All. Step 2) Extract anywhere you want to put them by following instruction 3 Step3) Double click to execute CNVRuler.exe NOTICE: Do not put programs nor data on the folder which has a name with 2-byte character (ex. Asian characters). It makes R occurs inside error (cannot make temporary directory) 4 After finishing installation, user interface will be appeared. 5 3. Data analysis A) Data uploading For CNV-Ruler analysis, two types of information (Clinical and CNV data) must be prepared. Step 1. Uploading clinical data In the clinical information (CI) file, 4 items (sample ID, age, sex and phenotype) are to be included as separate columns in the CI txt file (see the example below). If age or sex information is not available, the users can do the association analysis with just sample ID and phenotype data. Phenotype means the dependent variable for regression analysis. After selecting the CI file for the analysis, you must choose the sample ID and phenotype columns in the user interface with other covariates. The sample ID should be matched to the name of the samples in the CNV data file. Phenotype status must have binary values 0 and 1 for logistic regression. For sex column, users can input values as a string ‘male’ or ‘female’; ‘m’ or ‘f’; ‘man’ or ‘woman’; ‘1’ or ‘0’; ‘1’ or ‘2’ and it is not case sensitive. In addition to the four basic CIs, other variables for logistic regression analysis can be added in your CI (see an example below). If you have more CIs than the 4 CI columns, click the Covariates button, then ‘Covariates’ pop up window will appear. You can select the extra variables as many as you want. Only the selected extra covariates will be included for the association analysis. 6 Example of clinical information file and data loaded screen: 1) Analysis with sample ID and phenotype 2) Analysis with four main CIs 7 3) Analysis with additional covariates 8 Step 2. Uploading CNV data Choose your CNV call output file for analyzing the CNVR based association. CNV-Ruler can read 10 types of CNV call outputs (see Table below) and a custom CNV call. Format Version Tested Ref. PennCNV 2011Jun16 Wang et al., 2007 Nexus 5.1 www.biodiscovery.com Genomic Workbench 6.5 www.agilent.com CGHscape 1.5 Jeong et al., 2008 TCGA files Jun.2011 cancergenome.nih.gov NimbleScan 2.6 www.nimblegen.com Genome Studio 2011.1 www.illumina.com QuantiSNP 2.0 Colella et al., 2007 BirdSuite 1.5.5 Korn et al., 2008 Genotying Console 4.1 www.affymetrix.com If you want to use your own CNV list file, you must prepare a simple tabdelimited text file containing 5 columns as the example below. The names and order of column headings should be Chr, Start, End, Event and Sample_ID respectively. Example of user own CNV data file: Chr 1 1 2 1 … Start 10430 12410 400 2430 End 10592 12900 8210 2592 Event Loss Loss Gain Loss 9 Sample_ID Syndrome_TypeA_01 Syndrome_TypeA_01 Syndrome_TypeA_01 Syndrome_TypeA_02 Filtering options There are two filtering options in the CNV data uploading section. 1) CNV size filter Users can set their own threshold for minimum size to define the CNVs (unit: bp). A CNV which is smaller than the threshold will be excluded. 2) Mean signal intensity of the segment filter This option will be only used when the input file is TCGA or NimbleScan data. TCGA and NimbleScan data do not have ‘gain or loss’ information but have mean value of segmentation. Therefore, a cut-off criterion is required to define the copy number ‘gain’ or ‘loss’ status. Default value is ±0.3, which means that a CNV segment with mean value < -0.3 will be assigned as ‘loss’ and > 0.3 as ‘gain CNV’. Users can set their own cut-off filter. 10 B) Defining CNVR CNV-Ruler supports three different definitions of CNV Regions (CNVRs): CNVR, RO, and Fragment. They produce similar but slightly different boundaries and each of them has its own advantages and limitations as described in the main text. Method Select one of the following 3 definitions of CNVRs. 1) CNVR (CNV region) 2) RO (Reciprocal Overlap) 3) Fragment 11 1) CNVR (CNV region) CNVR is defined by merging of overlapping CNVs. i. CNVR trimming threshold Definition of CNVR is simple and straightforward, but this definition can overestimate the size and frequency of CNVR due to the potential false calls, which are usually rare and long-sized. CNV-Ruler can trim these extreme ones during merging process by CNV frequencies. In case of the CNVR method, users can trim the sparse area by using the regional density (recurrence) threshold. This option checks the regional density of participating CNVs base-wise and trimming the sparse area not satisfying the given density threshold (default: 0.1). This option does not affect RO nor Fragment method. ii. Additional options for building CNVRs: Gain/Loss separated region Using this option, the CNVR can be created with same types of CNVs, gain or loss type, within the considering area. If you select this option, CNVR outputs will be copy number gain CNVR or loss CNVR. If you don’t select this option, all overlapped CNVs will be used for building CNVR regardless of their type. Ex) Option is off: Gain/Loss option is on: 12 2) Reciprocal overlap (RO) CNV regions are determined by reciprocal overlap (RO) measure. First, CNVs which overlap at least one-base are grouped as initial CNV clusters. Within each cluster, RO is calculated for each CNV to the others. The pair of which RO is highest (default minimum threshold is >50%) will be merged and formed a CNV element (in orange). This process is repeated until every pair has RO of 50% or lower. The detailed process is illustrated in the following figure. CNV1 CNV2 CNV3 CNV4 CNV5 Initial CNV Cluster CNV1 CNV2-3 Step 1 CNV4 CNV5 CNV1 Step 2 CNV2-3-4 CNV5 CNVR1 Final regions CNVR2 CNVR3 In st ep 1, since the pair consisting of CNV2 and CNV3 has the highest RO, these two CNVs are merged into a CNV element called CNV2-3. Similarly, in step 2, CNV2-3 and CNV4 are merged into CNV2-3-4. As the RO values of all the remaining pairs do not pass the RO threshold, three CNV regions are defined (in black). The RO method can reduce the extent of size overestimation of CNV regions caused by CNVR method. However, compared with the other two methods, the RO method may increase the possibility of false negative results. For example, suppose that one locus embedded within CNVR3 (in the final step, figure above) is truly associated with the trait of interest. In both CNVR and fragment methods, the frequency of this locus is 2, but in the RO method, the frequency is 1, which may cause the true association to be statistically missed. 13 3) Fragment The fragment method dissects overlapping regions which have different frequencies of CNVs from the neighboring regions into smaller, separate fragments. CNVs Fragments CNVR1 CNVR2 CNVR3 CNVR4 CNVR5 Therefore, this method has the least probability of size overestimation compared with the other two methods. Also, the potential of false negative results may be lower than the RO method. By dissecting overlapping CNVs into smaller fragments, this method could generate a large number of smaller CNV elements which may increase the possibility of false positive associations as well as the calculation burden. NOTICE: CNV region information is stored in tmp directory and can be used later. You can remove it safely by deleting tmp directory if error is occurred. 14 Examples of CNVR outputs from the same CNV data The list below contains the CNVs in chromosome 1 identified from the 7 samples from Affymetrix Genotype Console. You can download the sample CNV file from our web site (www.ircgp.com/CNVRuler/index.html) Total CNV List Chr 1 1 1 1 1 1 1 1 1 1 1 1 1 1 1 1 1 1 1 1 1 1 1 1 1 1 1 1 1 1 1 1 1 Start 61723 61723 61723 61723 85924 235658 740857 16830808 16968362 17029580 17035208 17036531 17037085 17045446 63704937 82461630 104130168 121343784 121343784 121343784 144036737 145206610 148530424 148530424 148947698 149086173 149086551 166574788 182454823 196706260 196706260 196711067 243163830 End 228694 229063 229607 356530 229607 564621 1030307 16935995 17298496 17245518 17177033 17182425 17182425 17190850 63810371 82644795 104307231 121482967 121482967 121482967 144849544 145398179 148662751 148953984 149051903 149202866 149190306 166966828 182611606 196812518 196812518 196812518 243274530 Type Gain Loss Gain Gain Gain Loss Gain Gain Gain Gain Gain Gain Gain Gain Gain Gain Gain Gain Gain Gain Gain Gain Gain Gain Loss Loss Loss Gain Loss Gain Gain Gain Gain 1) CNVR (Recurrence Threshold is 0.1) Chr 1 1 1 1 1 1 1 1 1 1 1 1 1 1 1 1 Start 61,723 740,857 16,830,808 16,968,362 63,704,937 82,461,630 104,130,168 121,343,784 144,036,737 145,206,610 148,530,424 149,086,173 166,574,788 182,454,823 196,706,260 243,163,830 End 564,621 1,030,307 16,935,995 17,298,496 63,810,371 82,644,795 104,307,231 121,482,967 144,849,544 145,398,179 149,051,903 149,202,866 166,966,828 182,611,606 196,812,518 243,274,530 15 Type Mixed Gain Gain Gain Gain Gain Gain Gain Gain Gain Mixed Loss Gain Loss Gain Gain 2) RO Chr 1 1 1 1 1 1 1 1 1 1 1 1 1 1 1 1 1 1 1 Start 61,723 235,658 740,857 16,830,808 16,968,362 63,704,937 82,461,630 104,130,168 121,343,784 144,036,737 145,206,610 148,530,424 148,530,424 148,947,698 149,086,173 166,574,788 182,454,823 196,706,260 243,163,830 End 356,530 564,621 1,030,307 16,935,995 17,298,496 63,810,371 82,644,795 104,307,231 121,482,967 144,849,544 145,398,179 148,662,751 148,953,984 149,051,903 149,202,866 166,966,828 182,611,606 196,812,518 243,274,530 Type Mixed Loss Gain Gain Gain Gain Gain Gain Gain Gain Gain Gain Gain Loss Loss Gain Loss Gain Gain Start 61,723 85,924 228,695 229,064 229,608 235,658 356,531 740,857 16,830,808 16,968,362 17,029,580 17,035,208 17,036,531 17,037,085 17,045,446 17,177,034 17,182,426 17,190,851 17,245,519 63,704,937 82,461,630 104,130,168 121,343,784 144,036,737 145,206,610 148,530,424 148,662,752 148,947,698 148,953,985 149,086,173 149,086,551 149,190,307 166,574,788 182,454,823 196,706,260 196,711,067 243,163,830 End 85,923 228,694 229,063 229,607 235,657 356,530 564,621 1,030,307 16,935,995 17,029,579 17,035,207 17,036,530 17,037,084 17,045,445 17,177,033 17,182,425 17,190,850 17,245,518 17,298,496 63,810,371 82,644,795 104,307,231 121,482,967 144,849,544 145,398,179 148,662,751 148,947,697 148,953,984 149,051,903 149,086,550 149,190,306 149,202,866 166,966,828 182,611,606 196,711,066 196,812,518 243,274,530 Type Mixed Mixed Mixed Gain Gain Mixed Loss Gain Gain Gain Gain Gain Gain Gain Gain Gain Gain Gain Gain Gain Gain Gain Gain Gain Gain Gain Gain Mixed Loss Loss Loss Loss Gain Loss Gain Gain Gain 3) Fragment Chr 1 1 1 1 1 1 1 1 1 1 1 1 1 1 1 1 1 1 1 1 1 1 1 1 1 1 1 1 1 1 1 1 1 1 1 1 1 16 C) CNVR-Phenotype association analysis Methods A. B. C. D. Logistic regression Linear regression Chi-Squared Fisher’s Exact Test Users select one of the methods above. Regarding the Chi-Squared test, users can select between ‘Chi-Squared test’ or ‘Chi-squared test with Yates’ continuity correction’ based on the characteristics of their data. 17 Additional options for the association analysis 1) LRT CNV Ruler supports -2 Log Likelihood Ratio Test (LRT) and calculates p value of chi-squared distribution of LRT. With this value, user can figure out the regression model used for association analysis is significantly better than null model or not. Currently, this option could be applied to logistic regression only. 2) Population Stratification by PCA Since the association found could be due to the underlying structure of the population and not a disease associated locus, CNV Ruler can use Principal Component Analysis (PCA) to adjust population stratification. CNV Ruler calculates eigen vectors and uses up to 3 principal components as covariates for regression. Currently, this option could be applied to logistic regression only. 3) Separated p-values for Gain/Loss If a region contains both type of CNV – Gain and Loss - CNV Ruler will calculate p-values for statistical test using only gain-type CNVRs or only loss-type ones with this option. 4) Minor allele frequency Default value is 0.05 (5%). This means that CNVRs with less than 5% allele frequency will be excluded from the downstream association analysis. Alternatively, users can set their own threshold. For example, by setting the minor allele threshold to ‘0’, users can observe the association result of all CNVRs regardless of the allele frequency. D) Running After selecting statistical methods and setting allele frequency threshold level, click ‘Run’ key. Then the output of statistical calculation will be displayed in the report screen. 18 Report Screen A. CNVR Report The CNV region determined by user’s preference will be displayed in this window. The same list is also stored as a tab-delimited text file on the same directory. The file name consists of original name and region type. These are example tables for three different type of region CNVR RO Fragment B. Association analysis Report This is the window for the output of the association test. You can sort it by any column by clicking its header. It is also stored as a tab-delimited text file. The detailed option information is written in the header of the file. 19 References Bae, JS. et al. (2010) Genome-wide association analysis of copy number variations in subarachnoid aneurysmal hemorrhage. J. Hum. Genet., 55(11), 726-30 Barnes,C. et al. (2008) A robust statistical method for case-control association testing with copy number variation. Nat. Genet., 40, 1245–1252. Colella,S. et al. (2007) QuantiSNP: an Objective Bayes Hidden-Markov Model to detect and accurately map copy number variation using SNP genotyping data. Nucleic Acids Res., 35, 2013–2025. Forer,L. et al. (2010) CONAN: copy number variation analysis software for genome-wide association studies. BMC Bioinformatic, 11, 318 Joeng, Y. et al. (2008) CGHscape: A Software Framework for the Detection and Visualization of Copy Number Alterations. Genome & Informatics, 6(3), 126-129 Korn,J.M. et al. (2008) Integrated genotype calling and association analysis of SNPs, common copy number polymorphisms and rare CNVs. Nat. Genet., 40, 1253–1260. Pique-Regi,R. et al. (2010) R-Gada: a fast and flexible pipeline for copy number analysis in association studies. BMC Bioinformatics, 11, 380 Purcell,S. et al. (2007) PLINK: a tool set for whole-genome association and population-based linkage analyses. Am. J. Hum. Genet., 81, 559–575. Subirana, I. et al. (2011) CNVassoc: Association analysis of CNV data using R. BMC Medical Genomics, 4:47 The Cancer Genome Atlas (TGCA) research Network (2008) Comprehensive genomic characterization defines human glioblastoma genes and core pathways. Nature, 455,1061–1068. Wang,K. et al. (2007) PennCNV: An integrated hidden Markov model designed for high-resolution copy number variation detection in whole-genome SNP genotyping data. Genome Res., 17, 1665. Wittig, M. et al. (2010) CNVineta: a data mining tool for large case–control copy number variation datasets. Bioinformatics, 26, 2208-2209 20