1
BiX | %Visual Macro
User Manual
%VISUAL MACRO
USAGE GUIDE
Windows/Linux/Unix
BiX Corp.
MAY 2014
BiX | %Visual Macro User Manual | 1/176
BiX | %Visual Macro
User Manual
Trade Marks:
BiX and %VISUAL are trademarks of BiX Corp.
SAS is a trademark of SAS Institute NC, USA.
Excel is a trademark of Microsoft Inc. WA, USA.
Examples used throughout the manual
All screen shots are taken using SAS data sets commonly found in every SAS installation under the SASHELP libname.
(SASHELP.CARS, SASHELP.CLASS, SASHELP.HEART).
“DEMO” version VS “PRO” version
Upon first time installation the macro is preconfigured as “DEMO” version that can display data sets up to 1000 observations.
You can ask for a “trial activation key” the removes the limitation for a 30 days trial period.
Upon purchasing the “PRO” version you will receive an activation key that permanently removes the limitation.
To purchase the “PRO” version please go to:
http://bixforsas.com/?page_id=5442
Prerequisites - Important
%visual macro can be installed on the following platforms:
Windows laptop or desktop
Windows server
Linux server
Unix server (SOLARIS, HPUX, AIX)
Monitor Resolution
High resolution monitor (A minimum of 1024X768 is required. Higher resolution is mostly recommended and will allow more
windows to be shown simultaneously).
SAS Software
SAS 9.2 and above.
Minimum required SAS products: SAS/BASE, SAS/GRAPH.
Java Machine
Must be installed for producing KPI charts.
SAS Fonts
Windows: Must use DMS font: SASFONT Medium 8.
X11 Based systems – please consult the installation guide for setting the correct fonts.
X11 Server (for Unix/Linux systems).
Any X11 server package (Examples: Exceed, Exceed-on-Demand, MOBAXTERM)
Consult BiX technical support for any question regarding setting of %visual to work under your X11 environment.
BiX | %Visual Macro User Manual | 2/176
BiX | %Visual Macro
User Manual
Table of Contents
Activating the Macro ………………………………………………….………………….………………….………………….
4
Basic Concepts ……………………………………………………………………………….………………….………………….
11
Frequency Drill-Down …………………………………………………………………….………………….………………….
18
Univariate Drill-Down …………………………………………………………………….………………….………………….
28
Decomposition Tree …………………………………………………..………………….………………….………………….
34
Drill-Down Performance Tips …………………………………………………………………………………………………
42
Clear All Drill-Downs …………………………………………………..………………….………………….………………….
43
Statistical Info …………………………………………………………….………………….………………….………………….
44
Ad Hoc Reports ………………………………………………………….………………….………………….………………….
49
Ad Hoc Charts …………………………………………………………….………………….………………….………………….
56
Simple Filter ……………………………………………………………….………………….………………….………………….
120
Advanced Filter ………………………………………………………….………………….………………….………………….
123
Selecting Variables …………………………………………………….………………….………………….………………….
146
Conditional Formatting ………………………………………………………………….………………….………………….
153
Sorting Data ………………………………………………………………………………….………………….………………….
162
Jumping to Start/End ……………………………………………………………………………………………………………
614
Moving Columns ..………….………………………………………….………………….………………….………………….
165
Copy Data to Clipboard ………………………………………………………………….………………….………………….
166
Save as SAS Data set ……………………………………………………………………….………………….………………….
168
Column's Properties …………………………………………………..………………….………………….………………….
169
Viewer Properties ………………………………………………………………………….………………….………………….
174
Save as Profile ……………………………………………………………………………….………………….………………….
175
BiX | %Visual Macro User Manual | 3/176
BiX | %Visual Macro
User Manual
Activating the Macro
Overview
Method 1 – Calling the macro from a SAS program
Method 2 – Assigning the macro to a function key
Method 3 – Assign the macro as a default action in the SAS Explorer
Method 4 – Calling the macro from a SAS/AF application
Overview
After installing the macro as described in the installation guide and setting the site parameters you can use the
macro in several methods in your SAS session.
Method 1 – calling the macro from a SAS program
The first method is to insert a call to the macro into your SAS code. This can be done anywhere in the code.
When submitted in interactive environment, the call to the macro will launch the interactive interface displaying
the data set specified as a parameter to the macro.
BiX | %Visual Macro User Manual | 4/176
BiX | %Visual Macro
User Manual
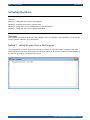
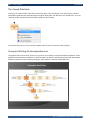
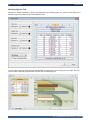
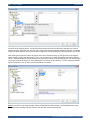
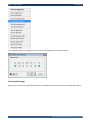
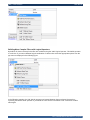
Method 2 – Assigning the macro to a function key
You can assign the macro to a function key as displayed in the following figure:
The syntax for the command is:
gsubmit “%visual();”
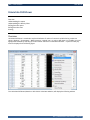
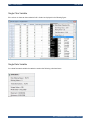
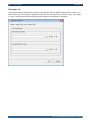
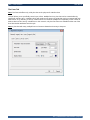
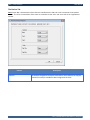
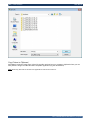
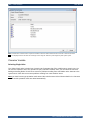
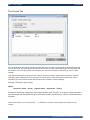
Each macro invocation done without a data set parameter will first activate a preliminary window where you’ll be
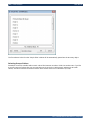
asked to select a data set or a profile:
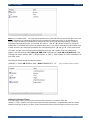
If you want to view more details about the data sets, check the option and scroll the slide bar to the right to
view description (label), last update and number of observations, variables and file size:
BiX | %Visual Macro User Manual | 5/176
BiX | %Visual Macro
User Manual
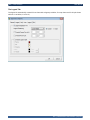
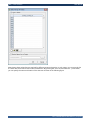
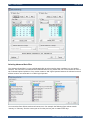
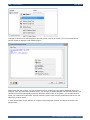
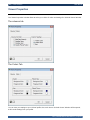
You can also select a predefined profile from your saved list of profiles shown on the second tab:
The profiles consist of a data set name and a list of saved attributes used as a starting point of the data set.
For example, if you always want to view your data with your choice of variables, where clauses and conditional
Formatting, then you can save these settings while in %visual viewer window into a named profile and use it
here to open the data set with these settings implied automatically.
BiX | %Visual Macro User Manual | 6/176
BiX | %Visual Macro
User Manual
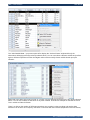
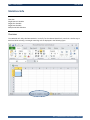
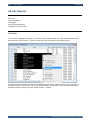
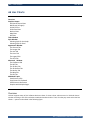
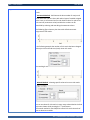
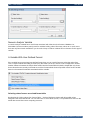
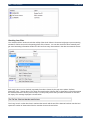
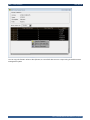
Method 3 – Assign the macro as your default action in the SAS Explorer
Using the third method will replace the standard built-in viewtable() SAS command which is invoked by default
whenever you double click on a SAS data set inside the SAS Explorer window.
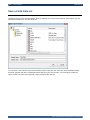
To change the default behavior of SAS Explorer window you need to change some setting in the SAS registry as
described in the following sections:
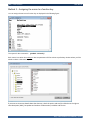
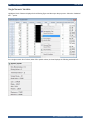
3.1 Invoke the Registry Editor
3.2 Select the “TABLE” node
Expand the SAS_REGISTRY tree as described in the following path:
SAS_REGISTRY CORE EXPLORER MENUS MEMBERS TABLE
BiX | %Visual Macro User Manual | 7/176
BiX | %Visual Macro
User Manual
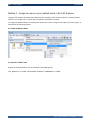
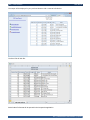
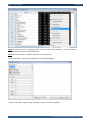
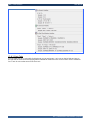
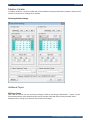
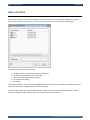
In the right side of the window you can control the default behavior of each option in the pop-menu. We
recommend to change the first option (Open…) which will leave the default behavior (double click) to the
standard SAS viewtable() command. If your SAS environment contains also SAS views then you must repeat the
operations for the “VIEW” node as well.
BiX | %Visual Macro User Manual | 8/176
BiX | %Visual Macro
User Manual
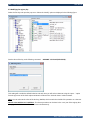
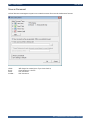
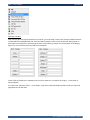
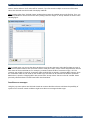
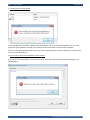
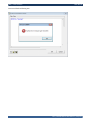
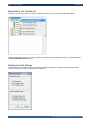
3.3 Modifying the registry key
Select the first key and open the pop-menu. Select the “Modify” option as displayed in the following figure:
Set the value of the key to the following command:
GSUBMIT „%%visual(%8b.%32b);‟
This setting will override the default behavior and each time you will select a data set using the “open…” option
from the pop menu of the SAS explorer window it will launch the “%Visual Viewer” window instead.
Note: You can also set the value of the last key (Default) which controls the double-click operation on a data set.
Note for sites with Server installation: The above procedure can be done in the “root” part of the registry thus
changing the default behavior for all SAS users simultaneously.
BiX | %Visual Macro User Manual | 9/176
BiX | %Visual Macro
User Manual
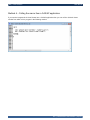
Method 4 – Calling the macro from a SAS/AF application
If you need to integrate the %Visual Viewer into a SAS/AF application then you can call the %Visual Viewer
window from within a SCL program in the following method:
BiX | %Visual Macro User Manual | 10/176
BiX | %Visual Macro
User Manual
Basic Concepts
Overview
Selecting (Highlighting) Data Methods
Selecting specific variables (columns)
Selecting specific observations (rows)
Selecting a block of data
Selecting the entire table
Using the Pop menu
Overview
All operations done in %Visual Viewer window are initiated by highlighting a block of data needed for the
operation to follow. For example, in order to create a chart, first highlight the data block needed for the chart and
then by using the pop menu select the "Ad Hoc Charts..." option which will open the "%Visual Chart Editor"
wizard that will guide you through the rest of the steps to complete the definition of the chart.
Selecting (Highlighting) Data Methods
You can select data in %Visual Viewer window in many ways. Data must be adjacent in a contiguous block.
Select by clicking the left mouse button on the selected column or area. This action will highlight your selected
area in a black background color as described in the following figures:
Selecting specific variables (columns)
This column selection is done by left button clicking and dragging the mouse over the column's headings.
Tip: If the variables needed for your selection are not adjacent, you can use the "Select Variable..." windows or the "Move
Column" option to organize them in a specific adjacent block.
BiX | %Visual Macro User Manual | 11/176
BiX | %Visual Macro
User Manual
Selecting specific observations (rows)
This rows selection is done by left clicking on the rows numbers (The most left column) and dragging the mouse
over the rows numbers.
Tip: If you need specific observations to be selected, use the "Simple filter" or the "Advanced Filter" option from the pop menu
which allow you to view only the observations that meets your needs.
BiX | %Visual Macro User Manual | 12/176
BiX | %Visual Macro
User Manual
Selecting a block of data
This block selection is done by pointing the mouse on the top left cell and dragging the mouse over the desired
block down to the right bottom cell.
Selecting the entire table
This selection is done by pointing and left-click on the top left cell and then dragging the mouse into the table
area while the left mouse button is still pressed.
BiX | %Visual Macro User Manual | 13/176
BiX | %Visual Macro
User Manual
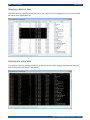
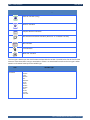
Using the Pop menu
Before (or after) highlighting a block of data you can always invoke the pop menu by right-clicking the mouse.
Options available in the pop menu varies according to selected area in the table and by the type of selected
variable (Numeric or Char). For example, the "Univariate Drill-Down..." option is only available for numeric
variables and for a selected block of entire single variable (one full column).
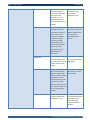
Option
Description
Remarks
Frequency Drill Down
Shows a frequency
analysis of values within
the selected column in a
graphical dynamic
interface which lets you
continue with data
exploration by selecting
slice(s) or row(s) for
further drill downs.
Only available for a
single complete column
highlighting. Mostly
suitable for nominal
discrete values
(Character or Numeric
type).
Univariate Drill Down
Shows a univariate
analysis of values within
the selected column in a
graphical dynamic
interface which lets you
continue with data
exploration by selecting
bars(s) or row(s) for
further drill downs.
Only available for a
single complete column
highlighting. Mostly
suitable for continuous
values (Numeric type
only).
Decomposition Tree
Shows in graphical
diagram the complete
drill path to the current
state of displayed data.
Clear All Drill Downs
Clear all drill downs and
exit all drill down
windows back.
Statistical Info
Shows statistics for any
type of rectangle
selected. Similar (but
more robust) to Excel
“Sum” & “Count” values
shown at the bottom
when selecting cells in a
spreadsheet. Results may
vary according to the type
of variables selected
inside the rectangle.
A quick way of getting
statistical info without
writing any piece of SAS
Code.
BiX | %Visual Macro User Manual | 14/176
BiX | %Visual Macro
User Manual
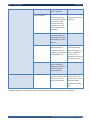
Ad hoc Report
Sends the data inside the
selected rectangle to
%Visual reporting utility.
The report can be
exported into many
different file formats:
Html, Excel2010 (xlsx), rtf,
and pdf.
Automatic generation
mechanism can be
implied when
producing reports.
Ad hoc Chart
Sends the selected
rectangle to “%Visual
Chart Editor” which can
create various charts
based on the selected
variables and values
inside the rectangle.
Charts can be sent to
%Visual reporting utility
where they can be
integrated into many
different types of
documents.
Many business charts
like: Bar, Pie, Map, Plot,
Barline and KPI can be
created with no
knowledge of SAS
syntax.
Simple Filter
A very quick and straight
forward method to filter
your data. Similar to Excel
popular “Column Filter”
method.
Only available for a
single complete column
highlighting.
Advanced Filter
Fully featured utility to
filter the data based on
simple to complex logic
“Where” clauses. Intuitive
GUI guides you in the
process and lets you also
integrate user written
“Where” clauses into the
filter. Macro variables can
be also integrated into
the filter.
Tip: Try the “Advanced
Date Filter” on a date
type variable…
Clear All Filters
Removes all filters
(Simple and Advanced)
implied on the data.
Filtered data is shown
in a specific background
color which can be
selected through
“Viewer Properties”
window.
BiX | %Visual Macro User Manual | 15/176
BiX | %Visual Macro
User Manual
Select Variables
If your data contains
many variables, you can
select those of interest
and arrange them in your
desired order of display.
You can also “Freeze”
variables while scrolling
left and right in the
viewer.
Conditional Formatting
Highlights the data using
color schema based on
dynamic statistical
analysis. When reporting
to Excel, uses Excel
symbols for conditional
formatting. Can be used
as an executive
dashboard. Different
conditional formatting
can be implied
simultaneously on
different variables.
Only available for a
single complete column
highlighting.
Clear All Conditions
Removes all Conditional
Formatting colors from all
variables.
Sort
Sorts the data according
to the selected column(s).
“Nodupkey” method can
remove duplicate
observations while
sorting.
Clear All Sorting
Remove All sorting
condition from all
variables.
Go to First Observation
Quick method to display
the first observation of
data.
Go to Last Observation
Quick method to display
the last observation of
data without the need to
scroll down repeatedly.
May take longer on first
time.
Move Column
Enables to rearrange
columns in a specific order.
You may alternatively use
the “Select Variables…”
option.
Mostly used when
variables needed for
chart, sort or reports
are not adjacent.
The underlying data is
not affected and you
can sort data even
without “write”
permission on the data.
BiX | %Visual Macro User Manual | 16/176
BiX | %Visual Macro
User Manual
Paste Column After
Completes the “Move
column” operation.
Copy to Clipboard
Copies the data inside the
selected rectangle into
the Computer’s clipboard.
You can then quickly
paste the data using
standard “Ctrl-V” into
many popular Windows
applications.
Save as SAS Data set
Save the data inside the
selected rectangle as a
new SAS data set in your
selected library and data
set name.
Column Properties
Shows SAS and %Visual
Meta-Data about the
column. Also allows to
temporarily replacing the
attached SAS format.
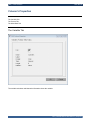
Viewer Properties
Opens a window where
you can set general
properties of the viewer
like colors, order of
variable and more.
Save as Profile
Saves all settings selected
in %Visual Viewer window
session for future use
with the same data set.
Variables names always
form the first line in the
clipboard.
Changing the format is
useful when drilling
down, for example, on
a date variable when
you want to view
distribution of values by
year and not by day.
The Profile can be used
to restart at the same
position (where clauses,
selected variables,
Conditional formatting
etc.)
A detailed explanation of each option shown at the above pop menu follows in the next coming pages.
BiX | %Visual Macro User Manual | 17/176
BiX | %Visual Macro
User Manual
Frequency Drill-Down
Overview
Understanding the report
Understanding the Pie Chart
Understanding the Bar Chart
Drilling from the report
Drilling from charts
Selecting Sum Variable
Printing
Saving as SAS data set
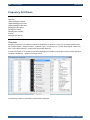
Overview
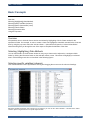
Frequency Drill-Down is a method to explore the distribution of values of a numeric or character variable with a
set of ordinal values. (“Payment Status”, “Customer Type”, “Credit Date” etc.) Usually these kind of variable will
have a user-defined format or a date format associated with them.
In order to drill-down on a variable you must first highlight that variable by selecting its column header and select
"Frequency Drill-Down..." option from the pop menu:
The following "Frequency Drill-Down" window will be displayed:
BiX | %Visual Macro User Manual | 18/176
BiX | %Visual Macro
User Manual
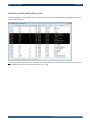
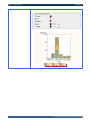
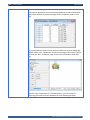
The "Frequency Drill-Down" window shows Frequency statistics computed "on the fly" for the selected variable
both in an interactive report and in an interactive graphic format. There is no need to make any preparations in
the data set in order to do a drill-down on any variable. Frequency drill-down can be done on both numeric and
char variables. One of the main advantages of the %Visual drill-down windows is that they allow you to continue
with interactive drilling on any value(s) and variable(s) as will be described in the following sections.
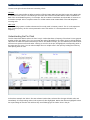
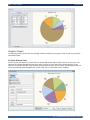
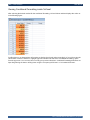
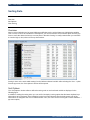
Understanding the report
The bottom part of the window shows a report with all distinct values found while scanning the variable. If the
variable has an associated format, then the internal unformatted value is shown on the left most column and
followed by the formatted value (The description column). If there is no format, then both columns shows the
same value. Next comes the column (N) which shows the count value of each specific value. The rest of the
columns shows percentages of each values, accumulated count and percentages. By default, the report is
sorted by descending count showing at the top row the value with the highest count value. You can use the pop
menu of the report to sort it in other ways, for example by its value rather than (N), if for example, you want to
find a specific value in a long list. Sorting the report recalculates the accumulated statistics.
BiX | %Visual Macro User Manual | 19/176
BiX | %Visual Macro
User Manual
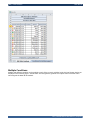
The two most right columns shows two interesting values:
%Pareto
The Pareto rule (named after an Italian researcher Vilfredo Pareto 1848-1923 and also known as the 80/20 rule)
is calculated in this column. Thus allowing to see where 20% of the accumulated distinct values contributes to
80% of the accumulated frequency. For example, 20% of customers contributes more than 80% of revenues, or
as another example: 20% of complain reasons in a CRM contact center creates 80% of the total telephone
incoming calls.
ABC Code
The ABC coding system is similar to Pareto and it is mostly used in inventory control. The "A" code represents
80% of total frequency, the "B" code represents the next 15% and the "C" code represents the last 5% of
frequency.
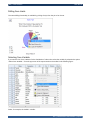
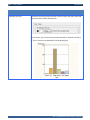
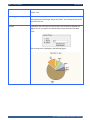
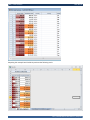
Understanding the Pie Chart
The Pie chart shows distinct values as slices in a pie. Values that have a frequency of less than 5% are grouped
together to form the "Other" slice. You can control the value of threshold for the "Other" slice by picking different
value from the radio-box located inside the pie area. If slice labels overlaps, you can rotate the pie so slice labels
will have more space one from the other. Clicking on one slice in the pie, will highlight its corresponding value in
the report and vice versa. You can select multiple slices or multiple rows in the report by holding the CTRL key
while picking slices or rows.
In the above example, the "Other" slice was selected (notice that a selected slice changes its label color) and
immediately, all corresponding values in the report were also highlighted. Notice that all those highlighted values
has a percentage of less than 5% and thus they are all belonging to the "Other" slice in the pie.
BiX | %Visual Macro User Manual | 20/176
BiX | %Visual Macro
User Manual
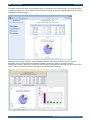
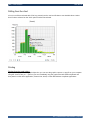
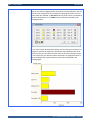
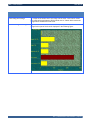
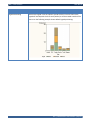
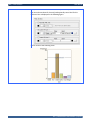
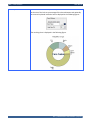
Understanding the Bar Chart
The bar chart shows all distinct values as an interactive bar chart. Values selected in the report or pie highlights
bars in the Pareto chart and vice versa.
You can use the radio-box selector to control which values are displayed according to the ABC scheme.
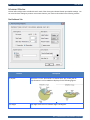
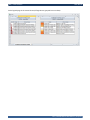
Drilling from the report
The most amazing feature of the Drill-Down windows of %Visual is that they allow further drilling on any value(s)
to view the detailed observations forming those values. Select (highlight) a value (or group of values with the use
of the CTRL key) and open the pop menu as displayed in the following figure:
BiX | %Visual Macro User Manual | 21/176
BiX | %Visual Macro
User Manual
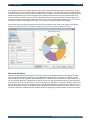
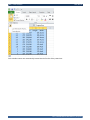
The "View Detailed Data..." pop menu option will re-display the "%Visual Viewer" window with only the
observations belonging to those previously selected values. You can now select a different variable and perform
again a drill-down operation to further investigate values of the secondly chosen variable based upon prior
selection:
Notice that in the above figure only "Honda" or "Toyota" cars are displayed according to the two values selected
before. You can now continue to drill-down on any other variable. In the above example we selected the "Drive
Train" variable to further drill-down.
There is no limit on the number of drill-down operations one can take in order to explore and analyze data.
Drill-down can be done as a frequency drill-down or univariate drill-down method (Explained in the next section).
BiX | %Visual Macro User Manual | 22/176
BiX | %Visual Macro
User Manual
Drilling from charts
The same drilling functionality is available by picking slice(s) from the pie or bar charts.
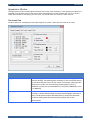
Selecting Sum Variable
If you want to view "Sum" statistics for the distribution of values then select the variable by selection the option
"Select Sum Variable..." from the pop menu of the report section as described in the following figure:
Select, for example, the "MSRP" variable:
BiX | %Visual Macro User Manual | 23/176
BiX | %Visual Macro
User Manual
The report and chart will display summary statistics for the selected sum variable.
Note: The following Frequency drill downs will keep displaying the sum value until you clear that selection.
Note: The above window shows variables organized into hierarchies. This feature requires BiX Meta-Data Server
license (Not included with %visual macro).
Printing
Printing from the graph object
If you open the pop menu of a graph object (Pie or Pareto) then you can save the graphic output to a *.png file
on your computer using the "Save Picture As..." option or you can immediately copy the graph to the MS Window
clipboard and then paste it to other office application ( Power Point, Word) or other MS Windows compliant
applications.
Printing from the report object
Saving the report as Document will allow the use of %Visual document management system:
BiX | %Visual Macro User Manual | 24/176
BiX | %Visual Macro
User Manual
%Visual document management system allow to select up to 4 types of documents that can be produced
simultaneously:
BiX | %Visual Macro User Manual | 25/176
BiX | %Visual Macro
User Manual
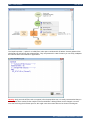
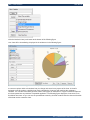
The output will be shown within your preferred browser as displayed in the following figure. The HTML document
is shown by default, and you can switch to other types of documents by pointing to the appropriate link on the left
contents part of the web page.
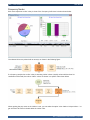
Depending of the type of document, %Visual will place both the report and the graph from the Frequency
Drill-Down window as displayed in the following Excel2010 document created by %Visual document
management system. If the report is a long one, then the graph will be placed on the right side of the sheet. If the
report is a short one (several rows) then the graph will be placed below the report.
BiX | %Visual Macro User Manual | 26/176
BiX | %Visual Macro
User Manual
Saving as SAS Data set
Saves the data of the analysis (The report part of the window) as a newly created SAS data set, thus allowing
you to continue manipulating the data.
BiX | %Visual Macro User Manual | 27/176
BiX | %Visual Macro
User Manual
Univariate Drill-Down
Overview
Understanding the report
Understanding the density Chart
Drilling from the report
Drilling from the chart
Printing
Overview
Univariate Drill-Down is a method to explore distribution of values of a numeric variable having continuous
values. (“Budget”, “Temperature”, “Blood pressure”,” Weight” etc.). In order to drill-down on a variable you must
highlight that variable by selecting its column header and select "Univariate Drill-Down..." option from the pop
menu as displayed in the following figure:
The Univariate Drill Down (Based on SAS PROC Univariate statistics) will display the following window:
BiX | %Visual Macro User Manual | 28/176
BiX | %Visual Macro
User Manual
Understanding the report
The left side of the window consist of two sub reports. The upper report is a static report which displays a set of
commonly used statistical measures calculated on the variable current values. The lower report is a dynamic
interactive report which displays percentiles calculation. Rows of this report can be selected for further
drill-down.
BiX | %Visual Macro User Manual | 29/176
BiX | %Visual Macro
User Manual
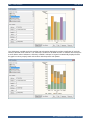
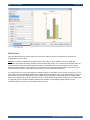
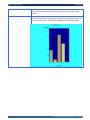
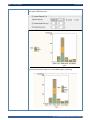
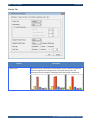
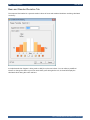
Understanding the Density Chart
The density chart displays the range of values from the lowest to highest divided by 4,8 or 16 equally
sub-sections. The bar value represents the amount of values within these ranges. You can quickly see were
values are concentrated and if the distribution of values is of normal form.
You can select the "Info" options which will cause a little tool tip to be open whenever you select a bar from the
chart as shown in the following figure:
BiX | %Visual Macro User Manual | 30/176
BiX | %Visual Macro
User Manual
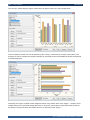
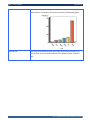
Drilling from the report
The lower report can be used to interactively select the desired sub-sections of percentiles and to drill-down to
see those detailed rows. In the following figure we have selected the middle range of values between the 25%
percentile to the 75% percentile. Drilling-Down to view detailed data will display only those selected values. You
can select multiple rows by using the CTRL key.
BiX | %Visual Macro User Manual | 31/176
BiX | %Visual Macro
User Manual
Drilling from the chart
A bar (or set of bars selected with CTRL key pressed) can be used to drill-down to see detailed values. Notice
that in order to select a bar the "Pick" option must be first selected.
Printing
Printing from the graph object
If you open the pop menu of a graph object then you can save the graphic output to a *.png file on your computer
using the "Save Picture As..." option or you can immediately copy the graph to the MS Window clipboard and
then paste it to other office application ( Power Point, Word) or other MS Windows compliant applications.
BiX | %Visual Macro User Manual | 32/176
BiX | %Visual Macro
User Manual
Printing from the report object
Saving the report as Document will allow the use of %Visual document management system:
BiX | %Visual Macro User Manual | 33/176
BiX | %Visual Macro
User Manual
Decomposition Tree
Overview
The Root Node
The Filter Node
Frequency Nodes
Univariate Nodes
The Viewed Data Node
Saving and Printing the Decomposition tree
Changing Attributes
Overview
The "Drill Path Decomposition Tree" window shows in a unique graphical layout the complete drill path of both
the frequency and univariate drill-down selections along with all possible values which were not selected. The
initial Filter code applied to the %Visual Viewer window is also shown. The final SAS "Where" statement can be
accessed and copied to other windows or SAS programs.
The decomposition tree is a dynamic view created "on the fly" from your drill-down selections. The tree is
composed of "Nodes" representing the values revealed in the drill-down process. Values selected in each step
are pointed by arrows. Text label on the left side of each row indicates the drill level and the name of the variable
selected for that level. The text on the right side lists statistics about total observations and selected
observations in each step. Nodes in the diagram have pop menu actions attached to.
BiX | %Visual Macro User Manual | 34/176
BiX | %Visual Macro
User Manual
The Root Node
The root node indicates the data set selected for the analysis. clicking on the root node opens a pop menu with
the following options:
Clicking on the "Node Properties..." options opens the "Data Set Properties".
The Filter Node
If a filter (Simple and/or Advanced one) is assigned to the data prior to starting the drill-down process, then a
special node will be inserted after the Data node, where you can pop a menu to view these filter as shown in the
following example where prior to starting to explore values, the user has decided to select patients above age 35
(using the "Advanced filter window" ) and use simple filter to select patients with blood pressure equals "Normal".
When you start to drill-down on that filtered data set, the decomposition tree will show a separate "Initial Filter"
node as displayed in the following Figure:
BiX | %Visual Macro User Manual | 35/176
BiX | %Visual Macro
User Manual
The "Node Properties..." option for a "Initial Filter" node opens a window with all "Where" clauses gathered from
simple filters as well as from the Advanced filter. They are presented in a text format so you can easily cut&paste
the code into other SAS windows or applications.
Warning: Only one node of Filter code can appear in the decomposition tree. It is mostly recommended that you
define all your filters needed for the analysis in the first initial filter. Although filters can be changed or receive
more clauses during the drill-down process, this might cause inaccurate values to be shown in the diagram.
BiX | %Visual Macro User Manual | 36/176
BiX | %Visual Macro
User Manual
Frequency Nodes
Each node represents a slice in the pie chart of the "Frequency Drill-Down" window shown below:
The selected slices are pointed with an arrow(s) as shown in the following figure:
If a frequency analysis has a slice in the pie denoting "Other" values (Usually values with less than 5%
contribution of the total), then those "Other" values are shown in a specific node shown below:
When opening the pop menu on the "Others" node, you can select the option "View "Others" Unique Values..." to
get a full list of all values included within the "Other" slice.
BiX | %Visual Macro User Manual | 37/176
BiX | %Visual Macro
User Manual
Which shows a window listing all detailed values belonging to the "Others" slice:
BiX | %Visual Macro User Manual | 38/176
BiX | %Visual Macro
User Manual
Univariate Nodes
Univariate drill down can be done by selecting column(s) from the density chart or by selecting percentiles from
the table. In each method you get a row of nodes representing all possible values and those selected by you to
further drill-down.
The example above shows a drill-down selection made on three out of eight columns presented in the density
graph as shown in the following figure:
BiX | %Visual Macro User Manual | 39/176
BiX | %Visual Macro
User Manual
The Viewed Data Node
clicking on the "Viewed Data" node allow to select the option "View Full Where Code" which opens a window
with all filters applied to this drill-down analysis: both the initial static one defined by the "Simple Filter" or by the
"Advanced Filter" window and also the filters implied from the drill path.
From the window you can cut or save the complete code for future use by other SAS programs.
Saving and Printing the Decomposition tree
The graphic layout can be easily saved to a *.png file on your system or copied into Windows clipboard. These
graphs are best suited for presentation for decision makers as shown in the following Power Point presentation
example. Possible uses are analyzing campaigns, Risk portfolios, Customer segmentation etc.
BiX | %Visual Macro User Manual | 40/176
BiX | %Visual Macro
User Manual
Changing Attributes
Some default colors of the Decomposition Tree can be modified and saved for future use by selecting the
"Viewer Attributes..." options of the pop menu as shown in the following figure:
BiX | %Visual Macro User Manual | 41/176
BiX | %Visual Macro
User Manual
Drill-Down Performance Tips
The performance of the drill-down mechanism in %Visual is dependent upon the following factors:
1. Number of observations and variables in the data set
Use data sets with the minimal required set of variables and observations. If possible, subset the data set prior to
exploring its contents with %Visual Drill-Down mechanism.
2. Libname Engine
For data sets with millions of observations, SAS/Base SPDE engine will deliver better performance than the
standard V9 Engine. Tip: Do not use compressed data sets. For large tables stored in External RDBMS
accessed via SAS/Access engine, BiX Corp. recommends copying its contents to SAS SPDE data sets prior to
exploring them with %Visual drill-down.
3. Physical Ram
Windows and Linux caches file blocks in memory. The first time you perform a drill-down on a data set it will take
longer than consecutive drill-downs. Make sure your workstation or server is equipped with adequate amount of
installed memory.
Real world example:
A Drill-down on a SAS V9 data set with 10M observations and 50 variables (a 5GB file) took (first time) 1:15
minutes and less than 2 seconds on consecutive drill-downs! (4 Core and 8 GB windows 7 Intel i7 box).
4. Disk Storage
Store your data sets on a modern disk array storage device which spreads the files amongst many disk drives
and spindles.
Consider using RAM disk software or SSD drive to store your most frequently used data sets as well as the
SASWORK libname path.
5. CPU/Cores
Use as many cpu/cores as possible since SAS and %Visual are multi-threaded.
For more detailed discussion of SAS tuning tips please refer to SAS documentation.
BiX | %Visual Macro User Manual | 42/176
BiX | %Visual Macro
User Manual
Clear All Drill-Downs
Clearing all drill-downs will close all drill-down windows selected along the drill path and will automatically return
you to your SAS window. Alternatively, you can close each drill-down window and return one step back in the
drill path.
BiX | %Visual Macro User Manual | 43/176
BiX | %Visual Macro
User Manual
Statistical Info
Overview
Single Numeric Variable
Single Char Variable
Single Data Variable
Multiple Variable Selection
Overview
The statistical Info utility calculates statistics “on the fly” for the selected data block. It works in a similar way to
MS Excel while selecting a rectangle containing cells as displayed in the following figure:
BiX | %Visual Macro User Manual | 44/176
BiX | %Visual Macro
User Manual
Single Numeric Variable
Highlight a block of data as displayed in the following figure and then open the pop menu. Select the “Statistical
Info…” option.
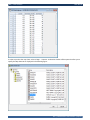
For a single numeric list of values (either full or partial column) %Visual displays the following statistical info:
BiX | %Visual Macro User Manual | 45/176
BiX | %Visual Macro
User Manual
Single Char Variable
If the column is character then statistical info is limited as displayed in the following figure:
Single Date Variable
For a Date formatted variable the statistics contains the following calculated items:
BiX | %Visual Macro User Manual | 46/176
BiX | %Visual Macro
User Manual
Multiple Variables Selection
A rectangle of data can also be selected for statistical info as displayed in the following figure:
When selecting multiple variables, %Visual calculates and shows a combination of statistical analysis derived
from SAS PROC FREQ and PROM MEANS as displayed in the following figure:
BiX | %Visual Macro User Manual | 47/176
BiX | %Visual Macro
User Manual
You can print the contents of the above window into %Visual document management system using the pop
menu.
BiX | %Visual Macro User Manual | 48/176
BiX | %Visual Macro
User Manual
Ad Hoc Reports
Overview
Save as Document
setting Style
Auto Copying Documents
Changes for Unix/Linux sites
Overview
You can select (highlight) any region in a "%Visual Viewer" window (using one of the selection methods) and
then select the "Ad-hoc Report..." option from the pop menu as displayed in the following figure:
All variables and observations included in the highlighted region will be available for the report. If you need to
previously subset or sort the data, you can set a Filter using the "Simple Filter" and/or the "Advanced Filter"
windows and select columns using the "Select Variable..." window.
BiX | %Visual Macro User Manual | 49/176
BiX | %Visual Macro
User Manual
Save as Document
%Visual Document management system can create documents from several simultaneous formats:
HTML Excel WordAcrobat -
Will always be created (even if you don't check it)
Excel 2010 true *.xlsx file
RTF document
PDF document
BiX | %Visual Macro User Manual | 50/176
BiX | %Visual Macro
User Manual
The output will be displayed in your preferred browser with a contents left side bar:
The Excel file will look like:
And all other file formats will be opened in their respective application.
BiX | %Visual Macro User Manual | 51/176
BiX | %Visual Macro
User Manual
Setting Style
%Visual Styles affects the output created for Excel, HTML, PDF and Word documents. %Visual has a set of 5
predefined styles and an additional set of 5 personal styles which can be customized. The "Styles Editor" window
shows on the right side a preview of the style. You can only change colors for the 5 personal styles.
Auto Copying Documents
%Visual temporarily stores the documents in a subdirectory created under the SASWORK Libname. You can set
%Visual to automatically copy the documents to a permanent directory in your system. (This directory can also
be mounted to your web server, thus immediately updating the information stored within a web portal)
Each submission of a report creates a set of files (HTML files, xlsx files, gif files etc.) and all of these files are
stored in a directory that can be prefixed with a string defined in the above window.
BiX | %Visual Macro User Manual | 52/176
BiX | %Visual Macro
User Manual
Changes for Unix/Linux sites:
When running %VISUAL in a Unix/Linux environment, usually you will not be able to launch your preferred
internet browser from your SAS session. The GUI for these systems offers a way to automatically send the
documents to your preferred list of email addresses (which your own email address can be one of them) and
then open the document from your email box.
If your site has a shared file system between the Unix/Linux box and the Windows server (by means of physically
sharing which several hardware vendors can offer or by means of software installation like Samba), then you can
also use the second method of copying the documents to your selected folder on the Windows server.
After the completion of the reports you’ll be presented with a confirmation window that tells you where your reports
were sent to. (You can use both methods simultaneously).
To select Email recipients, check the option as displayed in the above figure and then push the … pushbutton.
You’ll be presented with the following window:
BiX | %Visual Macro User Manual | 53/176
BiX | %Visual Macro
User Manual
On the left side of the window you can view all your email recipients. To add an email recipient, right click the
mouse and select “New Email Recipient…” option. Fill the details in the small window as displayed in the following
figure:
You can also import your recipients from a SAS data set with the following characteristics:
Data set name must be: “SASUSER.RECIPIENTS”
A character variable named “recipient” with length of 50.
A character variable named “email” with length of 256.
Tip: you can export your common email connections from your email application and import it with a simple SAS
program into a data set with the same characteristics as needed by %visual.
BiX | %Visual Macro User Manual | 54/176
BiX | %Visual Macro
User Manual
After inserting or importing your email recipients, you can select any one of them (or more) to form a group of
recipients. The group can be saved under a name of your choice and be reused for future reports.
Upon running the report, all Email recipients will receive an Email message with the report attached as a Zip file.
Extracting the Zip file will create all the underlying files that creates the report (Html files, Gif files and all other file
formats selected for the report).
BiX | %Visual Macro User Manual | 55/176
BiX | %Visual Macro
User Manual
Ad Hoc Charts
Overview
Graphics Output
PIE Chart & Donut Chart
BAR Charts (All types)
2D PLOT Chart
3D Surface Chart
BarLine Chart
Map Chart
KPI Chart
Titles Window
Style Window
Selecting Style for the Graph
Selecting Style for Excel
Appearance Window
The General Tab
The Images Tab
The Axis Tab
The Lines Tab
The Legend Tab
The Grid Tab
Advanced Window
The Pie/Donut Tab
The Bar Tab
The 2D Plot Tab
The 3D Surface Tab
The Barline Tab
The Map Tab
The KPI Tab
Additional Topics
Save Picture to File
Copy Picture To Clipboard
Save Picture as Document
Graphics with Multiple Pages
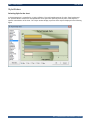
Overview
%Visual supports many of SAS software business charts. To draw a chart, select an area in "%Visual Viewer"
window according to one of the selections methods described earlier. Then, from the pop menu select "Ad Hoc
Charts..." options as described in the following figure:
BiX | %Visual Macro User Manual | 56/176
BiX | %Visual Macro
User Manual
Note1: If columns are not in a contiguous block, you can use the "Select Variables..." or "Move Columns..."
options to arrange columns in the desired order.
Note2: Maximum number of selected variables cannot exceeds 20.
"Visual Chart Editor" window will be displayed as in the following figure:
“%Visual chart editor” supports many chart types common for business graphics:
BiX | %Visual Macro User Manual | 57/176
BiX | %Visual Macro
User Manual
Matching Variables
After selecting the chart type that best suit your needs, you must assign "roles" to the selected variable that were
included within the highlighted block of data. The "Match Variable" section of the window will display labels on
push buttons according to the selected type of chart. In the following example, the push buttons are displaying
options for a Pie Chart and for a Bar Chart as an examples:
Matching Options for a Pie Chart
Matching Options for a Bar Chart
Some of the push buttons are mandatory and some are optional. For example, the "Pages..." push button is
always optional.
For a Pie Chart, select the "Slices..." push button. A pop menu with all available variables will let you select the
appropriate one for the chart:
BiX | %Visual Macro User Manual | 58/176
BiX | %Visual Macro
User Manual
Click the "Refresh Chart" push button at the bottom of the following figure:
Your chart will be immediately(*) displayed in the window as in the following figure:
(*) On first time, SAS initialize the graphic module so it may take a while until the chart will be produced.
A numerous options within sub-windows lets you change and control every aspect of the chart. %Visual is
designed to quickly produce a default chart just by selecting the chart type and matching the mandatory
variables. You can also immediately print the chart to many types of documents or copy it to Windows clipboard
to be later pasted into any Windows compatible application. The following figure display the chart saved as an
Excel2010 document. As you can see, the spreadsheet created by %Visual contains both the chart and the table
of the data used to create the chart.
BiX | %Visual Macro User Manual | 59/176
BiX | %Visual Macro
User Manual
Graphics Output
The following section will describe the matching variables needed by every type of chart in order to produce the
initial default chart:
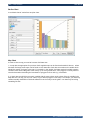
Pie Chart & Donut Chart
For the "slices" push button you should select a variable with distinct values (either numeric or character). The
values of this variable will determine the slices of the pie chart. In many cases, this variable will have a user
defined format associated with. If the variable has many distinct values, then all values contributing less than 5%
will be automatically grouped together into "Other" slice. (This 5% threshold can be modified).
BiX | %Visual Macro User Manual | 60/176
BiX | %Visual Macro
User Manual
If no analysis variable was selected, then the size of each slice represents the number of observations in each
slice (frequency). In this case the "Statistics" push button is optional. If you select an Analysis variable (Must be
a numeric one), then you must also select a Statistics (Sum or Mean). The size of each slice then represents the
statistics calculated for each slice as displayed in the example above where each slice represents the mean
value of "Weight" of cars for every type of car. By default, slices are ordered clockwise from the largest to the
smallest one. (the first slice starts at angle 90). One can see in the example above that the group of "SUV" cars
is having the largest mean weight while "Hybrid" cars group is having the smallest mean weight.
Donut charts have the same characteristics as Pie charts except the extra "Hole" in the middle. Text can be
inserted into this hole and also its relative diameter can be set using advance options of %Visual.
Data source: sashelp.cars
Bar Charts (All Types)
%Visual can generate numerous types of bar charts: vertical or horizontal and plane or 3D shaded bar charts.
The minimum requirement for a bar chart is the "MidPoint" variable which is a numeric or character variable
which usually have a set of distinct values. MidPoints can be either on the horizontal axis or the vertical axis. If
you only select a "MidPoint" variable then the size of the bar can only represent the frequency (Same behavior
as the "Slices" in pie and donut charts). If, on the other hand, you will select an "Analysis" variable, (which must
be a numeric one) then the size (height) of the bar represents the statistics computed on this variable for each
bar. Bar charts does not have an automatic "Other" grouping of small values as pie and donut charts do. Thus, if
you have a "MidPoint" variable with many distinct values you might get a cluttered display of many narrow bars.
BiX | %Visual Macro User Manual | 61/176
BiX | %Visual Macro
User Manual
The "SubGroups" variable can divide each bar into sub-section displaying the relative contribution of each sub
section to the total value of the bar. The "SubGroup" variable can be either numeric or character and usually has
a set of distinct values. Whenever a SubGroup variable is selected, a Legend is automatically displayed inside
the graph in order to properly match sub-sections with the specific color pattern.
BiX | %Visual Macro User Manual | 62/176
BiX | %Visual Macro
User Manual
The "Groups" variable displays groups of bars based on distinct values as in the example below:
A second analysis variable can also be selected (In this case you cannot use the "Groups" push button). This
technique is used to compare two analysis variables for each distinct value of the MidPoint variable as displayed
in the following figure:
And finally, the "Pages" variable creates multiple charts for every distinct value of the "Pages..." variable, These
multiple charts can be accessed through the "Next" or "Previous" push buttons located at the lower left side of
the window. These push button are hidden if there is no selection for the "Pages...".
BiX | %Visual Macro User Manual | 63/176
BiX | %Visual Macro
User Manual
2D Plot Chart
Plots are different from Pie or Bar charts since they don't make any previous calculations on data prior to
displaying the data in a chart.
Note: Pie and Bar first summarize the data based on the values of Slice, MidPoint, Group or SubGroup
categories and creates the chart according to these summarized values. You can think of Pie and Bar charts as
if you would first invoke SAS PROC Means to create a summarized data set and only then a chart is drawn
based upon these values. On the contrary, If you would have to chart these detailed values in Excel, then you
would first had to create a "Pivot Table" and only then you could create the Excel chart.
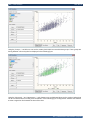
For a 2D plot chart, You need to supply two variables (numeric or character) for the "X Axis" and for the "Y Axis"
push buttons. Each combination of these two variables values is displayed in the chart. No calculation is done on
these values and they are all displayed as in the following example where 5,209 observations of sashelp.heart
data set are displayed in the chart. This kind of chart is usually called "Scatter Plot". Scatter plot are mainly used
to graphically view a possible correlation between two variables. The following example implies a linear
correlation between "Systolic" and "Diastolic" blood pressure.
BiX | %Visual Macro User Manual | 64/176
BiX | %Visual Macro
User Manual
Using the "Groups..." variable one can see the scatter plot divided into several distinct groups. These groups are
having different color and symbol as displayed in the following figure:
Using the "Advanced..." and "Appearance..." push buttons more sophisticated plots can be produced where dots
can be connected with a line using several methods. In the following figure a "Regression" method was selected
to draw a regression line between the dots of the chart.
BiX | %Visual Macro User Manual | 65/176
BiX | %Visual Macro
User Manual
3D Surface Chart
This is a 3 dimensional plot chart that plots Z values against a plane describes by (X,Y) coordinates. The Z
values are connected to form a surface. You must supply three numeric variables for the X, Y and Z variables.
The above chart usually called "cowboy hat" describes a known mathematical formula z=sin(sqrt(x^2+y^2));
BiX | %Visual Macro User Manual | 66/176
BiX | %Visual Macro
User Manual
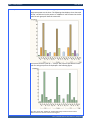
Barline Chart
A combined chart of vertical bars and plot chart.
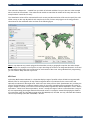
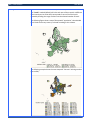
Map Chart
In order to chart a map you need to have two SAS data sets :
1. A map data set appropriate for your data. SAS supplied maps can be found at the MAPS Libname where
hundreds of already made maps can be found as SAS data sets. Each data set contain an ID variable which
identify the specific "Polygon" in the map. For example, in the "World" SAS data set the ID variable contains
countries codes around the globe. Each country (or in more general terms, each polygon) is usually made of
several observations describing the boundaries of polygons as lines with (x,y) coordinates.
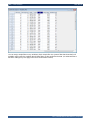
2. A "data" data set which has a numeric variable with the same values as the values of the ID variable in the
Map data set. This way you can "link" values in your data to polygons on the map. For example, your data may
contains monthly downloads of %Visual software for each country over the globe. Your data may be looking
something like this:
BiX | %Visual Macro User Manual | 67/176
BiX | %Visual Macro
User Manual
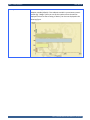
In order to produce the map chart, select a "Map..." data set. A selection window will be opened to allow you to
specify the Map data set as displayed in the following figure:
BiX | %Visual Macro User Manual | 68/176
BiX | %Visual Macro
User Manual
Then select the "Response..." variable from your block of selected variables from your data set. In the example
above it would be "Downloads". Then select the ID variable to match the ID variable of the map data set. In the
example above it would be "Country".
The "downloads" values will be summarized for each country and the total value will be used to specify the color
of that country on the map. By default, each map has six levels of colors and polygons on the map gets their
colors based on the calculated value as shown in the following figure:
Note: A map data set may contain polygons that describes not only a geographic maps but also other shapes
and structures. For example, one may have a "map" describing the surface of an integrated electronic circuit and
the data will describe failure rate in production for each section of the circuit. Using standard SAS programming,
you can create a "Map" data set of your own.
KPI Chart
A KPI (Key Performance Indicator) is a chart that displays range of possible values divided into segments with
different color for each segment. On top of these segments there is an indicator for the current value and
optionally an indicator for the target value. A KPI can have variety of forms (Dial, Speedometer etc.) and they are
used to quickly illustrate in a condense chart the value of one metric important to the organization (like sales vs.
target or budget vs. actual) on a scale of colors that represents segments like "Below expectation - Red", "Within
expectation - Yellow" and "Above expectation - Green". Usually the range of values is normalized into a range of
0 to 100 representing percentages instead of the actual values. For example, instead of displaying the distance
of current sales value ($ 1,235,000) to target value ($ 2,000,000) as $ 765,000, one may calculates this distance
value as a percentage (765,000 / 2,000,000) = 38.25%.
BiX | %Visual Macro User Manual | 69/176
BiX | %Visual Macro
User Manual
In order to chart KPI's your data must include at least one observation with a numeric variable holding the
"Value" to chart. A KPI chart is produced for every observation in the data set. Optional variables can hold the
"Label" for that KPI which is displayed on top of the KPI itself and a numeric "Target" variable. More optional
variables can hold the segments values and colors and also the type of KPI chart to draw. These optional
variables will be described later.
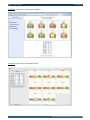
Usually KPI's are grouped together to form a "Dashboard" for executives like the one shown below which was
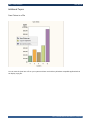
created solely using %Visual graphics window with some "Advanced..." options selected to form this
Excel2010 dashboard describing sales Vs. target at some airport locations in USA.
BiX | %Visual Macro User Manual | 70/176
BiX | %Visual Macro
User Manual
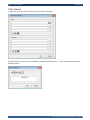
Titles Window
A graph may have up to 4 lines of titles and up to 4 lines of footnotes.
Each line has its own font, color and justification attributes controlled via the "..." push buttons that displays the
following window:
BiX | %Visual Macro User Manual | 71/176
BiX | %Visual Macro
User Manual
Style Window
Selecting Style for the chart
A chart appearance is controlled by a "Style" definition. The style handles aspects of colors, fonts background
etc. %Visual allow to select from SAS predefined set of styles and optionally override parts of that style for a
specific customization of the chart. The "Style" window display a preview of the style as displayed in the following
figure:
BiX | %Visual Macro User Manual | 72/176
BiX | %Visual Macro
User Manual
Selecting Style for Text
Whenever a chart is published it is always accompanied by its underlying data. The "Style" window allow you to
select the style for the textual part of the published chart:
You can select an Excel style from several predefined %Visual styles or even design your own style. The final
result inside the Excel2010 spreadsheet may look like the following figure:
BiX | %Visual Macro User Manual | 73/176
BiX | %Visual Macro
User Manual
Appearance Window
The appearance window controls options shared by all or most of the chart types. These appearance options are
organized in several tabs. Many of the options inherit their attributes from the selected style, and if you wish to
modify that inheritance and specify your own value, you should check the "Override" check-box first.
The General Tab
Contains options for controlling the size of the image file (in pixels), colors and fonts used for the chart.
Feature
Description
Image Size
The default image size is 500X400 pixels which is the size of the graphic area
inside the window. Thus default graph will always fit into the window exactly.
You can select different sizes to fit your needs. For example, A KPI graph will
usually be of a smaller size since KPI are grouped together to form a
dashboard. For a KPI, the recommended size is Very Small (300X200) or even
Mini (180X150).
Annotate data set
Specify a SAS data set that contains SAS annotate facility commands.
Annotate is a known SAS technique to enhance and add graphic elements to
a chart. The discussion scope of Annotate facility is beyond this document.
For further reading about the Annotate facility please refer to SAS
documentation.
BiX | %Visual Macro User Manual | 74/176
BiX | %Visual Macro
Color Scheme
User Manual
The color scheme is determined by the style selected for the chart. Colors for
slices or bars and for background are all stored in the style definition. You can
override colors assigned for slices and bars by selecting this option. You can
choose from two methods: 1) Uni Color where all slices or bars are colored by
the same selected color, or 2:) Palate of colors which are selected by the
following window:
In the "Color Palate" window shown above you can select up to 16 colors. For
example, if you wish to emphasize a specific bar with a different color than
other bars, then you can select the same color for all of the 16 colors except
for the color(n) for your bar/slice. Notice that colors are assigned to slices or
bars according to their relative position in the chart as displayed in the
following figure:
BiX | %Visual Macro User Manual | 75/176
BiX | %Visual Macro
User Manual
Text Options
Overriding this options selects the default font and color for any text in the
chart. You can change this defaults for a specific part of the graph in other
windows.
Colors
The color for the graph area is a background color for the area of the whole
parts of the chart while if your chart as a frame (Bars and Plots) then you can
also select a color for this specific part as displayed in the following figure:
BiX | %Visual Macro User Manual | 76/176
BiX | %Visual Macro
User Manual
The Images Tab
Some of SAS software supplied styles contains image definition that are applied to background of charts. if you
wish to select your own background images then select the override check box and select a *.gif or *.jpg images.
If a chart is assigned a background image then the background color attribute is overridden.
BiX | %Visual Macro User Manual | 77/176
BiX | %Visual Macro
Feature
User Manual
Description
Chart Background Image
An image for the whole chart. The image can be either "Tiled" which means
the image will be duplicated to fill the whole area or "Fitted" which means the
image will be stretched to fill the area.
Axis area Background Image
If your chart has an axis frame (Bar and Plot) then you can select a different
image for this part of the chart as displayed in the following figure:
BiX | %Visual Macro User Manual | 78/176
BiX | %Visual Macro
User Manual
The Axis Tab
The Axis tab control the appearance of the X & Y Axis of a bar chart or 2D Plot chart. In horizontal bar chart the
X axis is actually the vertical axis on the left side of the bar chart.
Feature
Description
Label
Select the label text, font and color for the label of the X axis. Usually
the axis label is the label (or name, if there is no label) of the variable
assigned to the X Axis.
Values
Select the font and color for the text of tick marks.
Text Direction
Select the direction of text of tick marks. In the following example
font, color and text direction has been changed for the chart:
BiX | %Visual Macro User Manual | 79/176
BiX | %Visual Macro
Major Tick Marks
User Manual
You can select one of two methods to control the number of tick
marks:
1. Automatic Method - SAS chooses the best number for major and
minor tick marks. For bar charts with ordinal type of variable assigned
to the X axis, it will create a bar for each distinct value. For plot chart
with nominal (continuous values) variable the number can be
controlled by selecting and overriding the automatic values.
The following figure shows a plot chart with default automatic
assignment of tick marks:
In the following example the number of tick marks has been changed
to 6 major tick marks and zero (none) minor tick marks:
The resulting X axis tick marks are shown below:
2. Manual Method - selecting specific values to be set as tick marks.
You can set values for tick marks in many ways as described in the little
help menu shown while pressing the "?" push button:
The manual method is most helpful to control tick marks intervals of
date or datetime variables.
BiX | %Visual Macro User Manual | 80/176
BiX | %Visual Macro
User Manual
Y1 & Y2 Axis Tabs
For bar charts use the Y1 axis while for Plot charts you can assign two Y axis: one on the left side and one on
the right side of the chart each displaying different statistical measures on the same common X axis. Definitions
for Y1 and Y2 axis are the same as for the X axis.
BiX | %Visual Macro User Manual | 81/176
BiX | %Visual Macro
User Manual
The Lines Tab
Note: The lines tab effects only a 2D plot chart or the plot part of a Barline chart.
%Visual allows you to specifically control up to 4 lines. Multiple lines in a plot chart can be created either by
specifically selecting two Y variables (which will result into two groups of points that may be connected with two
distinct lines, or by selecting a "Group" variable which can result into multiple lines depending on the number of
distinct values of this "Group" variable has. In this scenario, only the first 4 lines are editable and the rest of the
lines inherits their attributes form the style.
Note: a plot chart with many multiple lines can become cluttered and uneasy to interpret.
BiX | %Visual Macro User Manual | 82/176
BiX | %Visual Macro
Feature
Interpolation Type &
Symbol
User Manual
Description
Default behavior is to create a scatter chart where points are not connected.
Each point is represented by default with a "+" (Plus) sign:
However, you can select from several different methods to connect the points
with:
1. "Join" - connect the points with a straight line :
BiX | %Visual Macro User Manual | 83/176
BiX | %Visual Macro
User Manual
3. "Regression" - draw a linear regression line + confidence intervals:
Note: %Visual always automatically sorts the values by X variable prior to drawing the 2D plot chart.
Line Color & Width
If the interpolation method creates a connecting line, Selects the color and the
width of the connecting line.
Symbol Color & Size
Selects the color and size of the symbol used for the points in the chart.
Display Values
Shows the X axis value of each point in the chart. You can select the font and
color used for labeling the points.
BiX | %Visual Macro User Manual | 84/176
BiX | %Visual Macro
User Manual
The Legend Tab
The legend is automatically created for bar charts with subgroup variables, for map charts and for 2D plot charts
with two Y variables (Y1 and Y2).
BiX | %Visual Macro User Manual | 85/176
BiX | %Visual Macro
Feature
Legend Positioning
User Manual
Description
Position the legend in one of 8 places around the chart. You can select if the
legend will overlap with the chart itself (Inside) or will be created outside of the
chart area. the following example shows default legend positioning:
BiX | %Visual Macro User Manual | 86/176
BiX | %Visual Macro
User Manual
The following figure shows a legend on the "Middle Left" positioning arranged in
one column and three rows:
The following example shows an "Inside Middle Right" positioning:
BiX | %Visual Macro User Manual | 87/176
BiX | %Visual Macro
Legend Style
User Manual
Controls the color, font and shadow of the legend bar:
BiX | %Visual Macro User Manual | 88/176
BiX | %Visual Macro
User Manual
The Grid Tab
Note: Grid tab affects bar charts, 2D plot charts and Barline charts.
BiX | %Visual Macro User Manual | 89/176
BiX | %Visual Macro
Feature
Automatic Ref Lines
User Manual
Description
Creates a line on every major tick mark. You can control the color, width and
style (solid, dash or dots) of these lines.
For bar charts, you can also control if these lines will be "behind" the bars or
in "front" of the bars as displayed in the following figure:
BiX | %Visual Macro User Manual | 90/176
BiX | %Visual Macro
Custom Ref Line
User Manual
Sets up to two custom reference lines with specific value (must be between
the min and max values for that axis) and optionally sets a label for this
reference line as displayed in the following figure:
Which results to the following chart:
BiX | %Visual Macro User Manual | 91/176
BiX | %Visual Macro
User Manual
Advanced Window
%Visual will usually produce a default chart for each of the chart types selected based upon default settings. You
can override these settings to produce more tuned charts to your needs as described in the following sections.
The Pie/Donut Tab
Feature
Description
Pie Layout
2D layout is a "Flat" pie and 3D is a rotated "thick" pie. Usually the 2D
representation is more readable as displayed in the following figures:
Start Angle
The angle of the first slice. Default angle is 90 degrees.
BiX | %Visual Macro User Manual | 92/176
BiX | %Visual Macro
User Manual
Other Threshold
Slices which have value less than 5% (default) are grouped together into the
"Other" slice.
Ascending/Descending
Slices are ordered (by default) with a descending order (counter clockwise)
starting from the "Start Angle" where the "Other" slice is always shown as the
last slice in the pie.
Explode
Emphasizes one of the slices in the pie chart. You can select to explode the
biggest slice or any specific slice denoted by its exact character formatted
value.
The resulting chart is displayed in the following figure:
BiX | %Visual Macro User Manual | 93/176
BiX | %Visual Macro
Text Options
User Manual
Position each value of the pie chart (slice label, slice value and slice percent)
in a specific location (Inside, Outside or Arrow).
The resulting chart is displayed in the following figure:
If you check the "Match colors" then the color used for text is similar to
the color of the slice. (note: text located "Inside" the slice may become
obscure).
BiX | %Visual Macro User Manual | 94/176
BiX | %Visual Macro
Donut Options
User Manual
Donut chart is similar to 2D pie but they have a "Hole" in the middle. You can
set the size of the hole as a percentage of the donut diameter and optionally
set a text to be placed inside the hole as displayed in the following figures:
The resulting chart is displayed in the following figure:
BiX | %Visual Macro User Manual | 95/176
BiX | %Visual Macro
User Manual
The Bar Tab
Feature
3D Bar Type
Description
Applicable only for 3D vertical or horizontal Bar charts. Controls the 3D effect
of the bars. Options are: Hexagon,Prism, Star, Block and Cylinder. The
following charts are examples of Hexagon, Block and Cylinder respectively:
BiX | %Visual Macro User Manual | 96/176
BiX | %Visual Macro
User Manual
Order Bars
Bars are ordered (by default) by the midpoint variable values. Changing the
order of bars to "Ascending" will result as the chart in the following figure:
Dimensions
Overriding the default dimensions will enable compressing more bars to fit
into the chart area or to allow a wide text to be placed on top or inside the
bars.
BiX | %Visual Macro User Manual | 97/176
BiX | %Visual Macro
Display Outside Values
User Manual
Shows the value of the bar on top of the bar as displayed in the following
figure:
For horizontal bar charts the resulting chart is displayed in the following
figure:
Please note that if the graph has no analysis variables assigned to, then you
can only select "Frequency" or "Percentage" statistics to be displayed.
BiX | %Visual Macro User Manual | 98/176
BiX | %Visual Macro
Display Inside Values
User Manual
Valid for Vertical bar charts only. The following example shows percentages
out of values of all bars:
note: In the above example bar width has be extended to hold the wide percentage
text.
Selecting "Subpct" statistics will show percentages for each bar representing
100%:
BiX | %Visual Macro User Manual | 99/176
BiX | %Visual Macro
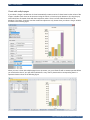
Colors By
User Manual
For bar charts with "Group" or "Subgroup" variables, controls the color
assignment pattern to the chart. The following chart displays a bar chart with
"Group" variable and a color pattern of "Midpoints" which means that similar
values in each group will have the same color:
The same chart with "Color By" = "Groups" will create a chart with the same
color for each group of bars as displayed in the following figure:
Note: bar charts with "SubGroup" variable will always result into charts with a
different color for each bar section and a legend.
BiX | %Visual Macro User Manual | 100/176
BiX | %Visual Macro
Data Type
User Manual
"Discrete" data type will create a bar chart for each distinct value of the
midpoint variable (default). If the midpoint variable is a continuous numeric
variable (Eg. "Weight") then you can set the number of bars that will be
displayed in the chart thus creating a "density" bar chart as displayed in the
following figure:
BiX | %Visual Macro User Manual | 101/176
BiX | %Visual Macro
User Manual
The 2D PLOT Tab
BiX | %Visual Macro User Manual | 102/176
BiX | %Visual Macro
Y Axis Settings
User Manual
If your plot has two Y axis variables, you can control the positioning of Y
values on the chart as displayed in the following figures.
If you place both Y1 and Y2 on the left axis then the values of the axis scales
to host min and max values of both variables and the label of the axis
changes to "Value". Notice that a legend is automatically produces.
However, if you decide to place each Y variable on a different axis then the
resulting chart with two "Y" different axes is displayed as in the following
figure:
BiX | %Visual Macro User Manual | 103/176
BiX | %Visual Macro
User Manual
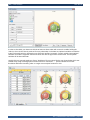
The 3D Surface Plot
Feature
Description
Colors
Overrides coloring inherited from the style definition.
Rotation
Overrides default positioning of the chart in 3D space by x/y/z rotation
planes.
BiX | %Visual Macro User Manual | 104/176
BiX | %Visual Macro
User Manual
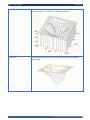
Display Sides
Display the 3D plot with sides as displayed in the following chart that
shows the depth of a small lake: (Rotation implied)
Display Grid
The same Sashelp.Lake data set shown without grid and from the default
rotation angel:
BiX | %Visual Macro User Manual | 105/176
BiX | %Visual Macro
User Manual
The Barline Tab
Note: Some "Bar" characteristics of the chart are controlled via the "Bar" tab in the "Advanced Chart Options"
window. The "Plot" characteristics of the chart are controlled via the "Axis" and "Line" tabs in the "Appearance"
window.
Feature
Statistics
Description
The statistics assigned to each part of the barline. Sum statistics can only be
selected if an analysis variable has been assigned to the chart.
BiX | %Visual Macro User Manual | 106/176
BiX | %Visual Macro
Order
User Manual
The order of midpoints of the bar is also the order of the Y axis points in the
plot (default). This can be changed to produce more complex barline charts,
for example, Pareto charts where the order of bars and plot are opposite.
The statistics assigned to the bars is "Freq" where each bar represents the
total number of incoming calls to a CRM call center by call type. The line
represents the cumulative percentage of each bar up to 100%. the bars are
ordered by descending order where the left most bar is the tallest bar while
the points on the plot line are ordered in ascending order representing the
ascending nature of cumulative percentage.
BiX | %Visual Macro User Manual | 107/176
BiX | %Visual Macro
User Manual
The Map Tab
BiX | %Visual Macro User Manual | 108/176
BiX | %Visual Macro
Coloring Method
User Manual
The "Discrete" method will color each part of the map with a different color.
The "Levels" method (default) will color each part of the map with a different
color based upon its value which corresponds to one of the color levels
created by dividing the range of values into the selected number of levels.
The following figure shows a map of Europe with "population" value divided
into 6 levels thus every country is colored according to this schema:
The following example shows the same map with "Discrete" coloring method
(less useful):
BiX | %Visual Macro User Manual | 109/176
BiX | %Visual Macro
User Manual
Uniform Legend
If a page variable has been selected then a separate map will be created for
each value of the page variable. Selecting the "Uniform" option will ensure
consistent legend and colors across all pages.
Include All Areas in Map
The map data set may contain areas which currently has no data in the data
set. Usually this will cause that area not to be included in the chart (default).
BiX | %Visual Macro User Manual | 110/176
BiX | %Visual Macro
User Manual
The KPI Tab
Note: KPI charts may take longer to produce.
Feature
KPI Type
Description
Several graphic designs are available to select from:
Type 1 - Dial
Type 2 - Half
Speedometer
Type 3 - Full Speedometer
Type 4-Horizontal
Slider
Type 7- Vertical
Traffic Lights
Type 8 - Horizontal Bullet
BiX | %Visual Macro User Manual | 111/176
BiX | %Visual Macro
KPI Type & Segments
User Manual
Select one of two methods to set KPI type and segments:
1. "Specify here" - use the settings in the window for each KPI. (A KPI is produced
for each observation).
2. "Data set Variables" - KPI type and segments (borders and colors) are based
upon specific variables with reserved names that must be in the data set along
with the variable for the KPI value itself.
The reserved variables are as follows:
"BOUNDS" - Char $100 variable which lists the borders of the segments as values
separated by blanks.
"COLORS" - Char $100 variable which lists the colors assigned for each segment
separated by blanks. Each color is denoted by a prefix of 2 letters "cx" and a RGB
color in hexadecimal notation in the range of 00-FF (Eg. "cxff0000" - for the "Red"
color).
"KPITYPE" - a number between 1 to 9 representing the KPI type according to the
relative positioning in the drop-down list in the window (1 - for "dial", 2- for "half
speedometer" and so on).
"KPIFORMAT" - Char $9 variable with the name of the format to use for displaying
the KPI value.
Notice that "bounds" variable will always have one more value than the "colors"
variable.
In the above example the variable "V" is the value of the KPI, the variable "L" is
the label and the variable "T" is the target variable. Both "L" and "T" are optional.
A KPI for each observation is produced and each KPI will have its own bounds and
colors.
BiX | %Visual Macro User Manual | 112/176
BiX | %Visual Macro
Segments
User Manual
If you have selected to specify segments "Here" up to four colored segments can
be set with respective colors and bounds. Then Three segments can be specified
by omitting the fifth value respectively. Segments values must match the possible
values for the KPI. Usually KPI values and targets are scaled to present
percentages values thus they are scaled from 0-100%.
You can select a predefined style for the colors or set your own specific color for
each segment.
Display Options
Control displaying of KPI values with their associated fonts and colors.
BiX | %Visual Macro User Manual | 113/176
BiX | %Visual Macro
Layout
User Manual
Controls the positioning of KPI charts in a dashboard. Dashboards usually contains
several KPIs all grouped to form an executive dashboard. consider the following
data set that contains KPI values and target of sales in different airports in the
USA:
It is recommended to resize the chart area to a smaller size than the default (Eg.
180X150 pixels) in the "Appearance" window. producing the KPI chart in %Visual
will show each KPI in a separate "page" and you can scroll down to view more
KPIs:
When the chart is exported as a "%Visual document" you can control the
positioning of the KPI within the dashboard as in the following examples:
BiX | %Visual Macro User Manual | 114/176
BiX | %Visual Macro
User Manual
Example 1: Layout of 2 x 4 presented in HTML file:
Example 2: Layout of 3 X 3 presented in Excel:
BiX | %Visual Macro User Manual | 115/176
BiX | %Visual Macro
User Manual
Additional Topics
Save Picture to a File
You can save the chart into a file on your system and later use it with any Windows compatible application that
can display a png file.
BiX | %Visual Macro User Manual | 116/176
BiX | %Visual Macro
User Manual
Copy Picture to Clipboard
Immediately copies the image from %Visual chart editor preview into your computer's clipboard where you can
later paste the image into other Windows compatible application (Eg. MS PowerPoint).
Note: Works only with SAS for windows. Not applicable for SAS under Unix/Linux.
BiX | %Visual Macro User Manual | 117/176
BiX | %Visual Macro
User Manual
Save Picture(s) as Document
Sends the chart(s) to a document(s) of your choice. the HTML file will always be created with optional links to
other file formats. the summarized data used to draw the chart is also printed inside the document.
BiX | %Visual Macro User Manual | 118/176
BiX | %Visual Macro
User Manual
Charts with multiple pages
If you select a "Pages" variable then %Visual automatically creates a series of charts based on the values of the
"Pages" variable. Each chart can be accessed using the "Next" or "Previous" push buttons or by using the pop
menu which lists all created charts with their respective values. There is a limit of 999 charts that can be
displayed. The "Next", "Previous" and the combo-box objects are only shown when you select a "Page" variable
as shown in the following figure:
When you save a chart with multiple pages into a document, you get a HTML file with a contents part that allows
you to select the chart. If you open the Excel2010 file, every chart is placed with its corresponding data in a
separate sheet as shown in the following figure:
BiX | %Visual Macro User Manual | 119/176
BiX | %Visual Macro
User Manual
Simple Filter
Overview
Selecting A Simple Filter
Selecting Values in a Simple Filter
Viewing Simple Filters
Overview
One of the method %Visual offers to subset a data set (filtering its contents) is by Simple Filters. This method is
very similar to filtering cells like in an Excel2010 spreadsheet. This is a very quick and straight forward method
aimed for novice users and also if the complexity of the filter is limited. For more complex filters you can use the
"Advanced Filter" method or the drill-down (Frequency and Univariate) methods or all of the three methods
altogether.
Selecting A Simple Filter
Highlight the variable that you want to filter and then select the "Simple Filter..." option from the pop menu as
displayed in the following figure:
Selecting Values in a Simple Filter
The Simple Filter window displays all possible unique values found in the column. Each value shows its count
value in square brackets preceding the value itself. Simply select the values that match your need in a very
similar way done in Excel spreadsheet filtering system.
BiX | %Visual Macro User Manual | 120/176
BiX | %Visual Macro
User Manual
You can sort the list by values or by count in ascending or descending manner. When you re-enter an already
selected simple filter you are presented with the previous selected values but you can refresh the list of available
values by clicking on the "Clear Filter" pushbutton.
Viewing Simple Filters
After returning to %Visual Viewer window, the filtered column changes it's header color in order to show columns
that have an active simple filter applied on them as shown in the following figure. (Tip: You can change the
default color of a simple filter column as well as other colors implied on the table by selecting the "Viewer
Attributes..." pop menu option).
BiX | %Visual Macro User Manual | 121/176
BiX | %Visual Macro
User Manual
You can assign simple filters to any variable(s). Each simple filter is a dynamic filter that shows the list of
available values under the condition that all other filters are also applied to the data. (An advanced filter or
drill-down settings may also apply to the list of shown distinct values).
BiX | %Visual Macro User Manual | 122/176
BiX | %Visual Macro
User Manual
Advanced Filter
Overview
Using Macro variables
Numeric Variable
Selecting Single Value
Selecting Group of Values
Selecting Range of Values
Numeric Analysis Variable
A Variable With User-Defined Format
Selecting values from an associated format table
Character Variable
Selecting Single Value
Date Variable
Selecting Single Date
Selecting Date Range
Selecting Advanced Date Filter
Time Variable
Selecting Time Range
Datetime Variable
Selecting Datetime Range
Additional Topics
Editing a Clause
Building More Complex Filters with Logical operators
Adding Free Format Clause
Checking Your Filter
Viewing full SAS Where Code
Cycling previously defined clauses
Viewing and modifying previously defined filter
Combining Advanced filter with other filtering methods
Using Cut and Paste methods for inserting values
Possible Error messages
Overview
An advanced filter is a SAS "Where" clause that you can build through a series of wizards with the addition of
logical connections (And, Or, Not) between them. The "Advanced Filter" window lets you choose values from the
right wizard for each type of variable (For example, if the variable is of a "Date" type, then you are presented with
options to select a date using a calendar instead of coding cumbersome SAS syntax like "12mar2012"d). Each
variable in the data set can have a filter clause implied on it and the default logical connection between all
selected clauses is "And". (No need to specifically write this "And" connection but you can select a different
logical connection like "Or" and imply parenthesis if needed). You can also manually code a "Where Statement"
within one of the wizards. The Advanced Window has numerous techniques to let you verify the correctness of
your where clause as will be described in the following sections.
BiX | %Visual Macro User Manual | 123/176
BiX | %Visual Macro
User Manual
As shown in the example above, The left side of the window shows the variable list of the data set. Select a
variable and then right-click your mouse to open a pop menu showing possible wizards for this type of variable.
Select the option that best suits your need and complete the clause by filling and selecting option in this wizard.
After quitting the wizard, the clause will appear in the list of selected clauses on the right side of the window.
Select another variable and repeat the process. You can select any number of variables each with a different
clauses. All selected clauses will be shown on the right side as shown in the following figure. The default logical
connection between all clauses is "And" (Although it is not shown on the window). You can change the default
logical connection to "Or" or "Not" and add parenthesis as needed.
Note: If you click on one of the selected clauses on the right side of the window, the SAS "Behind the scene"
generated code is displayed for this clause in the "Preview" section of the window.
BiX | %Visual Macro User Manual | 124/176
BiX | %Visual Macro
User Manual
Using macro variables in Advanced Filter windows
All advanced filter windows have an option to replace the value of a where clause in runtime with a macro
variable value. Check this option and then supply the macro variable’s name. You can assign values to the
macro variables using standard SAS language statements (like %let).
Numeric Variable
A numeric variable with no specific SAS format associated with it, will allow you to select from three possible
wizards as shown in the following figure:
Selecting Single Value
Inside the "Single Value" window you should supply a single numeric value and a comparison operator selected
from the list.
If the value is unknown to you, then you can ask %Visual to display the "Simple Filter" window that analyses "on
the fly" all possible distinct values by pressing the "..." push button.
BiX | %Visual Macro User Manual | 125/176
BiX | %Visual Macro
User Manual
The first selected value from the "Simple Filter" window will be automatically pasted into the text entry object.
Selecting Group of Values
Sometimes a numeric variable holds numeric values like Customer numbers, SSID, Part numbers etc. If you like
to specify a group of values then you can type them one by one in the "Select Group" window (Up to 9,999
values). This list of values then becomes a SAS where clause of the form "PARTNO in (3,6,8,9)".
BiX | %Visual Macro User Manual | 126/176
BiX | %Visual Macro
User Manual
Many times, these values lists are required for different reports and queries. In such cases, you can save the list
to a SAS data set for future retrieval and maintenance. By pressing the "Save as SAS Data set..." push button,
you can specify the name and location of the data set as shown in the following figure:
BiX | %Visual Macro User Manual | 127/176
BiX | %Visual Macro
User Manual
The saved SAS data set then becomes a repository for your saved list. Whenever you want to use the values
stored in the data set, you can press the "Read from SAS data set..." push button, then select the data set and
the variable that stores the values list as shown in the following figure. The values will be automatically pasted
into the "Select Group" window. Thus saving the retyping process of this list. If values in the list has to be
modified, then you can edit, add or delete values and save the list again.
Selecting Range of Values
For numeric variables, the "Select Range" window lets you type in two values that are eventually stored as a
SAS "Between" operator. If you don't know in advance the values, then you can request %Visual to display the
Simple Filter window for you by pressing the two "..." push buttons.
BiX | %Visual Macro User Manual | 128/176
BiX | %Visual Macro
User Manual
Numeric Analysis Variable
A numeric analysis variable has a SAS format associated with it that is on the formats: COMMAw.d or
DOLLARw.d (and some others) mainly used for variables holding values like money values etc. In such cases,
there are only two wizards available for you since the "Group of Values" window has no relevance for this type of
variable.
A Variable With User-Defined Format
If the variable has an associated user-defined format, then you can use this format to select the values from.
This is a faster method then letting %Visual query the values "on the fly" as done in the "Simple Filter" window.
Another difference between the Simple Filter method and the format method is that the simple filter only shoes
those values that are currently in the data set, and the format method shows all possible values for this variable
based on the external format table associated with the variable.
Selecting values from an associated format table
By selecting the "Select values from Format Table..." %Visual displays a window with all possible values
assigned in the associated format. You can select one or more values (CTRL). This operation does not scan the
actual data set and thus saves computing resources.
BiX | %Visual Macro User Manual | 129/176
BiX | %Visual Macro
User Manual
Note: A format value "**Other**" which may be found within a SAS user defined format cannot be used as a valid selected value.
Note: The displayed format is the first one matching its name along the “fmtsearch” path assigned by SAS system option.
Character Variable
Selecting Single Value
The "Select Single Value" window has a broader set of operators than if the variable was a numeric one. You
can use the "Contains" and "Like" operators to query character variables. Also, you can select the "Remove
leading and trailing blanks" check box to overcome problems resulting from extra blanks at the data set or the
"Ignore Case" check box to overcome problems resulting from case sensitive issues.
Note: you don't have to type quotation marks around the value because %Visual knows that this is a character
variable and the quotation marks are added automatically.
BiX | %Visual Macro User Manual | 130/176
BiX | %Visual Macro
User Manual
Date Variable
A date variable is a numeric variable with a SAS date format associated with it. The underlying value of a SAS
date value is the number of days since January, 1, 1960 which has the inner value of 0. Every date value before
01jan1960 is a negative number. This underlying structure of date values is hidden from the end user by %Visual
windows.
Selecting Single Date
The "Select Single Date" window allows to select a comparison operator and a single date. Use the calendar
object to select a specific date.
BiX | %Visual Macro User Manual | 131/176
BiX | %Visual Macro
User Manual
If the date value has to be a dynamic one, you can use the "Today()" push button which will build a dynamic
clause which changes according to the current actual date, If you choose this type of date value, then the
calendar is hidden as you can see in the following figure:
Selecting the "Other..." push button invoke a pop menu with some more often used advanced date values:
BiX | %Visual Macro User Manual | 132/176
BiX | %Visual Macro
User Manual
The "Attribute" window can change the colors of week days displayed in the calendar object:
Selecting Date Range
Date ranges can be set using the following window. Push buttons are similar to those in the Single Date window.
BiX | %Visual Macro User Manual | 133/176
BiX | %Visual Macro
User Manual
Selecting Advanced Date Filter
The "Advanced Date Filter" is a very sophisticated utility to select complex dates conditions in a very intuitive
interface. The date value is divided into three different sections: Day, Month and Year. Each section can have a
set of selected options implied on. Every section creates a "OR" logical operator between the selected rows and
all three sections are connected via a "AND" logical operator.
You must select from all three sections at least one row. For example, the following figure selects months
"January" or "February" from the current year or from the previous year no matter which days.
BiX | %Visual Macro User Manual | 134/176
BiX | %Visual Macro
User Manual
Warning: Some selection combination might result into a "No Meaning" date clause. For example, if you select
from the "Day" column the value "Yesterday" then you must select "Don't Care" from the "Month" and "Year"
columns otherwise there is no meaning to the term "Yesterday". For many of these meaningless cases %Visual
will alert you.
Time Variable
A time variable is a numeric variable with a SAS time format associated with it. Time values are the number of
seconds since midnight of the current date.
Selecting Time Range
BiX | %Visual Macro User Manual | 135/176
BiX | %Visual Macro
User Manual
Datetime Variable
A datetime variable is a numeric variable with a SAS datetime format associated with it. Datetime values are the
number of seconds since midnight of 01Jan1960.
Selecting Datetime Range
Additional Topics
Editing a Clause
After a clause has been set, you can always change its values by selecting the "Edit Clause..." option. You will
be presented with the same wizard that was used to build the clause with the previously selected values
displayed inside. Change your selection and save the wizard again.
BiX | %Visual Macro User Manual | 136/176
BiX | %Visual Macro
User Manual
Building More Complex Filters with Logical Operators
By default, all clauses selected in the filter are combined using the "AND" logical operator. This default operator
is not shown. If you want a different logical combination of clauses then select the appropriate options from the
pop menu as displayed in the following figure:
In the following example, the "OR" logical operator was inserted between the two selected clauses thus
overriding the default "AND" operator. If you delete the "OR" line then the default "And" connection will take
effect again.
BiX | %Visual Macro User Manual | 137/176
BiX | %Visual Macro
User Manual
Note: If you combine "AND" and "OR" logical operators in the same filter then you should also take care of the
order of precedence of evaluating the filter and use parenthesis for clarity and control. If no parenthesis are
present, "AND" will always be evaluated first and then the "OR" will be evaluated. This behavior is similar to
evaluating mathematical formulas. For example, the value of: 2 + 4 * 5 is always 22 since by default the
multiplication is calculated first and then the addition takes place. If you want to evaluate the mathematical value
in other order then you should add parenthesis like in the following term: ( 2 + 4 ) * 5 which result into 30.
The "AND" operator is like the mathematical Multiplication and the "OR" operator is like the mathematical
Addition. Thus the meaning of x=3 OR y=8 AND z=4 is different from ( x=3 OR y=8) AND z=4. Use
%Visual pop menu options 'Add "(" Before Clause' or 'Add ")" After Clause' to insert parenthesis in
your filter code.
The Example below shows the Where clause:
(INVOICE > 40000 OR ORIGIN='USA' ) AND ENGINESIZE > 3.5
(Note: The "AND" operator is hidden)
Adding Free Format Clause
In some complex cases, you may need to code the filter manually. For example, a filter like
"Actual > 0.95 * Predict" can only be hard-coded manually since there is no predefined wizard in %Visual
suitable for this type of clause. To add a "Free Format Where Clause" select this options from the pop menu:
BiX | %Visual Macro User Manual | 138/176
BiX | %Visual Macro
User Manual
This type of clause can be added anywhere and many times in the list of clauses. The "Free Format Where
Clause" window is displayed in the following figure:
While coding the where clause, you can get assistance from several pop menu options displayed above. For
example, if you don't remember variables names, you can open a Variable Window and select the variable. The
variable name will be automatically pasted into the editor at the location of the pointer. You can also import or
export your code into an external file. %Visual checks the syntax of the manually coded where text on exit, and
alerts if any violation exists.
A "Free format where clause" appears as a regular clause along other clauses. The logical connection is as
always "AND".
BiX | %Visual Macro User Manual | 139/176
BiX | %Visual Macro
User Manual
Checking Your Filter
The "Advanced Filter" window checks the validity of the whole "Where" clause and might pop-up some warning
windows if a failure occurred in the parsing phase of the clauses. You can also check the clause manually and
get some interesting information whether it's valid and how many observations in the data set meets the clause.
Each single clause can be checked (separately from other clauses) by the pop menu options "Perform
Short/Long Test..." shown above. The "Short" test searches the data set until an observation is found that meets
the clause and then the search process stops. This will quickly ensure that your data set selection is valid and
not empty. The message displayed is shown below:
The "Long" search, on the other hand, continues the search until the end of the data set has been reached and
reports the number of observation found to meet the clause as shown below:
BiX | %Visual Macro User Manual | 140/176
BiX | %Visual Macro
User Manual
If no observation meets the clause then a warning message is displayed:
By pressing the "All Clauses - Long test" push-buttons the process runs for all combined clauses.
Note: In some irregular scenarios, the "Short" test may perform as "Long" test. For example, if the only
observation that meets the clause is accidentally the last one in the data set, or if no observation meets the
clause. In these scenarios, the "Short" test will also run until the end of the data set and there will be no
difference in time needed for both tests.
Note: It is mostly recommended to perform those validity tests before closing the "Advanced Filter" window in
order to assure the validity of your Where clause.
Viewing full SAS Where Code
Each clause "Behind the scene" code is shown in the "Preview" section of the "Advanced Filter" window when
you click on the clause.
You can also view the full SAS "Where" generated code (for all clauses) in a single centralized window accessed
by the "View full Code" push-button:
The full where code can be saved to external file or copied and pasted into other SAS programs.
BiX | %Visual Macro User Manual | 141/176
BiX | %Visual Macro
User Manual
Cycling previously defined clauses
Each advanced filter successfully approved is saved in a temporary %Visual clipboard. This way you can recall
the complete filter again and apply it to a different data set. For example, you are working and exploring the
"Sales2012" data set with %Visual. A filter formulated while working on this 2012 data set may be also applied to
the "Sales2011" data set as well. Open the "Sales2011" data set and select the "Advanced Filter" window.
Instead of coding the clauses again. press the "Recycle" push-button (located near the "OK" push-button) and
the last saved filter will be loaded into the window. You can click again and the previous-1 will be loaded and so
on.
Note: If the clauses that are imported into the window do not match the variables of the data set then an Error
message will be displayed.
Viewing and modifying previously defined filter
After completing all definitions in the "Advanced Filter" window, click the "OK" push button and "%Visual Viewer"
window will redisplay the data set with the selected filter imposed on it. A filtered data set may have a different
color for observations in order to alert the user that the display is currently a filtered one:
Note: You can select the color of filtered data from the "Viewer Attributes..." window.
If you want to View/Change the filter, Simply select this option from the pop menu, and the "Advanced Filter"
window will redisplay the previously selected clauses. Make the desired changes and quit the window by
pressing the "OK" push button. The "%Visual Viewer" window will be automatically refreshed with the new filter
definition.
Combining Advanced filter with other filtering methods
The final effect of a Where clause on a data set is combined from three sources:
- Simple Filters imposed on data set column(s).
- Drill-Down selections.
- Advanced Filter.
In order to view all three sources in one centralized location use the Decomposition Tree window.
Using Cut and Paste methods for inserting values
You can cut value(s) from a %Visual Viewer window or from other sources (like Excel spreadsheet) and paste
them as a value(s) selection for your current filter. This technique can be either used within the "Single Selection"
window where the first value from your Cut & Paste buffer will be inserted into the text line, or in "Group of
BiX | %Visual Macro User Manual | 142/176
BiX | %Visual Macro
User Manual
Values" window where a list of values will be inserted. If your list contains multiple occurrences of the same
value, then %Visual sorts this list with "Nodupkey" attribute.
Note: Cutting values from "%Visual Viewer" window always return the variable name as the first line. Thus, you
can select whether to remove the first line when pasting it into the "Single" or "Group" windows as shown in the
following figure:
Tip: In simple cases you can use the above technique to merge two data sets. Select the first data set, open it
with %Visual Viewer window, then set a filter clause to meet your needs. Cut the values and paste them into the
filter clause of the second data set. For example, you want to select all bills of customers of age > 35. The
customer age variable is stored in "Customers" data set while bills are stored in "Outgoing Bills" data set. Open
the "Customers" data set, set a filter on the variable "Age" and then cut all customer's ID numbers (limited to
9999 values). Open the "Outgoing Bills" data set and set a "Group Values" clause on the "ID" variable. Paste
previously selected values from the Paste buffer into the window.
Possible error messages
Using the pop menu options and %Visual wizards to construct the Where clause minimizes the possibility of
syntax errors. However certain conditions might cause the error message window to pop:
BiX | %Visual Macro User Manual | 143/176
BiX | %Visual Macro
User Manual
1. Unequal number of parenthesis:
In the example above, the "NOT" operator starts automatically with an opening left parenthesis, but you must
assign the right parenthesis manually since %Visual doesn't know where to close the NOT operation.
This error message might appear also if you try to use the cycling method of clauses and bring in a clause which
does not match the data set.
2. Errors found in the Free format Where clause window
Since this is a free format editor, syntax checks detects some other errors like the one that is displayed in the
following figure:
BiX | %Visual Macro User Manual | 144/176
BiX | %Visual Macro
User Manual
Or an error like the following one:
BiX | %Visual Macro User Manual | 145/176
BiX | %Visual Macro
User Manual
Selecting Variables
Overview
Selecting Variables
Viewing Variable's Meta-Data
Manipulating The Variable List
Modifying Default Settings
Overview
If your data set includes many variables, you can use the "Select Variables" window to select only those
variables needed by you and arrange them in an order best suited for you. Selecting Variables does not change
the data set itself, only the presentation layer is modified.
Selecting Variables
You can select for your specific need up to 54 variables: 4 of them can be used as "Freeze" variables which
means that they will be displayed as the 4 left most column. scrolling the table horizontally (left and right) will
keep these variables in their positions and only other "Display" variables will scroll. This is very helpful especially
when you have many variables and you want some variables (eg. name and id number) to be freezed on the left
side). You can use the "Up" or "Dn" push buttons to further arrange variables in each specific tab (Freeze or
Display). Removing all variables from the selected lists returns all variables again to be shown in %Visual Viewer
window.
The list of variables shown on the left side of the window has a set of icons associated with each type of variable:
BiX | %Visual Macro User Manual | 146/176
BiX | %Visual Macro
Icon
User Manual
Variable Type
Character Variable (string)
Numeric Variable
Analysis Numeric Variable
User-defined formatted variable (Numeric or Character format)
Date Variable
Time Variable
DateTime Variable
The icon type is based upon the SAS format associated with the variable. The table below lists all SAS formats
known to %Visual and their icon type associations. If there is no associated format, then the icon type is either
Numeric or Character based upon the variable type.
Icon
Character
Variable Type
$ASCII.
$BINARY.
$CHAR.
$EBCDIC.
$HEX.
$MSGCASE.
$OCTAL.
$QUOTE.
$REVERJ.
$REVERS.
$BIDI.
$VSLOG.
$UPCASE.
$VARYING.
$.
BiX | %Visual Macro User Manual | 147/176
BiX | %Visual Macro
Numeric
User Manual
BEST.
BESTD.
BINARY.
D.
FLOAT.
RACT.
HEX.
NUMX.
OCTAL.
ROMAN.
SSN.
VAXRB.
VMSZN.
WORD.
WORDS.
Z.
ZD.
Analysis Numeric COMMA.
COMMAX.
DOLLAR.
DOLLARX.
EURO.
EUROX.
E.
IB.
IBR.
IEEE.
NEGPAREN.
PD.
PERCENT.
PERCENTN.
PIB.
PIBR.
PK.
PVALUE.
RB.
User-Define
Formatted
Any non-blank format not found in any of the other categories.
BiX | %Visual Macro User Manual | 148/176
BiX | %Visual Macro
Date
DATE.
DAY.
DDMMYY.
DDMMYYB.
DDMMYYC.
DDMMYYD.
DDMMYYN.
DDMMYYP.
DDMMYYS.
DOWNAME.
JULDAY.
JULIAN.
MMDDYY.
MMDDYYB.
MMDDYYC.
MMDDYYD.
MMDDYYN.
MMDDYYP.
MMDDYYS.
MMSS.
MMYY.
MMYYC.
MMYYD.
MMYYN.
MMYYP.
MMYYS.
MONNAME.
MONTH.
MONYY.
PDJULG.
PDJULI.
QTR.
QTRR.
WEEKDATE.
WEEKDATX.
WEEKDAY.
WEEKU.
WEEKV.
WEEKW.
WORDDATE.
WORDDATX.
YEAR.
YYMM.
YYMM.
YYMMC.
YYMMD.
YYMMN.
YYMMP.
YYMMS.
YYMMDD.
YYMMDD.
YYMMDDB.
YYMMDDC.
YYMMDDD.
YYMMDDN.
YYMMDDP.
YYMMDDS.
YYMON.
YYQ.
YYQC.
YYQD.
YYQN.
YYQP.
YYQS.
YYQR.
User Manual
BiX | %Visual Macro User Manual | 149/176
BiX | %Visual Macro
Time
HHMM.
HOUR.
TIME.
TIMEAMPM.
DateTime
DTDATE.
DTMONYY.
DTWKDATX.
DTYEAR.
DTYYQC.
TOD.
DATEAMPM.
DATETIME.
User Manual
If your organization has a %Visual Meta-Data Server license then you can view lists of variables with Meta-Data
layer imposed on them (If the %Visual administrator has defined one). Meta-Data layer consist of two possible
elements:
1:) Business Hierarchies which variables are organized into, to show some business logic among variables.
For example, "Customer Address" which usually consist a set of : Country, State, City, Street, Street No and Zip
code variables can be grouped together into one hierarchy instead of looking for them by the variable name
which may need to jump from one position to another.
2:) Explanation to variable's contents which may serve as help for users to understand the meaning of variables
in a data set. Meta-Data is defined and maintained by %Visual administrator. The following figure shows the
famous "Car" data set form SASHELP libname with Meta-Data imposed on it:
For more information regarding Meta-Data please refer to %Visual Meta-Data Server documentation.
BiX | %Visual Macro User Manual | 150/176
BiX | %Visual Macro
User Manual
Viewing Variable's Meta-Data
BiX | %Visual Macro User Manual | 151/176
BiX | %Visual Macro
User Manual
Manipulating The Variable List
Clicking on the root node (top node) of the variables list displays a pop menu with the following options:
Options regarding hierarchies can only be applied on data sets with meta-data and only if your organization has
a %Visual Meta-Data Server license.
Modifying Default Settings
Variable lists has set of default settings controlling it's default presentation. Changing defaults will take effect
from the next time you open a window with a variable list.
BiX | %Visual Macro User Manual | 152/176
BiX | %Visual Macro
User Manual
Conditional Formatting
Overview
Ranges Tab
Percentiles Tab
Mean and Standard Deviation Tab
Viewing Conditional Formatting inside %Visual
Viewing Conditional Formatting inside Excel2010
Multiple Conditions
Overview
Conditional formatting is being used to highlight numeric values with different colors according to some rule. For
example, sales below certain value or blood pressure above the mean value and so on. Many businesses use
this technique to present managers with reports that highlights KPI (Key Performance Indicators) for various
fields of interest.
%Visual uses three methods for conditional formatting:
1. Ranges Method - Allow up to 3 ranges with fixed values. different coloring systems and symbols can be used
to highlight ranges.
2. Percentiles Method - A dynamic method which calculates the percentiles on the fly and allow various colors
to be assigned to these percentiles.
3. Mean and Standard Deviation Method - A dynamic method which calculates statistical measures on the fly
and allow various colors to be assigned to these measures.
Conditional formatting can be applied to many variables in the Viewer Window. In order to assign a conditional
formatting rule to a variable you must first select the variable by highlighting its column and then from the pop
menu select "Conditional Formatting..."
Drilling or filtering data will keep the rules and will display conditional formatting colors also in the drilled or
filtered view. Using one of the dynamic methods will calculate statistical measures "on the fly" and will use colors
according to those calculated values on each view of detailed data.
Detailed description of each method follows.
BiX | %Visual Macro User Manual | 153/176
BiX | %Visual Macro
User Manual
Ranges Tab
The range of values of the selected variable is divided into three sub-ranges. You must select the boundaries of
these ranges and type your selected values into the "Value1" and "Value2" fields. You can split the range into
only 2 sub-ranges by typing in the same value for both fields.
You can select from a variety of colors and symbols for your ranges. %Visual window will only display colors but
when %Visual reporting will be applied to the selected section and output will be sent to Excel2010, %Visual will
use the Excel2010 set of symbols to display the conditional formatting colors and symbols.
In the first coloring options, you can select your own set of three colors. In the next 6 options %Visual will use
predefined colors (Red Yellow and Green) while the last option will use a gradient color from the selected color
down to the white color with eight levels of colors each representing a range of (HighestValue - LowestValue) / 8
.
BiX | %Visual Macro User Manual | 154/176
BiX | %Visual Macro
User Manual
Percentiles Tab
The percentile method is a dynamic one which means that colors are assigned to values according to statistical
calculation done "on the fly".
You can select a color scheme from a predefined set or change each percentile color specifically. When you'll
edit again the rule, %Visual will display the calculated values along the colors.
BiX | %Visual Macro User Manual | 155/176
BiX | %Visual Macro
User Manual
Mean and Standard Deviation Tab
The mean and Std method is a dynamic method. values of mean and standard deviations are being calculated
"on the fly".
A simple thematic bar diagram is being used to clarify the colors and values. You can select a predefined
scheme or change the colors to your own need. When you'll edit again the rule, %Visual will display the
calculated values along the colors and bars.
BiX | %Visual Macro User Manual | 156/176
BiX | %Visual Macro
User Manual
Viewing Conditional Formatting inside %Visual
After selecting the desired method for the conditional formatting, %Visual Viewer window displays the colors as
in the following figure:
Scrolling down or up observations will continue to display the colored values accordingly. If you wish to view the
values which colors are based on, highlight again the variable and select the "Conditional Formatting" option
from the pop menu. You can now view or modify your previous selections. Conditional formatting definitions are
kept along filtering the data or drilling down using the "Frequency Drill-Down" or "Univariate Drill-Down".
BiX | %Visual Macro User Manual | 157/176
BiX | %Visual Macro
User Manual
Viewing Conditional Formatting inside Excel2010
Reporting on a section of the table which has a conditional formatting rule on one or more of the variables, will
automatically use those colors also in the output documents as displayed in the following example of an
Excel2010 spreadsheet:
A legend describing the values of each color will be also automatically produced and will be placed in a separate
sheet inside the Excel2010 workbook as displayed in the following figure:
If one of the Excel2010 coloring options was selected, then the values inside Excel2010 will be displayed using
standard Excel2010 colored symbols as displayed in the following figure:
BiX | %Visual Macro User Manual | 158/176
BiX | %Visual Macro
User Manual
Multiple Conditions
Multiple and different condition can be applied to each of the numeric variables inside %Visual Viewer window as
displayed in the following figure. "Actual Sales" was assigned the gradient color option while "Predicted Sales"
was assigned the Mean & Std method.
BiX | %Visual Macro User Manual | 159/176
BiX | %Visual Macro
User Manual
Reporting this example into Excel2010 produces the following result
BiX | %Visual Macro User Manual | 160/176
BiX | %Visual Macro
User Manual
And a legend page in the second sheet (All legends are grouped into one sheet):
BiX | %Visual Macro User Manual | 161/176
BiX | %Visual Macro
User Manual
Sorting Data
Overview
Sort Options
Clear Sorting
Overview
Data in %Visual Window can be sorted (Without modifications to the original data set). Highlight the variables
(one or more) to sort. If the variables are not adjacent, you can first use the "move column" option from the pop
menu to move the desired column(s) to a new place in the table. Sorting is usually needed when you would like
to view the high (or low) values on the top observations.
Sorting is done on the entire table starting from the leftmost selected variable. After selecting the "Sort..." option
from the pop menu, the "Sort Options" window will be opened.
Sort Options
The "Sort Options" window allow to define the sorting order on each selected variable as displayed in the
following figure.
In addition to setting the sorting order you can ask for "Nodupkey" sorting option that eliminates duplicate keys
observations to be displayed. If the "Nodupkey" option has been selected, then the background color of the
observations is changed to the color of "Filtered Data" color (This color can be set using the "Viewer Attributes..."
pop menu option)
BiX | %Visual Macro User Manual | 162/176
BiX | %Visual Macro
User Manual
Warning: Sorting large data sets might require high computing resources.
Clear Sorting
The "Clear All Sorting" pop menu option from "%Visual Viewer" Window will restore the data set to its original
state.
BiX | %Visual Macro User Manual | 163/176
BiX | %Visual Macro
User Manual
Jumping to Start/End of Data
If the data set is large (Many observations) then a more efficient way to scroll down to the last or first observation
is by using the "Goto" pop menu options.
At the first time, the operation may take a while but afterwards jumping to the first or last observation will be done
very quickly.
BiX | %Visual Macro User Manual | 164/176
BiX | %Visual Macro
User Manual
Moving Columns
Moving columns is used to organize the columns in your specific order preference. There is an alternative way to
organize the variable by using the "Select Variables..." window.
You can move one or more columns simultaneously as described in the following procedure:
First highlight the column(s) to be moved and select the option "Move Column" from the pop menu. Then
highlight the variable that your moved columns will be inserted after, and select the option "Move Column After".
BiX | %Visual Macro User Manual | 165/176
BiX | %Visual Macro
User Manual
Copy Data to Clipboard
Highlight a section of the window as in the following figure: (Tip: You can also highlight the entire table by
selecting the left top cell).
Then by selecting the "Copy To Clipboard" menu option, you can now paste the data into other compliant
Windows applications like Excel, Access and many more who can paste a tab delimited data file stored in the
Cut & Paste buffer
Cutting & Pasting data using this method is a very quick and simple method, yet it does not keep coloring and
other attributes of the data.
BiX | %Visual Macro User Manual | 166/176
BiX | %Visual Macro
User Manual
SAS Variables names are automatically inserted into the first line of the pasted text.
BiX | %Visual Macro User Manual | 167/176
BiX | %Visual Macro
User Manual
Save as SAS Data set
Highlight a section of the Viewer Window. Then by selecting the "Save as SAS Data set" menu option, you can
now save the data into a new SAS Data set.
You can save a new data set only to those libnames that are not have the "read-only" access method namely:
the Work, Sasuser and other read/write libnames defined in your SAS session. You must supply a Data set
name (A valid SAS name) and optionally, supply a label for the data set.
BiX | %Visual Macro User Manual | 168/176
BiX | %Visual Macro
User Manual
Column's Properties
The Variable Tab
The Format Tab
The Meta-Data Tab
The Variable Tab
The variable tab shows administrative information about the variable.
BiX | %Visual Macro User Manual | 169/176
BiX | %Visual Macro
User Manual
The Format Tab
If the variable has a user-defined format associated with, then the values of the format are displayed in this tab.
You can also clear (dis associate) the format from the variable or select a different format to be associated with
the variable. This is usually needed if, for example, you need to do a frequency drill down by year for a date
variable.
User defined formats are grouped into SAS catalogs. SAS has a specific system option “fmtsearch” that tells
SAS where these catalogs are and in what order to search them in order to find the specific format. (This is
important if you have several formats with the same name located in several catalogs).
Example of “fmtsearch” option setting:
Option
Fmtsearch = (work
sasuser
project1.myfmt
project2.fmt
library);
If you do not specify the catalog name, SAS assume a default name: “formats”. If no specific setting is applied in
your SAS session then the default setting for the fmtsearch option is (work library). (“library” libname should be
assigned).
In the above window, you can click on the “…” pushbutton to view the current setting of this option in your
session.
BiX | %Visual Macro User Manual | 170/176
BiX | %Visual Macro
User Manual
To select a different format for the column display in %visual viewer, (SAS supplied or User Defined), select the
third option, and push the “…” pushbutton. This will display %visual “Select format” window as displayed in the
following figure:
Formats are grouped into two main categories: “SAS Formats” and “User Formats”. Under the “SAS formats”
category you will be able to select one format out of many most commonly used SAS supplied format. Some of
SAS formats let you control the total width and decimal places for your selection.
Under the “User Formats” category, you will be able to view each of the catalogs assigned in the “fmtsearch”
system option of your SAS session. Select one of the catalogs to view its contents.
Note: SAS formats and user defined formats can be of numeric or character type. The window shows only the
type of formats applicable for the type of the selected variable in the %visual viewer.
Before selecting a user defined format you can examine its values by clicking on the right mouse:
The content of the format is displayed in the following window:
BiX | %Visual Macro User Manual | 171/176
BiX | %Visual Macro
User Manual
You can copy the format’s values to the clipboard, to a new SAS data set or to a report using %visual document
management system.
BiX | %Visual Macro User Manual | 172/176
BiX | %Visual Macro
User Manual
The Meta-Data Tab
The Meta-Data tab shows information stored in BiX Meta-Data server.
(Requires a separate license)
BiX Meta-Data consists of two sections:
1) Variable hierarchy – organizes the variables of a data set in a hierarchy that resembles business logic
instead of alphabetic order.
For example, variables like “street” “city” can be grouped together under the hierarchy “Home Address”
instead of being displayed apart one from the other according to their alphabetic order. The hierarchy of
variables can be in viewed in several %visual windows.
2) Business Meta-Data – data about each variable like the formula used to calculate it, its role in the system
and whatever you may think is important to know about the variable. This text is displayed in the above
window.
Metadata can be “public” shared by all %visual users on the same server (typically set by %visual
administrator) or a “private” metadata set by yourself for your own private use.
BiX | %Visual Macro User Manual | 173/176
BiX | %Visual Macro
User Manual
Viewer Properties
The "Viewer Properties" window allows to select your choice of colors and settings for "%Visual Viewer" Window.
The columns tab
The Colors Tab
You can save your settings to your %Visual profile, thus, each time a "%Visual Viewer" Window will be opened,
It will use the settings from your profile.
BiX | %Visual Macro User Manual | 174/176
BiX | %Visual Macro
User Manual
Save as Profile
Each time you need to save the current settings of “%visual viewer” you can save these settings as a named
profile. Next time you invoke %Visual, you can use the profile to place you in the same settings again.
The settings that are being saved include:
1)
2)
3)
4)
5)
All filters (Simple or Advanced) applied to the data set
All drill downs (Frequency and/or univariate)
Selected variables (freeze and/or display)
All conditional formatting
All sorting
The profile is saved per user in his own SASUSER libname. Each profile is connected to a specific data set and
each data set can have multiple profiles for different purposes.
In order to open a data set using a predefined profile, invoke the %visual macro with no parameter. This will
launch the “Select Data Set” window where you can select a profile to be loaded.
BiX | %Visual Macro User Manual | 175/176
BiX | %Visual Macro
User Manual
Your Turn
Your feedback is important to us. If you have comments or suggestions about BiX %Visual Viewer, we'd like to
hear from you.
Send your comments to: [email protected]
Thank you for using a BiX product
BiX | %Visual Macro User Manual | 176/176