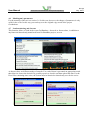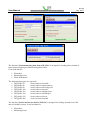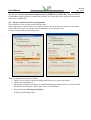
1
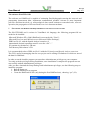
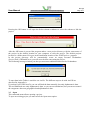
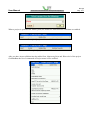
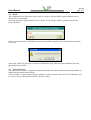
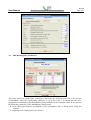
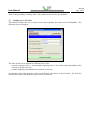
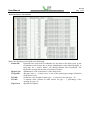
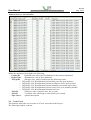
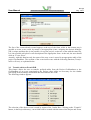
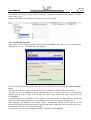
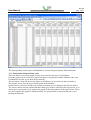
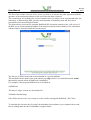
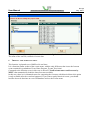
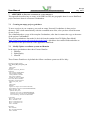
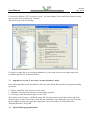
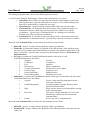
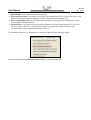
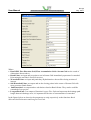
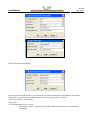
User Manual
Environment and Sustainable Development Department
Rev.00
Pag. 1/51
HALTFLOOD: USER MANUAL
The product called HALTFLOOD was produced by Research on Energy Systems - RSE S.p.a. and
the work has been financed by the Research Fund for the Italian Electrical System under the
Contract Agreement between RSE and the Ministry of Economic Development - General
Directorate for Energy and Mining Resources.
Warranty and Limitation Liability: The product is delivered as it is, without any guarantee. The
authors, RSE S.p.A. or the Research on Electrical System itself, may not be considered, at any rate,
responsible for direct or indirect damages deriving from the use of this product or from the
impossibility to use it.
Support service: The product is delivered together with a “User Guide” and no further
documentation is expected.
Use restrictions:
Recipient may use the software HALTFLOOD for company purposes and may not grant rights to
use it to any other individual or entity.
User Manual
Environment and Sustainable Development Department
Rev.00
Pag. 2/51
Index
1
2
3
4
5
6
7
Software and hardware requirements and installation guide .......................................................3
The menu system .........................................................................................................................5
The project menu .........................................................................................................................5
3.1
Data Schemes .......................................................................................................................5
3.2
New ......................................................................................................................................5
3.3
Open .....................................................................................................................................6
3.4
Delete ...................................................................................................................................8
3.5
Watershed data.....................................................................................................................8
3.6
Edit Muskingum’s parameters .............................................................................................9
3.7
Loading curve XY dams ....................................................................................................10
3.8
Create Event .......................................................................................................................12
3.9
Transfer tables to Event’GDB............................................................................................13
3.10 Load monitoring data .........................................................................................................14
3.11 Plot/transfer historical time series......................................................................................15
3.12 Create a Forecasts’DataBase..............................................................................................17
3.13 Visualize basin model map ................................................................................................17
The events menu ........................................................................................................................19
4.1
Select an Event...................................................................................................................20
4.2
Clean Event’sGDB.............................................................................................................20
4.3
WaterShed Data .................................................................................................................20
4.4
Dam options .......................................................................................................................21
4.5
Withdrawal options ............................................................................................................22
4.6
Muskingum’s parameters ...................................................................................................24
4.7
Load monitoring and forecast ............................................................................................24
4.8
Execute rainfall-runoff forecasting model .........................................................................27
4.9
Compute flow routing ........................................................................................................30
4.10 Forecast graph at Monitoring points ..................................................................................31
4.11 Graphs of forecasts at reservoirs ........................................................................................32
4.12 Forecasts and historical data comparison...........................................................................33
The update data menu ................................................................................................................35
The real time forecasts menu .....................................................................................................38
APPENDIX A: Getting started on a new project.......................................................................39
7.1
Creating an empty project geodabase ................................................................................39
7.2
Modify/Update coordinate system and Domain ................................................................39
7.3
Append new record, if necessary, in some dictionary tables ...........................................40
7.4
Upload initial geographical data ........................................................................................40
7.5
Upload initial alphanumeric data .......................................................................................43
7.5.1
Configuration data......................................................................................................43
7.5.2
Time Series ................................................................................................................43
7.6
Methodology for determining the hydro network and the schematic network .................45
User Manual
Environment and Sustainable Development Department
Rev.00
Pag. 3/51
The software HALTFLOOD
The software tool HaltFlood, is capable of estimating flood hydrograph entering the reservoir and
propagating downstream dam, implements mathematical modules relevant to most important
processes and data involved e.g. meteorological data, runoff estimate at watershed scale, reservoir
operation, the propagation of forecast floods over river downstream dams.
1
SOFTWARE AND HARDWARE REQUIREMENTS AND INSTALLATION GUIDE
The HALTFLOOD tool is written in VisualBasic 6.0 language, the following programs/OS are
needed to be installed:
Microsoft Windows XP o 2000 (Haltflood is not tested with “Vista”);
Microsoft Excel.exe and MSAccess.exe (Microsoft Office Package);
ESRI ArcGis 9.2 with the Spatial Analyst extension (*)
international decimal separation must be set to the “dot” “.”
PC pentium 4 with almost 1 GB ram
Free Memory Disk almost 2 GB
It is recommended to have ESRI ArcGis 9.2 with the 3D Analyst and Spatial Analyst extensions.
The GIS is useful in managing data for new project and in editing Geodatabase in which are stored
the data for Haltflood.
In order to run the installer program you must have Administrator privileges on your computer.
You only need the privileges during installation; once installation is complete the program can run
successfully without Administrator privileges.
After you have obtained the Setup Package and Administrator privileges, use the following steps to
install the program:
1. Run the Setup.exe
2. Run the HaltFlood.exe program
3. Create the HaltFlood.ini file (only during the first HaltFlood use), choosing “yes” (Si):
User Manual
Environment and Sustainable Development Department
Rev.00
Pag. 4/51
4. Choosing “Yes” it appears the following form
5. Verify the screen and international properties and setup the “EXCEL” and “ARCGIS
directory paths in your disk.
6. Then click “Ok”
It is also possible to update the data from the Project menu, choosing the option HaltFlood.ini
User Manual
2
Environment and Sustainable Development Department
Rev.00
Pag. 5/51
THE MENU SYSTEM
The menu system contains four menus to help you use the program. Each menu contains a list of
related commands.
The four menus are: Project, Events, Update Data, Real time forecasts.
• the Project menu contains a list of commands for open and managing projects, to update or
edit the geodatabase that is the container for all the different objects that form the complete
representation of the study area such: watersheds, dams, stream etc.;
• the Events menu contains a list of commands to run HaltFlood to study historical events;
• the Update Data menu allows, if available, to download from internet real time rainfall
forecast;
• the Real time forecasts menu contains a list of commands to run HaltFlood for real time
flood forecasting.
3 THE PROJECT MENU
As in the shown in the previous figure the project menu contains different menu commands.
3.1 Data Schemes
This command allows to input the schema code, given by the Forecast Office, for download the
rainfall forecasts from internet.
In Haltflood the schema is just a unique name that uniquely identifies a geographical area divided
into several sub-areas. If this name has been agreed with an Office that provides weather forecasts,
then the office can provide the average precipitation expected in the same sub-areas used by
Haltflood
In you don’t have the code you must insert one of your choice, but you cannot download the
forecasts from internet and you must enter the forecasts data manually.
To create a new project using the next command menu, you need perforce an existing scheme code
to link to the project. If the scheme list is empty it is impossible to create a new project.
3.2 New
This command menu allows creating a new project.
To create a new project you choose New . After this command is selected, the Create a New
Project window will open were you can input the name of new project.
User Manual
Environment and Sustainable Development Department
Rev.00
Pag. 6/51
Pressing the OK button it will open the Select scheme windows to select the scheme to link the
project.
After the OK button is pressed the program makes a new project directory with the same name of
the project in the default location on your computer to store the project. The default projects
location is a folder named \Progetti in the installation location of the HaltFlood.exe program.
In the project directory will be automatically create an empty Personal Geodatabase
(ProjectName_GDB.mdb) were you will store the date concerning the project.
This following message reminds you that you must enter additional data into the Geodatabase.
To enter data in the Tables is useful to use ArcGis. The different steps to do with ArcGIS are
described in Appendix A.
If you don’t have ESRI ArcGis you can still load the data manually, but only alphanumeric data.
The tool Haltflood uses only alphanumeric data, so you can run simulations, but you can not control
the congruence between geographical and alphanumeric data.
3.3 Open
This command menu allows opening a project.
To open an existing project you must select the Open menu option.
User Manual
Environment and Sustainable Development Department
Rev.00
Pag. 7/51
When a project is opened in the menu system, the menus for witch there are valid data are enabled.
Example of project without valid data of events
Example of project with valid data of events
After you have insert valid data into the tables Dam, MonitoringPoint and Watershed of the project
GeoDataBase the list of commands of Project menu will be enabled.
User Manual
Environment and Sustainable Development Department
Rev.00
Pag. 8/51
3.4 Delete
The command Delete allows the user to remove a project: this procedure requires attention as its
elimination is irrevocable.
Selecting the Delete option from the Project menu, a new window will be opened to choose the
project to delete:
If the user answers OK, a confirmation of the choice will be required, as the deleted data can not be
recovered:
Answering “Yes” (Sì), the project selected is deleted not only from the general database, but also
physically from the disk.
3.5 Watershed data
This option lets the user to assign the required parameters for each watershed previously defined, to
implement the rainfall-runoff model.
A new window is opened presenting the parameter values already stored in the Geo Database and
let, if necessary, to change them and save the new values.
User Manual
3.6
Environment and Sustainable Development Department
Rev.00
Pag. 9/51
Edit Muskingum’s parameters
This form shows the HydroCode, reading the data from the SchematicLink Tab of the project
GeoDataBase, when the TypeRouting parameter is set to the value 3 (it means that the wave
propagation is estimated by the Muskingum routing method). In the SchematicLink Tab are reported
the following parameters of the Muskingum-Cunge model:
- K, factor that approximately corresponds to the propagation time of flood waves along the
channel;
- X, weighting factor ranging between 0 and 0.5.
User Manual
Environment and Sustainable Development Department
Rev.00
Pag. 10/51
There is the possibility to change these values and store them in the geo-database.
3.7 Loading curve XY dams
This function allows the user to upload some data regarding the dams in the GeoDataBase. The
following form will appear:
The form let the user to upload two different Excel files:
- reservoir capacity curves + any automatic opening rules of the outlet works depending on the
water level in the reservoir;
- possible withdrawal standard curves from the reservoirs;
An example of the data structure of the two different excel sheets is shown below. The first line
contains the headers and the data begin from the second row.
User Manual
Environment and Sustainable Development Department
Rev.00
Pag. 11/51
ReservoirsCurves / CurveInvasi
Where the meaning of each field is the following:
- FeatureID:
HydroID code used in the Geodatabase for the dam or the outlet work. In the
Geodatabase each feature has a unique identification code called HydroID, to
load data for a certain feature you should indicate their HyodroID. The
HydroID is assigned at the time of creation of feature;
- HydroCode: alphanumeric code of the dam or of the outlet work;
- TbTypeID:
data type code (1 = volume curve; 8: rule of the opening percentage in function
of the water level);
- TbValX:
X abscissa value (height for data type = 1; water level for data type = 8)
- TbValY:
Y ordinate value (volume in cubic meters for type = 1; percentage of the
opening for type= 8)
- Tipo Curva: optional description.
User Manual
Environment and Sustainable Development Department
Rev.00
Pag. 12/51
WithdrawalCurves / CurvePrelievo
Where the meaning of each field is the following:
- FeatureID:
HydroID code used in the Geodatabase for the current withdrawal;
- HydroCode:
alphanumeric code of the withdrawal;
- TbTypeID:
data type code, which could assume the following values:
o TbTypeID =210: WaterDemand cyclical daily (one day, hour by hour)
o TbTypeID =220: WaterDemand cyclical weekly(one week, hour by hour)
o TbTypeID =230: WaterDemand cyclical monthly (one month, day by day)
o TbTypeID =240: WaterDemand cyclical yearly (one year, month by month)
o TbTypeID =250: WaterDemand constant each year
- TbValX:
X abscissa value (could be: time, day or year);
- TbValY:
Y ordinate value (discharge in cubic meters per second);
- Tipo Curva:
optional description.
3.8 Create Event
This function allows the user to create an “Event” associated to the Project.
The following window is shown:
User Manual
Environment and Sustainable Development Department
Rev.00
Pag. 13/51
The list of the events already created appears at the top of the form, while in the bottom part is
possible to create a new event, by means of an appropriate frame, assigning the desired identifier
(ID, is unique and therefore is not possible, for a given project, create two events with the same ID).
It is also possible add a brief event description in the appropriate form. At the end, the user should
click on “Create Event”
Actually, with this function only the name of the new event is stored in an appropriate table of the
project GeoDataBase. The creation of the event itself occurs with the following function (Transfer
tables to Event), as explained below.
3.9 Transfer tables to Event’GDB
This feature allows the user to transfer prefixed tables from the Project GeoDatabases to the
GeoDataBase of an event associated to the Project; these tables are necessary for the further
processing of the discharge and rainfall data associated to the event.
The following window appears:
The selection of the chosen event is made by means of the Combo Box. Clicking on the “Transfer”
button, in the Project directory, a new folder will be created with the name of the Project and Event,
User Manual
Environment and Sustainable Development Department
Rev.00
Pag. 14/51
in which the tool copy from the folder "Generali"a template Geodatabase and rename it with the
name of the event..
In this GeoDataBase, the folders previously selected will be copy.
3.10 Load monitoring data
This option let the user to upload in the project GeoDataBase the time series of precipitation,
discharge, levels, etc.. The following form appears:
The first step is the selection of the data file, you can find the file by clicking the "Select data file"
button.
The data file must be in excel format and have a fixed format, as shown in the figure below.
The first five rows are fulfilled with the identification data of each sub-basin and / or monitoring
stations and the type of data to be loaded: the codes must match with those reported in the
GeoDataBase.
In the subsequent rows (from line 6) are reported: in the first column, the date and hour, and in the
following columns the hourly data corresponding to the sizes of its respective header lines.
After choosing the datasheet (the combo will be automatically filled), if that data are in the
requested format, the program determines the different types of data and active options (in our case:
Precipitation, Water Levels, Outlet Discharge).
It is possible to see the file including the data by clicking on “See data file”.
User Manual
Environment and Sustainable Development Department
Rev.00
Pag. 15/51
The data uploading in the project GeoDataBase is activated by pressing the dedicated button.
3.11 Plot/transfer historical time series
This tool allows you to draw graphs of time series stored in the project Geodatabase.
From the graph you can select all or part of the data to copy them to another database (the event
Geodatabase) in order to use them for the analysis.
The tool opens a form like that in the figure in which there are two listview and a picturebox.
The listview in top, lists the types of data stored in the database.
In this listview, you can select the type of data (maximum two) to display in the listview below.
The listview below lists the stations that have data types as those selected in the top listview. You
choose up to a maximum of six stations: the graph of their data appears in the space below. When
you draw together the graph of rainfall and flow, the precipitation is represented by the y-axis
pointing downwards.
User Manual
Environment and Sustainable Development Department
Rev.00
Pag. 16/51
Pressing the “Transfer to the Events’GDB” button, it’s possible to copy data to a GeoDatabases
event, helped by the following mask, which allows, if you want, to limit the time range of data to
copy.
User Manual
Environment and Sustainable Development Department
Rev.00
Pag. 17/51
3.12 Create a Forecasts’DataBase
It allows to create a database event dedicated to real-time forecasts.
Under the project folder is created a folder called NomeProgetto_Evento_Previsioni, within which
the tool copy from the folder "Generali" a template Geodatabase to store real time data. In this
GeoDatabase all the needed data are copied from the GeoDatabase project.
3.13 Visualize basin model map
It allows to view the site map.
There are different opportunities to display, as shown by the menu items.
So it’s possible to open ArcGIS project on the current project or display by ArcExplorer o Quantum
GIS.
Please note that only with ArcGIS it’s possible to display data contained in GeoDatabase and
actually used by the program HaltFlood. ArcExplorer and Quantum GIS can display a copy of data
of GeoDatabase previously exported as shapefiles through ArcGIS.
Should be aware that, HaltFlood uses the data in the Geodatabase. If you change the geographic
data in the Geodatabase, shape files are no longer update on: this may necessitate the re-export to
shape files the features of the Geodatabase to see the update with ArcExplorer and Quantum GIS.
Below there is an example of displaying the map with ArcGIS.
User Manual
Environment and Sustainable Development Department
Rev.00
Pag. 18/51
In the absence of the program ArcGIS (in which case the corresponding menu item is disabled) is
possible to view the map through ArcExplorer.
ArcExplorer, to store map informations, uses a project file called myname. Axl.
To open directly from HaltFlood the name’s map of ArcExplorer must be myname.axl = Name of
Project + “_mappa.axl "(in our case: Adige_mappa.axl) and must be located in the same folder
where is the current project GeoDatabase.
Similarly , if there is a Quantum GIS installation, having created the relative project file on standard
name: Name of Project + “_mappa.qgs "
User Manual
Environment and Sustainable Development Department
Rev.00
Pag. 19/51
It must be remembered that, Quantum Gis unlike ArcExplorer , allows also to modify the data of
ShapeFiles, but this has no effect on the data of GeoDatabase used by HaltFlood. The geographic
data of GeoDatabase be changed only by ArcGIS, while the alphanumeric by Access.
4
THE EVENTS MENU
The processing are performed on the data contained in GeoDatabase event. The function “Events”
of the main menu has several items:
User Manual
Environment and Sustainable Development Department
Rev.00
Pag. 20/51
It is only after the selection of the event (option “Select an Event”) that the following options are
enabled.
4.1 Select an Event
The event is chosen by selecting the corresponding record in the window presented and confirming
the choice.
The name of the event s printed on the top of the screen:
4.2 Clean Event’sGDB
This option “cleans” the GeoDataBase event, eliminating any double data.
4.3 WaterShed Data
For each of WaterShed event, this mask allows to see or possibly change (saving changes) data of
WaterShed to use in the rainfall-runoff model applied to one event (in this way you can keep save
the original copy stored in the project Geodatabase.):
User Manual
Environment and Sustainable Development Department
Rev.00
Pag. 21/51
4.4 Dam options
It allows to change, for each of the dams included in the project, the display mode of calculation
form of the reservoir model, select the calculation step and select if outlet works must be opened
automatically when the water rises above a safety level.
User Manual
Environment and Sustainable Development Department
Rev.00
Pag. 22/51
Il the last column of each row you can see if you have selected the option to make the calculation
for the dam. The option is to put it in field “Subroutine” of the table SchematicNode the value
“Diga” (Dam). If you do not want to do the calculation you can choose the value
“SommaIdrogrammi” (sum hydrographs).
Note that the rainfall-runoff model is set to run the calculation with time step of one hour and this
step provides the inlet discharges to the reservoir. If the rate of change in the level of the reservoir
is small during one hour, is recommended to choose for the reservoir model the hourly time step.
However, if the reservoir volume is small compared to its discharge capacity (eg in case of Barrage)
it’s necessary to use a smaller time step calculation. In this way the model, can apply, with adequate
time step, the rules of operation of discharges included in the geodatabase and update the degree of
opening of floodgates to adapt them to rapid changes in the level.
4.5
Withdrawal options
This functions allows to select options concerning the withdrawal from the intake works of the dam.
Selecting it activates the mask below.
User Manual
Environment and Sustainable Development Department
Rev.00
Pag. 23/51
The mask shows the list of the intake works presented in the geodatabase and for each is possible to
choose a curve sampling.With the yellow button at the bottom right is possible to activate the graph
of standard curves loaded into geodatabase.
User Manual
Environment and Sustainable Development Department
Rev.00
Pag. 24/51
4.6 Muskingum’s parameters
For the meaning of the tool see section 3.6. In this case, however, the change of parameters is only
valid for the event. In this way you can keep save the original copy stored in the project
Geodatabase.
4.7 Load monitoring and forecast
This function allows to load in the event GeoDatabase, observed or forecast data , in addition to
any historical data already transferred from GeoDataBase project, as seen.
As shown, there are different modes of transfer. For each of them is presented an appropriate mask
that allows to choose the desired file, possibly open it to check it and then upload the data. For the
Excel files containing time series, the format must be identical to that already seen for the series.
User Manual
Environment and Sustainable Development Department
Rev.00
Pag. 25/51
The function “Load monitoring data from a XLS file” is designed for loading observed data of
hydro-meteorological provided from Regional Office.
It can load data for:
•
•
•
Watershed
Monitoring Point
Water Withdrawal
The following data types are expected:
• TSTypeID=70
: hourly observed rainfall
• TSTypeID=80
: hourly observed temperatures
• TSTypeID=90
: hourly observed freezing level
• TSTypeID=100
: hourly observed runoff
• TSTypeID=110
: hourly observed height snow
• TSTypeID=120
: hourly observed discharges
• TSTypeID=130
: hourly observed levels
• TSTypeID=200
: observed water demand
The function “Load rain forecast from a XLS file” is designed for loading, instead of xml file,
data of rainfall forecasts. It can load data for:
•
•
Watershed
Monitoring Point
User Manual
Environment and Sustainable Development Department
Rev.00
Pag. 26/51
The following data types are expected:
• TSTypeID=71, 72, 73
: hourly rainfall forecast (min, mean, max)
• TSTypeID=81, 82, 83
: hourly temperatures forecast (min, mean, max)
• TSTypeID=91, 92, 93
: hourly freezing level forecast (min, mean, max)
• TSTypeID=101, 102, 103 : hourly calculated runoff (min, mean, max)
• TSTypeID=111, 112, 113 : hourly height snow forecast (min, mean, max)
• TSTypeID=121, 122, 123 : hourly calculated discharges (min, mean, max)
• TSTypeID=131, 132, 133 : hourly calculated levels (min, mean, max)
The function “Load Dams time series from a XLS file” is designed for observed data of dams.
It can load data for:
•
•
•
Water Withdrawls Dams
Monitoring Point
Outlet Works Dams
The following data types:
• TSTypeID=70
• TSTypeID=80
• TSTypeID=90
• TSTypeID=100
• TSTypeID=110
• TSTypeID=120
• TSTypeID=130
• TSTypeID=200
• TSTypeID=300
• TSTypeID=400
: hourly observed rainfall
: hourly observed temperatures
: hourly observed freezing level
: hourly observed runoff
: hourly observed height snow
: hourly observed discharges
: hourly observed levels
: observed water demand
: hourly level demand
: hourly opening percentage discharges demand
The function “Load reservoir flood rountig plan from a XLS file”is designed for loading data of
reservoir flood rountig plan prescribed by control authority for the:
•
Dam
The following types of routing plans:
PrTypeID PrCode
1
EMPTYING
2
3
4
CLOSING
FILLTOLEVEL
RELEASEFROMLEVEL
5
RELEASETOLEVEL
6
AUTOMATIC
Description
Emptying the reservoir up to a given level
in a given time and with a flow rate limit
Closing outlets
Fill the reservoir up to a given level
Release a given discharge when it reaches
a given level
Release a given discharge
until you reach a given level
Sets gates in automatic mode
User Manual
Environment and Sustainable Development Department
Rev.00
Pag. 27/51
The function “Load rain measures and forecasts by WEB (from a XML file)”allows to load, in
GeoDataBase, observed data of rainfall and forecasts on various sub-basins acquired from Internet
in the form of XML files.
4.8 Execute rainfall-runoff forecasting model
The tool allows you to run the rainfall-runoff model.
If the study area was divided into several sub-watershed the model runs for each sub- watershed.
At the end the tool store the results in the GeoDatabase of the current event.
Is first presented with the following mask:
Then it’s important to operate as follows:
• Choose if you want run the model using rainfall forecast or observed rainfall
• Choose the starting date of
• Specify data from previous hours of rainfall and discharge that are used to assess the initial
condition of soil moisture (values shown here are the default).
•
Press the button “Check previous data”.
It shows the following Table:
User Manual
Environment and Sustainable Development Department
Rev.00
Pag. 28/51
It shows if there are the necessary data for calculating the model.
If at some point were present monitoring less data than needed (in the Table are marked in red those
Monitoring Point for which data must exist), it’s possible to enter them manually:
- select desired record;
- press button “Entering values manually”;
- enter desired value in dedicated mask.
- confirm the operation.
•
Press the button “Determines the initial conditions”.
User Manual
Environment and Sustainable Development Department
Rev.00
Pag. 29/51
It shows the following Table:
This operation also enables the lower current mask, with the frame "Model", initially disabled:
•
Choose the option “Show results”, then press “Run Model” .
It is presented the following mask, which gives the performance graph of the forecasts of rainfall
and discharge in different sub-basins (Watershed), the black vertical line indicates, in this as in
other similar graphics, the "actual" start of the forecasts.
•
If calculated data are incorrect, is possible store them in GeoDataBase. Select the option
“Store results to the GDB”, then press “Run Model”.
User Manual
Environment and Sustainable Development Department
Rev.00
Pag. 30/51
4.9 Compute flow routing
Is first asked to choose the date of the forecasts for which make the network calculation:
Pressing the button “Execute”, the program reads data of the network scheme from the database
and the inflow hydrograph to the network itself, and then calculates their propagation and sums the
inflows at different nodes. In case a node of this network is a reservoir, it enables the calculation
module for calculating the transition in it and the resulting flow downstream.
If in the options of the dams, the user has chosen to display the calculation, when the calculation of
a reservoir is enabled, the following mask will be opened for each dam:
Pressing the button “Perform Calculation”, the program reads data from the database of the dam
and performs the calculation of transition in the reservoir and the resulting flow downstream.
User Manual
Environment and Sustainable Development Department
All the results are stored in the database.
4.10 Forecast graph at Monitoring points
It allows to obtain the graph of the inflows and outflows to the measuring stations of type
"hydrometer" and "reservoir".
Rev.00
Pag. 31/51
User Manual
Environment and Sustainable Development Department
Rev.00
Pag. 32/51
For the current measurement station, the frame “Tresholds”, at the bottom right of the mask,
appear, if there are, certain threshold values of flows, which can be indicated on the graph.
You can add or remove a line on the graph that shows the threshold by selecting or un-selecting the
relative name on the list. These threshold values are stored in the table CurveXY GeoDatabases
Project.
If the frame “Contributions to the flow” is enabled, as in the case stated above, is also possible to
see on the graph (with dotted line) the contribution of flow, at the current station, due to individual
discharges of dams upstream. Is necessary to activate the function, selecting the appropriate check,
and then select, from dedicated Combo Box, the contribution wanted.
4.11 Graphs of forecasts at reservoirs
This option opens a mask where there are two graphs, both related to measured and forecast data
about reservoirs. The top graph shows the rainfall and flow (both in and out), while in the bottom
graph appear the levels of the reservoir, in conjunction with the maximum level of regulation and
the maximum level of reservoir.
User Manual
Environment and Sustainable Development Department
Rev.00
Pag. 33/51
4.12 Forecasts and historical data comparison
The choice of this option opens the following mask, where, for each Monitoring Point, is possible to
have a comparison, for each date of the forecast start, between historical data (black line) and those
forecasted by the models (colored lines ).
User Manual
Environment and Sustainable Development Department
Rev.00
Pag. 34/51
In this graph you can also show threshold values and contribution flows due to upstream reservoirs.
(see “Graph of forecasts at stations”).
If Monitoring Point is a type "Reservoir", the frame “Graphs of reservoir” is enabled, in which case
is possible to graph both the inflows and the outflows, or only the inflows, and finally the levels:
User Manual
5
Environment and Sustainable Development Department
Rev.00
Pag. 35/51
THE UPDATE DATA MENU
This function is developed to allow users to download by Internet data of monitoring networks
external to own organization.
Assuming, in current version, that the program is installed by a reservoir owner which uses their
own measurements of inflow and reservoir level and upload them into the Geodatabase through the
Project menu (for historical events) and Events (in case of an event in real time) organized as Excel
files, the function “Update Data” is designed to update the other data types, so:
•
Data of hydrometric network of stations located upstream and especially downstream of the
dam;
• Data of rainfall measures and average forecast on the sub-basins of geographic area where
the dam is located.
The “Update Data” function is therefore divided into two menus:
• Check for updates hydrometric monitoring
• Control measures and forecasts updates by web
User Manual
Environment and Sustainable Development Department
Rev.00
Pag. 36/51
The first of two menus is not yet active, and it’s possible to it activate only after agreement with the
operators of the monitoring network of the area where the dam is located.
The second menu is activated in the event of sample basins, for which, on an experimental basis, the
Laboratory of Meteorology RSE, provides measurements of rainfall by radar and forecasts of
precipitation from meteorological model.
The menu allows to activate the program HaltFlood-WS client that connects to the web.service of
the RSE server and download the update of the measures and forecasts available of the calculation
scheme which is associated with the current project.
The files are in XML format and are downloaded in a special subfolder.
This subfolder has the name of the code scheme (eg adige) and it is in a subfolder named wsdati
that must be present in that of HaltFlood’s installation.
For example, if the program HaltFlood.exe is installed on:
d:\HaltFlood
The data of “adige” scheme are downloaded in:
d:\Haltflood\wsdati\adige
If the folder doesn’t exist, is necessary to create it before running the HaltFlood –WS Client.
To calculate the forecasts, the first task is downloading forecast data to your computer the second
task is loading them into the GeoDataBase using the menu:
User Manual
Environment and Sustainable Development Department
Rev.00
Pag. 37/51
Events \ Load monitoring and forecast \ Load rain measures and forecasts by WEB (from a XML
file)
In the figure below, is possible to choose if upload past measures: this option is recommended in
real-time analysis to always have the latest update, however, if analysis of historical events, whose
measurement data are already in the geodatabase, is possible to omit loading them to speed up
processing.
When you make a new loading data, is recommended to overwrite any old data in the geodatabase.
User Manual
Environment and Sustainable Development Department
Rev.00
Pag. 38/51
In the picture above, for example, is loaded a forecast in “adige” scheme, on November 23, 2002.
The name of the xml file, estimates forecast date.
6
THE REAL TIME FORECASTS MENU
This function is planned to use HaltFlood in real time.
It is a function similar to that of the events menu, with the only difference that it uses the forecast
event contained in geodatabase Event Name Progetto_Evento_Previsioni.
Compared to the function event, in this case is choosed "Load rain measures and forecasts by
WEB ” that automatically loads the latest forecasts available.
In this case, there isn’t commands menu for comparing the forecasts with historical data: this option
is only available after the event has happened. If you want to study historical events, you should
load the observed data into an event Geodatabase and use the Events menu.
User Manual
Environment and Sustainable Development Department
Rev.00
Pag. 39/51
7 APPENDIX A: GETTING STARTED ON A NEW PROJECT
This appendix describes how to create, with ESRI ArcGIS, the geographic data for a new HaltFlood
project and store them in a Personal Geodatabase.
7.1
Creating an empty project geodabase
To store a project in you computer, you need an empty Personal Geodatabase in then project
directory : this is done automatically with the command menu New, after you have insert the name
of new project.
The command makes a copy of the template Geodatabase, after that it renames the copy as the name
of the project GeoDataBase.
The project geodatabase data model is derived from the standard ArcGIS Hydro Data Model
(http://www.crwr.utexas.edu/giswr/hydro/index.html) which have been added fields and tables to
take account of the special needs of the application HaltFlood.
7.2
Modify/Update coordinate system and Domain
In the empty geodatabase there three Feature DataSet:
1. Drainage
2. Hydrography
3. Network
These Feature DataSet are by default the follow coordinate system useful for Italy:
Projected Coordinate System:
Name: WGS_1984_UTM_Zone_32N
Alias:
Abbreviation:
Remarks:
Projection: Transverse_Mercator
Parameters:
False_Easting: 500000.000000
False_Northing: 0.000000
Central_Meridian: 9.000000
Scale_Factor: 0.999600
Latitude_Of_Origin: 0.000000
Linear Unit: Meter (1.000000)
Geographic Coordinate System:
Name: GCS_WGS_1984
Alias:
Abbreviation:
Remarks:
Angular Unit: Degree (0.017453292519943299)
Prime Meridian: Greenwich (0.000000000000000000)
Datum: D_WGS_1984
Spheroid: WGS_1984
Semimajor Axis: 6378137.000000000000000000
Semiminor Axis: 6356752.314245179300000000
Inverse Flattening: 298.257223563000030000
X/Y Domain:
Min X: -1387362.287268
Min Y: 2445888.317314
Max X: 213361002.212733
Max Y: 217194252.817315
Scale: 10.000000
M Domain:
Min: 0.000000
Max: 2147483645.000000
Scale: 1.000000
User Manual
Environment and Sustainable Development Department
Rev.00
Pag. 40/51
If you need a different “XY Coordinate system”, you must change it for each Feature Dataset. In this
case you also need to change the “Domain”.
This can be done with ArcCatalog.
If you have a shape file or an existing geodatabase of your study area you can simply import the
coordinate and the X/Y,Z domains from it.
7.3
Append new record, if necessary, in some dictionary tables
In the following tables of the geodatabase, there are some initial data needed for subsequent loading
operations:
TSType: table that lists the types of time series
TSQuality: table that lists the types of data quality acquired
CurveType: table that lists the types of curve XY
These tables, in the Progetto_GDB.mdb empty file, already contain records that relate to the most
common types of data: if you want to load into the geodatabase more data types you must first enter
the description of these new types and assign them a univocal number of TSTypeID and/or
TSQualityID and/or TbTypeID.
7.4
Upload initial geographical data
User Manual
Environment and Sustainable Development Department
Rev.00
Pag. 41/51
The starting geographic data consist of the following feature classes:
In the Feature DataSet Hydrography: features that represent the river system
1. HydroEdge: these features are typically represented in hydrography as a blue line
and in general they represent such features as streams, rivers, canals and pipelines
that can be represented by a single line on a map.
2. HydroJunction : are the locations at which Hydro Edge intersect each other.
3. SchematicNode : the SchematicNode Point feature class contains the points in a
Schematic Network, which may represent any feature within an Arc Hydro
geodatabase. Typical types of SchematicNodes are: drainage area centroids,
drainage area outlets and stream confluences.
4. SchematicLink : are Polyline feature class that provide a connection between the
upstream noto to downstream node. Typically they represent a stream or a channel.
About the table SchematicNode, is listed below the meaning of some fields:
•
•
•
•
HydroID – integer: A unique feature identifier within a geodatabase.
FeatureID: it contains the number of HydroID of the HydroFeature from which the node
was created. This enables the SchematicNode to connect to the attribute information of the
feature it describes. Typical feature connected to the SchematicNode are Watersheds and
HydroJunctions.
SrcType: it contains the CodedValueDomain number of the type of node.
CodedValueDomain are the follow:
- 1
Sorgente
(Source)
- 2
Confluenza
(Confluence)
- 3
Foce
(Outfall)
- 4
Derivazione
(Water withdrawal)
- 5
Centrale idroelettrica
(Hydroelectric power plant)
- 6
Utenza Irrigua
(Irrigation user)
- 7
Utenza Industriale
(Industrial user)
- 8
Utenza Idropotabile
(Drinking water user)
Subroutine: it contains the CodedDomain number of the type of subroutine call at the node.
CodedValueDomain are the follow:
- 1
sorgente
(Source: input runoff hydrographs from the
connected watershed)
- 2
SommaIdrogrammi
(Sum hydrographs: sum the discharge from
upstream schematiclinks)
- 3
Diga
(Dam: call the dam tool performing flow routing
at the connected dam)
- 4
Diversion
(Diversion: call the subroutine Diversion that
calculate the outflow into the downstream
schematiclinks)
- 5
Utenza
(Users: sub. non yet implemented)
About the table SchematicLink you must note the meaning of some fields:
•
•
HydroID – integer: A unique feature identifier within a geodatabase
FromNodeID – integer: Indicates the HydroID of the SchematicNode at the upstream end
of the Link
User Manual
•
•
•
Environment and Sustainable Development Department
Rev.00
Pag. 42/51
ToNodeID – integer: Indicates the HydroID of the Schematic Node at the downstream end
of the Link.
LinkType: it contains the CodedValueDomain number of the type of node.
CodedValueDomain are the follow:
- 1
affluente
(tributary)
- 2
principale
(main river)
- 3
canale
(channel)
Subroutine: it contains the CodedValueDomain number of the type of subroutine call at the
link. CodedValueDomain are the follow:
- 1
traslazione
(transfer: trasfers the inflow hydrograph to the
downstream node unchanged)
- 2
Muskingum
(Muskingum: call the Muskingum subroutine to routing
the inflow hydrograph to the downstream node using
the Muskingum method)
- 3
IdrogrammaUnitario (Unit hydrograph: not yet implemented)
- 4
InvasoLineare
(Linear reservoir: not yet implemented)
The section 7.6 describes the proposed methodology for the creation of this set of data and
watershed below mentioned
Feature DataSet Hydrography
1. Dam : in contains the data of dams (NOTE: In the table Dam, are considered in the
simulation only those dams which is assigned the value of the field JunctionID that
defines the HydroJunction of the hydrographic network in which the work is
located);
2. MonitoringPoint : it contains data from the monitoring stations in the area
concerned. The stations must correspond to points where instruments are or where
you plan to save the results of calculation. (NOTE. For each reservoir which you
makes the simulation it is necessary to include at least two monitoring points: one
reservoir and one type Dam Outlet)
About the table MonitoringPoint you must note the meaning of some fields:
• HydroID – integer: A unique feature identifier within a geodatabase
• JunctionID: it contains the number of HydroID of the HydroJunction of the
HydroNetwork from which is related. This enables the MonitoringPoint to connect to the
attribute information of the SchematicNode that have the same value in the FeatureID
field.
• FtypeID – it contains the CodedValueDomain number of the type of Monitoring Station.
CodedValueDomain are the follow:
- 1
Streamgage
- 2
Reservoir
- 3
Dam Outlet
- 4
Rain Gauge
- 5
Snow gauge
- 6
Weather station
- 7
Avalanche safety
- 8
Other
User Manual
Environment and Sustainable Development Department
Rev.00
Pag. 43/51
Feature DataSet Drainage
1. Watershed : feature class which contains a landscape subdivision into selected
drainage areas, which drain to a point on a river network. It also contains the
calibrated parameters of rainfall-runoff Bucket model.
About the table Watershed you must note the meaning of some fields:
• HydroID – integer: A unique feature identifier within a geodatabase
• JunctionID: it contains the number of HydroID of the HydroJunction of the
HydroNetwork from which is related. This enables the Watershed to connect to the attribute
information of the SchematicNode that have the same value in the FeatureID field.
7.5
Upload initial alphanumeric data
Alphanumeric data I dati alfanumerici can be divided into:
Configuration data
Time series
7.5.1
Configuration data
Fields of Watershed feature class Campi dei watershed containing the calibration parameters of
Bucket model: these fields must be fill in (there is an automatic calibration tool that allow to
evaluate parameters from historical data. The tool for automatic calibration uses the geodatabase
of historical events)
Dam’s data
1. Fields of Dam table: as an example, the field values of QuotaMaxRegolaz;
QuotaMaxInvaso are used to show reference levels in the graphs
2. Table DerivazDighe : contains, for all dams, the data of intake works.
3. Table ScarichiDighe : contains, for all dams, the data of the outlet works.
4. Table CurveXY: contains, for all dams, the data of elevation-storage relationship,
curve of automatic outlet opening, curve of standard withdrawal from intake works.
5. Table TabSorveglianza: contains, for all dams, the data about how much open the
outlet works during the flood events;
6. Table TabRientro: contains, for all dams, the data of outlet works closure when the
flood decreases;
7.5.2
Time Series
The geospatial feature of the Arc Hydro data model describe the water environment, that is, the
physical environment through which water flows. Also important are the water properties at any
geographic location: precipitation, discharge and water surface elevation. These properties are
contained in the TimeSeries component of the data model.
The project Geodatabase contains observed time series. To perform the analysis we use a second
type of GeoDataBase: the event Geodatabase. We create an event Geodatabae for each event, where
an event is a time period within much precipitation falls, it causes runoff, which discharging along
successive streams can rapidly swell the flows of the main river. Then, in the main river flows
propagate downstream.
The Event geodatabase stores the rainfall forecast, calculated and observed runoff.
The data model of both geodatabase is expected that all time series are contained in table
TimeSeries, this have a relationship with other tables that are used to define the data type.
User Manual
Environment and Sustainable Development Department
Rev.00
Pag. 44/51
A list of time series in the geodatabase is as follows:
1. Observed data during various events of rainfall on each watershed;
2. Observed values of flow in the closing sections of river with streamgauge;
3. Observed values of inflow in reservoirs;
4. Observed values of water elevation in reservoirs;
5. Observed values of outflow from reservoirs.
The historical time series are listed by event according to a list contained in a schedule of events
(table TSEvent) and are related to a monitoring point (streamgauge, reservoir) or area (watershed)
The TimeSeries table has two key fields:
FeatureID: field that contains the value of HydroID of Watershed or MonitorigPoint wich is
related.
TSEventID: field that contains the value of TSEventID referred to the list in TSEvent table.
It is possible upload time series data from an excel sheet having the follow format.
The tool L’interfaccia takes care of assigning the proper TSEventID.
In the first five rows, there are the identification data of sub-basins and / or of monitoring stations
and the data type you want to upload: codes must match those in geodatabase.
In particular are important:
• HydroID: identification code of station or of sub-basin that must correspond to that presented in
Geodatabase respectively in:
column HydroID of the table MonitoringPoint
column HydroID of the table Watershed
• TSType: identification code of data type that must match to the field TSTyeID of the table
TSType
User Manual
Environment and Sustainable Development Department
Rev.00
Pag. 45/51
In subsequent lines (ie from the sixth row) are shown, in the first column, the date and hours and in
the following columns, relative hourly data correspond to the variables of respective header lines.
7.6
Methodology for determining the hydro network and the schematic network
The Arc Hydro data model provides a basic database design for water resources which describes
geospatial and temporal data on surface water resource features of the landscape.
The standard ArcGIS Hydro data model describes only natural water systems, and does not support
constructed water infrastructure: therefore the data model has been integrated by adding additional
tables and fields to meet the needs of HaltFlood.
One of the most important components Hydro Data model is the Network. This component contains
a water resources network of streams, rivers and the centerlines of water bodies. Its main purpose is
to describe the connectivity of water movement through the landscape.
The Network is contained in the Network feature dataset of Geodatabase. In this Feature Data Set
there are:
•
HydroNetwork is the principal feature class of this dataset: it is an ArcGIS geometric
network, whose components are HydroEdges and HydroJunctions. Water flows along
HydroEdges, and HydroEdges are connected by HydroJunctions. The Hydro Network
describes flow through rivers and streams, and the centerlines of waterbodies.
•
SchematicNetwork, which consists of the SchematicLink and SchematicNode feature
classes. These features are used to symbolise the connection of drainage areas to
HydroJunctions, and to provide a simplified view of water flow through the landscape.
About HydroNetwork it should be noted that there are two type of junction::
1. HydroJunction: junctions that may have particular behaviors and attributes and have
relationship to other feature in Geodatabase (hydro feature)
2. HydroNetwork_Junction: locations that are anonymous points on the network with no
attributes or user interests. These junctions are required only for the network connectivity.
In Hydro Data Model, the geographical points of reference are HydroJunction which in
geodatabase have a unique number named HydroID that is key field for relationtip to other objects
(the connection of any objects to the HydroJunction is obtained by inserting in the key field
JunctionID of the object the HydroID value of the related HydroJunction).
In particular are related to HydroJunction the features:
Watershed
MonitoringPoint
Dam
Creating a new project, you must choose a list of points of interest. For each point you need to
create a HydroJunction.
At the HydroJunction there may be works such as dams or points of interest where the runoff is
calculated (in this case it is a drainage point of watershed).
Once the HydroJunction of interest was selected in the network, the following steps need to be
done to create the necessary calculation scheme:
1. defining the watershed that have the closing section at these HydroJunction;
User Manual
Environment and Sustainable Development Department
Rev.00
Pag. 46/51
2. should be fill in the field JunctionID, of the Dam table, with the HydroID value of the
HydroJunction
3. Building the SchematicNetwork establishing the appropriate SchematicNode
SchematicLink and in particular:
o Creating a SchematicNode at each HydroJunction (will be nodes of type
confluence ScsType=2, except the final network node that will be of type outfall
ScsType=3) and fill in the field FeatureID with the HydroID value of relative
HydroJunction;
o Creating a SchematicNode at area centroids of watershed (will be nodes of type
ScsType=1 source) ) and filling the HydroID value of relative watershed in the field
FeatureID;
o Link with a SchematicLink the SchematicNode of type ScsType= 1 source to the
SchematicNode of relative drainage area outlet (the sequence of steps for finding the
SchematicNode of confluence is the following: 1) select the watershed related to the
initial SchematicNode using the key field FeatureID, 2) the field JunctionID of the
watershed contains the HydroID value of arrival HydroJunction and at this point
you can select the arrival SchematicNode searching where FeatureID= HydroID of
HydroJunction). This ShematicLink will be of type LinkType=1 tributary
(affluente).
o Link with a SchematicLink the SchematicNodes of type ScsType=2 confluence or
ScsType=3 outfall: This ShematicLink will be of type LinkType=2 main river
(principale)
For all these operations, is very useful to use the software for ArcGIS Arc Hydro Tools,
downloadable from the internet site of ESRI (http://www.esri.com/) in download area.
To use all the functions of the software, is necessary to have, for the same geographical area, a
digital terrain model, for example, is possible to use the IGM, or extract the part that affects the data
published by Consortium for Spatial Information (CGIAR-CSI ) on the digital model of the world
with step 90 meters produced by NASA Shuttle Radar Topographic Mission (SRTM) and
downloadable from the website http://srtm.csi.cgiar.org/Index.asp.
Having the terrain model, the hydrographic network and the software Arc Hydro Tools, it is
possible to do automatically using ArcGIS:
Automated perimetry of Watershed closed on sections of selected HydroJunction
The automatic creation of Schematic Node and Schematic Link
Below, it is shown the toolbar and a description of the data input and output menus used to perform
the two calculations above.
To perform the data preprocessing for the automatic perimeter of Watershed, you must perform the
calculations indicated in the submenus of the figure below:
User Manual
Environment and Sustainable Development Department
Rev.00
Pag. 47/51
Here are represented input/output data of menu Terrain Preprocessing.
Were:
Raw DEM is the original elevation grid (DEM) of the area;
AGREE Stream: are the vector hydrography lines of the area;
AGREE DEM: is output of AGREE, a surface reconditioning system for Digital Elevation
Models. The system adjusts the surface elevation of the DEM to be consistent with a vector
coverage. The system has been developed by Ferdi Hellweger at the University of Texas at
Austin in 1997. For a full reference to the procedure refer to the web link
(http://www.ce.utexas.edu/prof/maidment/GISHYDRO/ferdi/research/agree/agree.html).
DEM: is the input of Fill sinks function. If a cell is surrounded by higher elevation cells, the
water is trapped in that cell and cannot flow. The Fill Sinks function modifies the elevation
value to eliminate these problems. This input can be a copy of Raw DEM or, as in the example
above, a copy of AGREE DEM.
User Manual
Environment and Sustainable Development Department
Rev.00
Pag. 48/51
Hydro DEM: is the output of Fill sinks function;
Flow Direction Grid: is the output of the Flow Direction function. The values in the cells of the
flow direction grid indicate the direction of the steepest descent from that cell.
Flow Accumulation Grid: is an output and represents, for each points, the dimension in cells
for upstream contributing basin.
Stream Grid: is an output and represents the difference between points considered river cells
and basin cells, where river cells are those that have an upstream contributing area more
extensive than a typical threshold defined by the user.
For automatic perimeter of Watershed, run submenus shown in the following figure:
Input and output of menu Watershed Processing are represented below:
User Manual
Environment and Sustainable Development Department
Rev.00
Pag. 49/51
Where:
Raw DEM, Flow Direction Grid, Flow Accumulation Grid e Stream Grid are the result of
elaborations shown above;
Batch Point: are input and are points to set in Stream Grid immediately upstream of watershed
Point using the tool Batch Point Generation
Watershed Point: are input and particulary HydroJunction chosen like closing sections of
interest.
SubWatershed Point: are output and are the closing points in the centre of Stream Grid cells
more nearest to Batch Points.
SubWatershed: are output and are sub-basins closed to Batch Points. They can be used like
watershed of our project.
LongestFlowPath: is an output of function Longest Flow Path and represents the drainage path
longer than each drainage area; it’s important for the time of concentration of watershed.
In the figures below are descrive the parameters to assig respectively to the functions Batch
Subwatershed Delineation and Longest Flow Path.
User Manual
Environment and Sustainable Development Department
Rev.00
Pag. 50/51
Node/Link Schema genaration
On each node and each branch, is expected to be activated a subroutine of calculation: the possible
subroutines of calculation are different depending on the type of node or branch.
A list of possibilities is as follows:
Type nodes:
SchematicNode.ScrTye=source
o Subroutine=source : calculation of rainfall runoff model applied to corresponding
watershed.
User Manual
Environment and Sustainable Development Department
Rev.00
Pag. 51/51
SchematicNode.ScrTye=confluence and SchematicNode.ScrTye=outlet
o Default -Subroutine=SommaIdrogrammi : calculation of the sum, instantaneously of
the outflows of branches that converge in the node.
o Optional - Subroutine=dam : sum of inflows in the node and calculation of routing at
the dam that is in correspondence to the node.
Types of branches:
SchematicLink.LinkType=tributary
o Default - TypeRouting=translation : calculation of the outflows from the branch
like that inflows but translated in time for a number of hours identical to the value of
translation associated to respective field.
o Optional - TypeRouting=Muskingum : calculation of outflows from the branch with
Muskingum method using parameters Musking_K, Musking_X and NumSubReach
contained in respective fields.
Optional - TypeRouting=Unit Hydrograph : calculation of outflows from the branch with Unit
Hydrograph method using data represented in table UnitHydro.
SchematicLink.LinkType=principal
o Optional - TypeRouting=translation : calculation of the outflows from the branch
like= inflows translated in time of a numeber of hours identical to the value of
translation time associated to respective field.
o Default - TypeRouting=Muskingum : calculation of the outflows from the branch
with Muskingum method using parameters Musking_K, Musking_X e
NumSubReach contained in respective fields.
o
Optional - TypeRouting=Unit Hydrograph : calculation of the ouflows from the
branch with Unit Hydrograph method using data represented in table UnitHydro.