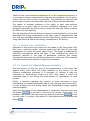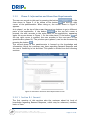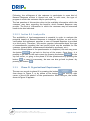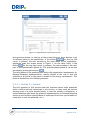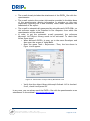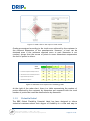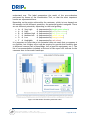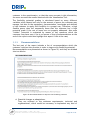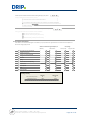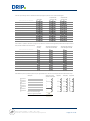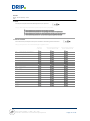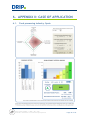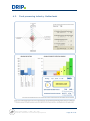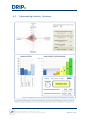
1
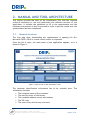
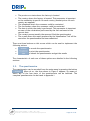
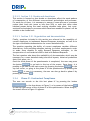
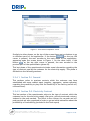
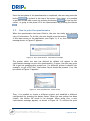
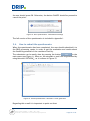
Environment Policy and Governance LIFE Programme Demand Response in Industrial Production [Life Project Number: 11 ENV / DE / 340] Action B4 Visualization Tool Guide User Manual Date: 03/12/14 PROPRIETARY RIGHTS STATEMENT This document contains information, which is proprietary to the DRIP Consortium. Neither this document nor the information contained herein shall be used, duplicated or communicated by any means to any third party, in whole or in parts, except with prior written consent of the DRIP consortium Title of the Deliverable Visualization tool guide (User Manual) Action B4 Task title Action title Definition of certification prerequisites Development of visualization tools Main Author Project partners involved RWE Action leader ECA Klingele, Campofrio Type (Distribution level) PU, Public CO, Confidential, only for members of the consortium (including the Commission Services) Status In Process In Revision Approved Further information www.drip-project.eu Life Project Number: 11 ENV / DE / 340 Action B.4. Definition of certification prerequisites - Page 2 of 50 - Index 1. INTRODUCTION 6 1.1. WHAT IS THE VISUALIZATION TOOL? 6 1.2. WHY DO WE NEED IT AND WHAT ARE THE BENEFITS? 6 1.3. WHO CAN USE IT AND BENEFIT FROM THE TOOL? 7 1.4. TO WHOM IS IT ADDRESSED WITHIN THE FACILITY? 7 1.5. WHAT TYPE OF INFORMATION IS REQUIRED? 7 1.6. HOW CAN I GET IT AND WHAT ARE THE SYSTEM REQUIREMENTS? 8 1.7. ONCE THE PRE-EVALUATION IS DONE, WHAT IS THE NEXT STEP? 8 1.8. TO WHOM I CAN CONTACT IF I NEED MORE INFORMATION? 8 2. MANUAL AND TOOL ARCHITECTURE 9 2.1. GENERAL STRUCTURE 9 2.2. THE QUESTIONNAIRE 10 2.2.1. Phase I: Technical and Organizational Requirements 11 2.2.1.1. Section A.I. General information 13 2.2.1.2. Section A.II. Data management, control and measuring 13 2.2.1.3. Section A.III. Use of energy and processes 14 2.2.1.4. Section A.IV. Load Profile 16 2.2.1.5. Section A.V. Demand Response Flexibility 16 2.2.2. Phase II: Information and Know-How Requirements 17 2.2.2.1. Section B.I. General 17 2.2.2.2. Section B.II. Load profile 18 2.2.3. Phase III: Organizational Requirements 18 2.2.3.1. Section C.I. General 19 2.2.3.2. Section C.II. Breaks and downtimes 20 2.2.3.3. Section C.III. Organization and documentation 20 2.2.4. Phase IV: Contractual Compliance 20 2.2.4.1. Section D.I. General 21 2.2.4.2. Section D.II. Electricity Contract 21 2.3. HOW TO PRINT THE QUESTIONNAIRE 22 2.4. HOW TO SUBMIT THE QUESTIONNAIRE 23 3. RESULTS 25 3.1. USEFULNESS OF THE RESULTS 25 3.2. HOW TO GET THE REPORT 25 3.3. HOW TO UNDERSTAND THE RESULTS: STRUCTURE OF THE REPORT 26 3.3.1. Radar chart Life Project Number: 11 ENV / DE / 340 Action B.4. Definition of certification prerequisites 26 - Page 3 of 50 - 3.3.2. Potential Label 27 3.3.3. Recommendations 30 3.4. EXAMPLES 4. 31 TERMS AND CONDITIONS OF USE: END USER LICENCE AGREEMENT 32 4.1. OWNERSHIP AND GRANT LICENCE 32 4.2. PROHIBITED USES 32 4.3. NO WARRANTY 33 4.4. LIMITATION OF LIABILITY 33 4.5. TERMINATION 34 4.6. DATA MANAGEMENT 34 4.7. MISCELLANEOUS 34 5. APPENDIX I: QUESTIONNAIRE 35 6. APPENDIX II: CASE OF APPLICATION 43 6.1. FOOD PROCESSING INDUSTRY. SPAIN 43 6.2. FOOD PROCESSING INDUSTRY. NETHERLANDS 45 6.3. PAPERMAKING INDUSTRY. GERMANY 47 6.4. LOGISTIC CENTRE FOR FOOD STORAGE AND DISTRIBUTION. SPAIN 49 Life Project Number: 11 ENV / DE / 340 Action B.4. Definition of certification prerequisites - Page 4 of 50 - Index of figures Figure 1. Main Screen of the Visualization Tool ..................................... 9 Figure 2. Questionnaire Selection Form ............................................ 11 Figure 3. Technical and Organizational requirements screen (I) ............... 11 Figure 4. Missing of essential information message (I) ........................... 12 Figure 5. Technical and operational requirements screen (II). Missing information ..................................................................... 12 Figure 6. Missing of essential information message (II) .......................... 13 Figure 7. Technical and operational requirements. Cross-sectional technologies .................................................................... 15 Figure 8. Technical and operational requirements. Production processes .... 15 Figure 9. Information and Know-How Requirements screen ..................... 17 Figure 10. Organizational requirements screen ................................... 19 Figure 11. Contractual Compliance screen......................................... 21 Figure 12. Print questionnaire. Confirmation message ........................... 22 Figure 13. Print questionnaire. Printer setup...................................... 22 Figure 14. Print questionnaire. Confirmation message ........................... 23 Figure 15. Submit questionnaire. Automatic e-mail generation ................ 23 Figure 16. Verification of object library MS Outlook 14.0 ....................... 24 Figure 17. Radar chart in the report of final results ............................. 27 Figure 18. Minimum score required for flexibility grades ........................ 27 Figure 19. DRIP Global Flexibility Potential Label ................................ 28 Figure 20. Recommendations to improve the flexibility potential ............. 30 Life Project Number: 11 ENV / DE / 340 Action B.4. Definition of certification prerequisites - Page 5 of 50 - 1. INTRODUCTION This document describes the VISUALIZATION TOOL developed in the framework of the project “Demand Response in Industrial Production” DRIP, providing with the necessary guidance to use it and understand the obtained results. 1.1. What is the Visualization Tool? Tool based on a questionnaire implemented in MS EXCEL ® for a preliminary evaluation of the flexibility potential (manageable power) of industrial customers The Visualization Tool is an application based on Microsoft EXCEL® designed to help industrial customers in the identification of the flexibility potential they may have, based on the abilities to manage their loads to get modifications in their usual pattern of energy consumption. The tool is based on a questionnaire divided into four parts. The questionnaire includes questions regarding technical and economic issues related to the energy consumption in the factory, how energy is used in the different processes or how suitable is the customer to implement some kind of Demand Response Actions. As a result, the Visualization Tool provides with a “DRIP Flexibility Label” which includes a Flexibility Grading, a preliminary estimation about the manageable power that the customer may have, based on the answers to the questionnaire, and some recommendations. 1.2. Why do we need it and what are the benefits? Free, easy-to-use and quick mechanism to get a first estimate of the suitability of industrial consumers to manage their loads and make a profit of this The evaluation of the flexibility of industrial customers is a complex task which requires a detailed study and analysis of the different processes, how they are linked, how much energy they consume during the time and which are the driving parameters of such consumption. This evaluation takes time and resources to the customer, who usually needs the support of an external consulting company. Consequently, this analysis is translated into a significant cost which uses to make customers reluctant to develop this kind of evaluation. The Visualization Tool is an easy-to-use mechanism by means of which industrial customers could obtain an initial estimation, even if rough, about the flexibility potential they may have. Based on the result of this analysis, Life Project Number: 11 ENV / DE / 340 Action B.4. Definition of certification prerequisites - Page 6 of 50 - customers may get not only an estimation about their current potential, but also a list of recommendations to improve it and become even more flexible. The more flexible is a customer, the higher is the benefit which can be obtained when such flexibility is put into the market. The time required to complete the questionnaire would be between one and two hours (depending on the knowledge of the person filling it in and the available information), just downloading the file from the internet, which is a significant advantage in terms of time and cost. 1.3. Who can use it and benefit from the tool? Any kind of small and medium industrial customer interested on load management and how it can provide with benefits The Visualization Tool has been designed to analyse the flexibility potential of small and medium industrial customers. Help from a specialized consulting company can be requested, but it can be directly used by the technical staff of the own industry. 1.4. To whom is it addressed within the facility? It should be handled by the head of maintenance of the facility with the support of someone from the department of quality It is recommendable that the questionnaire is filled in by the head of maintenance of the facility or someone with a deep knowledge on how energy is consumed in the different processes as the results obtained with the tool strongly depend on the accuracy of the information provided to the questionnaire. It is also highly recommendable the support of the quality department in order to assess the suitability of processes to be stopped or shifted depending on the impact it may have on production. 1.5. What type of information is required? Basically it is required technical information on the use of energy in the facility and knowledge, abilities and interest of the staff on load management The questionnaire is divided into four parts, and the information required to fill it in depends on the category of each of them: Technical and operational requirement. The information necessary for this part is referred to the energy consumption in the factory (electricity and others), what the main characteristics of the processes are, how energy is shared between the different processes and how the energy management is performed. Life Project Number: 11 ENV / DE / 340 Action B.4. Definition of certification prerequisites - Page 7 of 50 - 1.6. Information and Know-How requirement. This part requires information about the knowledge, abilities and interest of the customer on Demand Response. Organizational requirements. Information about the behaviour of processes according to the current schedule of work, the ability of employees to use and apply the flexibility to the processes and available documentation is required in this part. Contractual compliance. Finally, some basic concepts about the electricity contract of the factory are also required for this part. How can I get it and what are the system requirements? The tool can be downloaded from the DRIP project website. You will need MS Excel® 2010 to fill in the questionnaire and ACROBAT ® reader to see the results The questionnaire can be freely downloaded from the website of the project: http://www.drip-project.eu/downloads.html. The file is based on Microsoft EXCEL® 2010. ACROBAT® Reader is also necessary in order to open the report of results, which is sent by e-mail in pdf format once the questionnaire is submitted. 1.7. Once the pre-evaluation is done, what is the next step? A detailed study in the customer’s facilities is necessary to define and quantify accurately the full flexibility potential of the customer The Visualization Tool provides with a quick estimation about the customer flexibility potential based on the answers to the questionnaire, which may limit the accuracy of the obtained results. Therefore, and in-depth evaluation, based on detailed information of the customer obtained in a specific energy audit is necessary to define, quantify and evaluate his full flexibility potential. DRIP has also developed a Simulation Tool which could be used for this purpose. A free version of it is available in the website of the DRIP project (www.drip-project.eu) 1.8. To whom I can contact if I need more information? The Visualization Tool has been developed in the framework of the EU-Life+ DRIP Project, coordinated by RWE. In case you need more information you can contact: Thomas Theisen ([email protected]) RWE Deutschland AG - Kruppstr. 5, 45128 Essen (Germany) Website: www.drip-project.eu – email: [email protected] Life Project Number: 11 ENV / DE / 340 Action B.4. Definition of certification prerequisites - Page 8 of 50 - 2. MANUAL AND TOOL ARCHITECTURE This section provides the users of the Visualization Tool with the required technical assistance to use and understand the different sections of this application. It includes the guidelines to fill in the questionnaire and the necessary instructions on how to proceed in order to get the results once the questionnaire has been completed. 2.1. General structure The first step after downloading the questionnaire is opening the file. Microsoft EXCEL® 2010 or a most recent version is requested. Once the file is open, the main menu of the application appears, as it is shown in Figure 1. Figure 1. Main Screen of the Visualization Tool The customer identification information has to be included here. This information includes: The The The The The complete name of the consumer activity sector of the factory complete address (street and number) ZIP code town where the factory is located Life Project Number: 11 ENV / DE / 340 Action B.4. Definition of certification prerequisites - Page 9 of 50 - The province or state where the factory is located The country where the factory is located. This parameter is important as the evaluation is specific for each country (market prices for each country are applied) The telephone where the consumer could be contacted The fax number where the consumer could be contacted The date in which the study is performed. This parameter is important as some of the calculations performed by the tool are based on the current date The contact person (usually the same as filled the questionnaire) The e-mail where the report produced by the Visualization Tool will be sent after the questionnaire has been submitted There are three buttons on this screen which can be used to implement the following actions: to accede the questionnaire to print the questionnaire to submit the questionnaire and get the results The characteristic of each one of these options are detailed in the following sections. 2.2. The questionnaire The questionnaire can be acceded from the main menu by pressing the button . When do so, the form shown in Figure 2 appears, by means of which any of the four parts of the questionnaire can be selected. The complete questionnaire can be found in Appendix I. Life Project Number: 11 ENV / DE / 340 Action B.4. Definition of certification prerequisites - Page 10 of 50 - Figure 2. Questionnaire Selection Form 2.2.1. Phase I: Technical and Organizational Requirements When the button is selected in the form shown in Figure 2, the first part of the questionnaire, regarding Technical and Operational Requirements appear, as it is shown in Figure 3. Figure 3. Technical and Organizational requirements screen (I) Life Project Number: 11 ENV / DE / 340 Action B.4. Definition of certification prerequisites - Page 11 of 50 - On the top of the screen there are two buttons to go to different parts of the application. If the button on the top left corner is pressed, the user accedes to the main menu of the application, appearing again the screen shown in Figure 1. On the other hand, if the button on the top right corner is pressed, the user accedes to the next part of the questionnaire. Some information requested in the questionnaire is essential in order to get reliable results in the final report. If some of this information is missing when the user tries to leave this part of the questionnaire (pressing either the buttons MAIN MENU or NEXT), the boxes requiring such information are turned in red (Figure 5), while the next message appears: Figure 4. Missing of essential information message (I) Figure 5. Technical and operational requirements screen (II). Missing information If the button OK is pressed, the user can complete the missing information in order to accede to the next section or going back to the main menu. Otherwise, the following message appears when the button Cancel is pressed: Life Project Number: 11 ENV / DE / 340 Action B.4. Definition of certification prerequisites - Page 12 of 50 - Figure 6. Missing of essential information message (II) If the button OK is pressed, the user will accede to the Main Menu or the Next section (depending on the previous selection) without uploading the missing information, which may produce important mistakes in the final report. Otherwise, the user will be able to upload the information in the questionnaire if Cancel is pressed. This first phase of the questionnaire is divided into the following sections: 2.2.1.1. Section A.I. General information This section includes information regarding the size of the factory (number of employees, production and annual electricity cost) and the energy consumption characteristics. Regarding the electricity consumption, it is necessary to indicate the annual consumption including all the electricity which is coming from the grid as well as supplied by other sources. Other characteristic information to be supplied here is the contracted power, the peak power and the share of electricity consumption in summer and winter and the part of electricity used by the consumer which is coming from the grid. Information about self-generation technologies available at the plant is also requested. The thermal annual consumption provided by other sources than electricity should be also indicated. The last question in this section refers to previous studies or consultations carried in the past at the facility, as well as the type of consultation (integral energy audit for the whole plant for efficiency purposes, integral energy audit for the whole plant for other purposes than efficiency or energy audit for some specific processes (compressed air, air conditioning, etc.). More than one option may be chosen. 2.2.1.2. Section A.II. Data management, control and measuring Information about the devices and systems used in the factory for management, control and measuring of variables involved in the energy consumption is gathered in this section. Life Project Number: 11 ENV / DE / 340 Action B.4. Definition of certification prerequisites - Page 13 of 50 - The first question refers to the availability and type of an Energy Management System (EMS) in the facility (certified or in process to be certified). The following question is referred to the type of measurements performed in the factory (centralized control system including metering, automatic meter reading system remotely manageable, local automatic meter reading systems nor remotely manageable or manual process) The last question refers to the availability of internet or network connection next to the electrical panels. 2.2.1.3. Section A.III. Use of energy and processes This sections is probably the most complex to be completed due to the level of detailed information regarding how energy is consumed in the different processes. It is important to have information as much accurate as possible in order to have a good estimation of the potential in the final report. When detailed information is not available, estimations done by the technical staff of the factory based on their experience become essential in order to properly complete this section. Energy consuming processes have been divided into two groups: A. Cross-sectional technologies Cross-sectional technologies are energy consuming processes composed of one or more machines or devices which use energy in order to provide with an auxiliary service but they are not directly related to the production of a good (final or intermediate). 11 cross-sectional technologies have been identified, such as steam production and distribution, ventilation or compressed air. The first step is to check the cross-sectional technologies available in the facility by doing click with the mouse in the checking box next to each one of them (see Figure 7). Then, the questions related to such technology in the rest of the questionnaire will be enabled. For each technology it is necessary to include the share in the annual energy consumption (for electricity and others) and the use of energy during the year (hours/day and days/week). Life Project Number: 11 ENV / DE / 340 Action B.4. Definition of certification prerequisites - Page 14 of 50 - Figure 7. Technical and operational requirements. Cross-sectional technologies B. Production processes They are processes themselves directly related to the production of a specific good (final or intermediate). Like in the case of the crosssectional technologies, the first step is to check the processes available at the factory by doing click with the mouse in the checking box next to each one of them. They are very specific and depend on the type of industry, so that next to each checking box it is necessary to write a description for each of the available processes. Then, it is necessary to include the share in the annual electricity consumption (in this case, just for electricity) and the use of energy during the year (shifts/day, hours/shift and days/week). Figure 8. Technical and operational requirements. Production processes Life Project Number: 11 ENV / DE / 340 Action B.4. Definition of certification prerequisites - Page 15 of 50 - Either for the cross-sectional technologies as for the production processes, it is necessary to answer some questions regarding the possibility to interrupt or reduce load for each of them. In particular, the possibility to interrupt and partly reduce (more or less than 50%) each one of them must be addressed. The impact of eventual problems in the supply to each cross-sectional technology or process needs to be also completed, attending to if such problems could make the factory stop or reduce the load rate (below or above the 50% of the full capacity). The last questions of this sections are referred to the availability of historical data about the energy consumption of the plant (type of measurements and how long they have been gathered) and how often energy studies are done by using such historical data on the energy consumption of the factory. 2.2.1.4. Section A.IV. Load Profile Questions in this section are referred to the shape of the load profile (flat load curve, repetitive peaks, eventual peaks) and the type of peak load management to control the power peaks if any. The impact of seasonability (different consumptions during the year) is also considered by means of questions referred to the type of parameters affecting the energy consumption during the year (external temperature, load work, other reasons) and the production load capacity in high and low seasons. 2.2.1.5. Section A.V. Demand Response Flexibility The last sections of this first part of the questionnaire is referred to the aspects which could affect the initial flexibility of the factory. For the different productions processes it is necessary to indicate if they are continuous or discontinuous during one shift, that means if there are scheduled stops or not during the usual pattern of consumption of each process. Finally, a question regarding the capacity of some processes to store intermediate or prefabricated goods used in the following processes is done, as well as about the time during which this intermediate storage capacity could be applied. Once this first phase of the questionnaire is completed, the user may press the button to go back to the top of the screen. Once there, it is possible to go back to the main screen by pressing the button on the top left corner, or going to the phase II of the questionnaire by pressing the button Life Project Number: 11 ENV / DE / 340 Action B.4. Definition of certification prerequisites - Page 16 of 50 - 2.2.2. Phase II: Information and Know-How Requirements The user can accede to this part by pressing the button in the form shown in Figure 2, or by means of the button on the top right corner of the questionnaire. When doing so, the screen shown in Figure 9 appears. As in phase I, on the top of the screen there are two buttons to go to different parts of the application. If the button on the top left corner is pressed, the user accedes to the main menu of the application, appearing again the screen shown in Figure 1. On the other hand, if the button on the top right corner is pressed, the user accedes to the next part of the questionnaire (phase III). The previous part (phase I) can be also accessed by pressing the button . This second phase of the questionnaire is focused on the knowledge and information which the customer may have regarding Demand Response and the use of flexibility in his facilities. This phase is divided into the following sections: Figure 9. Information and Know-How Requirements screen 2.2.2.1. Section B.I. General The first question of this sections asks the customer about his level of knowledge regarding Demand Response, which may be advanced, medium, basic or none. Life Project Number: 11 ENV / DE / 340 Action B.4. Definition of certification prerequisites - Page 17 of 50 - Following, the willingness of the customer to participate in some kind of Demand Response actions is figured out and, in such case, the type of program in which the customer may be participating. The last question of this section refers to the available information which the customer may have regarding the benefits which Demand Response may provide. The kind of information in which the customer may be interested needs to be also indicated. 2.2.2.2. Section B.II. Load profile The availability of load measurements is essential in order to evaluate the potential impact of Demand Response in industrial facilities, as well as for verification and settlement purposes in case of Demand Response is provided to a third party. Therefore, this section requires information about the type of measurements regarding the load profile which may be available for the customer (general data, measurements detailed by processes, etc.). Once this second phase of the questionnaire is completed, the user may press the button to go back to the top of the screen. Once there, it is possible to go back to the main screen by pressing the button on the top left corner, or going to the phase III of the questionnaire by pressing the button . In case it is necessary, the user can also go back to phase I by pressing the button . 2.2.3. Phase III: Organizational Requirements The user can accede to phase III by pressing the button in the form shown in Figure 2, or by means of the button on the top right corner of the of the phase II of the questionnaire. When doing so, the screen shown inFigure 10 appears. Life Project Number: 11 ENV / DE / 340 Action B.4. Definition of certification prerequisites - Page 18 of 50 - Figure 10. Organizational requirements screen As in previous phases, on the top of the screen there are three buttons to go to different parts of the application. If the button on the top left corner is pressed, the user accedes to the main menu of the application, appearing again the screen shown in Figure 1. On the other hand, if the button on the top right corner is pressed, the user accedes to the next part of the questionnaire (phase IV). The previous phase (phase II) can be also accessed by pressing the button . The third phase of the questionnaire deals with organization requirements for Demand Response implementation, mainly related to the way in that the schedule of activities in the plant is related to the energy consumption. This phase is divided into the following sections: 2.2.3.1. Section C.I. General The first question of this sections asks the customer about some potentials which could be already discovered in the factory, so they could be used as starting point of a more detailed study. In case the answer is affirmative, a second question asks about the grade of implementation of Demand Response actions in the facilities (specification of some specific actions, performance of some pilot to test the potential, etc.). Life Project Number: 11 ENV / DE / 340 Action B.4. Definition of certification prerequisites - Page 19 of 50 - 2.2.3.2. Section C.II. Breaks and downtimes This section is focused on how breaks or downtimes affect the usual pattern of consumption of the different cross-sectional technologies and processes. For each one of them, it is necessary to answer if some process or processes reduce their load rate (more or less than 50%) or even shut down when habitual pauses during the usual working schedule take place. Just crosssectional technologies or processes which have been enabled in phase I will be suitable to be chosen here. 2.2.3.3. Section C.III. Organization and documentation Finally, questions included in this section are referred to the capability of current employees to implement Demand Response strategies, as well as to the type of available documentation for a more detailed study. The question regarding the ability of current employees consider different alternatives, from providing adequate training to current employees in order to make them capable to apply Demand Response strategies, to the incorporation of new technical staff to deal with Demand Response. The last question asks about the availability of documentation which may be necessary for a more detailed study (electrical layouts, historical production data, floor plans, etc.). Once the third phase of the questionnaire is completed, the user may press the button to go back to the top of the screen. Once there, it is possible to go back to the main screen by pressing the button on the top left corner, or going to the phase IV of the questionnaire by pressing the button . In case it is necessary, the user can also go back to phase II by pressing the button . 2.2.4. Phase IV: Contractual Compliance The user can accede to the this last phase IV by pressing the button in the form shown in Figure 2, or by means of the button on the top right corner of the of phase III of the questionnaire. When doing so, the screen shown in Figure 11 appears. Life Project Number: 11 ENV / DE / 340 Action B.4. Definition of certification prerequisites - Page 20 of 50 - Figure 11. Contractual Compliance screen Similarly to other phases, on the top of the screen there are two buttons to go to different parts of the application. If the button on the top left corner is pressed, the user accedes to the main menu of the application, appearing again the screen shown in Figure 1. On the other hand, if the button on the top right corner is pressed, the user accedes to the previous part of the questionnaire (phase III). This last phase of the questionnaire includes some information regarding the type of contract used by the customer for the electricity supply. This phase is divided into the following sections: 2.2.4.1. Section D.I. General This sections refers to previous contacts which the customer may have established with some market agent (supplier, aggregator, system operator) regarding the possibility to play with the flexibility of the factory (switch-off, reconnections). 2.2.4.2. Section D.II. Electricity Contract This last section of the questionnaire refers to the type of contract which the customer has for the electricity supply (flat price, period-structured contract, indexed to the pool market). The prices in the contract for on-peak and offpeak periods are also requested in order to get an initial estimation about the profitability of load shifting (included in the final report) Life Project Number: 11 ENV / DE / 340 Action B.4. Definition of certification prerequisites - Page 21 of 50 - Once the last phase of the questionnaire is completed, the user may press the button to go back to the top of the screen. Once there, it is possible to go back to the main screen by pressing the button on the top left corner, or going to the phase III of the questionnaire by pressing the button . 2.3. How to print the questionnaire When the questionnaire has been filled in, the user can easily get a printed copy of his answers. To do this, the user should press the button in the main screen of the application (see Figure 1). If so, the confirmation message shown in Figure 12 appears: Figure 12. Print questionnaire. Confirmation message The printer which the user has defined by default will appear in the confirmation message to print the questionnaire. If agree, the user may press OK to get the questionnaire printed out. If a different printer is desired (for example, to get a PDF file), the button Cancel should be pressed. If so, the box shown in Figure 13 appears. Figure 13. Print questionnaire. Printer setup Then, it is possible to choose a different printer and establish a different configuration by pressing the button Setup. When the new printer has been chosen, the button OK needs to be pressed. When doing this, a new confirmation message appears, as shown in Figure 14. To confirm the print Life Project Number: 11 ENV / DE / 340 Action B.4. Definition of certification prerequisites - Page 22 of 50 - the user should press OK. Otherwise, the button CANCEL should be pressed to cancel the print. Figure 14. Print questionnaire. Confirmation message The full version of the questionnaire is included in Appendix I. 2.4. How to submit the questionnaire When the questionnaire has been completed, the user should submitted it to the DRIP processing centre in order to get the evaluation and results about the flexibility potential of the considered facility. The submission can be easily done by pressing the button in the main menu (see Figure 1). When so, an automatic e-mail will be generated by using Microsoft OUTLOOK®, as it is shown in Figure 15. Figure 15. Submit questionnaire. Automatic e-mail generation Regarding this e-mail it is important to point out that: Life Project Number: 11 ENV / DE / 340 Action B.4. Definition of certification prerequisites - Page 23 of 50 - The e-mail already includes the attachment of the EXCEL ® file with the questionnaire. The e-mail contains the contact information provided in the Main Menu of the questionnaire. Missing information or mistakes on this part (especially regarding the e-mail address) could make impossible the submission of the report. The e-mail is automatically generated by using Microsoft OUTLOOK®, so this software needs to be installed in the computer from which the questionnaire will be submitted. In order to get the automatic e-mail generated, the reference Microsoft 14.0 Object Library needs to be activated. To check that follow these steps: o When Microsoft EXCEL® is open, go to the menu Developer and then open the screen of Visual Basic o Open the menu Tools > References… Then, the box shown in Figure 16 will appear. Figure 16. Verification of object library MS Outlook 14.0 o Verify that the object library Microsoft Outlook 14.0 is checked. If not, check it and press OK. In any case, you can always send the EXCEL® file with the questionnaire as an attachment to the address: [email protected]. Life Project Number: 11 ENV / DE / 340 Action B.4. Definition of certification prerequisites - Page 24 of 50 - 3. RESULTS This section is devoted to explain how the results of the analysis performed by the Visualization Tool can be obtained and how these results should be understood. Based on the answers of the users to the questionnaire and a preestablished score to each potential answer, a grading is obtained in order to show how far the consumer is from the full potential he may have according to his technical characteristics. 3.1. Usefulness of the results Results provided by the Visualization Tool show an estimation of the flexibility potential that industrial customers may have. This flexibility potential is not just referred to the amount of power which can be delivered of managed by customers, but also to the ability, capabilities and means to do it successfully. Results can be divided into two blocks: Potential Quantification (first page of the report) and Improvement Recommendations (second page of the report). The Potential Quantification includes different charts where the current abilities of energy consumers to modify their usual patterns of energy consumption are highlighted. In these charts, customers can easily see what is their current potential and how far they are from being more flexible and so increment the potential benefits from using this flexibility. This aspect is detailed according to technical, know-how, organizational and contractual issues (such as the dimensions of the questionnaire) so that consumers can establish a strategy and decide what actions perform first to improve the potential. The Improvement Recommendations mean a guideline to the consumer to improve his potential by improving some specific issues which are addressed in the questionnaire. 3.2. How to get the report Once the user has submitted the questionnaire, the information will be uploaded in the application and the report with the results of the analysis will be send to the customer. This is a semi-automatic process so that the report should be available to the user no later than two working days after the submission of the questionnaire. If after two days the user has not received the report, a new submission should be done. In order to open the report, ACROBAT® Reader needs to be installed in the computer. You can get a free version of the software at: http://get.adobe.com/reader Life Project Number: 11 ENV / DE / 340 Action B.4. Definition of certification prerequisites - Page 25 of 50 - The report will be submitted to the user as a two-pages PDF file, including the results following discussed. 3.3. How to understand the results: Structure of the report The report provided by the Visualization Tool is a two-pages PDF file which include the following parts: A Radar Chart, showing the level of completeness of the questionnaire in each of the considered four phases and the number of points achieved with the answer to the different questions The DRIP Global Flexibility Potential Label, which provides the customer with a ranking place according to his flexibility potential. A list of recommendations which the customer may use to improve his potential. These recommendations are customized and depend on the answers to the questionnaire. 3.3.1. Radar chart The radar chart shows the number of points achieved by the consumer in each of the four phases (dimensions) of the questionnaire. It is presented in the report as it is shown in Figure 17. According to these points, which are based on the answer of the users to the questionnaire, it can be seen how far the consumer is from the maximum potential to be achieved. The maximum potential does not only depend on the amount of manageable power, but also on the abilities of employees, available control and monitoring devices, knowledge on DR issues, etc. This chart is very useful to help customers to understand why a potential grading has been given, as well as to identify the dimension or dimensions which could be improved (which is also complemented with the list of recommendations also provided by the report). To show this aspect more clearly, the green line shown in the chart represents the border to achieve the next potential level. The minimum score required to achieve the different grades of potential, evaluated and adjusted during the DRIP project according to the tests performed in real facilities (see Appendix II) is given by Figure 18. Life Project Number: 11 ENV / DE / 340 Action B.4. Definition of certification prerequisites - Page 26 of 50 - Figure 17. Radar chart in the report of final results Grades are assigned according to the total score achieved by the customer in the different dimensions of the questionnaire. However, a level can be obtained even if the minimum required score in each dimension is not reached, always that the excess of points in some dimensions compensates the lack of points in others. MINIMUM SCORE REQUIRED FOR FLEXIBILITY GRADES A+ A B C D Very high High Medium-High Medium-Low Low a. Technical and Operational Requirements 80% 60% 50% 25% 15% b. Information and Know-How Requirements 80% 40% 30% 20% 5% c. Organizational Requirements 80% 40% 30% 20% 5% d. Contractual compliance 80% 40% 30% 20% 5% GRADE POTENTIAL Figure 18. Minimum score required for flexibility grades At the right of the radar chart, there is a table summarizing the number of points obtained by the customer by dimension and compared with the total number of points that could be obtained also by dimension. 3.3.2. Potential Label The DRIP Global Flexibility Potential Label has been designed to inform industrial customers about their degree of flexibility in a clear and easy to Life Project Number: 11 ENV / DE / 340 Action B.4. Definition of certification prerequisites - Page 27 of 50 - understand way. The label summarizes the result of the pre-evaluation performed by means of the Visualization Tool, so that the most important results are represented here. Depending on the points achieved by the customer, which in turn depends on the answers to the different questions, the potential grade is assigned. There are six different potentials, depending on the total grading: A+ A B C D F Very high High Medium–high Medium-low Low Negligible (represented (represented (represented (represented (represented (represented by bright green colour) by pale green colour) by soft green colour) by yellow colour) by orange colour) by red colour) It is important to point that a low potential does not mean that a consumer is not flexible, but a higher effort may be required to provide this flexibility due to different reasons (lack of knowledge, lack of specific equipment, etc.). The list of recommendations included at the end of the report will indicate to the consumer how to face such handicaps. Figure 19. DRIP Global Flexibility Potential Label Life Project Number: 11 ENV / DE / 340 Action B.4. Definition of certification prerequisites - Page 28 of 50 - The label, shown in Figure 19, is divided into three parts: A. Grading by section. This is a bar chart representing the percentage of points achieved by the customer in the different dimensions of the questionnaire. It is a different representation of the data presented in the radar chart. B. Global flexibility potential grading. The minimum score to achieve the different grading is represented in a bar chart. To the left, a blue column represents the points achieved by the customer (in the different sections of the questionnaire). A red dotted line represents the actual potential reached by the customer. C. Summary box. This part of the label, located below the Global flexibility potential grading, provides the customer with the following information: The total number of points achieved The flexibility potential assigned, represented by a letter (from A+ to F) and a coloured box with the legend of the potential. The colour of the letter and the box are univocally linked to the assigned potential The estimated flexible power, expressed in kW and relative to the contracted power (in %). This power is calculated based on the answers of customers to the questionnaire so that it is just a rough estimation which depends on the accuracy of the information provided by the customer in the questionnaire. Therefore, the real potential would necessarily have to be determined in a more detailed study on site. The estimated annual incomes which the use of flexibility may provide the customer. They are evaluated by using the flexible power determined in the previous paragraph, assuming 720 flexible hours per year, the prices during on-peak (for reductions) and offpeak (for recoveries) provided by the customer in the questionnaire and the mean price in the pool market of the country where the factory is located1. Similarly to the estimated flexible power, this is a rough estimation to give the customer a magnitude order of the potential benefits which the application of flexibility may have, but the real benefits would need a more detailed study on site, considering the real flexibility and the real market conditions applicable to the customer. The DRIP Global Flexibility Potential Label has to be considered as it actually is: an estimation to give the customer, with little effort, resources and time, a general idea about the flexibility potential which he may have and the potential benefits which he may obtain. It is important to point out that these estimations are performed in base of the information provided by the 1 Source: Eurostat. Electricity prices for industrial customers, 2013S2 Life Project Number: 11 ENV / DE / 340 Action B.4. Definition of certification prerequisites - Page 29 of 50 - customer in the questionnaire, so that the more accurate is this information, the more accurate the results obtained with the Visualization Tool. The flexibility potential grading is calculated based on many different variables which depend not only on the amount of power the customer may manage, but also on the equipment, documentation, knowledge and abilities of the customer to apply this flexibility in a proper way. Therefore, a high flexible power does not necessarily mean that the customer has a high potential grade if the rest of issues are not properly addressed. Also some “hidden” potential is evaluated by means of key questions which the consumer may have even if he is not aware of that (recommendations at the end of the report would also highlight this aspect if this is the case) 3.3.3. Recommendations The last part of the report includes a list of recommendations which the customer could put into practise in order to improve his flexibility potential. Recommendations are presented as shown in Figure 20, and they are divided into two blocks: Figure 20. Recommendations to improve the flexibility potential A. Essential changes or adaptations. They are referred to the minimum requirements, technical and organizational, which would be necessary to implement any kind of Life Project Number: 11 ENV / DE / 340 Action B.4. Definition of certification prerequisites - Page 30 of 50 - flexibility action a minimum guarantee of success. In particular, the minimum requirements to be satisfied by the customer in order to achieve a good flexibility qualification are related to: The existence of an Energy Management System The existence of a Data Gathering System The existence of internet or network connection Basic knowledge and training on Demand Response of the technical staff of the factory Availability of the load profile of the factory Availability of some basic documentation (electrical layouts, floor plants and metering) B. Other recommendations to improve the potential They are recommendations which may help the customer to improve the potential but they does not mean an significant change regarding the current situation of the facilities. 3.4. Examples The tool has been tested in the four industrial sites participating in the DRIP project. Moreover, the results have been validated by comparison to the subsequent detailed analysis where the full potential of customers was accurately evaluated and identified. By means of this testing and validation procedure, the criteria for weighting the different questions in the grading of the flexibility potential has been updated and adjusted. The four sample reports are shown in Appendix II. Life Project Number: 11 ENV / DE / 340 Action B.4. Definition of certification prerequisites - Page 31 of 50 - 4. TERMS AND CONDITIONS OF USE: END USER LICENCE AGREEMENT RWE Deutschland AG (RWE), as developer of the so-called Visualization Tool (V-TOOL), is willing to license this application based on Microsoft EXCEL© to you on the condition that you accept all of the terms contained in the following end user Licence Agreement (LA). Please read the LA carefully before downloading the Software. By exercising the option to download the Software you agree to be bound by the terms of this LA. 4.1. Ownership and grant licence RWE retains all rights including but not limited to copyright and other intellectual property rights, anywhere in the world. You are granted, free of charge, the following non-exclusive, non-transferable and limited rights : (a) You may download a copy of the V-Tool onto one computer or server solely for non-commercial, academic research purposes, provided that the computer used for running the software is running a validly licensed copy of the operating system for which the V-Tool was designed. (b) You may make copies of the V-Tool as may be necessary for back-up and archival purposes, provided that each copy is kept in your possession and provided you reproduce RWE’s copyright notice on each copy. You must acknowledge use of the V-Tool using the following form of words and citations in all publications and presentations of research carried out using the Software: “The analysis presented in this document has been carried out using the Visualization Tool developed by RWE in the framework of the DRIP Project”. You must comply with all applicable laws relating to the use of the Software. The licence granted to you under this LA is personal to you. You shall not permit any third party to access, modify or otherwise use the V-Tool nor shall you access, modify or otherwise use the V-Tool on behalf of any third party. 4.2. Prohibited uses You must not remove or alter any copyright notices on any and all copies of the V-Tool. Life Project Number: 11 ENV / DE / 340 Action B.4. Definition of certification prerequisites - Page 32 of 50 - You may not, without written permission from RWE: (a) Use, copy, modify, merge or transfer copies of the V-Tool or any documentation provided by RWE which relates to the V-Tool except as provided for in this LA. (b) Distribute, rent, lend, lease, transfer or sub-license the V-Tool or any of your rights or obligations under this LA to any other party. (c) Reverse engineer, decompile, disassemble or unlock the V-Tool for any reason. (d) Disclose at any time any information provided to you by RWE under this LA to any third party. You may not use the name of RWE nor the names of its contributors to endorse or promote products derived from the V-Tool without specific prior written permission. 4.3. No warranty The V-Tool has been developed for research purposes only. You acknowledge that RWE is licensing the V-Tool to you, free of charge, and on the condition that the disclaimers set out in this LA will apply. RWE disclaims any warranty to the V-Tool. The V-Tool is provided ‘as is’ without any express or implied warranty of any kind, including but not limited to any warranties as to merchantability, fitness for purposes or noninfringement of third party rights. RWE excludes and explicitly disclaims all express and implied representations, warranties, conditions and terms not stated herein (including the implied conditions or warranties of satisfactory quality, merchantable quality, merchantability and fitness for purpose). The above warranty disclaimer and exclusions will only apply to you to the extent permitted in the relevant jurisdiction and does not in any event exclude any implied warranties, conditions or terms which may not under applicable law be excluded, restricted or modified. 4.4. Limitation of liability You acknowledge that RWE is licensing the V-Tool to you, free of charge, and on the condition that the limitations set out in this LA will apply. RWE excludes all liability whether in contract, tort, negligence or otherwise, in respect of the Software and/or any related documentation provided to you by RWE including but not limited to liability for loss or corruption of data, loss of contracts, loss of income, loss of profits, loss of cover and any consequential or indirect loss or damage of any kind arising out of or in connection with this LA, however caused. This exclusion shall apply even if RWE has been advised of the possibility of such loss or damage. Life Project Number: 11 ENV / DE / 340 Action B.4. Definition of certification prerequisites - Page 33 of 50 - 4.5. Termination RWE may terminate this LA at any time with immediate effect upon written notice to you. This LA shall automatically terminate if you: (a) Fail to comply with any terms and conditions herein; or (b) Voluntarily return the V-Tool In the event of termination, you must immediately destroy any and all copies of the V-Tool. Unless terminated earlier, the restrictions on your rights to use the V-Tool expire upon expiration of the copyright to the V-Tool. 4.6. Data management By submitting the completed questionnaire to get the report provided by the Visualization Tool, the user authorizes RWE to store and handle the submitted data for market studies. This information will be treated as confidential and it just be used aggregated. The user can also submit the completed questionnaire anonymously without filling in the data regarding identification. In any case, the user has to indicate a valid e-mail address where the report will be sent, as well as the industrial sector of the facility for research purposes. 4.7. Miscellaneous This LA represents the entire agreement between you and RWE relating to the V-Tool and supersedes any previous agreements or representations. No amendments or modifications to this LA will be valid unless it is in writing and signed by an authorised representative of RWE. The invalidity or unenforceability of any clause in this LA will not affect the validity or enforceability of the remaining clauses. This LA will be governed by and construed in accordance with the substantive laws of Germany whose courts shall have exclusive jurisdiction over all disputes which may arise between you and RWE. Life Project Number: 11 ENV / DE / 340 Action B.4. Definition of certification prerequisites - Page 34 of 50 - 5. APPENDIX I: QUESTIONNAIRE Consumer 0 5 Address - ZIP Town (Province) - Austria Sector A.I. GENERAL A.I.1.Number of employees A.I.2a. Annual production A.I.2b. Units Used to measure annual production A.I.3. Annual cost of electricity €/year 1 Electricity consumption A.I.4. Annual electricity consumption kWh/year 1 Total, including the grid and other sources A.I.6. Peak power Summer: A.I.5. Contracted power kW If different values, contracted power on peak kW Winter: kW 1 A.I.7. Electricity consumption ratio Summer: % 50 1 1 50 Winter: % A.I.8. Are you supplying part of your electricity needs through self generation resources? A.I.9. Which self generation technologies do you have? 1 Nominal power 0 Annual production kW kWh/year 0 Diesel generator Steam turbine kW kWh/year 0 CHP plant kW kWh/year 0 Photovoltaic system kW kWh/year 0 Other (indicate): kW kWh/year A.I.10. What share in your annual consumption comes from the power grid? % 100 Note: According to questions A.I.4 and A.I.9., about the 0% of the electricity supply should be coming from the power grid Energy provided by self generation is HIGHER than the annual consumption 0 Thermal consumption (others than electricity) A.I.11. Annual thermal energy consumption kWh/year 0 I just consume electricity 0 A.I.12. Have energy studies or consultations ever been carried out at your facility? A.I.13. If yes, when did the last one take place (indicate year)? 1 0 A.I.14. If yes, indicate the type of consultation More than one can be chosen Integral energy audit for the whole plan for efficiency purposes Integral energy audit for the whole plant for other purposes than efficiency Energy audit for some specific process (compressed air, air conditioning,…) A.II. DATA MANAGEMENT, CONTROL AND MEASURING A.II.1. Does a certified Energy Management System (EMS) exists? 0 A.II.2.Do you have some kind of measurements or data gathering in your plant? 1 A.II.3.If yes, what type of metering system do you have? 0 Life Project Number: 11 ENV / DE / 340 Action B.4. Definition of certification prerequisites - Page 35 of 50 - A.II.2.Do you have some kind of measurements or data gathering in your plant? 1 A.II.3.If yes, what type of metering system do you have? 0 A.II.4.Do you have internet or network connection in the proximity of electrical panels? 1 A.II.5. If yes, where is the internet or network connection available? Near the transformers (less than 5 m) Near the main electrical panels (less than 5 m) Near the secondary electrical panels (less than 5 m) Around the factory, near the process machinery A.III. USE OF ENERGY AND PROCESSES A.III.1. Which cross-sectional technologies are available in your plant, what is their approximate share in the annual consumption and what is their energy supply source? Share in the annual energy consumption, % Electricity 0 Steam production and distribution 0 Hot water for processes 0 Hot water for cleaning and DHW 0 Other sources Use of energy Hours per day Days per week 0 % 0 % 0 0 0 % 0 % 0 0 0 % 0 % 0 0 Cooling production and distribution 0 % 0 % 0 0 0 Ventilation 0 % 0 % 0 0 0 Lighting 0 % 0 % 0 0 0 Electronic devices and computing 0 % 0 % 0 0 0 Compressed air 0 % 0 % 0 0 0 Vacuum system 0 % 0 % 0 0 0 Offices 0 % 0 % 0 0 0 Sewage treatment 0 % 0 % 0 0 Checking summary Electricity Other sources Cross-sectional processes 0% 0% Production processes 100% 100% 100% 100% TOTAL ENERGY CONSUMPTION A.III.2. Can your interrupt, reduce or reschedule the electricity supply to any of those cross-sectional technologies? Interruptible Partly Reducible (more than 50%) Partly Reducible (less than 50%) Steam production and distribution Hot water for processes Hot water for cleaning and DHW Cooling production and distribution Ventilation Lighting Electronic devices and computing Compressed air Vacuum system Offices Sewage treatment Life Project Number: 11 ENV / DE / 340 Action B.4. Definition of certification prerequisites - Page 36 of 50 - A.III.2. Can your interrupt, reduce or reschedule the electricity supply to any of those cross-sectional technologies? Partly Reducible (more than 50%) Interruptible Partly Reducible (less than 50%) Steam production and distribution Hot water for processes Hot water for cleaning and DHW Cooling production and distribution Ventilation Lighting Electronic devices and computing Compressed air Vacuum system Offices Sewage treatment A.III.3. If there is a problem in the electricity supply to any of these cross-sectional technologies which produces the interruption of one of them, how does it affect the rest of the factory? The factory must stop The factory keeps working at a load rate lower than 50% The factory keeps working at a load rate higher than 50% Steam production and distribution Hot water for processes Hot water for cleaning and DHW Cooling production and distribution Ventilation Lighting Electronic devices and computing Compressed air Vacuum system Offices Sewage treatment A.III.4. What are your main production processes, their approximate share in the annual consumption and their number of shifts a day? Description Share in the annual electrical consumption Shifts/day Hours/shift Days/week 0 Process 1 0 % 0 0 0 0 Process 2 0 % 0 0 0 0 Process 3 0 % 0 0 0 0 Process 4 0 % 0 0 0 0 Process 5 0 % 0 0 0 0 Process 6 0 % 0 0 0 0 Process 7 0 % 0 0 0 0 Process 8 0 % 0 0 0 Cross-sectional technologies Other less significant processes TOTAL ELECTRICITY CONSUMPTION Life Project Number: 11 ENV / DE / 340 Action B.4. Definition of certification prerequisites 0% 100% Others must be positive 100% - Page 37 of 50 - A.III.5. Can your interrupt, reduce or reschedule the electricity supply to any of those production processes? Partly Reducible (more than 50%) Interruptible Partly Reducible (less than 50%) Process 1: Process 2: Process 3: Process 4: Process 5: Process 6: Process 7: Process 8: A.III.6. If there is a problem in the electricity supply to any of these processes which produces the interruption of one of them, how does it affect the rest of the factory? The factory must stop The factory keeps working at a load rate lower than 50% The factory keeps working at a load rate higher than 50% Process 1: Process 2: Process 3: Process 4: Process 5: Process 6: Process 7: Process 8: A.III.7. Do you store the historical energy consumptions of your plant? 1 A.III.8. If yes, for how long have you been storing this information? A.III.9. Based on present or historical data, do you analyze the energy consumptions in your facility? Life Project Number: 11 ENV / DE / 340 Action B.4. Definition of certification prerequisites - Page 38 of 50 - A.IV. LOAD PROFILE A.IV.1. What is the shape of your load profile? 0 A.IV.2. In case you have power peaks, do you perform some kind of peak load management? A.IV.3. Is your load profile affected by seasonality? 1 A.IV.4. What is your production load capacity in high and low season? Production load capacity in high season % 0 Production load capacity in low season % 0 A.V. DEMAND RESPONSE FLEXIBILITY AV.1 Which of your production processes operate continuous and discontinuously during one shift? Process 1: Process 2: Process 3: Process 4: Process 5: Process 6: Process 7: Process 8: AV.2 Do you have product storage capacity for intermediate or prefabricated goods which are used in following processes? Life Project Number: 11 ENV / DE / 340 Action B.4. Definition of certification prerequisites - Page 39 of 50 - Consumer Address - ZIP Town (Province) - Austria Sector B.I. GENERAL B.I.1. What is the level of knowledge you have regarding Demand Response? B.I.2. What is your willingness to participate in some kind of Demand Response action? 1 B.I.3. If your are participating at present or you are interested in some Demand Response program, could you indicate what type? More than one can be chosen 0 Direct Load Control Interruptible Load Capacity Reserves Real Time Pricing Time-of-Use Pricing Other (indicate) B.I.4. Do you think that you have enough information about how Demand Response works and the benefits it provides? B.I.5. If no, which kind of information do you need? 0 1 Technical requirements Economic benefits Environmental impact Legal requirements Others (indicate) B.II. LOAD PROFILE B.II.1. Is the electrical load profile available to your company? Life Project Number: 11 ENV / DE / 340 Action B.4. Definition of certification prerequisites - Page 40 of 50 - Consumer Address - ZIP Town (Province) - Austria Sector C.I. GENERAL C.I.1. Have you already discovered some flexibility potential in your processes? 1 C.I.2. If yes, what is the grade of implementation of demand response actions in your facilities C.II. BEAKS AND DOWNTIMES C.II.1. Is the electricity consumption of some process shut down or reduced during breaks or downtimes? C.II.2. If yes, which processes or cross-sectional technologies are affected and how? The process is shut down 0 CST1: Steam production and distribution 0 CST2: Hot water for processes 0 CST3: Hot water for cleaning and DHW 0 CST4: Cooling production and distribution 0 CST5: Ventilation 0 CST6: Lighting 0 CST7: Electronic devices and computing 0 CST8: Compressed air 0 CST9: Vacuum system 0 CST10: Offices 0 CST11: Sewage treatment The process keeps working at a load rate LOWER than 50% The process keeps working at a load rate HIGHER than 50% 0 Process 1: 0 Process 2: 0 Process 3: 0 Process 4: 0 Process 5: 0 Process 6: 0 Process 7: 0 Process 8: Life Project Number: 11 ENV / DE / 340 Action B.4. Definition of certification prerequisites - Page 41 of 50 - C.III. ORGANIZATION AND DOCUMENTATION C.III.1. Are employees capable to sufficiently understand, apply and implement Demand Response strategies? C.III.2. Do you have updated documentation on the following topics? Electrical layouts of the main electrical panels of the factory (transformer and general distribution panels) Electrical layouts of the secondary pannels of the factory Technical documentation of the machinery installed in the factory Historical production data for, at least, two years General floorplan of the buildings of the factory Detailed floorplans of the different sections and processes of the factory Detailed information about the control and metering devices installed in the factory Technical proposals developed by the engineering staff of the factory regarding energy efficiency or DR Technical proposals developed by external auditors regarding energy efficiency or DR Consumer Address - ZIP Town (Province) - Austria Sector D.I. GENERAL D.I.1. Have you ever contacted any market agent regarding power switch-off / reconnection? More than one can be chosen Yes, I contacted a power supply company Yes, I contacted a DR Aggregator Yes, I contacted the TSO Yes, I contacted the distribution company of my area Yes, I contacted other (indicate): 0 No, never D.II. ELECTRICITY CONTRACT D.II.1. What type of contract do you have for your electricity supply? D.II.2. What are the mean prices for on-peak and off-peak periods in your electricity supply contract? On-Peak: cts€/kWh Off-Peak: Life Project Number: 11 ENV / DE / 340 Action B.4. Definition of certification prerequisites cts€/kWh - Page 42 of 50 - 6. APPENDIX II: CASE OF APPLICATION 6.1. Food processing industry. Spain Life Project Number: 11 ENV / DE / 340 Action B.4. Definition of certification prerequisites - Page 43 of 50 - - RECOMMENDATIONS - ESSENTIAL CHANGES OR ADAPTATIONS • Congratulations! Essential changes or adaptations are not required - OTHER RECOMMENDATIONS TO IMPROVE THE POTENTIAL - C) Organizational Requirements • You will need skilled staff at your facility to properly implement DR actions and use your flexibility. It is good that you think your employees are capable, but they need some training on DR. Let’s make your employees become DR experts! - Life Project Number: 11 ENV / DE / 340 Action B.4. Definition of certification prerequisites - Page 44 of 50 - 6.2. Food processing industry. Netherlands Life Project Number: 11 ENV / DE / 340 Action B.4. Definition of certification prerequisites - Page 45 of 50 - - RECOMMENDATIONS - ESSENTIAL CHANGES OR ADAPTATIONS - A) Technological and Operational Requirements • An Energy Management System needs to be installed in the facility. An EMS certified according to DIN EN ISO 50001 is highly recommended • Internet or network next to the equipment to be monitored and controlled is essential for the implementation of DR actions - C) Organizational Requirements • You will need skilled staff at your facility to properly implement DR actions and use your flexibility. You can provide with some training your employees or you can contract someone to deal with Demand Response. It is easy to make a profit of your flexibility with the proper team! OTHER RECOMMENDATIONS TO IMPROVE THE POTENTIAL A) Technological and Operational Requirements • An energy study should be done at the facility on order to analyze the energy consumptions • An automatic metering system would improve your potential • You should keep more detailed information about the energy consumption of your plant. It is essential to accurately evaluate the benefits of DR • You should analyze more frequently your energy consumptions. If you know where the energy is going to, you will be able to easier identify where you can save more! B) Information and Know-How Requirements • You should improve your knowledge regarding Demand Response. And we can help you! C) Organizational Requirements • You already have the basic information necessary to perform a detailed energy study for identifying and quantifying the flexibility of your facilities. However, it would be fantastic if you could get some additional information regarding: Historial production data. Previous technical proposals (internal or external) regarding energy efficiency or DR. The more information you have, the easier is to identify your full potential! D) Contractual Compliance • You should consider a different contract for your energy supply. More dynamic contractual models, including different prices at different times during the day will give you an important advantage when using your flexibility Life Project Number: 11 ENV / DE / 340 Action B.4. Definition of certification prerequisites - Page 46 of 50 - 6.3. Papermaking industry. Germany Life Project Number: 11 ENV / DE / 340 Action B.4. Definition of certification prerequisites - Page 47 of 50 - - RECOMMENDATIONS - ESSENTIAL CHANGES OR ADAPTATIONS • Congratulations! Essential changes or adaptations are not required - OTHER RECOMMENDATIONS TO IMPROVE THE POTENTIAL - A) Technological and Operational Requirements • Your are more flexible than you think!. The impact of habitual management operations in your cross-sectional technologies allows you a higher flexibility than you have identified • You should keep more detailed information about the energy consumption of your plant. It is essential to accurately evaluate the benefits of DR • You have product storage capacity for intermediate goods, and this fact makes you flexible. The more you can increase your storage capacity, the more flexible you will be! B) Information and Know-How Requirements • You should improve your knowledge regarding Demand Response. And we can help you! • You have the load profile of your factory but it is not enough. You should think about installing some additional power meters to get more detailed information about the energy behavior of your processes. Do not worry if you do not know where to install them or how many you should put. We can help you! C) Organizational Requirements • You will need skilled staff at your facility to properly implement DR actions and use your flexibility. It is good that you think your employees are capable, but they need some training on DR. Let’s make your employees become DR experts! • You already have the basic information necessary to perform a detailed energy study for identifying and quantifying the flexibility of your facilities. However, it would be fantastic if you could get some additional information regarding: Electrical layouts of secondary panels of the factory. The more information you have, the easier is to identify your full potential! Life Project Number: 11 ENV / DE / 340 Action B.4. Definition of certification prerequisites - Page 48 of 50 - 6.4. Logistic centre for food storage and distribution. Spain Life Project Number: 11 ENV / DE / 340 Action B.4. Definition of certification prerequisites - Page 49 of 50 - - RECOMMENDATIONS - ESSENTIAL CHANGES OR ADAPTATIONS • Congratulations! Essential changes or adaptations are not required - OTHER RECOMMENDATIONS TO IMPROVE THE POTENTIAL - B) Information and Know-How Requirements • You should improve your knowledge regarding Demand Response. And we can help you! • You have the load profile of your factory but it is not enough. You should think about installing some additional power meters to get more detailed information about the energy behavior of your processes. Do not worry if you do not know where to install them or how many you should put. We can help you! - Life Project Number: 11 ENV / DE / 340 Action B.4. Definition of certification prerequisites - Page 50 of 50 -