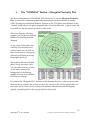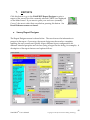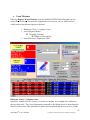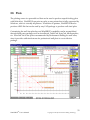
1
PERFORMANCE DRILLING TECHNOLOGY™ The Next Generation in Well Planning and Directional Drilling ™ WinSERVE for Windows ™ USER’S MANUAL 1 WinSERVE TM User’s Manual Copyright © 2012 by Performance Drilling Technology ™ WinSERVE for Windows ™ USER’S MANUAL PERFORMANCE DRILLING TECHNOLOGY, INC. Copyright © 2012 by Performance Drilling Technology All rights reserved worldwide. INFORMATION CHANGE NOTICE Due to application upgrades the details contained in this manual are subject to change without notice. Performance Drilling Technology does not assume any responsibility for discrepancies in this manual. April 2012 2 WinSERVE TM User’s Manual Copyright © 2012 by Performance Drilling Technology ™ ™ WinSERVE for Windows Support Information Please refer to the following for customer support regarding this product: Performance Drilling Technology, Inc. Address: 11834 Key Biscayne Ct. Houston, TX 77065 Phone: (281) 890-7494 (Office: orders and technical support) (281) 682-7554 (Cell) Fax: (281) 890-7585 Email: [email protected] Website: www.winsurv3d.com 3 WinSERVE TM User’s Manual Copyright © 2012 by Performance Drilling Technology ™ WinSERVE Table of Contents I. Main Screen Organization .............................................................................7 1. Menu Bar ........................................................................................................................ 8 a. File............................................................................................................................ 8 b. Edit ........................................................................................................................... 9 c. Reports .................................................................................................................. 12 d. Curve 21 Projections ........................................................................................... 14 e. Tools ...................................................................................................................... 17 f. Options .................................................................................................................. 18 g. Wizards ................................................................................................................. 19 2. Curve Information Area............................................................................................. 20 3. Curve Selector ............................................................................................................. 22 4. Survey List Panel......................................................................................................... 23 5. Location Info ................................................................................................................ 24 6. The “NORMAL” Button – Mosquito Proximity Plot ............................................. 25 a. Normal Plane ....................................................................................................... 26 b. TVD Plane ............................................................................................................. 26 c. True Minimum ..................................................................................................... 26 d. Crossings............................................................................................................... 26 II. Main Screen Action Buttons ........................................................................28 1. TARGETS ..................................................................................................................... 28 a. Target List ............................................................................................................. 29 b. Target Boundary Points and Picture................................................................. 31 c. Target Offsets ....................................................................................................... 32 2. INFO ............................................................................................................................. 33 3. WELL PLANNING ..................................................................................................... 34 4. PROJECTIONS ............................................................................................................ 34 5. ADD SURVEY ............................................................................................................. 35 4 WinSERVE TM User’s Manual Copyright © 2012 by Performance Drilling Technology 6. PLOT ............................................................................................................................. 39 7. REPORTS...................................................................................................................... 40 a. Survey Report Designer ..................................................................................... 40 b. Curve List ............................................................................................................. 44 c. Least Distance ...................................................................................................... 45 8. TIE-IN ........................................................................................................................... 49 9. PARAMETERS ............................................................................................................ 50 10. SAVE ............................................................................................................................. 51 III. Plots ..................................................................................................................52 1. Plot Controls ................................................................................................................ 53 2. Wall Plots with CAD .................................................................................................. 62 IV. Projection Methods ........................................................................................65 1. Curve 21 Projections ................................................................................................... 65 2. Graphic Projections (Binoculars) .............................................................................. 71 3. Formation Line Maker ................................................................................................ 74 V. Well Planning .................................................................................................77 1. General Preparation for a Well Plan ........................................................................ 78 a. A Note About Profiles and Projections ............................................................ 79 b. Well Proposal Planning Screen.......................................................................... 81 2. Projections .................................................................................................................... 86 3. Directional Well Plan Examples.............................................................................. 100 a. Slant Well Profile ............................................................................................... 100 b. S-Well Profile...................................................................................................... 102 c. Horizontal Profile 2-D....................................................................................... 104 VI. Tools ...............................................................................................................107 1. Interpolate .................................................................................................................. 107 2. Tally Book .................................................................................................................. 108 5 WinSERVE TM User’s Manual Copyright © 2012 by Performance Drilling Technology 3. UTM Manager (GEOMAPPER) .............................................................................. 109 4. Platform Manager ..................................................................................................... 113 5. Dip-DLS Calculator................................................................................................... 115 Welcome to WinSERVE (16-bit) WinSERVE is a directional drilling and well planning program from Performance Drilling Technology, Inc. Here you’ll find all of the necessary tools to perform survey calculations, including least distance; make projections to help make informed drilling decisions; design well plans of varying complexity; print reports and generate plots of your well data. This documentation is provided to introduce and familiarize you with the structure and use of the program’s features. The emphasis is descriptive rather than step-by-step to facilitate distribution and availability to the user, the document is included on the WinSERVE program installation as an Adobe .PDF file. 6 WinSERVE TM User’s Manual Copyright © 2012 by Performance Drilling Technology I. Main Screen Organization The Main Screen is designed so that the most commonly needed features of a directional drilling program are up front and center. Adding surveys, making plots, printing reports, selecting targets, making projections, interpolations, and much more are all within a couple of button clicks of the WinSERVE Main Screen. The Main Screen is organized logically into five distinct areas: Main Screen Menu Bar Curve Information Wellbore Location Survey List Action Buttons • • • • • A brief description of the purpose and function of each of these areas follows. More 7 WinSERVE TM User’s Manual Copyright © 2012 by Performance Drilling Technology detailed and in depth explanations of each item are provided elsewhere in the documentation, as well as practical lessons and examples to assist the user to become quickly proficient and be able to utilize the powerful tools of the WinSERVE program to maximum advantage. 1. Menu Bar a. File New Create a new FILE. File name should have no more than 8 characters. The .SVY extension will be automatically appended to the file name and the file will be saved under the WinSERVE directory unless the path is changed. Open Opens an existing FILE. WinSERVE will always try to load the last file saved during your last session when the program is started. Save Save the currently opened FILE. To save the file automatically every 5 minutes, click AutoSave ‘ON’ under Options. Save As Save the FILE under a different file name, for backup or transfer to another computer. EXPORT Export the selected CURVE as a WinSERVE Survey text file (.SAY) for transfer to another computer; verify that the Curve you want to export is selected (appears in CURVE #) before executing the Export function. Multiple curves are exported individually and saved as distinct files with different names. Export the WinSERVE FILE to generate an AutoCAD Lisp (.LSP) file; the AutoCAD Lisp Setup Screen will open to allow the setup of variables for import to AutoCAD and the creation of wallplots. See Creating Wall Plots With AutoCAD, for information about Lisp files. Other customized file formats are listed for specific individual customers. IMPORT Import a WinSERVE Survey text file (.SAY). Each file contains a single CURVE, with the Curve # under which it was exported. If 8 WinSERVE TM User’s Manual Copyright © 2012 by Performance Drilling Technology that Curve # in the current FILE contains data, a message will warn you that you are about to overwrite the curve information. Avoid this scenario by selecting an available curve in which to put the data before executing the Import function. May be used to import offset well surveys or a well proposal to the current job file. Import survey or proposal text files in various custom formats for individual customers for use with WinSERVE. Plot Go to the WinSERVE Survey Plot screen to set up a plot. About About WinSERVE Directional Software. Copyright and authorization notice. Performance Drilling Technology contact information. File list Last four files opened convenience feature of Windows. Exit Exit WinSERVE. You will be prompted to Save or Not to Save. b. Edit Curve Editor Opens the Curve Manager dialog box. Curves can be moved, copied, deleted or appended to another curve. The list at the upper left of the screen shows the curve names and numbers. Surveys of the selected curve are displayed at the lower left. The selected curve number button is blacked out on the MOVE TO CURVE ‘keypad’ at the upper right. The contents of the destination curve (indicated in the TO CURVE box) are displayed at the lower right. If attempting to Append one curve to another, the program logic will not allow you to append a curve with a starting MD less than the last MD of the curve to which you are appending. The Copy feature is useful to save a projection curve to a curve less than #21 so it would not be overwritten with the next projection. You might do this if the projection is to become your new well plan or if you wanted to make a plot showing several different projections to a target. HEED the WARNING!! Changes are not permanent until SAVED. 9 WinSERVE TM User’s Manual Copyright © 2012 by Performance Drilling Technology Gyro Drift Editor Import the raw (uncorrected) data into an empty curve (0-9) and specify a curve (10-19) to put the calculated curve. Fill in directions and drift checks (if applicable) and click Calculate. Make Formation Lines Go to Formation Line Maker dialog box. WinSERVE utilizes the concept of formation 10 WinSERVE TM User’s Manual Copyright © 2012 by Performance Drilling Technology lines to define the dip and direction of formations. The lines are stored as survey curves and are useful not only as visual aids seen on a plot, but more powerfully as a line that can be projected to using WinSERVE routines to solve complex 3-D curvatures. The curve may also represent a lease line or hard line that must be avoided. This topic is discussed in more detail in Formation Line Maker. 11 WinSERVE TM User’s Manual Copyright © 2012 by Performance Drilling Technology c. Reports Survey Report Selecting Survey Report activates the WinSERVE Report Designer screen, as seen below. Here the user is presented with various options to setup the report and print it or save it as an ASCII file. Once the report layout is determined, it can be saved as a template to maintain preferred settings. It is important to remember that the report is generated for the curve selected on the Main Screen, so be sure you have the curve you want to print before moving to the Report Designer. For a full description of report setup options and procedures, see Error! Reference source not found.. Target Projection Report The Target Projection Report presents a tabular summary of three types of projections to an array of nine points in and around the target. A complete discussion can be found in WinSERVE Reports, Print Target Report. Least Distance Selecting the Least Distance option displays the screen seen below. WinSERVE calculates the least distance between the workcurve and either another single curve or all survey curves loaded into the program, including an ellipse of uncertainty model if 12 WinSERVE TM User’s Manual Copyright © 2012 by Performance Drilling Technology desired. The Least Distance Report provides the data for the selected pair of curves; in addition, a detailed ellipse report can be saved to file or printed. A Traveling Cylinder Graph may also be generated and printed. A complete discussion can be found in the separate section WinSERVE Reports, Least Distance. 13 WinSERVE TM User’s Manual Copyright © 2012 by Performance Drilling Technology d. Curve 21 Projections Straight Line MD <Ctrl>+<L> Straight Line TVD Build and Walk > MD,Target INCL and AZ at TVD (or Plane) <Ctrl>+<Z> OUIJA BOARD CALCULATOR <Ctrl>+<M> DLS projection to Target <Ctrl>+<T> Vector Project to Target 3D to Formation Line Vectored Curve Special Projection Setups Curve 21 Projections are an indispensable tool to aid the directional driller as he drills the well, allowing him to stay “ahead of the game” by testing various possible scenarios and predicting the results of alternative drilling strategies, and making confident and informed decisions and adjustments to drilling parameters “on the fly”. They are referred to as Curve 21 Projections because WinSERVE reserves Curve 21 for storing the results. The projections will be made from either the last entered survey (Sensor) of the Workcurve or from the projection to the bit (BHL) based upon which 14 WinSERVE TM User’s Manual Copyright © 2012 by Performance Drilling Technology button is selected on the Main Screen. However, if Curve 21 is the selected Curve Number on the Main Screen, then the projection is made from the end of Curve 21, allowing a series of different types of projections to be strung together as one curve and displayed. In fact, entire wellplan proposals may be generated in this manner. By using the Curve Manager to copy and store such a series of projections at any particular stage into another curve, it is clear that the user is provided virtually infinite choice and flexibility to plan a course of action. Selecting any of the options from this menu except the last two will pull up the Proposal Projection Form. All of these selections have common display elements including the Tie-in Point (the point from which the projection will be made) and the resultant Projected Point. Dependent on the specific selection, the Parameters box displays different sets of variables to be entered or solved for; in addition, other windows unique to each method are displayed as required. Below is an example of the screen for DLS projection to Target. Specific and detailed discussion of these powerful tools and their use can be found in 15 WinSERVE TM User’s Manual Copyright © 2012 by Performance Drilling Technology Projection Methods. 16 WinSERVE TM User’s Manual Copyright © 2012 by Performance Drilling Technology e. Tools [See the in-depth section on these features at the end of the manual.] Interpolate Interpolate between two survey points by MD or TVD. The interpolated point may be inserted into the survey list and labeled as such. The interpolated point may also be made a Tie-in point for a sidetrack well workcurve or proposal by selecting MAKE TIE IN. Tally book The Tally book is provided as a convenience to those who wish to utilize it, and the selfexplanatory entry form is shown below. The tally may be printed out. UTM Manager WinSERVE GEOMAPPER provides pull-down menus for choice of geographic area and the ellipsoid model to be employed. It is advised to consult the company geologist or other representative to obtain the proper model to be used. A full discussion of general mapping and modeling considerations, as well as an example calculation may be found in the Tools section at the end of this manual. Platform Manager The WinSERVE Platform Manager allows the user to establish a slot template describing wellhead locations for multiple wells. It should be noted that the scope of this feature is intentionally limited, inasmuch as WinSERVE is designed for and primarily directed toward serving the needs of relatively smaller drilling operations, by providing a powerful yet easy to use package of well planning and survey reporting tools whose focus is the individual well. Dip-DLS Calculator The WinSERVE Dip-DLS Calculator Tool is a convenience feature to get a quick visualization of a minimum DLS curve. The user specifies three of the six variables to generate the curve. An additional feature that is useful for directional drillers as they approach a formation ‘landing’ in a horizontal well is the calculation of the build rate needed. 17 WinSERVE TM User’s Manual Copyright © 2012 by Performance Drilling Technology f. Options AutoSave Click AutoSave ‘ON’ for WinSERVE to automatically save your file data every five minutes. Screen Colors Selecting Screen Colors pulls up the Main Screen Color Adjuster that allows the user to customize the “look” of WinSERVE by modifying the colors of the overall background, input fields, headings and labels, comment lines and alternating spreadsheets. Allow Cluster Survey Input Click ‘ON’ and you can enter multiple surveys at one depth Show Last Row 18 WinSERVE TM User’s Manual Copyright © 2012 by Performance Drilling Technology g. Wizards A “wizard” in software parlance is a set of organized steps that leads the user through the most common type of tasks. The Startup Wizard guides the directional driller by asking all the right questions and then leading him to the screen that he needs to get started with that particular task. Each of the Startup Wizards is just a link to the part of the program which you could otherwise navigate to yourself if you are familiar with the program.The sequence of startup wizards are as follows: 1. Filename- Entering the filename you want to work with is the first thing to be done. This file will contain all of the information for this job. It will contain your default settings, and all of the data for this job. 2. Job INFO- Enter the Job Information such as Company Name, Rig Location, etc. To do this from the Main Screen, select the INFO Button at the bottom. 3. I/O Parameters- Select Quandrant or Azimuth Input, Method of Calculation, and Feet or Meters. 4. Input Targets- Enter Target Shapes and locations. You can enter many different targets if you choose. 5. Curve Parameters- Assign names, numbers and colors to commonly used curves. 6. Tie-in for Survey- Enter the tie-in survey for the survey you are going to enter. 19 WinSERVE TM User’s Manual Copyright © 2012 by Performance Drilling Technology 2. Curve Information Area The Curve Information area of the Main Screen is shown at the left. A description of each input box is found in the table below. FIELD DESCRIPTION File Archive file name and path where data is saved. Displayed as a visual reminder only and cannot be edited. Work# Curve number currently used as your WORKCURVE. Normally where your surveys are entered and typically Curve 0 by convention. Default curve from which projections will be made. Plan# Curve number currently used for your proposal. Typically Curve 1 by convention. Curve# Curve number currently selected for which information is displayed. The ‘active’ curve in which program functions and operations may be performed Curve Name Name assigned by user for selected curve. Choose a name descriptive of the curve contents to help you organize and manage the job as the well progresses. Selected by using the drop down box. Another visual user aid for curve management. Curve Type 20 WinSERVE TM User’s Manual Copyright © 2012 by Performance Drilling Technology North Offset North (+) or South (-) offset in feet or meters. Used when entering surveys of an offset well for anticollision purposes, or to manually set up a multiple well slot template. East Offset East (+) or West (-) offset in feet or meters. Used when entering surveys of an offset well for anticollision purposes, or to manually set up a multiple well slot template. VS Direction Direction of the Vertical Section plane for the selected curve. RKB Elevation Offset in feet or meters from RKB to sea floor. Number Of Surveys Displays number of survey records in the selected curve. CLICKING in this window expands the survey list to a full screen view. CLICKING again will return to the normal Main Screen view. If an RKB is entered, Subsea (Subdatum) depths can be displayed, printed on the report, and plotted Subseas 21 WinSERVE TM User’s Manual Copyright © 2012 by Performance Drilling Technology 3. Curve Selector Permits the user to select the CURVE with which you wish to work: to view or edit surveys, to do projections, to plot or to print a report, for example. WinSERVE allows the user to quickly change from one curve to another simply by clicking one of the 30 buttons. Curves that contain data are easily identifiable by the raised, 3 dimensional appearance of the button. The color of the curve may be selected by right-clicking on the button. Curves 21-29 are reserved for different types of projection curves. Curve 0 is referred to throughout this documentation as the WORKCURVE. Curve 1 is generally reserved for proposals. It is recommended that you use the same curves for the same purposes from one job to the next, e.g., Curve 0 - Workcurve, Curve 1- Proposal, Curve 6 and 7 - Formation Dip Lines or Guide Lines, and so on. You are not restricted from making alternative choices for curve assignments; however, maintaining consistency between users and from job to job will minimize confusion and avoid inadvertent loss or corruption of data. 22 WinSERVE TM User’s Manual Copyright © 2012 by Performance Drilling Technology 4. Survey List Panel The Survey List Panel resembles a standard spreadsheet and functions in the same way. At the top of the window the Curve Name and Curve Type are repeated from the Curve Info area, and a reminder of whether the selected curve is the current proposal or current workcurve is indicated based on the Work# and Plan# settings. The example above illustrates the highlighted Tie-in survey and one selected survey. A survey is selected by clicking on the proper row in the gray column at the far left of the window. The entire width of the Survey list table cannot be displayed at once on the screen. The slide bar at the bottom of the window is used to view hidden columns extending off the right of the screen. These columns will be slid into view by displacing those to the right of the gray vertical divider (at the right edge of TVD above). The divider can be moved by placing the cursor over it and dragging it to another location. Individual columns can be collapsed by right-clicking in the column heading (the Course Length is collapsed above between Vertical Section and Closure Distance). Expand the column by right-clicking again. Column widths are adjusted by placing the cursor on the right column edge in the heading and dragging. The vertical slide bar at the right of the window allows you to scroll through the survey list. For a full screen view of the survey list, click in the Number of Surveys box in the Curve Info area. See Add Survey for a complete discussion. 23 WinSERVE TM User’s Manual Copyright © 2012 by Performance Drilling Technology 5. Location Info The survey calculation displayed here is the location of the Sensor (i.e., the last entered survey) or the Bit (BHL), depending on which button is selected. Input a Bit to Sensor distance in the text box to project to the bit. The arrow buttons are only displayed if BHL is selected (and the Workcurve is the current curve), since it is a projected point based on the current trend of the last two surveys. Very often this calculated point will differ from the driller’s estimation of actual drilling results. The buttons can be used to increment or decrement the projected survey parameters accordingly to obtain a more realistic bottom hole location (or the altered numbers may be input directly). This is an important consideration to remember since any further projections made from the bit may be grossly inaccurate if no experienced judgment is made regarding the expected BHL. Select Least Distance ON and specify a Comparison Curve to automatically calculate a least distance from the Sensor or Bit location to that curve. This is a very convenient feature to get a “quicklook” least distance to any curve of interest without leaving the Main Screen. See the Least Distance section for a complete description or report. 24 WinSERVE TM User’s Manual Copyright © 2012 by Performance Drilling Technology 6. The “NORMAL” Button – Mosquito Proximity Plot The latest enhancement to WinSERVE, click this button to see the Mosquito Proximity Plot. A powerful routine that graphically demonstrates the least distance to nearby wells, showing true minimum distance, distance on the TVD plane, and distance on the “normal” plane; that is, the plane perpendicular to the hole direction. A great visual aid for a driller to see his relative position to other wells. This form displays a floating graphic (you can drag it around) similar to a traveling cylinder diagram. At the center of the plot is the well that you currently have selected (and you can click on the curve buttons to change the reference well without closing the graphic window). The markers that are scattered about, if any, are other wells. You can select a survey station on the main screen in the background of the floating graphic window and watch all the distances change. It’s dubbed the “Mosquito Plot” because of this dynamic function – select a survey and then use the up or down arrow keys to move the cursor on the survey spread sheet. As the cursor moves from survey to survey the markers will shift around the diagram quickly, something akin to the way mosquitoes fly around. 25 WinSERVE TM User’s Manual Copyright © 2012 by Performance Drilling Technology There are four types of least distance that can be calculated using this graphic. a. Normal Plane This is the distance that the comparison well is from the reference well on the plane that is perpendicular (ie NORMAL) to the direction of the reference well. The graphic is oriented to high-side direction. The square symbols with the numbers represent the normal-plane distances. The red cross hairs represent north-south and east-west. The arrow at the end of one of the red lines represents north. This is an extremely valuable representation to a directional driller. It can be used to show where he is in comparison to his proposed path and show how many feet right or left and up or down he is from the equivalent point on the proposal. This type of calculation is not the same calculation that many directional drillers have on their calculators. Calculators don’t calculate normal plane - they calculate TVD plane, if that, and unless the well is horizontal the up-down right-left numbers that are provided are incorrect. b. TVD Plane This is the distance that the comparison well is from the reference well on the same horizontal plane (i.e., at the same TVD) as the reference well. The graphic is oriented to high-side direction. The square symbols with the numbers represent the normal-plane distances. The red cross- hairs represent north-south and east-west. The round solid filled symbols represent the TVD distances. c. True Minimum This is the minimum distance that the comparison well is from the reference well. It is not defined on any particular plane and is portrayed on the graph in terms of distance and direction. The hollow circular symbols represent the true minimums. True minimum and normal plane are related in that the normal distance from the reference well to the comparison well is the minimum distance from the comparison well to the reference well at the points of intersection. This is because, geometrically, the nearest point on any given well that is not parallel to the reference well will always be perpendicular to that point on the comparison well. d. Crossings When the True minimum is selected, the Check Crossings option becomes available. This is a very important option to select when concerned about the possibilities of 26 WinSERVE TM User’s Manual Copyright © 2012 by Performance Drilling Technology collisions. Since all of the other options only check for distances at the reference survey point, and no points in between, those methods will not pick up a collision. ‘Check Crossings’ employs an analytical geometry calculation to determine if there is a crossing of wells between the current survey station and the next survey station. When there is a crossing it is represented by an exaggerated solid circle. Note that crossings do not automatically imply collisions, but rather minimum points of approach between two wells. As such, they are the points at which collisions will potentially occur so it is important to turn this option on when collision is a possibility. If the directional driller selects a projection curve as the reference curve, he can look ahead along that possible path to determine the likelihood of a collision. The default range on the graphic is automatically calculated so that the outer most distance is equal to the maximum distance of all the wells. Thus, in this mode the distance is always changing and often of no practical interest. It allows one to see the ‘big picture’. Of more use is the fixed range, which when selected defaults to a radius of 25 ft or meters, but can be set to any value by the user. In this mode the driller can set a radius of interest and any well that comes within range will then “show up on his radar” and give him ample warning. 27 WinSERVE TM User’s Manual Copyright © 2012 by Performance Drilling Technology II. Main Screen Action Buttons 1. TARGETS Click this button to go to the Target Maker screen, where the user may enter multiple targets and target shapes, or modify existing targets. The Target Maker allows the user to design, rotate and offset targets of various shapes. You can specify a maximum of 18 different targets, with targets 19 and 20 reserved for the graphical projection system. Remember that the term “target” need not only refer to the geologist’s payzone. Specifying intermediate targets while drilling advances, such as ‘end of build’ or ‘entry point’ can be an immense help to the directional driller. In addition, targets may be used to define formation guide lines, which may in turn be used as a target object for a projection. 28 WinSERVE TM User’s Manual Copyright © 2012 by Performance Drilling Technology a. Target List At the bottom of the screen is a list of the WinSERVE Targets that resembles a normal spreadsheet in form and function. Vertical and horizontal slide bars are used to display parts of the list hidden from view. It is only necessary to enter the TVD and coordinates to specify a target. Coordinates may be entered in either rectangular or polar form: WinSERVE will calculate and update the form not chosen. Established targets may be edited by clicking in the cell of the item you wish to change. To delete a target, first select it by clicking in the column to the left of the target number to highlight the record, then press <Delete>. If the target is an entry point for a horizontal well it may be desirable to enter the Inclination At Target. See a description of all Target Entry Parameters below. Target Entry Parameters: Target Shape The Target Shape is chosen by first clicking in the column, then clicking on the pull down button to view the choice of shapes: circular, square, rectangular, polygonal, ellipsoidal and point types of targets. There is no reason that hybrid targets combining shapes could not be designed: by overlaying a square and a circle, for example, a half square, half circular target can be generated. TVD True Vertical Depth of Target NS Coordinate North-South coordinate of Target. North coordinates are positive values, South coordinates are negative values. 29 WinSERVE TM User’s Manual Copyright © 2012 by Performance Drilling Technology EW Coordinate East-West coordinate of Target. East coordinates are positive values, West coordinates are negative values. Polar Direction Direction to Target from the origin (Well head normally) Polar Distance Distance to Target from the origin (Well head normally) Inclination at Target For vectored targets, such as a horizontal entry point, enter the Inclination of the target here. This value will be used when ‘Build Rate Needed’ calculations are made. Azimuth at Target For vectored targets, such as a horizontal entry point, enter the Azimuth of the target here. The Vector Projection routine will use this value if that projection is chosen. Inclination from last Target Value is calculated, not input. It is the inclination from the last target to the current target, and is useful for well planning purposes. Often, but not always, equal to the Inclination at Target for the previous target. Azimuth from last Target Value is calculated, not input. It is the azimuth from the last target to the current target, and is useful for well planning purposes. Often, but not always, equal to the Azimuth at Target for the previous target. Number of Vertices Number of corners for a polygon. Squares and rectangles all have 4. Polygon may have a maximum of 8. Rotation Rotation of the target, relative to the direction. Target rotation may also be entered in the spin box that is below the picture of the target shape. Thickness Thickness of the target. Not used in the current version, but may be incorporated in future versions. Included here for the sake of completeness. However, should 30 WinSERVE TM User’s Manual Copyright © 2012 by Performance Drilling Technology you have a cylindrical target, for example, it can be modeled by defining the top and bottom as two separate targets. Display Pattern Pattern within target picture for screen display only. Target Comment Comment associated with the target, such as ‘Entry point’. b. Target Boundary Points and Picture Target dimensions are entered in this table. The inputs vary based on the selected Target Shape; for example, you need only specify one side of a square, or the diameter of a circle to define it, whereas a rectangle or ellipse requires two lengths, X and Y. The convention used here is that the X- axis is perpendicular to the polar direction of the target. In other words, for a rectangle with lengths of X=100 and Y=50, the ‘low’ side of the target will be the longer side seen at the bottom of the picture. The target shape is centered around the given target coordinates. The top line of the table contains the X and Y offset of the target shape center point. Normally these numbers should be zero. Only if the entire target needs to be shifted with respect to the original center should an offset be entered. 31 WinSERVE TM User’s Manual Copyright © 2012 by Performance Drilling Technology An X offset moves the target shape left (negative) or right (positive), perpendicular to the polar direction of the target; a Y offset moves the target shape ‘up’ (positive, closer toward the origin in plan view) or ‘down’ (negative, away from the origin in plan view) along the line of polar direction. Note that it is the target shape that shifts: the target coordinates as entered in the Target List remain the same. The target picture is displayed to provide a visual reminder of the selected Target Shape and the current rotation status of the target. Rotating a point or a circle is meaningless, but rotation of a polygon, rectangle, ellipsoid or square can be seen. c. Target Offsets Surface offsets apply a “global” correction to all targets in the table. Here are three scenarios in which this feature will save you a lot of extra work. You have just finished doing a well plan with 4 targets and the geologist calls to say that all of the targets have been moved down 17 feet because he forgot to include a TVD offset. Or, he calls and says that the targets remain the same, but the surface location of the rig has moved. Or, perhaps you are trying to determine an ideal surface location for a customer. Pressing the SURFACE OFFSETS button pops up the Target Offset dialog box in which you can enter TVD and rectangular offsets and apply them to all of the targets listed. For example, to move your targets down by 10 feet, enter a 10 in the TVD box and press ADD TARGET OFFSET. To move the targets up by 10 feet you would press SUBTRACT TARGET OFFSET. The best way to learn how this tool works is to simply play around with it and notice how the target coordinates change. Reference Options The reference options are with respect to the target or to the wellhead. Normally you would select To Target, which facilitates setting up the target boundaries. Selecting “To Wellhead” can be useful to view actual coordinates of a target’s corners, for example. 32 WinSERVE TM User’s Manual Copyright © 2012 by Performance Drilling Technology 2. INFO Click this button to open the Error! Reference source not found.Error! Reference source not found.Error! Reference source not found.Error! Reference source not found.Error! Reference source not found.Error! Reference source not found.Error! Reference source not found.Error! Reference source not found.Error! Reference source not found. Form dialog box to enter the basic well information to be used in the header for plots and reports. This information is not used in any calculations. It is only used for reference purposes and as header information in reports and plots. Hit <TAB> to move between fields. Grid: Grid divergence between Grid North and True North. GL or MSL: Ground Level or Mean Sea Level. 33 WinSERVE TM User’s Manual Copyright © 2012 by Performance Drilling Technology 3. WELL PLANNING Click this button to go to the Well Proposal Planning screen. The Well Plan package is available only in the Office Copy of WinSERVE; the button is dimmed for field users. However, the field user may utilize the various powerful Projection tools to generate a wellplan. See the section on Well Planning. 4. PROJECTIONS Click this button to go to the Graphic Projection Mode screen. This screen provides a visual, target-centric graphical view of various types of projections. It is an extremely powerful way to view complex situations around the target. See the section on Projections. 34 WinSERVE TM User’s Manual Copyright © 2012 by Performance Drilling Technology 5. ADD SURVEY Click this button to open the Adding a survey dialog box. To edit a survey just select it on the spreadsheet listing. Adding Surveys This is the screen where surveys can be added to the bottom of a survey list, and is accessed by pressing the ADD SURVEY action button. Surveys may be added to any curve, but in general it is only relevant to add surveys to your workcurve. To add a single survey, enter the data, <TAB> between fields and press DONE to return to the Main Screen (individual surveys may also be easily input directly into the Survey List spreadsheet). To enter multiple surveys, the ADD MODE facilitates repeated entries by looping back to the Measured Depth field after the Azimuth is entered. Press either the <ENTER> key or the <+> key to go to the next field. This method of input is used here so that a person who is entering many surveys on a numeric keypad can do it quickly and efficiently, without hesitation. When you are finished entering all of your surveys press DONE to return to the Main Screen. If you want to do a series of rotational check shots, or ‘cluster surveys’ at a single depth, choose OPTIONS>ALLOW CLUSTER SURVEY from the menu. Click ADD SURVEY, then check CLUSTER SURVEY INPUT to open the following input box: 35 WinSERVE TM User’s Manual Copyright © 2012 by Performance Drilling Technology Click to choose the number of surveys in the cluster (from 2 to 8) and enter the surveys. Click Calculate Cluster to derive the Average Projected Survey. This is a true positional average, not merely a numerical average of the surveys, which would yield an incorrect answer. Quadrant or Azimuth Input Survey direction may be entered as either a quadrant or azimuth by selecting the Directional Input Method. Whichever mode is selected, the survey direction is displayed in the alternative form in the gray box just below the input text box. WinSERVE Automatic Calculation Features When a survey is entered and calculated, WinSERVE may automatically perform numerous other calculations, depending on the selected options. The following list illustrates the available task functions: 1- Use a trend projection based on the last two surveys to calculate the bit 36 WinSERVE TM User’s Manual Copyright © 2012 by Performance Drilling Technology location. The ‘Bit to Sensor’ distance is input in the Location box at the upper right hand quadrant of the MAIN SCREEN. 2- Calculate all projection options that are checked in the PROJECT screen and place the results in their respective assigned curve locations (Curves23-29). The projection will be made from either the Bit location or Sensor location depending upon whether the BHL or SENSOR button is selected 3- Calculate the least distance between your workcurve and the curve specified in the upper right hand quadrant of the MAIN SCREEN by clicking Least Distance ‘ON’. The least distance will be calculated from either the Bit location or Sensor location depending upon whether the BHL or SENSOR button is selected. The comparison curve can be the proposal curve or an offset well. Even when drilling through a complex maze of wells, generally you will be concerned with no more than 3 or 4 wells at one particular time. If you have entered (or imported) the surveys and corresponding surface location offsets into other available curves, this feature provides a quicklook determination of the least distance to each well of interest by simply entering the number of the curve to which it is assigned. A complete Least Distance report or Traveling Cylinder plot for desired sections of the entire curves is available by choosing Reports>Least Distance from the pull-down menu. Editing Surveys You can edit your data directly on the spreadsheet at the bottom of the main screen. The Tie-In Survey is the first record and is highlighted in black and white. With the exception of the Tie-In, you are only permitted to edit the Measured Depth, Inclination, Azimuth and Comment fields, since all other values are calculated. To edit a survey click on the item of data you wish to edit and change it on the screen in the same way as with a standard spreadsheet. There are several ‘Hidden Features’ for editing that you must remember since they are not displayed on the screen. To the left of the spreadsheet window is a gray bar. Click on that gray bar to highlight the entire record to the right of the cursor. This is called ‘selecting’ a survey. By dragging the mouse up or down while on the gray bar you can select more than one survey. Once you have selected a survey there are five different things you can do: 1- Delete a survey or group of surveys by pressing the <DELETE> key. You will be prompted to confirm or cancel the deletion. 37 WinSERVE TM User’s Manual Copyright © 2012 by Performance Drilling Technology 2- Insert a survey by pressing the <INSERT> key. A blank line will be inserted above the record that is currently selected, allowing you to input the new survey data. 3- Make the selected survey point a target point by typing <T>. A pop up list will show the current TVD’s of the target list. Select an unused target number from this list, and the coordinates and TVD of the survey point will automatically be copied to the WinSERVE target table. This is a handy feature to pick an intermediate drilling target from the proposal curve or from a projection curve, for example. 4- Comments attached to surveys are quite often necessary when printing out the data in the Survey Report, but may not be desirable when plotting because they clutter up the plot and overwrite each other. Once the comments have been entered, WinSERVE allows the user to turn all selected comments ‘off’ (e.g., to plot) or ‘on’ as appropriate. This is accomplished by inserting an asterisk <*> in front of the comment in the comment field. This would be tedious for a long list of surveys; so, after having selected the surveys, typing <C> will add asterisks for all of the comments associated with those surveys and prevent the comments from appearing on the plot or in the survey report. 5- Remove the asterisks for all of the selected survey record comments by typing <A>. This action enables comments from those records to be printed in the survey report or to appear on the plot. 38 WinSERVE TM User’s Manual Copyright © 2012 by Performance Drilling Technology 6. PLOT Click this button to go to WinSERVE Survey Plot screen to generate a plot of the currently selected curve and any other curves that are checked in the CURVES > PLOT COLORIZER dialog box, which is accessed from the Plot screen. See Plot. 39 WinSERVE TM User’s Manual Copyright © 2012 by Performance Drilling Technology 7. REPORTS Click this button to go to the WinSERVE Report Designer to print a report of the survey list of the currently selected CURVE # as displayed on the Main Screen. If you want to print your workcurve (normally Curve 0), be sure to select that curve before pressing this button. See Error! Reference source not found.. a. Survey Report Designer The Report Designer screen is shown below. The user chooses the information to present in the report. Once setup, the report design may be saved as a template, enabling the user to easily and quickly output different report configurations for different intended purposes and viewers (using a larger font for faxing, for example). A description of the report features and options follows. 40 WinSERVE TM User’s Manual Copyright © 2012 by Performance Drilling Technology Header Comment In addition to the job information presented in the header section, a header comment of up to four lines may be inserted at the top of the report, centered on the page, just below the header section. Remember to put a backslash <\> at the end of each line when typing comments. Click MAKE DEFAULT if you want this comment to appear on every report. Available Fields There are 21 fields available to be printed in the Survey Report. To add an item to the bottom of the list of fields to be output, click on it to select it, then press ADD. To insert an item in the list, select it, click on the Fields in Report item above which you want it to appear, then press INSERT. Depending on the number selected, it may be necessary to experiment with the font size or print the report in landscape mode for an easily readable and well organized report. Two Fields of special note are Up-Down and Left-Right, which are particularly useful in horizontal sections to know the location relative to a formation line. After selecting and ADDing or INSERTing these fields, press the SETUP LINE pop-up box (indicated by the cursor above) to go to the Special Projection Parameters screen to input the Curve # to which the distance to the survey station will be calculated. Fields in Report Displays the fields that will be printed in the survey report. Fields listed in descending order in the box are printed left to right across the columns of the page. To remove an item from the list to be printed, select it, then press TAKE BACK. Boxed Comments If this box is checked, a box will be placed around each survey with its associated comment in the report, thereby highlighting the comment. Projection to Bit If this box is checked, a projection made to the bit will be printed IF: The curve to be printed is the workcurve (as indicated by WORK# on the WinSERVE MAIN SCREEN), AND A Bit to Sensor distance is entered in the MAIN SCREEN. 41 WinSERVE TM User’s Manual Copyright © 2012 by Performance Drilling Technology Show Projection to Bit at TVD and Inclination This is a special flag active only when printing a report of the workcurve. It is particularly useful for horizontal wells where it is critical to know what the needed build rate and landing point are projected to be. If this box is checked, all of that information will be printed at the end of the report, after the projection to the bit. If the projection to the bit is not selected then the projection is made from the last survey point. If checked, press SETUP to go to the Special Projection Parameters dialog box to select the curve in which the formation line is stored and input the required entry angle. The projection will be stored in Curve 23, where it may be viewed, printed or plotted. Grouping Grouping refers to the number of surveys that are printed before an empty line is inserted into the printout. This enhances the readability of the survey list. From Depth The measured depth from which the survey list will be printed. The default is 'ALL', but any start depth may be specified by selecting it in the list box at the lower left of the screen. Save Template Once you have your report setup the way you want it, you may save it as a template with a .TMP extension. This is advantageous if you need to print or save the report in several different formats, eliminating the need to redo the setup for each type. Get Template If you have created templates for different report formats, press this button to retrieve the file with your preferred setups. Print Critical Points Press this button to print a survey report including only the critical points of your proposal. The critical points must first be applied to the survey list on the Well Plan screen in order for this report to be available. Print Target Report Press this button to print the Target Projection Report for the currently selected target. A tabular summary of projections of the workcurve to the center and 8 other points on or around the target boundary, depending on the target shape, is printed. The Target Report is available even if the workcurve is not the curve 42 WinSERVE TM User’s Manual Copyright © 2012 by Performance Drilling Technology selected to print. A diagram of the target and 9 projection points is included. The three projection methods utilized are Protractor, Minimum DLS Curvature, and Slant Well with specified DLS. The DLS is input in the Special Projection Parameters dialog box (press SETUP to access) or from the Graphical Projection Mode screen (press PROJECT button on MAIN SCREEN). The projected bit location will also be printed if BHL is selected on the MAIN SCREEN, as well as proximity data to the Comparison curve (which defaults to PLAN#). Report to Print Pull down menu to choose among Survey Report, BHL Report or Pipe Tally. See the appendix for sample reports. Interpolated Reports Click ON if you want to fill a gap in the survey list with interpolated surveys. The interpolation may be done by MD or TVD, with the user specifying the desired start and end depths and the station interval. EW – NS Reference Choose the reference to be the wellhead (normally) or slot location. Directional / Mining Mode Switch Typically ‘directional’, but mining applications consider a vertical inclination to be “90” and horizontal to be “0” degrees. The data is transposed for the purposes of the report. 43 WinSERVE TM User’s Manual Copyright © 2012 by Performance Drilling Technology b. Curve List The yellow box in the lower right hand corner is for selecting the curve you want to print. The default curve is the curve that was displayed on the MAIN SCREEN when you chose to go to the Report Designer. The name of each curve is listed. If no name has been assigned to the curve then a blank line is displayed. Logo Bitmap Press this button to Select Bitmap to Use as Logo on the report. Logo Size Press this button to choose Bitmap Size to be printed. Magnification factors between 0.1 and 5 times may be specified. Fonts ICON Press this ICON to select the general font and font size for the report Some experimentation is necessary to optimize the look of the report. Printer ICON Press this ICON to display the Print dialog box and print the report. You may setup your printer here and choose Portrait or Landscape orientation for your report. Currently there is no Print Preview feature available in WinSERVE. ASCII File ICON Press this ICON to display the Save ASCII Text File dialog box to save the report as a text file. Your filename will automatically be given a .TXT extension. This is very useful if you need to create a survey file to export to another program. Setup the Fields in Report to include only Measured Depth, Inclination and Azimuth; press the ASCII File button and answer “no” to a full report to create a space delimited text file of raw survey data. 44 WinSERVE TM User’s Manual Copyright © 2012 by Performance Drilling Technology c. Least Distance Selecting ReportsLeast Distance from the MAIN SCREEN Menu Bar pulls up the screen shown below. The screen is organized into five areas, two of which are not visible unless the relevant option is checked: • • • Reference Curve – Compare Curve Least Distance Model Traveling Cylinder Ellipse of Uncertainty Least Distance Comparison Table Reference Curve – Compare Curve Specify by number the two curves you want to compare, for example, the workcurve and an offset well. The Curve Information entered on the Main Screen is reproduced to the left of the screen. The calculation is performed automatically as soon as you <TAB> 45 WinSERVE TM User’s Manual Copyright © 2012 by Performance Drilling Technology off the curve number entry, allowing you to quickly examine multiple curves. Note that the actual distance and direction are not initially visible in the table; use the scroll bar at the bottom to view the information at the far right of the table. Select whether you want the direction reference to be ‘High Side (HS)’ or ‘North’. The table is updated as you switch between either reference. If you press ‘Click here for more’ you are given the option to perform the scan at each survey station or by a specified increment, and by MD or TVD. The default is by station MD. The program limits the minimum increment so that a maximum of 500 points will be calculated. The user can specify a Start and End Depth to focus on a particular curve section if ‘Increment’ is checked. ZOOM Feature For an even more narrow focus, a ZOOM feature is provided. Press ‘Click here for more’, select ‘Increment’ and specify the depth range to zoom in on. Enter an increment value and click OK. The least distance will be recalculated over the selected range and displayed in the table. Once such a calculation has been made, you may continue to zoom further by selecting a range of data points from the table (by clicking on the far left column of the table and dragging) on which to ZOOM, then type ‘C’. The calculation will be redone over that range with a scan increment equal to one-tenth of the previously specified increment. For example, if you had entered an increment of 10 feet, the scan in the ZOOMed range would use an increment of 1 foot. The table is expanded to include the ZOOMed range. Press ‘C’ again and another scan with an increment of 0.1 ft. (this time one-tenth of 1 ft.) will be calculated and displayed. This can be of great importance if the drilled well passes nearby an offset well and the actual least distance between them happens to occur between the originally calculated stations, in which case you may be misled and given a false sense of security, not being aware how close you actually are. Thus it is always a good practice to ZOOM in the range of possible interference, on either side of the initially calculated least distance. Least Distance Model WinSERVE calculates least distance as either the True Minimum Distance or TVD Slice Distance. The True Minimum model is generally preferred because that is the critical 46 WinSERVE TM User’s Manual Copyright © 2012 by Performance Drilling Technology information sought. The program will ‘look out’ from the station in all directions searching for the closest point of the comparison curve, whereas in the TVD Slice method, the search is confined to a horizontal plane at the TVD of the station. To appreciate the difference, imagine a scenario of two inclined curves heading in different directions and crossing one above the other. The TVD Slice may determine an irrelevant point where the comparison curve has already passed and is moving farther away from the reference, when the critical least distance is ‘just over your head’ at a slightly higher TVD! Selecting True Minimum Distance opens a pop-up box to choose the Minimum Distance Increment. The least distance is calculated from the Reference Curve to the survey stations of the Compare Curve. As with the discussion of the ZOOM feature above, there is a chance that the true least distance point may fall between survey stations of the Compare Curve. By specifying the Minimum Distance Increment, the calculation is performed for interpolated stations between surveys at the chosen interval to obtain a more accurate least distance value. Traveling Cylinder Checking Traveling Cylinder opens the Traveling Cylinder Options dialog box. The user enters the Start and End TVD and the Cylinder Radius within which the calculations will be done. Click the appropriate radio button for whether the calculations will be performed only between the two comparison curves (Comp Well) or for all curves selected (All Wells). Press Curves to view and select from the list of curves. Check the box if you want to Apply Subsea values to TVD. Select the Reference to be True North or High Side. Once the Options have been set, press CALCULATE. The Traveling Cylinder plot is displayed. Press Expand Plot for a full screen view; press Hide Plot to return to the options screen. If you change any options, be sure to press Erase Plot before you CALCULATE again – the plot is not automatically refreshed. Press Print Cylinder to print the plot. Ellipse of Uncertainty Checking Use Uncertainty opens the Ellipse of Uncertainty dialog box. Choose the uncertainty model to use and also the type of survey instrument, which assigns a standard error specification for the tool type to be used in the calculation. Least Distance Comparison Table At the bottom of the screen is a tabular presentation of the least distance calculations in spreadsheet form. To the left are the survey data of the Reference Well; the next 47 WinSERVE TM User’s Manual Copyright © 2012 by Performance Drilling Technology columns to the right show data for the calculated least distance point of the Compare Well. Use the horizontal slide bar to view the distance, direction and inclination of the point as measured FROM the Reference TO the Compare. If the TVD slice model is used, there is no Inclination between points (all inclinations are 90 deg), and NO=TVD is displayed for records in which there is no TVD overlap. It is possible to delete rows from the table but no data may be edited. Press PRINT for a Least Distance Report that reproduces the information in the table, along with a graphical indicator of relative direction at each station. A small arrow displayed with the inclination provides a reminder of whether the compare point is above (Inc>90 deg, less TVD) or below (Inc<90 deg, more TVD) the reference. Ellipse Report The Ellipse Report permits the user to save ellipse of uncertainty tabular data as a text file (.TXT) that may be viewed in Windows Notepad or printed. 48 WinSERVE TM User’s Manual Copyright © 2012 by Performance Drilling Technology 8. TIE-IN Click this button to open the Error! Reference source not found. dialog box. A tie in may be entered for each curve that is not reserved for projections. Note that the user is reminded of the curve number and name at the top of the box. <TAB> to move between fields. The Tie-In Survey may also be entered directly onto the survey list spreadsheet as the first survey (highlighted by white numbers on black background). A Tie-In may be entered for each curve that is not reserved for projections, i.e., any curve other than curves 21-29. 49 WinSERVE TM User’s Manual Copyright © 2012 by Performance Drilling Technology 9. PARAMETERS Click this button to open the Error! Reference source not found. dialog box to set input and output parameter choices, measurement units, etc. Dialog box for entering survey parameters and preferences. Choose the Method of Calculation, preference for azimuth input and output, the vertical section reference, and measurement units of feet or meters. Although the program will convert depth and displacement data, it is important to realize the inherent limitation: if you are mistakenly set on meters, and enter a value of 1000 ‘real’ feet, converting meters to feet will change the number to 3280 feet – in other words, a true mathematical conversion is performed, not merely a change of label! 50 WinSERVE TM User’s Manual Copyright © 2012 by Performance Drilling Technology 10. SAVE Click this button to save all of the data and the setup parameters. WinSERVE saves all of the well information in a single file. It is generally good practice to press this button as often as needed. However, it is possible to have WinSERVE automatically save every five minutes by choosing Main Screen>Options and clicking ‘ON’ AUTOSAVE. This feature is on by default. 51 WinSERVE TM User’s Manual Copyright © 2012 by Performance Drilling Technology III. Plots The plotting screen is a powerful tool that can be used to produce superb looking plots with little effort. WinSERVE can print any plot on any printer that is fully supported by Windows, which is virtually all printers. In addition to printers, WinSERVE can also produce a DXF file that can be used by any CAD package to produce wall sized plots. Customizing the wall size plots beyond WinSERVE’s capability can be accomplished through third party packages such as AutoSketch, TurboCad, AutoCad, Micrographics, etc. AutoCad Lite is the option recommended by Performance Drilling for new users, since it provides sufficient features for professional wall plots in a cost effective package. 52 WinSERVE TM User’s Manual Copyright © 2012 by Performance Drilling Technology 1. Plot Controls The features and functions of each of the menu items are discussed below: TYPE OF PLOT Select the type of plot you want from the drop down box: Composite Horizontal Vertical Structure slot Plot consisting of both the Vertical and Horizontal views Plot of the Horizontal view only Plot of the Vertical view only Horizontal Plot with circles plotted at the origin to depict the template at the well head GRID CONTROL Select your preference for displaying grid lines. For the Composite Plot, each view is controlled separately. None Apply no grid line to currently selected plot type Coarse Apply a grid line to each major division as defined by #TICKS for currently selected plot type Fine Apply X number of grid lines between major divisions for currently selected plot type. Enter the desired number of fine lines in the input box. The number can be quickly adjusted using the arrow buttons. COLORING GRID LINES – The user can customize the appearance of the plot by choosing colors for both the coarse and fine grid lines. Right-click on the label GRID CONTROL to display the color selection menu and choose the color of the major division lines. Left-click in the same area to select the color to be applied to the fine grid lines. These colors may also be set by clicking the left balloon button for fine lines and the right balloon button for coarse lines. When preparing a plot for output to a DXF file the only colors that map exactly are the colors that have at least one value of 255 in the RED, GREEN and BLUE components of the selected color. # TICKS The number of major divisions on the X-axis of the selected plot. Use the arrow buttons to quickly fine-tune the appearance of the plot: the UP arrow increments 2 ticks per click, the DOWN arrow decrements by one. 53 WinSERVE TM User’s Manual Copyright © 2012 by Performance Drilling Technology SPACING The number of feet or meters between major TICKS on the plot. The arrow buttons change the value by 50 units per click. PLOT TYPE TVD When selected, changes in SPACING, #TICKS and GRID CONTROL settings will apply only to the TVD (Vertical) plot and the cursor tracking boxes at the top of the screen will display TVD and VS. HORZ When selected, changes in SPACING, #TICKS and GRID CONTROL settings will apply only to the Horizontal plot and the cursor tracking boxes at the top of the screen will display rectangular coordinates. Another way to switch between the horizontal and TVD plots is to move the mouse to the plot area on the screen and click in the general area of the desired plot. Notice that the Plot Type buttons toggle back and forth depending on the selected plot. ORIENTATION Select the preferred orientation for viewing the plot on the screen. Horizontal wells, for example, generally look better in landscape mode. When printing, double check to see that the printer is setup to print in landscape or portrait (Press PRINT, then select SETUP). Portrait Landscape will hide the Select this if you want your plot oriented like the page you are looking at now. (The Main Screen will be visible beneath the Plot window). Select this if you want your plot oriented sideways. When in Landscape mode, right-clicking within the plot area menu; right-click again to restore the menu. HEADER Select this button to go to the Plot Header Setup screen. Check each item you want to appear in the header section of the plot, if any. If you choose not to have a header, the plot may be sized so that the plot area is maximized. The last three options do not pertain to the header. Check ‘Framed?’ to draw a frame or box around the plot area. Check ‘Axis Titles’ to label each axis of the plot. LABEL 54 WinSERVE TM User’s Manual Copyright © 2012 by Performance Drilling Technology Press this button to open the Labeler dialog box to select the survey labels you want associated with each data point. The frequency with which the labels will be displayed is controlled with the Survey Spacing slidebar, ranging from every one to every 500 surveys. Labels for the Vertical and Horizontal views are selected independently. For any of the selected labels to appear on the plot, you must check the Comment box. (To prevent actual survey comments from being displayed, use the asterisk <*> operator, as discussed in Error! Reference source not found.). Conversely, to remove all labels, clear the Comment box checkmark. The Blocked Comment Options allow the user to specify a color for the alphanumeric type, the background within the frame enclosing the label, the outline of the frame, and the line drawn from the frame to the data point. The Font may also be specified. Press Apply to preview your selections before returning to the Plot screen. Pressing Reset ALL will override your label selections and restore the comments originally entered in the Survey List. When you are satisfied with the appearance of the plot, press OK. On the Survey Plot screen, individual Label frames may be repositioned by leftclicking within the frame and dragging it. Right-clicking within the frame opens the Comment Properties dialog box, where you can view the Survey Information for the point, edit the label or delete it. Press APPLY to put the change into effect. Press RESET ALL to restore the comment as it was. At times, after dragging and dropping various frames, the program may lose track of the positioning pointers it uses to organize all the information on the plot, and get ‘hung up’. If this happens, press LABELS, RESET ALL to restore normal functionality. Choosing which curves to label- If there is more than one curve to plot, it is unlikely that you will want to label every curve. WinSERVE allows the user to turn labels on or off for each curve independently. See the following section about CURVES to learn how. CURVES One of the most powerful features of WinSERVE is the ability to quickly decide what to plot and what not to plot. When drilling a well it is most often desirable to show the proposed curve, the current survey curve, and a projection to target 55 WinSERVE TM User’s Manual Copyright © 2012 by Performance Drilling Technology all on the same plot. It may also be desirable to show an offset well at times. Select the CURVES button to accomplish these tasks with ease. Plot Curve Check box - Check the first box next to each curve number to select it to plot. If you press the PLOT button on the WinSERVE Main Screen and your currently selected curve (Curve # on the Main Screen) is not checked to plot, WinSERVE automatically sets it to plot. The logic is that it is assumed that you want to view that curve now. Label Curve Check box - Check the second box next to the Curve Number if you want labels applied to that curve. Obviously you would not want survey labels for any curves storing dip or formation lines! Curve Color - Click on the rectangular colored box to the right of the Curve Number to choose the color of the curve. The Curve Name will appear in the box if one has been assigned. Press SELECT All Data Curves to check them all for Plotting. Only the workcurve automatically is checked for Labels. Press UNSELECT ALL to clear all checkboxes. ZOOM ON or OFF Zooming is a powerful feature that allows you to quickly zoom in and see details of the curves. The zoom screen does not magnify the grid. Positioning zoom box- Press the ZOOM button to change to ‘ZOOM ON’ (the letter color will also change to red). Place the cursor in the upper left hand region of the area you want to zoom on, click, and drag the box to the diagonally opposite (lower right hand) corner to enclose the area of interest while holding the mouse key down. Release the mouse button to view the zoomed area. Using Zoom as a protractor and string- The numbers at the top of the zoom screen show the TVD and Vertical section, or the NS-EW coordinates depending on which plot you have zoomed in on. If you select a point with the mouse and drag the mouse to another point with the mouse button still depressed, you will see that the distance and inclination (or direction) between those two points are also displayed. This is the equivalent of an electronic protractor and string, and is useful to see how far off the line you may be, or to do a ‘quick and dirty’ straightline projection to a point 56 WinSERVE TM User’s Manual Copyright © 2012 by Performance Drilling Technology PRINT Select this button to open the Print dialog box. In most instances it will be a simple and straightforward operation, just press the OK button and your printer will print out the plot. However, if your printer is not turned ON, or is not the default printer, the program will crash. Press PRINT, SETUP to select landscape or portrait mode. WinSERVE does not currently support Print Preview, so it may be necessary to print out several plots to confirm that the presentation is how you want it. See the discussion below on Scaling the Plot for more information. Occasionally, you may want to adjust the printer settings before printing, and you can accomplish this by choosing SETUP, OPTIONS. Each printer has it’s own personality, otherwise known as a driver. Windows provides a standard interface for connecting those drivers, but neither the Windows interface nor the many different drivers are perfect, and unpredictable things can happen that are beyond WinSERVE’s scope. If you have problems with a particular printer and you are sure that you have everything setup correctly, call the manufacturer of the printer and discuss the problem with them. They will be able to help you out, especially if there is a bug fix and a new version for their driver. Make DXF Select this button to open the Save as DXF file dialog box. A DXF file (Data eXchange Format) is an industry standard file format that can be imported into any CAD package such as AutoCad, which would enable you to transfer your plot to a larger, wall size plot. All you need to do is name the file; an extension of .DXF will be automatically appended. The file that WINSERVE exports is nearly, but not exactly like the 8 ½ by 11 size plots. Information pertaining to Curves, Labels, Grids and Colors (varies according to the importing package) will be exported. Frames inserted by means of the GRAPHIC BUTTONS (Logos, Critical Points, Comments or Target Parameters) will NOT be exported! SET ORIGINS Press this button to open the Set Plot Origins dialog box. The maximum TVD value of the Vertical plot can be either calculated automatically or set manually. WinSERVE will scan the selected curves to set the MAX TVD. Sometimes this automatic value bumps up against the lower axis line, and the only way to move it is to manually set it. Adjust this value if your plot is being placed too high or too low. It is generally best to initially have it set to AUTO CALC to view how it 57 WinSERVE TM User’s Manual Copyright © 2012 by Performance Drilling Technology is scaled, and then choose a MANUAL SET value if necessary. You can also set the MINIMUM values of the Vertical Section to move the vertical axis, and set minimum NS and EW values for the axis lines of the Horizontal plot. Being able to set these values allows you to set up the equivalent of a zoomed plot. See the discussion below on Sizing the Plot for more information about adjusting the plot axes. DONE WinSERVE standard key for exiting the Plot screen and returning to the Main Screen. TRACKING Check the box to activate a unique and powerful feature of the WinSERVE plotting routine. When TRACKING is ON, notice the set of ‘crosshairs’ that appears in each view of the plot. The center point tracks along any selected curve by moving the mouse and interpolates survey information for any point along that curve, displaying the results in a table at the top of the screen. The color of the numeric survey data in the table corresponds to the color specified for the selected curve being tracked (the curve number is shown in the box title). Jump between curves and note the change! If you check the Least Distance box within the table, another window pops up to display constantly updating Least Distance to Curves, with a data line for as many curves as are plotted; again, the color of the data matches the color of the curve. This is a True Minimum Distance calculation. You may select North or High Side reference (which only affects the direction between points). The REFERENCE (‘From’) curve is whichever the crosshair is tracking, and is identified in the Interpolation box at the top. The COMPARE (‘To’) curves are all the others which are shown in the window, displaying, from left to right, the curve number, least distance, direction to LD point, inclination to LD point, comparison TVD, NS and EW coordinates, and a graphical indication of High Side direction. Enter a value in the RADIUS input box at the top and a circle of that radius appears at the crosshairs. This provides a threshold or cutoff distance: no data will appear in the Least Distance window unless the COMPARE curve falls within this radius, as can be seen on the screen. This provides the user with a very quick and efficient method to determine whether you may be approaching too close to another well. 58 WinSERVE TM User’s Manual Copyright © 2012 by Performance Drilling Technology The Least Distance window may be moved anywhere within the plot screen so that it does not obscure the curves by clicking on the Least Distance to Curves title bar and dragging the box. GRAPHIC BUTTONS You can place a Target Parameters box, a Critical Points box and a Comment box on your 8 ½ by 11 or A4 plot. In each case, pressing the button positions a small box in the upper left hand corner of the screen. Click on it and drag the box onto the plot, placing the upper left hand corner at the location where you want the box to be drawn. The size of the box will be automatically adjusted to accommodate the number of targets or critical points that are to be printed. In the case of Comments, you can adjust the width of the box, and the height of the box will be automatically adjusted for you to accommodate the length of the comments. To remove any of these boxes from the plot screen, click the appropriate button again. In no case will the actual comment appear on the screen, to save on computer crunching; rather, the generic headings listed below will identify each box. Target Parameters Press the button that looks like a target. Critical Points Press the button that has the ‘P’ in it. Comments Press the button with the picture of a lined page on it. Color Balloon Press the balloon to the left to select the color for the fine grid lines. Press the balloon to the right to select the color for the coarse grid lines. V.S.P. The Vertical Section Plane. The VSP defaults to the value set in the PLAN # of the current PROPOSAL CURVE on the Main Screen. Our viewing angle is actually 90 degrees to the right of the direction of the vertical plane defined by the VSP. You can change the number here, to view from a different perspective, if for example, other plotted curves have different VSP’s than the Proposal, or the curves turn through three dimensional space. Reset Vertical Click this button to instantly move the origin of the Vertical plot to the lower left, 59 WinSERVE TM User’s Manual Copyright © 2012 by Performance Drilling Technology one major grid division up and right from the corner. Insert LOGO Click this button located at the bottom of the plot area to open the Select Bitmap to Use as LOGO dialog box. WinSERVE currently has over 200 company logos available in the folder C:\WINSURV2\LOGOS, and new ones may be added easily. Select the logo you want to insert: you will be prompted to select the region of the plot where you want to place it. (Note the letters of the button change to PLACE LOGO, in red). Place the cursor on the plot as the upper left hand anchor of the logo box, click and drag to create it. The box may be resized, and moved by dragging and dropping (click on it to view edit handles). A logo may not be distorted – the aspect ratio of the original .BMP drawing will always be maintained. It is possible to insert multiple logos, for both the drilling company and the operating company for example. To delete a logo from the plot, right-click within it to display Graphic Options, check Delete and press OK. Printer Spec Technical data about your printer, for information purposes only. Sizing the Plots WinSERVE provides a simple and efficient feature for visually sizing and designing the look of the plot. Known as ‘handles’, each view of the plot uses two handles that you can grab with the mouse to adjust the plot area and axis location. The handles are visible as small red squares, two of which are located at the respective origins of the Vertical and Horizontal plots, the other pair at the edge of each plot view. The handle located at the upper left hand corner of the plot to the left of the TVD axis will only adjust the available plot area as measured from the top of the page. Thus, if you chose not to print a header, for instance, you could drag the handle up to maximize the utilization of space on the page. Note however, that the action of this handle does have an effect on the Horizontal view as well, shortening or lengthening the NS axis as necessary to meet the uppermost boundary. The handle located at the lower left hand corner of the Horizontal view adjusts both dimensions of the rectangular plot box. Once again, major divisions of the NS axis will be added or subtracted as necessary, but dragging the handle left or right will only stretch or squash the EW axis grid squares without altering the scale, since the number of divisions along this axis is fixed by the # TICKS setting. Being a graphically oriented tool, a few minutes spent moving these handles around will more clearly explain their function than all the words of the preceding paragraph! 60 WinSERVE TM User’s Manual Copyright © 2012 by Performance Drilling Technology The other pair of handles allows you to position the origins wherever you want, and is most useful to specify which quadrants will be seen in the Horizontal view. If you have moved the origin of the Vertical plot, remember that you can return it instantly to the lower left hand corner by clicking Reset Vertical. 61 WinSERVE TM User’s Manual Copyright © 2012 by Performance Drilling Technology 2. Wall Plots with CAD When it comes to generating wall plots of directional wells the level of presentation has increased dramatically in the last few years. For one, the types of wells that are being drilled today are considerably more complex in many cases than the standard directional well of a few years ago. Thus the amount of information that is necessary to drill that well has increased and the tools to present that information have changed. Also, with the advent of giant ink jet printers such as the NovaJet and the HP DesignJet series the presentation quality has tremendous potential for improvement over what was generally acceptable just a few years ago with a CalComp plotter. With the new generation of plotters it is no longer necessary to purchase expensive specially-gridded paper nor is it necessary to select logos and fonts based upon how quickly a Calcomp can draw it. Since the new plotters are big ink jet printers, doing color fills of logos and fonts and grid lines is no more time consuming than any other type of line. To generate a wall plot you must first create a DXF file of the WinSERVE plot. Go to FILE>EXPORT>AUTOCAD LISP from the main screen menu (don’t worry about what that means, it’s an artifact from previous versions). You’ll then see something like the following screen: 62 WinSERVE TM User’s Manual Copyright © 2012 by Performance Drilling Technology Adjust your paper size and scales and click GENERATE DXF. This DXF file can be imported by a wide variety of CAD programs such as AutoSketch, Vector or DesignCad. The advantage to using a CAD package is that advanced tools are available for modifying the drawing. The DXF file that is generated by WinSERVE is very much like the plot that is generated on the screen. It is not identical, but it is very similar. Going to AutoCAD With AutoCad running you should see a blank screen. This blank screen is actually a prototype drawing, normally called ACAD.DWG. You can set up standard features you want to always have available with this drawing, such as the fonts and layers additional layer names, but don’t worry about that now. Number 3 Warning: If you want to place additional comments and comment boxes within the drawing, boxed out over a gridded area you need to be aware of the Z-factor. The Z-factor is the elevation of each component of the drawing. True, the drawing is a 2-D drawing, but think of it as a building with several floors. The floors are made out of transparent glass. If a line is drawn on the glass you can’t see the lines below. This is desirable because we want to block out the grid, not have the grid overwrite our text 63 WinSERVE TM User’s Manual Copyright © 2012 by Performance Drilling Technology boxes, numbers and lines. When WinSERVE creates the lisp file it makes the GRID at elevation 0 (z=0), and nearly everything else at elevation 1 (z=1). Thus, if you want to type a commentary about the well in MTEXT, make sure that you modify the elevation to 1. Now, if you want to place a box around the commentary, type in BOX at the command line, size it up with the mouse and then press ‘1' for elevation. You will have to do this for any logos that you have been using as well. In fact, it is desirable to reblock the logos so that they are automatically set at an elevation of 1 when you insert them into the drawing. Number 4 Warning: Fall in love with your SAVE command in AutoCAD. AutoCAD chokes real easy the less memory it has. Even when it has gobs of memory, it still chokes, so unless you like to lose your work, SAVE! 64 WinSERVE TM User’s Manual Copyright © 2012 by Performance Drilling Technology IV. Projection Methods WinSERVE incorporates many different types of projection methods that are used both to create well plan proposals and to make projections while drilling the well. In this section a general description of each method is provided. The focus of the discussion is in terms of how these tools are used to make projections from the workcurve to assist the directional driller as drilling progresses. To avoid repetition, the more complex methods are discussed in detail and by illustrative examples as part of Well Planning. Although the field user may not access the Well Plan module, it will be shown how most proposals may be generated using the projection methods at your disposal. The simplest projection is that to the bit, which is discussed as part of the WinSERVE Main Screen. By selecting BHL and inputting the Bit to Sensor distance, the bottom hole location is automatically projected as each survey is added using the trend of the last two surveys. All other projections selected from the Main Screen (i.e., ‘Curve 21’ from the menu or ‘Graphic Mode’ from the ‘binoculars’ button) are made either from the last survey or the bit, depending on whether Sensor or BHL is selected. The only exception is when Curve 21 is the currently selected Curve #, in which case the projection will be made from the end of Curve 21. 1. Curve 21 Projections The user accesses these projection methods by choosing Curve 21 Projections from the Main Screen menu bar. They are so named because WinSERVE reserves Curve 21 to store the results. As noted above, if Curve 21 is the current Curve #, a series of projections may be made sequentially. Otherwise, the contents of Curve 21 are overwritten with each subsequent projection. If you want to save any Curve 21 projection, select Edit Curve Editor from the Main Screen menu and copy Curve 21 to an empty curve. The following pull down menu lists the methods available under Curve 21 65 WinSERVE TM User’s Manual Copyright © 2012 by Performance Drilling Technology Projections: Choosing any option except the last two moves you to the Proposal Projection Form. Don’t be confused by the word “proposal” appearing when your intention is to make a projection from the workcurve. The reason is simple – these are the same tools shared by the Well Plan module to do projections while creating a proposal! Example of Proposal Projection Form for OUIJA BOARD CALCULATOR Certain elements of the Projection screen are common to all methods. At the upper left is a drop down menu duplicating your options from the Main Screen so that you can try different projections while remaining on the same screen. On the left hand side of the screen is the current Tie In point, and at the right hand side is the Projection point, initially blank when the Form first appears. Just below the Projection point is an input box to specify the Curve Repeat (number of feet or meters between stations) that will be used in the calculation. At the bottom of the screen is the Comment box in which you may enter a comment for each projection point. After a projection is made, pressing the ADD+ button will save it in Curve 21, and move the projected point into the Tie In frame. Above the Projection point are two radio buttons to indicate whether the projection is being made from the Workcurve or Curve 21. If Workcurve is selected, you may experiment with different projection methods or parameters repeatedly, and each time the calculation will restart from the original 66 WinSERVE TM User’s Manual Copyright © 2012 by Performance Drilling Technology workcurve endpoint. If Curve 21 is selected, successive projections will be made from the endpoint of the previous projection. The effect is the same as if you had selected Curve #21 on the Main Screen. Press PLOT to graphically view the projection (be sure Curve 21 is checked under CURVES. It is also a good idea to have different colors for the workcurve and Curve 21 so that the projection may be clearly seen). Press DONE to return to the Main Screen. Notice that the Survey List of the workcurve has not changed. If you wish to view the projection stations, select Curve #21. Projection points for which comments were entered are highlighted. A survey report or plot including the projection may be printed if so desired. In the middle of the screen is the Parameters input area in which different sets of variables are presented depending on the projection method chosen. Additional popup windows may appear to present you with further options. As you input the required parameters, <TAB> to advance and view the projected point. Each method is described below: Straight Line to MD Extend the curve at the current inclination and azimuth to a point defined by either the TOTAL MD or by the ADDED MD. The variable not entered is automatically calculated. Straight Line to TVD Extend the curve at the current inclination and azimuth to a point defined by either the TOTAL TVD or by the ADDED TVD. The variable not entered is automatically calculated. If you want to project straight to a target, you may select it directly from the Target TVD list at the bottom of the Parameters frame, and the corresponding TVD information will be displayed in the text box. Build and Walk MD, Target If the To Measured Depth button is selected, enter the desired MD, Walk Rate and Build Rate and the program will calculate a projection point. The Point to Target # button is a special option that will turn to and point in the direction of a target selected from the Target TVD list, while maintaining angle. Since this is a pure turn option, only the Walk Rate parameter input box is displayed. This option can be useful in situations where the 3D solution gives you an ‘upsy-doosey’ that you would like to avoid. (An ‘upsy-doosey’ is a mathematical solution which generates an impractical curve that builds, drops, and then builds again). 67 WinSERVE TM User’s Manual Copyright © 2012 by Performance Drilling Technology INC and AZM at TVD (or Plane) This method provides a number of different Solve Options, or ways to approach the problem: To Inclination and Azimuth can be used to turn and point towards a target at a given inclination. Specify the TVD, Final Inclination, and Final Azimuth of the desired endpoint. Point to Target # finds the solution such that the projection point is oriented in the direction of the entered target. Lock on Plane allows the user to project to a point on a plane with a constant DLS. Select this button and a text box will prompt you to input the Curve # which defines the plane, which would be your previously created formation line. By allowing you to project to 3-D space rather than the target line, this unique tool can provide a clear indication of realistic consequences given the constraints imposed by real world drilling conditions. MAKE IT SO!! tweaks the concept of landing on a plane at a given inclination to provide an iterative solution in which you also end up pointed toward a given target. Select the target and MAKE IT SO! then enter the Curve # of the formation line and the desired inclination. As you <TAB> off the inclination, the program will converge on the point on the plane that meets the inclination and orientation criteria. With the more advanced graphical solutions now available in WinSERVE, this method has become more or less superfluous. Ouija Board Calculator Before computers, there was the Ouija Board slide rule calculator. It is still one of the simplest, most powerful, and most practical tools available. This is what WinSERVE refers to as an Open Target calculator, because rather than specifying a definitive endpoint, the user provides a limited set of parameters, and then sees where he ends up as a result. The Ouija Board asks a driller to determine his priority – depth, angle or direction? Common to all solutions is a fixed DLS. The user may then examine the problem from different perspectives, and get an immediate feel for how he needs to proceed to accomplish his objective, namely, where to set his toolface. DLS Projection to TARGET This is the same calculation routine used for the 3D-Slant Well Profile. There are several 68 WinSERVE TM User’s Manual Copyright © 2012 by Performance Drilling Technology solve options under this projection method. Select which target to project to from the Target List, or enter the Target # directly. From Solve Option at the bottom center of the screen, select whether you want to set the DLS and solve for a Final Inclination, or specify the desired inclination and calculate the required DLS. At the bottom left the user selects the Profile Option, most typically Build and Hold. The slant well routine builds the curve at a constant dogleg until it is pointed towards the selected target, and then projects a straight line to the target. If the input DLS is too low, the program uses the minimum DLS, and there is no tangent section. Conversely, if the input inclination is too high, a solution with the maximum possible inclination is presented. The Hold and Build Profile Option reverses the solution approach, extending the curve in a straight line before building and turning to reach the target. This essentially combines two separate projections and eliminates the guesswork for the user to decide how far to extend the straightline projection. Another feature available with this method is the Connect Targets option, found at the lower right of the screen. Select the first target you want to hit from the Target List and drag down until the last target to hit is highlighted. Enter the DLS to use and press the CONNECT TARGETS button. The routine basically strings a series of slant well projections from target to target. Vector Project to Target This is a powerful and mathematically complicated projection tool most useful for planning a well. Because it is an iterative process performing many calculations, finding a solution can be time consuming, and in some cases may not yield a result; therefore it is not generally of interest to the directional driller to make quick projections as drilling proceeds. A thorough discussion of this topic is found in Well Planning. 3D to Formation Line This tool projects the intersection of a minimum DLS curve with a formation line at a specified inclination. As with the DLS to Target method, if there is enough space between the Tie In and the curve, you have the option where to place the straight line projection; in this case, the choice is presented as a Yes/No response to the question – Hold then Build? Selecting NO enables the Directional Alignment option. To use this method it is necessary that you have first created a formation line (See Formation Line Maker). Enter the curve number of the line in the TARG CURVE text box and specify the inclination at which you want to hit the line. As you <TAB> off the inclination, the projection is calculated and displayed to the right. 69 WinSERVE TM User’s Manual Copyright © 2012 by Performance Drilling Technology Vectored Curve This is a graphical projection method most commonly used as a well planning tool; as such it is discussed in detail in Well Planning. Special Projection Setups Choosing Special Projection Setups displays the Special Projection Parameters screen. This screen provides the user with three special functions. In the upper area you may set up for an automatic slant well projection to the currently selected target. Check the box ‘DLS to use for CURVE 29’ and enter a DLS value in the text box. After each survey calculation the projection will be made automatically and stored in Curve 29. If the input DLS is too low, a minimum curvature will be calculated. The second function is to specify a Curve # (e.g., your formation line) with which to compare your workcurve if you choose to print the Up/Down or Left/Right fields in the survey report. This is useful when drilling the extension of a horizontal well. (The comparison curve could just as well be your proposal). Thirdly, you may have WinSERVE automatically calculate the Build Rate Needed to hit the formation defined by the Curve # at a given inclination, include that information in the survey report, and store the projection in Curve 23. This is the same feature found in Tools Dip-DLS Calculator, but with the convenience of having it done automatically. 70 WinSERVE TM User’s Manual Copyright © 2012 by Performance Drilling Technology 2. Graphic Projections (Binoculars) The Graphical Projection mode allows the user to do complex projections by simply pointing and clicking with the mouse. Shown above is an example of the screen accessed by pressing the PROJECT button (Binoculars icon) on the Main Screen. Projections are made from the workcurve as identified by the Work #, as the user is reminded by the banner at the top of the screen, either from the SENSOR or BHL Location as selected on the Main Screen. The screen is dominated by the graphical display area. This display is target-centric, with the axes centered at the currently selected target, indicated at the lower left corner. If this is not the target that you want to project to, press EDIT TARGET to make your selection from the Target Maker screen. The size of the viewing area around the target is controlled by the vertical scroll bar to the left of the display area. Adjust the zoom factor by positioning the slider. This automatically determines the scale of the axes, shown in the SPACING box. Remember that these are coordinates referenced from the 71 WinSERVE TM User’s Manual Copyright © 2012 by Performance Drilling Technology target. If you zoom out enough you will see the endpoint of the workcurve indicated by a red cross-hairs symbol. The large numeric text boxes at the lower left indicate the geographic coordinates of the mouse cursor referenced from the wellhead, duplicating the same information from the complete survey calculation data displayed along the left edge of the screen. As you move the mouse around in the display area these values are continually updated, with the TVD held constant at the TVD of the selected target. At the top left of the screen under MODE is a drop down menu of the available projection methods. The ‘BUTTONS’ options listed refer to the Projection Point buttons located at the lower right corner, and are redundant to the Mouse options (you will notice that the mode switches to ‘Mouse’ as soon as the mouse is moved from the drop down box). In the descriptions below, target point refers to the end point of the projection, which is set by positioning the mouse anywhere in the display area and right-clicking. The first time, the selected projection will be made to the center of the selected target; you may subsequently position the target point wherever you choose, and the curve will be drawn per the parameters of the selected mode. Click on the Projection Point buttons to project to the Center, Left, Right, Top Center or Bottom Center of the selected target. A small red circle will be displayed on the target perimeter. Modes Protractor Straight-line to the target point. This is a classical projection tool familiar to directional drillers using a string and protractor on a wall plot. Your DLS 3-D Slant well to the target point. Specify the desired dogleg in the text box near the bottom of the screen. If the input DLS is too low, a minimum DLS projection will be made. If a projection at the specified DLS cannot reach the target point, ‘*****’ are displayed in the survey data boxes. Zeros will typically be displayed for the Buidrate and Walkrate since a slant projection terminates as a straight line. 72 WinSERVE TM User’s Manual Copyright © 2012 by Performance Drilling Technology Build & Walk-Controls Specify the desired Build and Walk Rates in the text boxes near the bottom of the screen. Minimum DLS 3-D calculation of the minimum DLS to generate a curve of constant curvature to the target point. Similar to Your DLS except that it will never include a straight tangent section. S-Well Vector Projector (Double Curve Profiler) As a Profiler, this tool is limited to use in the Well Plan module Vectored CurveAdvanced Although this sophisticated method may be used to make projections, it is generally utilized as a well planning tool and as such it is discussed in detail in Well Planning. The SHOW CURVES area of the screen is reproduced to the left. By checking the boxes the user is able to display more than one projection at the same time. Note the Curve #’s in parentheses which indicate where the curves are stored. In fact, any curve checked under the PLOT CURVES screen may be displayed. The projected survey stations may be viewed by selecting the Curve # on the Main Screen. The curve titles indicate the selected color of the curve. Any specific projection curve may be saved and protected from being overwritten while you experiment with other projections by pressing Copy Mode Curve to 23. However, if you have setup an automatic horizontal projection under Special Projection Parameters, Curve 23 will be overwritten the next time a survey is calculated. Aside from enabling their display on this screen, checking the boxes also determines which projections WinSERVE will make automatically each time a new survey is entered, a very convenient time-saving feature. Be sure to set up your DLS, Build and 73 WinSERVE TM User’s Manual Copyright © 2012 by Performance Drilling Technology Walk rates the way you want before exiting the screen (the DLS may also be entered under the Special Projection Parameters screen). Check SHOW VERTICAL to display a vertical view (also centered at the selected target). The Vertical Section Plane will be that of the workcurve. The zoom magnification may be adjusted with the slide bar. (If the slide bar is hidden, the Vertical View window may be moved by clicking within the title bar at the top and dragging it.) At the bottom of the window, the Vertical Section, TVD, EW and NS coordinates are displayed and continually updated to indicate the position of the mouse cursor. In this view it may be desirable to display formation lines; to do so, the curves must be checked under the PLOT CURVES screen. You may also reposition the target point in this view by right-clicking with the cursor where you want it; the designated point will be stored as Target #20, and automatically becomes the selected target. This can be a very helpful time-saving feature, particularly with horizontal wells, enabling you to create a new target quickly without leaving the projection screen. 3. Formation Line Maker The Formation Line Maker is accessed from the Main Screen by choosing Edit Make Formation Lines to display the screen shown below: 74 WinSERVE TM User’s Manual Copyright © 2012 by Performance Drilling Technology Formation lines are a great asset in designing well plans and for making projections while drilling, utilizing the unique WinSERVE concept of treating the line, or a plane defined by that line, as a target. The formation lines which are created are saved as curves, and it is recommended as a good organizational practice that the user maintain consistency from well to well by designating the same Curve # for these lines. Throughout this documentation Curves 6 and 7 are typically reserved for this purpose. There are three Line Calculation Methods to choose from, of which Method 1 is most commonly used. The critical data the user needs to know are the Dip Angle, Dip Direction, and Zero VS TVD. The Dip Direction is defined as the maximum down dip of the formation, and Dip Angle is positive in that direction. Zero VS TVD represents the intersection of the formation line under the wellhead, i.e., the true vertical depth at zero vertical section. This information would be available from the geologist. It may be the case that the formation TVD is only given at the target; knowing the dip, you could use the Dip-DLS Calculator to find the Zero VS TVD to create your line. The Length of Line extends the line out to a vertical section as input in the text box; enter a number larger than the VS of the target of interest to ensure that the line appears on the plot in the relevant area. Set the Thickness equal to zero unless you want two lines depicting the top and bottom of the formation to be displayed. 75 WinSERVE TM User’s Manual Copyright © 2012 by Performance Drilling Technology One consideration to keep in mind is to make sure that the dip and dip direction obtained from the geologist represent the maximum dip and are defined as above. There may be cases in which the Target direction is NOT the same as the direction of maximum dip. The following equation will provide the formation dip in the direction of the Target: Target Direction Dip = COS (Maximum Dip Angle Direction - Target Direction) * Maximum Dip To help you visualize the situation, imagine holding a sheet of lined writing paper in front of you at an angle toward the floor. An ant walking straight down the page away from you experiences the full incline, or maximum dip. Now consider the perspective of an ant walking left to right along one of the ruled lines. All such lines are horizontal, and perpendicular to the direction of maximum dip, so that ant walks along a perfectly level line and doesn’t notice any dip at all! A diagonal line drawn across the page representing the target direction is inclined at an angle between zero and the maximum defined by the equation shown. This number would be the dip angle to use to create your formation line. Method 2 creates a line between two specified targets and is especially useful for cases in which the desired line does not come below the wellhead. With this method Length of Line refers to the extension of the line before the first target. It may be necessary to create “fake” targets for the purpose of generating the line, for example if the line represents a hard line or lease line. Method 3 allows you to model an irregular formation top by breaking it into segments between points specified by TVD and vertical section, up to a maximum of 20 points. As the data are entered, the program calculates coordinates for the point based on the Vertical Plane input and the Dip Angle as the angle between successive points. These points may be stored as targets by selecting the appropriate radio button. However, remember that WinSERVE permits you to define a maximum of 18 targets, so it may be necessary to edit the Target List to reflect other objectives. 76 WinSERVE TM User’s Manual Copyright © 2012 by Performance Drilling Technology V. Well Planning [NOTE: The Well Planning module is available only in the WinSERVE Office Version offered by PDT.] The module is opened by pressing the WELLPLAN button on the Main Screen. In the Field Version the button is dimmed and access is disallowed. WinSERVE Well Planning Philosophy The guiding philosophy of WinSERVE Well Planning is to provide a set of tools with the flexibility to enable a well planner to easily generate virtually any type of proposal, and to approach the problem in a variety of ways depending on the circumstances and information at hand. The metaphor is that of a toolbox. While different tools may each be used to accomplish a particular task, some are more appropriate or efficient than others for specific situations. If you need to loosen a nut for instance, an adjustable wrench can do the trick, but perhaps a box wrench or socket would be the better choice. A state-of-the-art directional well planning tool such as WinSERVE does not merely rely on a set of basic templates to solve the simple problems of 2D well planning. Rather, it presents the user with a set of 2D and 3D curve building subroutine options that the user must learn and become familiar with to utilize in the most productive manner. WinSERVE empowers the user to successfully design virtually any style of well plan, including complex proposals incorporating vectored (or aligned) targets, by means of sequential combinations of these various methods. A discussion of the basic WinSERVE well planning methodology is given below, followed by descriptions of the layouts of the various screens and well planning options (the contents of your toolbox!). In addition, in the appendix you will find Lesson Plans providing detailed examples that guide the user in planning all types of wells, from simple slant well profiles to the advanced ‘turn-a-zontal’ type of well proposals. There are further examples of special drilling scenarios, such as how to plan a well to avoid an obstacle such as a salt dome or lease line. 77 WinSERVE TM User’s Manual Copyright © 2012 by Performance Drilling Technology 1. General Preparation for a Well Plan In preparation to begin designing a well plan with WinSERVE, there are several pieces of information that should be established at the outset. The first thing the well planner needs to consider is fundamental – Where do we want to go? What are the targets that we want to hit? WinSERVE has a powerful target editor and it can be advantageous to enter the targets in sequential order of depth, although this is not mandatory. Has a rig location been firmly established? What is the Vertical Section Plane of reference going to be? What is the length of the repeat section in the build or tangent sections, i.e., do you want a survey listed every 30 feet or every 100 feet? Are there any constraints with regard to a kick-off point or dogleg severity or lease lines? Although many of these points need to be resolved before creating your proposal, WinSERVE does provide the flexibility to easily modify your choices as conditions dictate. Targets An important concept for the newcomer to WinSERVE to understand which may differ from previous experience with other well planning packages is the consideration of what constitutes a “target”. The traditional definition of a target as a geological payzone is one with which most people will be familiar. WinSERVE maintains that standard treatment, but broadens the concept to include lines and planes as target objects, which dramatically impacts the power of the well planning tools at your disposal. There are four types of targets defined in WinSERVE: Shape Targets Targets may be assigned a shape of a point, circle, rectangle, square, ellipse or polygon. Each shape is defined first by the center point of the target, which is the target location coordinates, and is then drawn around that point according to the appropriate variable, such as diameter, length or width. Offset coordinates may be input to shift the Shape location with respect to the VSP. Refer to . Line Targets A line can be created and become a target, a definition of a plane or a formation bed boundary. WinSERVE is unique in that it allows the user to use lines as targets. Refer to Formation Line Maker to see how to create a line. 78 WinSERVE TM User’s Manual Copyright © 2012 by Performance Drilling Technology Plane Targets Planes are defined by the maximum down dip angle and the down dip direction. A well plan can be done in which the plane is treated as a target, with the objective being to intersect the plane at a given inclination and direction. Open Targets Open targets are defined by the parameters that are used to reach that particular point. For example, a sidetrack might be begun with the general instruction ‘Build 50 feet with a Dog Leg Severity of 3°/100ft with a tool face of 140°’. The resultant target point will be wherever that course of action happens to end up. The Ouija Board Calculator projection option is an example of an Open Target calculator. All target types listed above will be described by example in the discussions of specific well planning methods, as well as in the Appendix: Lesson Plans. a. A Note About Profiles and Projections Before moving on to the extensive discussion of the Well Plan module and its components, it is worthwhile to comment on the difference between Profiles and Projections. By definition, a Profile creates a well plan from a kick off point, providing a fixed template for planning the most common types of wells (slant wells and S-wells). In many cases, the simple Profile is sufficient to get you exactly where you want to go, but more often than not, it only gets you part of the way there, or doesn’t provide the flexibility needed to define the entire well path. Thus, most experienced well planners will plan the majority of their wells using Projections. Projections are tools that continue or extend a well path from the last point of the curve. By using a series of projections to build the curve step by step, even the most complex well plan may be realized. The WinSERVE “toolbox” provides many different types of Projection methods, capable of solving both 2-D and 3-D scenarios, utilizing both numerical input and graphically oriented techniques. The key to successful well planning is to learn how each projection method works, and to know which will be most effective in any given situation. As the user gains familiarity with the various tools at your disposal, you will notice similarities and apparent redundancies between methods. This is intentional – there are many possible paths to reach the same destination. However, it should be understood that with the increasingly complex methodologies whose underlying techniques may be transparent to the user, there will be cases in which there is no convergence to a solution. Don’t despair or become frustrated, just try a different approach to achieve your objective. 79 WinSERVE TM User’s Manual Copyright © 2012 by Performance Drilling Technology The Projection options of the Well Plan module nearly duplicate those that are accessed directly from the Main Screen. The important point to remember is that while Curve21 and Binocular (Graphic) projections selected on the Main Screen are made from the Workcurve as specified in the Work # box. (unless curve 21 is the selected Curve #), well plan projections are made from the proposal curve. If the currently selected Curve # does not match the curve specified in the Plan # box, the window shown below will pop-up to prompt you to verify which curve to use. 80 WinSERVE TM User’s Manual Copyright © 2012 by Performance Drilling Technology b. Well Proposal Planning Screen The Well Proposal Planning Screen shown above is organized into five functional areas: Text boxes for user input of VS Plane, Hold Repeat and Curve Repeat Profile Types and Projections Solve – Parameter input area Commands and Info WinSERVE Proposal Curve survey list Before beginning to design a well plan, the user should input the desired values for Hold Repeat and Curve Repeat to determine the spacing of survey stations in tangent and curved sections. Standard practice is 100 feet (30 m) and 30 feet (10 m). The Vertical Section Plane is duplicated from the Main Screen Curve Info, but may be changed if desired. 81 WinSERVE TM User’s Manual Copyright © 2012 by Performance Drilling Technology At the upper left hand corner are listed the PROFILE TYPES and PROJECTION methods which are available, the “toolbox” from which the well planner chooses the tools to design and build the well proposal. Profiles are templates of the most common well plan designs, which by definition originate from a kick-off point and terminate at the selected target. There are three profile types to choose from: Slant well, S-well and Horizontal, all of which may be realized in 2-D or 3-D. The Horizontal profile may be considered as a special case of an S-well, but with two build sections rather than a build and drop. Clicking the TIE-IN button pops up the TYPE KOP SELECTOR frame that offers three choices: 2-D KOP, 3-D Tie in Point and 3-D Curve Tie in. By selecting the 2-D Tie In the proposal will always kick off at zero vertical section. However, a deep kickoff point may have drifted several hundred feet (or meters) from the surface location, in which case a 2-D Tie In may not yield the most advantageous proposal to drill the well. Selecting the 3-D Tie In Point calls up the Tie In dialog box for the user to enter a more accurate Tie In survey from which to begin the proposal. The 3-D Curve Tie In is a sophisticated feature of great help when planning a slant well sidetrack. The Curve # containing the surveys of the well to be sidetracked is entered in the text box, and the user enters the desired DLS and Hold Angle for the sidetrack. WinSERVE will interpolate along the given curve searching for the first point from which such a slant well could be drilled. Allowing the program to determine the sidetrack point saves you the time that would be spent finding a solution by trial and error. Press OK to confirm the type of KOP to use. The list of available Projection techniques can be seen by clicking on the drop down button. These may be used to extend the well profile by sequential stages, and are generally the same as described in 82 WinSERVE TM User’s Manual Copyright © 2012 by Performance Drilling Technology Projection Methods. The use of these methods is illustrated by means of examples later in this section. In addition, there are two tools found in this menu that are not projections, but can be useful on occasion for well plans with a 2-D Tie In: Depth Shift Proposal – shifts the KOP of the proposal to the specified TVD, recalculating the surveys and shifting the entire curve by an offset equal to the difference between KOP’s. This is useful for making RKB elevation corrections, and may also be used to move a Formation Dip Line up or down after temporarily assigning the curve as the current Plan #. It is also used when solving the problem of determining an unspecified surface location (see the Examples). Rotate Proposal – rotates the entire proposal to the specified direction. The direction is referenced from the end of the proposal, i.e., the rotation is accomplished ‘from the bottom up’. It can be a useful tool in a situation in which you are trying to shoot a curve through a series of targets that are not aligned; you can experiment by rotating the curve slightly to see what might be the best solution. This tool should only be used with proposals that have a zero or near zero inclination at the kick off. It may also be used to rotate Dip Lines as described above for the Depth Shift. The Graphic Proposal Mode is a graphically oriented method of generating well plans that supports slant well, build and walk, minimum curvature and S-well projections, and also includes a very powerful tool called the Double Curve Profiler. This mode is particularly useful in instances in which it is necessary to thread through several targets without being required to hit the center of those targets. These tools may also be used to steer around an obstacle while pointing toward a target utilizing a technique known as dynamic vectoring. One advantage of these graphical solutions compared to the standard S-well profile is that in addition to specifying the entry angle of inclination at the target, the user can also control the direction of approach to a target. Detailed examples illustrating these methods can be found at the end of this section. Two buttons that duplicate features found on the Main Screen are presented here as a time saving convenience. The Dip Calculator allows the well planner to test various scenarios and get a quick visualization of slant projections with the information at hand. It may also be used to determine the RKB_TVD for the purpose of creating a formation line. Refer to Tools Dip-DLS Calculator for a complete description of this tool. The Interpolate function enables you to insert points into the proposal, interpolated by either MD or TVD. It is useful for entering the TVD’s of formation tops (which may then be used to create 83 WinSERVE TM User’s Manual Copyright © 2012 by Performance Drilling Technology formation lines), or for selecting a point from which to begin a sidetrack. Refer to Tools Interpolate for further information. Three other buttons grouped in this area allow the user to manipulate the proposal. Press Cut 0ff to delete all surveys below a selected row. There may be instances when a particular projection doesn’t yield the desired result in its entirety, but you want to utilize part of it and make another projection from a point within the survey list; this tool may be used for that purpose. Del Last allows you to delete the last projection that was made; repeated clicking will continue to delete any other projections in reverse order. An important point to remember is that the action of this button as just described is only within the individual well plan session; if you exit Well Plan, and then return, the program no longer distinguishes each projection and pressing Del Last will delete the entire well plan! And since the program has no recollection of how the curve was built, Redo Last cannot regenerate it. As with Del Last, the action of Redo Last is confined to the current work session; however, it differs from the delete function in that its meaning is literal – it can only redo the last projection. In other words, if you press Del Last more than once, you cannot retrieve the entire sequence of projections, only the last one deleted. The Commands and Info area to the right of the screen contains a box that indicates the number of the PROPOSAL CURVE you are working on. You may change the number to select a different curve. The Calculate button is used only with Profile Types to generate the curve once the Solve parameters have been entered. Since profiles always begin at a KOP, calculating a profile when the curve already contains data will erase all surveys currently on the screen; thus, as a precaution a warning will be displayed if the user is about to overwrite the current curve. Press Plot to view the proposal on the plot screen. The curve is automatically selected by the program to be plotted. Press Targets to go to the Target Maker to view or edit the Target List. Press Save to save your work. As usual, it cannot be emphasized enough to SAVE whenever you’ve done a fair amount of work that you don’t want to risk losing. At the bottom of the screen is the WinSERVE Proposal Curve survey list where the survey calculations are displayed in spreadsheet form identical to that on the Main Screen. One additional convenience feature is located at the far right of the table: click on the arrows to move instantly to the top or bottom of the list; click in the area between the arrows to toggle the screen view between normal and a full screen survey listing. Just above the toggle control is the Show Critical Points button, which when pressed condenses the survey list to display only the critical survey points of the proposal. This is very helpful to quickly review your well plan. The button changes to Show Surveys 84 WinSERVE TM User’s Manual Copyright © 2012 by Performance Drilling Technology to return to the complete list and the Apply button pops up. Press Apply if you want to highlight the critical points in the list and to automatically attach comments identifying those points. At the top center of the screen is the Solve area in which text boxes for the parameters pertaining to each Profile type are displayed. These may include KOP, DLS1, DLS2, Start Angle, Entry Angle, Hold Angle, Tangent and Post Hold. In the center next to each variable is a radio button; the user checks the button to choose which is the unknown variable to solve for, and enters values in the text boxes for those that are known, or fixed. The text boxes of the variables that the program will solve for change to red as a reminder to the user that these are not to be input but will be calculated. At the bottom is the Target No. selector box indicating the target that is to be used to calculate the profile, or make those projections that project to the target. To change the Target No., click on the thumbnail control, type the number directly, or go to the Target Maker to select the desired target. Press DONE to exit the Well Plan module and return to the WinSERVE Main Screen. 85 WinSERVE TM User’s Manual Copyright © 2012 by Performance Drilling Technology 2. Projections The simple well profile examples that were just described are sufficient for the vast majority of well plans, however, it is often the case that, for example, a straight line projection needs to be made to a given point. Or to accomplish a side track from a given point in space it is often necessary to describe a toolface and DLS for so many feet and then shoot for the target with other projection methods. When such a situation arises one needs to use the projections. Clicking the PROJECTIONS drop down button shows the list of available projection techniques seen at the left. Many of these are the same methods discussed previously in 86 WinSERVE TM User’s Manual Copyright © 2012 by Performance Drilling Technology Projection Methods. The difference is that in that case the projections were made from the endpoint of the workcurve, whereas now they will extend a proposal curve to design the wellpath. Projection Screen Setup Select a projection method from the drop down list and the Projection Proposal Form is displayed (with the exception of the Modified S Well, which utilizes the main screen, and the graphical methods). On the left hand side of the screen is the current tie in point, and the right hand side of the screen is the projection point, initially blank. In the middle of the screen are the parameters that may be adjusted to solve for that particular projection. As you <TAB> off the last parameter the projection is displayed on the right. When you are content with the projection point press the <ADD> button to append it to the proposal. A comment describing each projection point may be entered in the comment box at the bottom of the screen. Straight line to MD Enter the TOTAL MD to project to and have the delta MD calculated, or enter an additional measured depth in the ADDED MD box and have the TOTAL MD calculated. Straight line to TVD This works just like the measured depth, except that you are working with TVD instead MD. At the bottom of the Parameters Frame is a Pick List displaying the TVD's of all assigned targets by number. Select a target and the TVD will be displayed in the TOTAL TVD text box. Build and Walk to MD Select TO MEASURED DEPTH under SOLVE Options and enter the desired MD, Walk Rate and Build Rate. Select the POINT to TARGET # option to accomplish a pure turn projection to a selected target TVD. Inclination and Azimuth @ TVD • To Inclination and Azimuth can be used to turn and point towards a target at a given inclination. Specify the TVD, Final Inclination, and Final Azimuth of the desired endpoint. • Point to Target # finds the solution such that the projection point is oriented in the direction of the entered target. • Lock on Plane allows the user to project to a point on a plane with a constant DLS. Select this button and a text box will prompt you to input the Curve # 87 WinSERVE TM User’s Manual Copyright © 2012 by Performance Drilling Technology which defines the plane, which would be your previously created formation line. By allowing you to project to 3-D space rather than the target line, this unique tool can provide a clear indication of realistic consequences given the constraints imposed by real world drilling conditions. • MAKE IT SO!! tweaks the concept of landing on a plane at a given inclination to provide an iterative solution in which you also end up pointed toward a given target. Select the target and MAKE IT SO! then enter the Curve # of the formation line and the desired inclination. As you <TAB> off the inclination, the program will converge on the point on the plane that meets the inclination and orientation criteria. With the more advanced graphical solutions now available in WinSERVE, this method has become more or less superfluous. Ouija Board Calculator Select a Solve Option and enter the parameters as required. This method is referred to as an ‘open target’ projection since rather than specifying the target, you establish DLS and toolface orientation criteria and see where it takes you. DLS Projection to TARGET Choose to specify the final inclination or desired DLS to a selected target. You may also choose whether to have the curve section at the beginning or end of the projection. Modified S-Well to TARGET This is the same routine that is used for the 3-D S-well profile and thus is set up on the same screen. The only difference is that with the projection you will always be projecting from the last point in the curve, whereas with the profiler it starts from the tie in point (KOP). Select the target number you wish to project to using the arrow buttons and select the parameter to solve for by clicking the radio button. You may specify the entry angle at the target and incorporate a ‘post hold’ section so that the approach to the target will be in a straight hole section. This very powerful routine may be used to calculate tangent sections from a tie in to a fixed point. If solving for other than the Hold angle, the solution may take considerable time to calculate. Be patient. Vector project to TARGET Mathematically speaking vector projection is the most complicated projection method. The reason being that there are five target variables being solved for; the three rectangular coordinates and inclination and azimuth. The method employed here for a solution gives a constant dogleg solution, however the toolface of the dogleg normally changes from station to station. The method the solver uses is an iterative method. The solver starts by shooting the target from the tie in point and then shooting the tie in point from the target with a 3-D slant well routine. The inclination and azimuth is 88 WinSERVE TM User’s Manual Copyright © 2012 by Performance Drilling Technology compared and if they are within a millionth of a degree then the routine is considered solved. If not within the millionth of a degree the tie in point and the target point are both changed so that they are the next station in the two respective curves. At each station the minimum dog leg is calculated and if that dogleg exceeds the current dog leg then the entire process is started over from the initial target and tie in points, with a dog leg of 0.1 more than last time. This process is repeated until the routine bails out either by coming within the above tolerance or by exceeding a bail-out dogleg value. Finding a solution with this method can be time consuming, or it can be almost instantaneous. The amount of time required depends upon several factors: obviously, the speed of your computer, but more importantly, which initial parameters are used. Setting up to do a Vector Projection Step 1 First choose the target you want to shoot at from the Target Selector box. located in the parameters section at the center of the project screen When you choose the target you will see the Target Inc and Target Azm text boxes to the lower left reflect the values for that target. These values are the values that you either input or were calculated for you when you input your targets. If they are what you want to have at the target leave them alone, but if you want to adjust them you can do that here. Step 2 Now type in the desired values for the upper dog leg and the lower Dog leg under DLS1 and DLS2. These are the initial values that the program will attempt to use. If there is not a solution with this method then the one or both of the DLS's will be iterated depending upon the solve option you have selected in Step 3. Step 3 There a four solve options. Really, there are five, the fifth being that the desired dog legs that you want to have render an immediate solution. The other options are variations on how the solver iterates the DLS's when searching for a solution. The four options are: • LOCK DLS1 - This keeps the value of DLS1 at the value you input and iterates DLS2. • LOCK DLS2 - This keeps the value of DLS2 at the value you input and iterates DLS1. • MAKE = - This iterates DLS1 and DLS2 at the same time and makes them equal at all times. 89 WinSERVE TM User’s Manual Copyright © 2012 by Performance Drilling Technology NO LOCKS- Let's the solver iterate the DLS that failed the last test and keep the other one the same. • Step 4 Check your bail out value. The bail out value defaults to 40. If you anticipate higher dog legs than 40 then change the bailout value. Coiled tubing directional drilling, for example, works with dog legs well in excess of 100. Step 5 Press CALCULATE. Sometimes the program takes so long to calculate it has the appearance of hanging up, but it is just calculating millions of equations. To speed up the solution, set the Curve Repeat value larger. Sometimes the curve that the Vector projector gives you has got a hump in it that doesn't look like it really belongs there. The vector projector does not give an absolutely optimum solution all of the time. It is a powerful tool, but it isn't always the perfect tool. 3-D Vectored Curve to TARGET Description of Projection The Vectored Curve projection consists of two curves connected to one another without a tangent section. The dogleg of each curve can normally be adjusted so that they are equal by adjusting the KOP or the TVD of the target for the first curve. The advantage of this type of curve is that it can hit a given point at a given inclination and azimuth. Where Used This type of curve is used in winged lateral wells where landing points are restricted. It can also be used as one of the projection tools in building complex proposals. Input Parameters Primary Target Point, desired Inclination at target and desired Azimuth at target, Secondary Target point (1st TVD) and KOP. In all, there are 9 input parameters 90 WinSERVE TM User’s Manual Copyright © 2012 by Performance Drilling Technology Setting up to do the projection Input the Primary Target in the Target list. Even though the size and shape of the target may not be important, it is a good idea to make the target a circle with a given diameter. That way you can see the target on the projection screen. Select your proposal curve on the main screen. The last survey in the proposal curve is used as the tie in point. This projection method allows you to specify a curve from which you can kick off. For example, if you wanted to pick a sidetrack KOP from an existing well you can enter the curve number for the tie in curve in the projection screen and the program will interpolate on that curve automatically. Select 3D Vectored Curve to TARGET from the PROJECTIONS drop down list If the displayed Inclination and Azimuth at the target are not what you want, enter the inclination and azimuth. This could have been done when specifying the target. If you are going to be using a tie in curve to determine your KOP enter the tie in curve number under TIE CURVE. Adjust the size of the projection graphic by moving the vertical slider to the left 91 WinSERVE TM User’s Manual Copyright © 2012 by Performance Drilling Technology of the graphic screen. Remember, this screen is target-centric. If you have specified a tie in point you should see a cross hair displayed over that point if your zoom is properly adjusted. If everything is setup up properly when you move the curser near the tie in point. Numbers all over the screen should be changing. If you are not in a solution convergence zone “DLS2" to the lower left will say “OUT”. When you are in a solution convergence zone DLS2 will show a number. The DELTA Distance is the distance between the Primary Target and the projected landing point at the primary target’s TVD. You want this delta distance to be zero. Moving the mouse around trying to get the delta distance to be zero can be a tedious process. So, instead of wasting time trying to converge with the mouse an automatic function called LOCKXY will do it for you. Before you can use the LOCKXY function you must click on the graphic screen where DLS2 does not say ‘OUT’. When you click the graphic screen is temporarily disabled so that you can move off the screen to the LOCKXY button without changing any more values. When you press LOCKXY you will see two lines snap to the center of the graphic screen, your target. The DLS1 and DLS2 are the dog legs of the two respective curves. Invariably these number are different at this stage of the game. It is frequently the case that you want a solution that has the doglegs equal. There are two ways to do this. The two LOCKDLS buttons will look for a solution varying either the KOP or the 1st TVD (Secondary Target TVD). This can take quite a few seconds, maybe even a minute depending upon your computer. In order to solve this problem there are three levels of iterations. LOCKON XY This button will find a solution for the given KOP and 1st TVD such that the landing point of the curve is at the center of the selected target at the desired inclination. LOCK DLS with KOP This button will find a solution for the given KOP and 1st TVD such that the landing point of the curve is at the desired target and inclination and azimuth AND the two Dog legs are equal. In order to do this the KOP is adjusted until there is a solution.( IF THERE IS A SOLUTION) LOCK DLS with 1st TVD This button will find a solution for the given KOP and 1st TVD such that the landing point of the curve is at the desired target and inclination and azimuth AND the two Dog legs are equal. In order to do this the 1st TVD is adjusted until there is a solution.( IF THERE IS A SOLUTION) 92 WinSERVE TM User’s Manual Copyright © 2012 by Performance Drilling Technology Sometimes is desirable to solve for a specific Dog Leg. Let’s say you want 18.00, not 18.31 for a dog leg. If you are LOCKING with the 1st TVD button above and your dog leg comes out to be 18.31, for example, you could raise the KOP by a few feet and solve again. By manually adjusting the KOP you can converge on the desired dog leg of 18. Using ARROW KEYS to adjust KOP and 1st TVD There are times when the automatic methods just run away and do not render a solution, and there are times when you do not want to have the two dog legs equal. By entering the KOP or 1st TVD manually you can update the solution. To make this manual iteration easier and fast the arrow keys have been tied to the text boxes. It is easiest to explain by example. • • • • • • • • Place the cursor in either the KOP or 1st TVD box. Place your three middle fingers over the arrow keys on your keyboard. Press the up arrow - you should see the value in the text box increase by ten. Press the down arrow - you should see the value in the text box decrease by ten. Press the left arrow - The increment value has now been divided by ten, to 1. Now Press the up arrow again. You should see the value increase by one. Press the Right Arrow - The increment value has now been multiplied by 10. Press the Right Arrow again. - The increment value has now been set to 100. By deft usage of these keys a user can manually and quickly converge on a solution. Sometimes it is easier to find a solution manually like this than it is to get the computer to solve. ADD PROP Then you are content with the curve you have and want to make it a proposal curve press this button. It will be immediately displayed. If you don’t like the curve you see and want to generate another one you must press the REDOPROP button. The critical points of the curve are stored in curve 21. (The straight lines you see on the graphic screen) REDOPROP- Un does the proposal you just added. If you didn’t have proposal you just added it backs the tie in point to the first survey in the proposal list. AUTO- This button attempts to automatically find a constant dogleg solution varying the 1st TVD method without you clicking in the convergence zone. It usually works. Horizontal Projections 93 WinSERVE TM User’s Manual Copyright © 2012 by Performance Drilling Technology One of the trickiest types of projections to make in directional drilling is ‘needed build rate to a dipping formation’. If the formation is has a 0 degree dip then the calculation is straightforward and can be done easily on a calculator. When the TVD of the target does not stay constant, however, the problem is more difficult to solve. WinSERVE allows the user to do a projection to dip in two different methods. One method is a graphical method in which the user moves the mouse to point in the vertical section plane and can see how the Minimum DLS and the Inclination change. The other method is an option under the PROJECT button. Setting up a horizontal dip projection requires several steps. Once done, however, each time a survey is entered this projection is automatically calculated and stored in curve 23. Furthermore, the entry point can be printed in a survey report or a BHL report as an option. Setting up a Horizontal Projection: First, make sure that you have a target specified on the formation line. Normally this would be your desired entry point in the proposal. For this target enter the Inclination you want to have at the target. Second, create a Formation Dip Line. From the main screen go to EDIT and choose MAKE FORMATION LINE. You will see a screen that has: • CURVE NO. - Number of the curve where you want to store your formation line. • TARGET NO.- Number of Target that is on the Formation Line. When you input the text box shows some information about the target, including the Inclination at the Target that you either entered or told the computer to calculate for you when you were entering your targets. When Geologists refer to dip angle they are always referring to degrees from the horizontal, so the Dip angle that is shown is 90 minus the Inclination at Target. • DIP ANGLE - This will initially default to 90-Inclination at Target, but you can change it to what ever you want. • LENGTH OF LINE- Extension of line from zero vertical section to the departure desired. • NAME OF LINE- Give it a name, like TOP OF FORMATION. 94 WinSERVE TM User’s Manual Copyright © 2012 by Performance Drilling Technology • and CREATE LINE - Takes all the above information and creates a line survey file in the CURVE NO. you specified. Once a formation line is created this becomes not only a visual aid that can be viewed when desired, but also a line that can be projected to using the projection tools built into WinSERVE. To automatically project to the curve there are several more things to do. You should understand that this 'Dip Line' could just as easily be hold angle for a directional or s-well. When kicking off a slant well, building to the hold line is the same as building to a dip line. Perhaps a better name for these lines would be guide lines, since they are used to guide the inclination. Although this projection method does not solve for the direction, generally the directional driller handles that with small nudges left or right. Setting up an automatic Projection to Dip Line The procedure for setting up an automatic projection to dip is described below. • • • • • 1-Click the PROJECT button on the main Screen 2-Place and X next to the CALCULATE MIN DLS TO CURVE # 3-Place the number of the curve which represents the dip line you want to project to. 4-Enter the Inclination you want to hit the line with. 5-Select if you want the calculation to be made to the Target Direction, or to the last survey direction. Last Survey direction may in fact be a projected direction to the bit if you have the SHOW BHL selected on the main screen. Now, you can either press CALCULATE, and the projections will be generated for you in curve 23 or you can enter a Survey and upon calculating the survey this projection will be made automatically for you, and the result placed in curve 23. In all, this is very powerful tool for a horizontal driller to have when drilling to a dip, allowing him to see exactly what he needs to do to land at the proper inclination, and how far off in section he will be when getting there. Using the Graphical projection method Using the graphical projection method can be a great tool for quickly approximating what is necessary. To use the Graphical Project method do: 95 WinSERVE TM User’s Manual Copyright © 2012 by Performance Drilling Technology • • • • • • 1-Enter the PLOT and select CURVE. Make sure that the Curve representing your formation line is selected. Exit Plot with DONE. 2-Select the Binoculars 3-Select VERTICAL PLOT check box at the lower center of the screen 4-Maximize VERTICAL PLOT 5-Choose Minimum DLS- MOUSE from the PROJECTION MODE in upper LEFT 6- Size the Plot with the slider until it is the magnification you desire. At this point you should see your dip line passing through your target in the center of the screen. As you move the mouse around the screen you can see how the minimum build rate and the inclination at the landing point changes by looking at the data displayed to the left. When you have the number near the values you desire, (often you can't get EXACTLY the values because of the accuracy of the screen, but often close is good enough) press the right mouse button and you will see the that the curve has been plotted. If you want to keep this curve select CAPTURE CURVE button. Your target coordinates will be stored in Target 20 and the curve will be stored in CURVE 22, not 23. Thus if you want to do quick comparisons, or comparative plots you can without much trouble. Using this graphical method is very useful for illustrating to geologists what can and can't be accomplished while drilling a well. Geologist sometimes lose track of what is technically possible from a drilling stand point and this tool can be used to illustrate quickly what is possible with a constant curvature. Of course, if one wants to explore what can be done with a tangent that is a matter of entering a tangent section survey, and projecting from the end of that using this method, or by using the 3-D S-Well projection method. Horizontal WELLS The planning of a horizontal well can be broken down into two separate problems. The first problem is the type of curve that needs to be built. The second problem is the type of horizontal section. Generally, customers will want to have a constant dogleg curve section from the kick off point to the landing point in the formation. How this curve is built depends upon what you know about it to begin with. Various scenarios are described below. Often the horizontal section is a straight line to a given TD point. Customers are beginning to request more and more horizontal targets as the 3-D seismic technology is providing them with a more accurate picture of the formation. The formations often are 96 WinSERVE TM User’s Manual Copyright © 2012 by Performance Drilling Technology not planar but go up and down much as surface terrain goes up and down. WinSERVE has some powerful, and easy to use tools that allow planning such a well easily. THE CURVE SECTION Horizontal Problem Number 1 The customer wants to drill a well to a formation with a known dip and KBTVD. You are also given the DLS that the motor will have to drill the curve. You don’t have a KOP or fixed Target point. WinSERVE has a special 2-D routine for just this problem. From the screen shown below select the Horizontal Profile. Turn off the VS and the KOP check boxes that are in the middle of the screen. When the two boxes are turned off the program lets you know that it is going to create a target and displays a data box. Fill in all the information in the data box plus the DLS and the ENTRY angle. Press DONE in the data box then press calculate. If you have filled in all the data boxes properly you will have your curve. Horizontal Problem Number 2 The customer wants to drill a horizontal well from a tie in point on a previously drilled well. He gives you the KOP, maximum dip angle and dip direction. There are several ways to solve this problem with WinSERVE, each dependent on the solution the customer wants to see. Option 1Customer wants to hit the formation along a specific line • Create a formation line using the formation line editor under EDIT on the main menu. Use whatever method is suitable for your application. • Enter your tie in point on your proposal curve, or select an already existing curve as your proposal curve. • Select the WELL PLAN button on the Main Screen. • Select 3-D to Line in the Projections section • Enter the curve number for the formation line you just created • Enter the entry angle. To the right you will see the end point of your curve. If you do not see a curve calculated then something is wrong with your setup. Maybe your line is not long enough or is not pointed in the direction you want. • DIRECTIONAL ALIGNMENT • If you want to align the direction as well as the inclination on the formation line select YES in the Directional Alignment. A directional alignment data box will pop up. You will need to enter a DLS value and a TFO value then tab off of the 97 WinSERVE TM User’s Manual Copyright © 2012 by Performance Drilling Technology Inclination to recalculate. This alignment method iterates a course length at the DLS and TFO specified until it either finds a solution or bails out trying. You can press the ESC key to make it stop iterating if it seems to be hung up. Generally you will want to have the alignment DLS and the DLS of your landing curve be equal. The only way you can achieve this is to fiddle with the alignment DLS and TFO values until the two DLS’s match. They have a tendency to converge towards each other so by taking DLS values that are half the distance between each other you can lock in on a value quickly. Don’t forget the TFO value. Customer wants to hit the formation plane at a given inclination in a specific direction. Go to the formation line maker and create a line using method 1 that represents the maximum down dip and down dip direction of the formation plane. Select WELL PLAN on the main screen. Select DLS at TFO to TVD Select the option box that says LOCK ON FORMATION TVD Enter the Curve number of your formation curve you just created. Enter the Inclination and direction you want to be in when you land the curve. Assuming you have entered your data properly you will see the end point of the curve calculated. Option 2• • • • • • Customer wants to hit the formation plane in a given inclination and at the same time pointed towards a fixed target point. Go to the formation line maker and create a line using method 1 that represents the maximum down dip and down dip direction of the formation plane. Option 3• Entering your Target Point If your target point is the end of your formation line you can Go to the main screen, select the survey point like you are going to Delete it, but instead of pressing the ‘DEL’ key , press the ‘T’ key. You will see a pop up target list. Select the target that you want to use. Or, you can simply go to the target list and enter the target manually. • Select WELL PLAN on the main screen. • Select DLS at TFO to TVD • Select the option box that says MAKE IT SO • Make sure that the target you want it is selected • Enter the Curve number of your formation curve you just created. • Enter the Inclination. When you Tab off of the inclination the computer will begin converging on solution. 98 WinSERVE TM User’s Manual Copyright © 2012 by Performance Drilling Technology Horizontal Problem Number 3 The customer knows his kick of point and has a specific landing point in the formation. This problem is like a modified S-Well, with a build-hold-build scenario. The customer can specify the DLS’s to use in the build sections as long as they are effectively greater than the minimum build rate they will work. THE HOLD SECTION Once the curve section of a horizontal well is built, the horizontal section needs to be built. Which projection method you use depends upon how many targets you want to drill through and whether or not your curve is aligned in the direction you want to go. Projection Methods you can use: • Straight line to MD-Enter the MD • Straight line to TVD-Enter the TVD you want to drill to. • DLS to TARGET - Enter the DLS you want to use to point to the target. • DLS to TARGET using the CONNECT TARGETS option for connecting many targets. Select the targets you are going to use by clicking on the leftmost side of the target box and then dragging the highlight to the last target you want. Enter the default DLS you want to use to connect the targets and then press CONNECT TARGETS. • Vector Project- Select the azimuth and inclination you want. See the section of documentation on the vector projector on how to use this tool. • Vector project to multiple targets- Before using this you should make sure that the inclination and azimuth specified for each target is what you want. You do this with the TARGET EDITOR from the main screen. Double check the last target, especially since this target is not automatically assigned and will often have a stray number for inclination and azimuth. Upon returning the VECTOR PROJECTOR in Well Planning select your targets as described above under DLS to TARGET. 99 WinSERVE TM User’s Manual Copyright © 2012 by Performance Drilling Technology 3. Directional Well Plan Examples Examples of different types of well plan scenarios and the use and explanation of the various WinSERVE well planning tools is the best way to describe them, progressing from the simplest to the more complex. The user is encouraged to actively follow each step and confirm a duplication of the result. It is advisable to create a NEW FILE for this purpose. The descriptions are written as if the examples are performed sequentially in one session, and it is always assumed that the proposal curve is Plan # 1. If you wish to save any particular example, select Edit Curve Editor to copy the proposal to another curve. a. Slant Well Profile The default presentation upon first entering the Well Proposal Planning Screen is for the most common well profile, the 2-D Slant Well, as seen in the example shown above. With this option the parameters that are displayed are KOP, DLS1 and Hold Angle. You must enter values for any two of the three variables, and click ON the button of the third to be calculated. I. Example: 2-D Slant Well Given Information: A) Set up Target #1 at 4500 feet TVD, 45 degrees direction, 1000 ft displacement. B) Fixed KOP at 650 ft; DLS1 3/100 Solve: Hold Angle The 2-D KOP solution always assumes a “zero-zero” tie in survey, i.e., zero coordinates (and thus, zero inclination and vertical section). Select Target #1 in the selector boxClick on the button next to the Hold Angle as the variable to be solved for. Enter a KOP of 650 in the box next to the K.O.P. label, and a 3 next to DLS1 for the dogleg severity. Press CALCULATE: WinSERVE prompts the user whether to set the VSP equal to that of the selected target – click YES. You should immediately see a value of 15.57 for the Hold Angle, and a list of all the surveys displayed in the spreadsheet below. If you should want a different Vertical Section Plane, you may enter it in the V.S. Plane text box to recalculate the proposal. Click Show Critical Points: the KOP, End of Build and 100 WinSERVE TM User’s Manual Copyright © 2012 by Performance Drilling Technology BHL are displayed in the survey list with automatic labeling comments. Click Apply if you want the comments to be included in the full survey list. Now let’s look at the problem another way; for instance, you want a Hold Angle of 25 degrees, and want to know the required DLS to achieve that. Enter a Hold Angle of 25, click the button next to DLS1 and press CALCULATE: WinSERVE warns you that you are about to overwrite the existing proposal – click YES, and the value of DLS1 changes to .7448 and the survey list is updated to display the new proposal. Now let’s solve to find the KOP for a DLS of 3 and a Hold Angle of 25. Enter a DLS1 of 3, click the button next to KOP and press CALCULATE: again click YES to redo the proposal and you will see a new KOP of 1932.1 displayed. This simple exercise illustrates the procedure for creating Profile type well proposals. The user examines the given information to determine how to proceed. It should be noted that it is unnecessary to delete the last proposal when working with Profiles since the Profile type well plan always is initiated from the KOP and thus always overwrites an existing proposal. II. Example: 3-D Slant Well Given Information: A) Target No. 1 remains the same. B) Tie In point: 1500 MD, 2 deg INC, 300 AZ, 1499.7 TVD, N-S coordinate 13.09, E-W coordinate –22.67. Solve: Hold Angle The 3-D Slant Well problem implies that one no longer has a “zero-zero” tie in survey and that as a result the generated curve will not lie in a plane, i.e., there will be a turn involved. Press the TIE-IN button and select 3-D Tie In Point to enter the given tie in data. Notice that when you press DONE to exit the Tie In dialog box, the survey is inserted and the list is automatically recalculated. However, the turn to the original VSP is accomplished in one station, resulting in an undesirable well plan. Press OK to confirm the 3-D Tie In Point selection and notice that the KOP parameter boxes are removed from the Solve area. This follows naturally since you have specified a fixed KOP determined by the tie in and it is thus no longer a variable that may be changed. Press CALCULATE to illustrate a point: no solution is found for the given tie in and a DLS of 3 and a Hold Angle of 25 because all three variables have been specified for a mathematically impossible solution. Click the Hold Angle button and press CALCULATE again: a new proposal is generated in which the Hold Angle is 20.98. 101 WinSERVE TM User’s Manual Copyright © 2012 by Performance Drilling Technology The solution rendered for any Slant Well Profile will always show a constant Dog Leg Severity in the curve section. If there is any turn, the DLS remains fixed while the Walk Rate and Build Rates change. The calculation routine for the 3-D Slant Well is the same as that used to calculate the DLS Projection to Target from any point other than the KOP. b. S-Well Profile Select the S-Well Profile Type and TIE-IN2-D KOP. (It is not necessary to “zero” the tie in survey – it will be overwritten). In the Solve area there are now seven different parameters displayed: KOP, DLS1, DLS2, Entry Angle, Hold Angle, Tangent and Post Hold. There is also a square check box to the right of the DLS text boxes to alert the solve routine whether the upper and lower DLS's are to be set equal, or specified differently. Checking the box will not change either of the displayed values until you have entered one of the DLS’s and tabbed off it. Remember that DLS is always a positive number, by definition describing the absolute curvature of a line without reference to any ‘up/down’ or ‘left/right’ orientation. The program assigns positive or negative Build and Walk rates based on the solution generated. Entry Angle is the final inclination you want when the target is reached. Post Hold is a straight line section extending from the second curved section before reaching the target. The text box is highlighted in yellow to remind the user that this variable must be entered if such a section is desired; it cannot be calculated (note that there is no radio button associated with the Post Hold parameter). III. Example: 2-D S-Well Given Information: A) Target No. 1 remains the same as previous examples. B) KOP at 1000, DLS1 of 2/100, DLS2 of 1.5/100, Entry Angle of 7 deg. Solve: Hold Angle Confirm that the 2-D KOP is selected, set up the Solve area to match the given information, and press CALCULATE. If you have entered the data correctly and checked the Hold Angle button, you should see the solution of Hold Angle of 20.431 degrees and a Tangent Section of 1741.65. Notice that the Tangent was calculated automatically as part of the solution for Hold Angle. For a further insight into the mechanics of the S-Well solution, change the KOP to 2000 and recalculate. Notice that the TVD at the bottom hole location is 5097.06, deeper than the target TVD, and there is 102 WinSERVE TM User’s Manual Copyright © 2012 by Performance Drilling Technology no tangent section. This can be clearly seen if you view the PLOT. In this scenario, given the specified KOP and DLS’s, it is impossible to hit the target at TVD; instead, the solution is calculated to match the target’s displacement in the proposed Vertical Section Plane. As with the Slant Well example, the problem can be approached in many different ways. Enter a Hold Angle of 24 and solve for KOP: you should get a KOP of 1234.7. Now what if you wanted the doglegs to be equal? Check to solve DLS1 and check the box to the right, and CALCULATE: you should see a value of 1.7987 displayed for both DLS1 and DLS2. Enter 2 in either of the boxes and tab off to verify that they are set equal. Now let’s examine the case where you want to specify the Tangent Section, for instance to reach a desirable casing point. This is a special case in which you must enter a value for the checked parameter. Check the Tangent Section button and notice that the KOP, Hold Angle and Tangent text boxes all turn red. This is to indicate that in this mode the KOP and Hold angle will be recalculated based on the value of the Tangent input. Enter a Tangent Section of 1000 and CALCULATE: the new KOP is 1434.4 with a Hold Angle of 26.0523. To see how the Post Hold feature is used, enter a value of 200 and CALCULATE. Viewing the bottom of the survey list one can see the straight-line extension with which the proposal finishes. The 3-D Tie In Point option works in the same manner as with the Slant Well, with the KOP parameter boxes removed from the screen. The generally recommended best approach and the one that yields the quickest solution is to input the desired build and drop DLS’s and the Entry Angle, and solve for the Hold Angle. It is possible to specify a Hold Angle and solve for the DLS’s or Entry Angle; however, these solutions can often take more than a minute to calculate due to a greatly increased number of calculations taking place in comparison to the preferred choice. Note that you can also plan 3-D horizontal proposals by specifying a high landing (entry) angle, in which case both curve sections are building, rather than the familiar build and drop of the classic SWell. 103 WinSERVE TM User’s Manual Copyright © 2012 by Performance Drilling Technology c. Horizontal Profile 2-D Select the Horizontal Profile and TIE-IN2-D KOP, and you will see that in the Solve area the same set of parameters as for the S-Well are displayed, with the addition of two check boxes at the bottom labeled FIXED SECTION and FIXED KOP. In terms of the mathematical solution, the general profile for a horizontal well is similar to an S-Well, but with two builds instead of a build and a drop; however, horizontal well plans are sufficiently different to constitute a separate profile. The following examples outline the most common scenarios. IV. Example: Given Information: Solve: Fixed KOP, Fixed Target, Fixed DLS A) Create Target #2 at TVD 6000, Direction 60, Displacement 4000. B) KOP 2000, DLS1 = DLS2: 3/100, Start Angle 0, Entry Angle 85 Hold Angle This general solution for a horizontal well assumes that there is both a fixed KOP and a fixed target; normally this means that there will be a tangent section between two builds. The user specifies the desired dogleg and solves for the Hold Angle, just as in the S-Well example above. Both the FIXED SECTION and FIXED KOP boxes should be checked. (FIXED SECTION refers to the fixed displacement of the target in the VSP). Enter the given data, select Target No. 2, and CALCULATE. Press PLOT to view the curve. V. Example: Given Information: Fixed KOP, Unknown Target VS and Build Rate A) Same Target #2 as in previous example. B) KOP 2000, Start Angle 0, Entry Angle 85 Check FIXED KOP and un-check FIXED SECTION. A message alerts the user that this mode will recalculate the target displacement. What this means is that this solution generates a minimum constant DLS curve in which the entry point or BHL lands at the TVD of the selected target, but not at the given target displacement. VI. Example: Given Information: Fixed Target, Unknown KOP and Build Rate A) Same Target #2 as in previous example. B) Start Angle 0, Entry Angle 85 104 WinSERVE TM User’s Manual Copyright © 2012 by Performance Drilling Technology Check FIXED SECTION and un-check FIXED KOP. In this mode the program adjusts the KOP to find the minimum constant DLS curve in which the entry point or BHL hits the target. The user inputs only the Start Angle (normally zero) and the desired Entry Angle. Given the constraints of a constant dogleg curve, depending on the combination of depth and displacement of the target, the solve routine may ‘run out of room’ attempting to find the solution, and a message will then inform the user that the KOP is less than zero. This process can be seen if you change the TVD of Target #2 to 4400 and recalculate: note the KOP of 34.8; now change the TVD to 4300 – no solution is possible. VII. Example: Given Information: Fixed DLS, Unknown Target, Known Dip and Formation TVD A) DLS1 of 10/100, Entry Angle 85, Dip 5 deg and Formation zero VS = 5000 In this example, un-check or turn off both the FIXED SECTION and FIXED KOP check boxes. A pop-up box titled FIXED DLS will appear, as shown below: This mode adjusts the KOP to generate a constant dogleg curve at the specified DLS to intersect a dip line characterized by the given parameters. The intersection point is then defined as a target stored in the assigned number. Once the data have been entered, press DONE to close the dialog box, then press CALCULATE to find the solution. The coordinates of the BHL of the proposal are those of the target that was created, and which may also be viewed in the Target Maker. As with the previous example, in some circumstances a constant curvature solution cannot be found and the ‘KOP less than zero’ message will be posted. In such cases, try a higher DLS value. This is the same solution routine as in PROJECTIONS3-D to Formation Line, except it is solved inversely, from a defined BHL back to an undetermined KOP. It provides a quick, short-cut solution for when a constant dogleg curve landing on a well-defined formation is desired. Instead of having to create a formation line first, and specifying a target location to shoot for, the program accomplishes the objective in one easy step. The solution does not create the formation line, however; if you want to see the line on 105 WinSERVE TM User’s Manual Copyright © 2012 by Performance Drilling Technology the plot, you must create it by selecting Edit Make Formation Lines from the Main Screen and input the same Dip Angle, Dip Direction and Zero VS as above. Refer to Formation Line Maker, and see Example X for an illustration of a projection to a dip line. 106 WinSERVE TM User’s Manual Copyright © 2012 by Performance Drilling Technology VI. Tools 1. Interpolate Interpolate between two survey points by MD or TVD. The interpolated point may be inserted into the survey list and labeled as such. The interpolated point may also be made a Tie-in point for a sidetrack well workcurve or proposal by selecting MAKE TIE IN. WinSERVE will prompt you to choose the curve in which to store the point. A text file with the extension .INT may also be created, or a previously created file loaded. This file saves all points that have been interpolated, and allows them all to be inserted at once if the file is loaded and executed by clicking EXECUTE TVD LIST. 107 WinSERVE TM User’s Manual Copyright © 2012 by Performance Drilling Technology 2. Tally Book The Pipe Tally interface is provided as a convenience to those who wish to utilize it. The tally may be printed out. 108 WinSERVE TM User’s Manual Copyright © 2012 by Performance Drilling Technology 3. UTM Manager (GEOMAPPER) WinSERVE provides the user the GEOMAPPER as a convenience to calculate magnetic declinations and convert between UTM coordinates and latitude and longitude. Results are virtually identical to officially recognized government programs and should suffice for most applications. However, should you need officially sanctioned data, WinSERVE comes packaged with GEOMAGIX and CORPSCON programs which may be found in the Windows Program list. Documentation for CORPSCON is included. Although these programs will not be discussed as part of this manual, the user is encouraged to investigate and utilize them at his discretion. WinSERVE GEOMAPPER provides pull-down menus for choice of geographic area and the ellipsoid model to be employed. It is advised to consult the company geologist or other representative to obtain the proper model to be used. A full discussion of general mapping and modeling considerations, as well as an example calculation may be found in Error! Reference source not found.. Get to the Geomapper by going to Tools> UTM Manager. The Geomapper is designed to assist the user in calculating the UTM and Lambert coordinates from latitude and Longitude, or vice versa. Once the geographical 109 WinSERVE TM User’s Manual Copyright © 2012 by Performance Drilling Technology coordinates are calculated the magnetic declination and grid correction are calculated and displayed. This program uses the same methods of calculation as the Department of Defense program GEOMAG. The calculation of the Map Projections are taken from the U.S. Geological Survey Professional Paper 1395. As a surveyor it is essential to know what correction to apply to magnetic directional measurements. This program calculates them using a low-frequency mathematical model. This means that this model predicts what the average magnetic dip and declination is for a given time, but does not predict the higher frequency variations that occur in a given day. Ellipsoid Models The earth is not round! This has been known for centuries. The Earth’s shape most closely resembles a geoid, which is a type of ellipsoid. The radius of the earth at the equator is a couple hundred kilometers more than the radius at the poles. Ever since man has been able to measure those radii with any type of accuracy there have been different radii, setting different standards for surveying. The Clark - 1866 ellipsoid, for example, is based on measurements made in the mid 1800's. This model is what most surveying is based upon in the U.S. In other countries, other standards are used. The most accurate is the GRS 80 ellipsoid model that is based upon extensive satellite measurements of the earth. To start applying this model to all surveying done today would invalidate all surveying done with the earlier model and cause certain confusion and legal problems, thus, we still use the older models for surveying purposes. Map Projections There are many different ways to map the earth on to a flat page. This is the science of cartography. The best type of map projection to use depends upon the area being mapped, and the application. The most desirable map projection methods are those that present the least amount of distortion, and at the same time are relatively easy to calculate. Now, with computers, the later reason is not as important as it used to be. The two most widely used map projections are the Universal Transverse Mercator (UTM) and the Lambert Spherical Conic. The UTM breaks the mapped area down to a set of successively smaller rectangular areas. These areas are called zones. To map a general region it is necessary to know the origin, which consists of a central Longitude that runs through the middle of the UTM rectangle and an origin Latitude. For Lambert projections there are four reference lines: a northern and southern latitude and an eastern and western longitude. 110 WinSERVE TM User’s Manual Copyright © 2012 by Performance Drilling Technology Magnetic Models The magnetic field of the earth is constantly changing. The state of the magnetic field depends upon internal activities within the earth and the earth’s interaction with the sun. Fortunately the gross changes to the magnetic field are predictable to a certain degree and that is what magnetic models are about. The magnetic field is not round, or ellipsoid. What defines the shape of earth’s magnetic field is the field strength, and field direction at each point around the volume of space that surrounds the earth. To mathematically describe this field and how it changes at any given point over a period of time is quite complicated. The general name of the model that is used is a Spherical Harmonic. It would mean more if they called it a summer squash shape, one of those pretty undulating squashes that look better than they taste. This is where the IGRF and World Wide Magnetic data comes into play. Every five years the USGS issues a new set of constants that are used to predict the next five years of magnetic strength and direction. The IGRF models that have been used in the past are based upon a 10 lobe spherical harmonic model. The World Wide Magnetic model that is becoming the new standard is based upon a 12 lobe spherical harmonic model. For surveying purposes the differences are negligible. The 10 lobe model has about 120 constants and the 12 lobe model has about 500 constants. Thus, predictions are supposedly a little more precise with the World Wide Magnetic model. (WWM). Using Geomapper Despite the complexity of the problem, using GeoMapper to calculate the UTM or Lambert Coordinates and Magnetic field properties is quite simple. First, you must make sure that the ellipsoid model is set to the ellipsoid model used in your part of the world. In the U.S. it should be set to Clark - 1866. Then, select the Map Projection from the pick list. If you are unsure as to which zone to choose, ask the geologist for the job. Next, choose the Magnetic model to use. The magnetic models are located in the C:\survey directory and have the extension .MIF. Once that is done, the two questions are, ‘Where are you?’ and ‘When are you?’ The answer to ‘Where are you?’ can be expressed in Longitude and Latitude or in the East, North coordinates. You will always have one or the other. The answer to the second question, ‘When are you?’ defaults to the current date on the computer, but you can change the date manually if you wish. Example: Location: Latitude: Longitude Time Alaska, Zone 4 65 33' 34.2345" 148 23' 45.4689" West Current Date 111 WinSERVE TM User’s Manual Copyright © 2012 by Performance Drilling Technology Click on the MAP TYPE AND LOCATION down arrow and select ALASKA ZONE 4 Click on the ELLIPSOID MODEL and select Clark - 1866 Click on the MAGNETIC MODE and choose the c:\Survey\MODEL.MIF file. In the Latitude box enter 65, 33, 34.2345 in the Degrees, Minutes Seconds text boxes. You will see the Decimal value: 65.55950958 Displayed in the Latitude box. In the Longitude box enter -148,23,45.4689 in the degrees, minutes seconds text boxes. You will see the Decimal Value: -148.39596358 displayed. When you <TAB> off of the Decimal for the Longitude the coordinates will be calculated for you. You will see: 743025.0132392 for the East Coordinate and 4227836.1395556 for the North Coordinate. You will also see magnetic information displayed for the current date. The field strength is measured in nanoteslas. To convert to Gauss, divide by 10000. You could have entered the coordinates and gotten the Geographical latitude and longitude instead. When you <TAB> off of the North Coordinate your geographical coordinates are calculated. The only inputs that you have for the magnetic information are the time and the magnetic model. 112 WinSERVE TM User’s Manual Copyright © 2012 by Performance Drilling Technology 4. Platform Manager The WinSERVE Platform Manager allows the user to establish a slot template describing wellhead locations for multiple wells. It should be noted that the scope of this feature is intentionally limited, inasmuch as WinSERVE is designed for and primarily directed toward serving the needs of relatively smaller drilling operations, by providing a powerful yet easy to use package of well planning and survey reporting tools whose focus is the individual well. Thus, while the user may input XYZ reference coordinates for a field and platform structure, these parameters function mainly as well location identifiers rather than as part of a comprehensive field management system. The extent of WinSERVE’s purpose in this regard is to provide the well planner and field personnel a simple tool to facilitate collision analysis for the current well, limited to the 113 WinSERVE TM User’s Manual Copyright © 2012 by Performance Drilling Technology number of curves available in the survey file. This objective may be accomplished without the Platform Manager simply by entering surface offsets for each curve on the Main Screen. The next generation of survey and well planning software, HawkEye (www.hawkeye3d.com), includes extensive database well management features with enhanced 3D graphic capabilities. 114 WinSERVE TM User’s Manual Copyright © 2012 by Performance Drilling Technology 5. Dip-DLS Calculator The WinSERVE Dip-DLS Calculator Tool is a convenience feature to get a quick visualization of a minimum DLS curve. The user specifies three of the six variables to generate the curve. Initially the Calculate button is dimmed and the variable labels are displayed in red text. When the program has enough inputs to generate a solution, the Calculate button switches to bold type and the variable labels are displayed in blue text. Click Calculate to view the solution. The colors of the variable input boxes are duplicated in the graphic diagram to identify the parameters clearly. If you want to change a variable and recalculate the curve, click in the box to overwrite it and press the pencil eraser icon to delete a sufficient number of other variables to allow a solution. The bottommost ‘eraser’ will clear the entire input table. This aspect of the tool is primarily of interest to well planners to quickly test different scenarios before beginning the proposal. An additional feature that is useful for directional drillers as they approach a formation ‘landing’ in a horizontal well is the calculation of the build rate needed. This is a minimum DLS projection to hit a formation line. It is necessary to know the RKB_TVD value of the line to utilize this tool. If you press the BR Needed button, three boxes will 115 WinSERVE TM User’s Manual Copyright © 2012 by Performance Drilling Technology appear across the bottom of the window, automatically displaying the current TVD and VS of the selected Curve# (typically the workcurve), and the last value entered for RKB_TVD. All of these values may be changed. Enter the End Angle (entry or landing angle) and Dip Angle and click BR Needed again to perform the calculation. Note that the Start Angle is the inclination of the current survey or BHL. WinSERVE will store the last entered values for RKB_TVD, End Angle and Dip Angle, so you can obtain an updated projection after each survey is calculated by simply clicking BR Needed without any data entry. Refer to Special Projection Setups to learn how to have this projection calculated automatically and stored in Curve 23. 116 WinSERVE TM User’s Manual Copyright © 2012 by Performance Drilling Technology 117