1
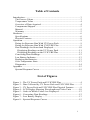
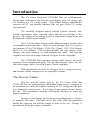
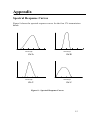
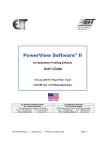
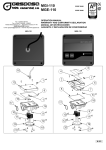
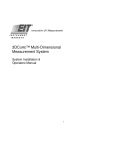
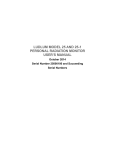
UVICURE® Plus
&
UV Power Puck™
USER'S MANUAL
Table of Contents
Introduction............................................................................................. 3
The Process Values.............................................................................. 3
Temperature Value .............................................................................. 4
Overview of Data Acquired.................................................................. 4
Components Shipped........................................................................... 5
Manual ................................................................................................ 5
Warranty ............................................................................................. 5
Hardware................................................................................................. 6
Specifications ...................................................................................... 6
Physical Features ................................................................................. 8
Operation ................................................................................................ 9
Doing An Exposure Run With UV Power Puck.................................... 9
Doing An Exposure Run With UVICURE Plus.................................... 9
How Readings Are Stored and Displayed........................................... 10
Displaying Readings on the UV Power Puck .................................. 11
Displaying Readings on the UVICURE Plus .................................. 11
Converting Data Readings ................................................................. 12
Low Battery Indicator ........................................................................ 13
Replacing the Batteries ...................................................................... 13
Over-Temperature State..................................................................... 13
Diagnostics........................................................................................ 14
Appendix .............................................................................................. 15
Spectral Response Curves .................................................................. 15
List of Figures
Figure 1 – The UV Power Puck and UVICURE Plus ............................... 4
Figure 2 – Data Collected by UV Power Puck and UVICURE Plus .......... 5
Figure 3 – UV Power Puck and UVICURE Plus Physical Features........... 8
Figure 4 – LCD Display Showing Wavelength and Value Units ............ 10
Figure 5 – Order in Which Values Are Displayed.................................. 12
Figure 6 – Converting Data Readings .................................................... 12
Figure 7 – Low Battery Display ............................................................. 13
Figure 8 – Spectral Response Curves ..................................................... 15
i
ii
Introduction
The UV Power Puck and UVICURE Plus are self-contained,
electro-optic radiometers that measure and display total UV energy and
UV intensity in a UV curing system. Their robust designs withstand the
extremes of UV and thermal radiation that are part of the UV curing
environments.
The carefully designed optical sensing systems measure only
certain wavelengths while rejecting others that are not relevant to the
process. The output of the sensing system is converted to digital form and
displayed in a liquid crystal readout.
The UV Power Puck measures four different ranges of ultraviolet
wavelengths at the same time. With one pass through your UV process,
you measure UVA (320-390nm), UVB (280-320nm), UVC (250-260nm)
and UVV (395-445nm). This reading includes not only dosage (total
energy), but peak intensity of each transmission band. The spectral
response curve for each range is shown in Figure 8 in the Appendix.
The UVICURE Plus measures dosage (total energy) and peak
intensity of one transmission band. The spectral response curves for any
individual range can be viewed in Figure 8 in the Appendix.
Both instruments are ideal for all types of UV curing processes,
and because of their compact size are especially versatile.
The Process Values
The two process values read by the UV Power Puck and
UVICURE Plus are peak intensity and dosage (total energy). Intensity is
an instantaneous value, the highest intensity of UV energy that the unit
sees during the exposure run. It is energy at one instant in time during
the run. The instruments measure and display intensity in watts per
square centimeter.
Dosage or total energy (the terms are interchangeable) is a factor
of intensity over time. The units derive this value from the intensities
during the exposure run and the length of time of the run. Dosage is
measured in Joules per square centimeter.
3
Reaching the intensity and dosage values specified by your
process is necessary for achieving a complete UV cure.
Figure 1 – The UV Power Puck and UVICURE Plus
Temperature Value
The UV Power Puck and UVICURE Plus also provide an internal
temperature sensor that senses and displays the internal temperature of the
devices. This reading is provided so you can keep the unit within safe
operating parameters. It is not an indication of the temperature of the
curing system. The temperature reading is displayed in degrees
Centigrade for ¾second when the instrument enters the RUN mode.
Overview of Data Acquired
During each exposure run, the UV Power Puck and UVICURE
Plus collect the data shown in the matrices in Figure 2. The matrices
show the data in a format similar to the format in which the data is stored
in the memory of the instruments.
4
Value
Dosage
Intensity
UVA
UVA
J/cm2
UVA
W/cm2
UV Power Puck Wavelength
UVB
UVC
UVB
UVC
J/cm2
J/cm2
UVB
UVC
W/cm2
W/cm2
Value
Dosage
Intensity
UVV
UVV
J/cm2
UVV
W/cm2
UVICURE Plus Wavelength
UV
J/cm2
UV
W/cm2
Figure 2 – Data Collected by UV Power Puck and UVICURE Plus
Components Shipped
Each instrument is shipped along with this User’s manual in a
protective foam-lined carrying case.
Manual
This manual contains all the information you need to use and
maintain the UV Power Puck and UVICURE Plus. There is an
introduction to the instruments and the process values they measure, a
description of the hardware, specifications, and instructions for using the
instruments in your application. Any maintenance problems that are not
covered in this manual should be addressed to the EIT Customer Service
Department. See “Warranty” section that follows.
Warranty
Warranty period for the UV Power Puck and UVICURE Plus is
six months from the date of purchase, abuse and neglect excepted. The
only user-serviceable parts in the units are the batteries. If your unit does
not operate properly, call EIT at (703) 478-0700 or FAX at (703) 4780815. We will arrange for its return to the factory for repair and
recalibration. In addition, the unit should be returned every six months
for certification.
5
Hardware
Specifications
(Specifications subject to change without notice).
Display:
4-digit LCD.
Range:
UVA, UVB, UVV – 5mW/cm2 to 5W/cm2; UVC – 5mW/cm2 to 1W/cm2
Accuracy:
+/- 5% typical; +/- 10% guaranteed.
Spectral Response:
UV Power Puck: Four channels continuously monitored during operation.
UVA (320-390nm), UVB (280-320nm), UVC (250-260nm),
UVV (395-445nm)
UVICURE Plus: One channel continuously monitored during operation.
(Example: UVA 320-390nm)
Spatial Response:
Approximately cosine.
Operating Temperature Range:
0-75o C internal temperature; tolerates much higher external temperatures
for short periods; audible alarm indicates when temperature is too high.
CAUTION:
The maximum internal temperature is 80o C. If internal temperature
exceeds this, the warranty is voided.
Time-out Period:
4 minutes RUN mode (no energy observed), 2 minutes DISPLAY mode
(no key activity).
Batteries:
Two user-replaceable lithium cells, Duracell DL2450, Sanyo CR2450 or
equivalent.
6
Battery Life:
1500 readings with typical use.
Dimensions:
4.60 x .50 inches; 117 x 12.7 millimeters (D x H).
Weight:
11.75 ounces (333.1 grams).
Package Material:
Aluminum, stainless steel.
Carrying Case Material:
Cut polyurethane interior to accommodate radiometer. Scuff-resistant
nylon exterior cover.
Carrying Case Weight:
1 pound (453.6 grams)
Carrying Case Dimensions:
12 x 4.7 x 8.25 inches; 304.8 x 119.4 x 209.6 mm (WxHxD)
7
Physical Features
The main physical features of the UV Power Puck and UVICURE Plus are
shown in Figure 3.
Push Buttons LCD Display
SELECT
Battery Door
RESET
UV Sensors
UV Power Puck
A B
V C
UVICURE Plus
A
Figure 3 – UV Power Puck and UVICURE Plus Physical Features
8
Operation
Doing An Exposure Run With UV Power Puck
1.
Turn the unit on by pressing either the Select or the Reset button.
The unit flashes the software version, PX.XX, for one half second. It
then displays the wavelength last selected and the value last read
before power-up.
2.
Do a short press of the Reset button to clear memory and put the unit
in the RUN mode. The display flashes “run” after momentarily
displaying the internal temperature of the unit. Confirm that the unit
flashes “run” before initiating a reading. A long press of the Reset
will turn the unit off.
3.
Put the device on the belt under the UV source with the LCD display
down, directed away from the light source. Pass it through the
system. When it comes out, the display will still be flashing “run”.
CAUTION:
Exposing the LCD display to high intensity UV radiation will
damage the LCD.
4.
Press Select to exit RUN mode and to display the reading. It will be
in the same display mode that it was in before the exposure run, but
will display the new value.
Doing An Exposure Run With UVICURE Plus
1.
Turn the unit on by pressing either the Select or the Reset button.
The unit flashes the software version, PX.XX, for one second.
2.
Do a short press of the Reset button to clear memory and put the unit
in the RUN mode. The display flashes “run” after momentarily
displaying the internal temperature of the unit. Confirm that the unit
flashes “run” before initiating a reading. A long press of the Reset
will turn the unit off.
9
3.
Put the device on the belt under the UV source with the LCD display
down, directed away from the light source.
CAUTION:
Exposing the LCD display to high intensity UV radiation will damage the
LCD. Pass it through the system. When it comes out, the display will
still be flashing “run”.
4.
Press Select to exit RUN mode and to display the reading. It will be
in the same display mode that it was in before the exposure run, but
will display the new value.
How Readings Are Stored and Displayed
The UV Power Puck and UVICURE Plus write the data they
sense into a section of non-destructible memory each time you do an
exposure run.
The internal temperature reading is the internal
temperature of the unit when placed in the RUN mode. The intensity and
dosage readings are based on what the unit senses optically during the
exposure run. In the case of the UV Power Puck, the intensity and dosage
are different for each transmission band.
The data readings are displayed in the LCD display. The
wavelength of the displayed reading is shown at the top of the display and
the units of the value of the reading are listed at the right of the display.
See Figure 4. If the peak intensity exceeds threshold on a particular
wavelength, the displayed number in that bandwidth (both J/cm2 and
W/cm2) will flash, indicating that the collected data cannot be considered
valid.
ABCVX
UV A
X
W/cm
2
W/cm
2
J/cm
2
°C
Figure 4 – LCD Display Showing Wavelength and Value Units
10
Displaying Readings on the UV Power Puck
The matrix in Figure 5 shows all the data readings taken and
stored during an exposure run. You display the data readings by doing
long and short presses of the Select button. Each short press of the Select
button shows the next value in the wavelength. Short presses are
identified by a short chirp after the press. Each long press of the Select
key (approximately .75 seconds in duration) shows the same value in the
next wavelength. NOTE: A long press of the Reset button will turn the
unit off. The unit displays “Off” momentarily and then turns off.
In summary, short presses loop through the values for one
wavelength, from top to bottom, back to the top. Long presses loop
through all the wavelengths showing the same value, moving from left to
right, looping back to the left.
Displaying Readings on the UVICURE Plus
The matrix in Figure 5 shows all the data readings taken and
stored during an exposure run. You display the data readings by doing
short presses of the Select button. Each short press of the Select button
shows the next value in the wavelength. Short presses are identified by a
short chirp after the press.
In summary, short presses loop through the values for the
wavelength, from top to bottom, back to the top. It is important to use a
short press of the Select button to display the next value. A long press of
the Select button in undefined for this unit, and the display appears not to
change from the first value. NOTE: A long press of the Reset button
turns the unit off. The unit displays “Off” momentarily and then turns
off.
11
Short press of Select key: the
display moves to the reading
below, then loops back to the top.
Value
UV Power Puck Wavelength
UVA
UVA
J/cm2
UVA
J/cm2
Dosage
Intensity
UVB
UVB
J/cm2
UVB
J/cm2
UVC
UVC
J/cm2
UVC
J/cm2
UVV
UVV
J/cm2
UVV
J/cm2
Long press of Select key: the display moves to
the reading at the right and loops back to the
left.
Value
UVICURE Plus Wavelength
Dosage
UV
J/cm2
UV
W/cm2
Intensity
Short press of Select key: the display moves to
the reading below, then loops back to the top.
Figure 5 – Order in Which Values Are Displayed
Converting Data Readings
If your specifications are in milliWatts or milliJoules, you will
need to convert your instrument readings from watts and joules to
milliWatts and milliJoules. Do this by moving the decimal point three
places to the right of the display. See Figure 6.
UV A
X
2
W/cm
2
= 0.500 Watts/cm or 500 milliWatts/cm
2
Figure 6 – Converting Data Readings
12
Low Battery Indicator
When the batteries need to be changed, “LO BATT” is displayed
in the upper right corner of the LCD display as shown in Figure 7. If this
happens during an exposure run, the reading is still valid. The low
battery indicator is designed to illuminate early enough so that your data
remains valid. If battery capacity drops to the point where data integrity
is affected, the unit automatically writes zero to all locations. Under
severe low battery conditions, the unit does not enter RUN mode.
Therefore, confirm that the unit flashes “run” before initiating a reading.
UV A
X
LO BATT
W/cm
2
Figure 7 – Low Battery Display
Replacing the Batteries
Follow these procedures to replace the batteries.
1.
Loosen the screw on the battery door and remove the door.
2.
Remove the old batteries.
3.
Install two new lithium cells (Duracell DL2450 or Sanyo CR2450),
observing polarity. The unit is designed so it will not operate with
reversed cells.
4.
Replace the door and the screw.
Over-Temperature State
If the internal temperature of the UV Power Puck or UVICURE
Plus exceeds 65o C during an exposure run, the unit will emit a steady
beeping tone after the run. However, the data it has collected is accurate
and can be read by pressing the Select key. When you do this, the beeping
tone stops, and you can step through the data readings. In addition, if the
internal temperature of the unit exceeds 75o C the unit beeps once, then
displays the internal temperature continuously. It will not operate until
13
the internal temperature drops below 75o C. You should confirm that the
unit flashes “run” before initiating a reading.
CAUTION:
If you press Reset to initiate the RUN mode, before the unit cools to 75oC,
all data from the previous exposure run is cleared from memory. The unit
beeps and again continuously displays the temperature.
Diagnostics
The UV Power Puck and UVICURE Plus are continuously doing
internal self-tests. If the unit detects an internal problem, it will display
one of the following error codes on the LCD display. Both error codes
indicate unresolvable problems that require returning the unit to the
factory for service.
EI = E2PROM WRITE ERROR
E2 = E2PROM READ ERROR
14
Appendix
Spectral Response Curves
Figure 8 shows the spectral response curves for the four UV transmission
bands.
300
325
350
375
Wavelength
400
425
250
275
300
325
Wavelength
UV-A
230
240
250
260
Wavelength
350
UV-B
270
375
400
425
450
Wavelength
UV-C
UV-V
Figure 8 – Spectral Response Curves
15
375