1
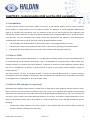
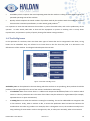
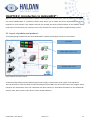
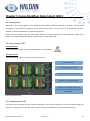
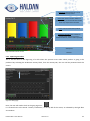
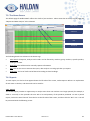
USER MANUAL Promotional copy A product of: Haldan MES® by: Haldan Consulting 81B Haupt Street Sidwell Port Elizabeth 6061 South Africa Tel: +27 (0) 41 451 3825 Email: [email protected] Website: www.haldanmes.com Individual manuals can be obtained from Haldan Consulting or their distributors. ©2014 Haldan Consulting. All rights reserved. No part of this manual may be reproduced or utilized in any form or by any means, electronic or mechanical, including photocopying, recording, or by any information storage and retrieval system, without permission in writing from the author. Haldan MES® is a trademark of Haldan Consulting. All other trademarks are property of their respective owners. Trademarks are used in this manual for purposes of identification only. Haldan MES ® User Manual Version 1.0 2 About the Author: Born out of a successful, multi-award winning automotive components company, Haldan Consulting aims to be a leader in providing production management systems to industry. Our systems build on our knowledge and experience in helping manufacturing companies improve their performance. Our vision is to utilise “best-in-class” processes, systems and products to deliver value to our clients by establishing more effective and efficient methods of performing business tasks in the manufacturing environment. Haldan MES® is based on the knowledge which Haldan Consulting has gained while implementing world class performance at many companies. The idea was born from the desire to build a standardised resource for facilitating continuous improvement in manufacturing environments through the measurement and analysis of Manufacturing Execution. Arno Koch is a pioneer in the field of process improvement and is the author of one of the very first published books on OEE. Haldan Consulting used his knowledge and experience as an improvement consultant as a starting point to develop this software resource. Haldan Consulting, in collaboration with Solutech Systems, has developed a software program called Haldan Manufacturing Execution Systems (Haldan MES®). It is a dynamic information system that drive effective execution of manufacturing operations. It provides both operators and management with essential and accurate information via in-depth analysis and reporting. The power of the software lies in its capacity to report losses quickly, visualize the effect on daily production, and facilitate effective corrective action. All development of Haldan MES® is performed by a multidisciplinary team. Currently, Haldan MES® focusses on the effective measurement of OEE . But, in the near future, the software will be expanded to align with all modules within a Manufacturing Execution System. At present, the software allows your production team to identify its hidden capacity and utilise it in improving production output. It is able to literally double production at half the cost, or lower costs whilst maintaining current capacity. The beauty of the software is that it provides the manufacturing team with the measures they need to understand what is happening on the shop floor. This will supply them with the information they need to make the right decisions, effectively stimulating participation throughout the company. Haldan MES ® User Manual Version 1.0 3 Author’s Message and Purpose of this Manual: In any manufacturing environment, the smooth operation of equipment is vitally important. The value that customers’ pay for is added to most processes with the use of machines. Machines are relied on to supply products to the customer when it is needed. However, it is clear that a vast range of machine problems affect factories all over the world. The companies that work towards understanding their equipment problems and eliminating them altogether are the ones who are sailing ahead in the production race. The essence of this understanding is Overall Equipment Effectiveness (otherwise referred to as OEE). OEE is a measure that lets you see how well your equipment is running. Essentially, it measures the effectiveness and efficiency of actual machinery output in comparison with the ideal output. It shows you how many products your machine is turning out as well as how much of the time the machine is actually working, and what percentage of its output is of a good quality. In an ideal factory, machines would operate endlessly (100%), using there full capabilities (100%), with a production yield of perfect quality (100%). However, in practice, this is not always realistic. Losses are what cause this discrepancy between the ideal situation and the actual situation. A crucial part of any significant improvement strategy is the ability to calculate the effectiveness of your machinery using OEE software. The benefits of OEE software include improved visualisation, resulting in shopfloor efficiency awareness. The Haldan MES® software is easy to operate and provides powerful objective data and information, giving your management and administrators all the necessary material to assist in future decision making. It is easy for the software, once purchased, to easily be expanded to other sections of the plant. The biggest benefit of using locally designed and manufactured software is having local support and consulting easily and freely available whenever the need arises. Figure: Shopfloor Data Collect allows you to collect data more easily and more accurately straight from the shop floor. Haldan MES ® User Manual Figure: The Dashboard is a visual representation of your current OEE performance. Version 1.0 4 Figure: Haldan MES® provides the user with an analyser tool with a wide array of clear graphs, charts and reports. This manual supplies the user with as much information as possible about how Haldan MES® should be used, and how you can use it to your maximum benefit. Haldan MES ® User Manual Version 1.0 5 Table of Contents: 1. 2. 3. Understanding OEE and the OEE calculation pg 9 1.1. Introduction pg 9 1.2. What is TPM? pg 9 1.3. What is OEE and why is it important? pg 9 1.4. The Six Big Losses pg 10 1.5. The OEE formula and calculations pg 11 1.6. The Shopfloor Teams’ role pg 13 1.7. Management’s role pg 13 1.8. The advantages of using Haldan MES® pg 13 Introduction to Haldan MES® pg 15 2.1. Layout of modules and products pg 15 2.2. Preparation of Masterdata pg 17 2.2.1. Plants pg 17 2.2.2. Machine groups pg 17 2.2.3. Data Devices pg 17 2.2.4. UOM pg 17 2.2.5. Categories, Groups and Activities pg 18 2.2.6. Scrap reasons pg 19 2.2.7. Products pg 19 2.2.8. Teams pg 20 2.2.9. Machines pg 20 2.2.10. Permission groups and Users pg 20 2.2.11. Screen Editor pg 21 2.2.12. SDC comments pg 22 Setting up Masterdata administration pg 23 3.1. Introduction pg 23 3.2. Plants pg 24 3.3. Machine groups pg 24 3.4. Data Devices pg 25 3.5. Uom pg 26 Haldan MES ® User Manual Version 1.0 6 3.6. Activities 4. 5. pg 27 3.6.1. Adding Activities to Categories pg 28 3.6.2. Adding Groups to Categories pg 29 3.6.3. Adding Activities to Groups pg 31 3.7. Scrap reasons pg 32 3.8. Products pg 33 3.9. Teams pg 35 3.10. Machines pg 36 3.11. Permission groups pg 42 3.12. Users pg 44 3.13. Screen Editor pg 46 3.14. SDC comments pg 50 3.15. Logs pg 50 3.16. Licensing pg 52 Shift Scheduler pg 53 4.1. Configuration pg 53 4.2. Scheduling shifts pg 57 Using Shopfloor Data Collect pg 62 5.1. Introduction pg 62 5.2. Accessing the SDC pg 62 5.3. Navigating the SDC pg 62 5.3.1. Capturing a Product pg 63 5.3.2. Capturing a Downtime Reason Code pg 64 5.3.3. Adding an Activity Comment pg 65 5.3.4. Editing an Activity pg 66 5.3.5. Activity Split pg 66 5.3.6. Capturing Scrap pg 67 5.3.7. Capturing the Team on Shift pg 68 5.4. Data Analysis pg 69 5.4.1. Availability pg 69 5.4.2. Performance pg 70 5.4.3. Quality pg 71 Haldan MES ® User Manual Version 1.0 7 6. 7. Manual Collection of Data pg 72 6.1. OEE Work Centre Time Sheet pg 72 6.2. Inputting data into Haldan MES® pg 74 MES Data Analyser pg 80 7.1. Introduction pg 80 7.2. Accessing the Haldan MES® pg 80 7.3. The Home Screen pg 81 7.4. Reports pg 81 7.4.1. Period pg 81 7.4.2. Activity pg 83 7.4.3. Indices pg 83 7.5. Data Analysis pg 85 7.5.1. OEE pg 85 7.5.2. OEE Andon pg 85 7.5.3. Availability pg 86 7.5.4. Performance pg 88 7.5.5. Quality pg 90 7.5.6. Losses pg 91 7.5.7. Shift Analyser pg 92 7.5.8. Utilization pg 92 7.6. Trends pg 93 7.6.1. OEE pg 93 7.6.2. OEE Andon pg 94 7.6.3. Availability pg 95 7.6.4.Performance pg 96 7.6.5. Quality pg 96 7.6.6. Downtime pg 97 7.6.7. Production pg 98 7.6.8. Scrap pg 99 8. Conclusion pg 100 9. References pg 101 Haldan MES ® User Manual Version 1.0 8 CHAPTER 1: Understanding OEE and the OEE calculation 1.1. Introduction An ideal machine operates continuously (100% of the time), at full capacity (100%), with an output of perfect quality (100%). In reality however, this is not always possible. The objective of Overall Equipment Effectiveness (OEE) is to calculate the losses which occur on machines so that you are able to improve the productivity and effectiveness of those machines. In order to be able to calculate where a machine suffers losses, an OEE calculation must be done. The OEE calculation will provide results that demonstrate the machine’s total effectiveness, revealing where the losses occurred. The main areas of the OEE calculation include: The availability rate of the machine (in other words, when is it operating and when it is not?) The performance rate of the machine (in other words, is the machine operating at maximum speed?) The quality rate of the machine (in other words, is the machine producing good products?) 1.2. What is TPM? TPM refers to Total Production Maintenance. It is a strategy that a company utilizes to improve the effectiveness of its manufacturing and production environment. This is accomplished by using techniques which enable your existing machinery to produce more good products. TPM aims to achieve an ideal production situation where there are no breakdowns, no defects, no losses because of rejects or poor quality, and no accidents, injuries or health problems.[1] The ideal situation can only be reached through a process of continual improvement. It requires complete participation from every member of the business, from the operators on shop floor level, to the office staff, and up to the highest level of management. One tool of TPM is OEE. 1.3. What is OEE and why is it important? Manufacturing companies make money by adding value to materials to make products that the customer wants. Most companies use their machines to add this value. This is why it is so important for machines to be operating effectively, with as little waste as possible. OEE stands for Overall Equipment Effectiveness, and it is a measurement tool that is used in TPM to reveal how effectively machines are running. A machine’s overall effectiveness is more than just the amount of parts that it can produce in a shift. The three main areas that OEE accounts for are the following: Performance: which compares the actual output of the machine with the potential output which the machine could be producing in the same time. Haldan MES ® User Manual Version 1.0 9 Availability: which compares the actual operating time that the machine is taking to make products with the potential operating time of this machine. Quality: which compares the actual number of products made by the machine with the number of products that meet the customers specifications, in other words, good products.[2] It is important to note that OEE monitors the machine or process that adds value, and not the productivity of the operator. In other words, OEE looks at how well the equipment or process is working. This is strictly about improvement, and promotes a policy of openly sharing information amongst workers. 1.4. The Six Big Losses In the operation of a machine, there are three main types of waste that can be categorised. From these, six big losses can be identified. They are referred to as losses due to the fact that they lead to a decrease in the effectiveness of the machine. The diagram below depicts this overview: Figure: Overview of Six Big Losses Availability Loss can be explained as the time during which the machine is not producing, when products should be produced. This can generally be for one of two reasons: breakdowns and waiting. A breakdown loss occurs when there is a sudden and unexpected breakdown/failure of a machine which causes in a loss in production time. The cause of this failure may be technical or organisational (for example, operational error or poor maintenance). A waiting loss occurs when the machine is waiting for something. This can be subdivided into categories: idle or line restraint. Firstly, when a machine is idle, it means that production time has been lost because the machine does not make any products. For example, when a changeover occurs, the machine normally has to stop producing for some time in order to change tools, dies, or other parts. Secondly, when a line restraint Haldan MES ® User Manual Version 1.0 10 CHAPTER 2: Introduction to HaldanMES®: When it comes to OEE and improvement, Haldan Consulting believes that decisions must be based on information, not instinct. Haldan MES® is a software product which allows you to collect and access information that is most important to your business. This chapter will walk you through the terms and parameters of the software which need to be associated with your company norms. This will allow for a faster and easier implementation process. 2.1. Layout of modules and products: The following diagram demonstrates how Haldan MES® modules and products connect to one another: Dashboard Haldan MES® Analyser Tool Shopfloor Data Collect Figure: Module connection layouts As the above figure demonstrates (following from left to right), each machine sends signals to the I/O device. This I/O device then sends this data the Central Database (Central DB). The central DB contains the program which interprets this information. Once the information has been collated, it sends OEE information to the Dashboards, Analyser tools, SDC’s and any other device used to display OEE data. Haldan MES ® User Manual Version 1.0 15 The diagram below also illustrates the relationship between the different parts and function of the program: Figure: Relationship between Masterdata and the other majors parts of Haldan MES ® software This figure above illustrates how Masterdata supplies the Central Database with information, which in turn, supplies the Dashboard, SDC, Data Analysis and Mobile devices with information. The SDC (which is an automatic data collection device situated on the shop floor) has a two way communication process with the Central Database, both providing and receiving OEE information to and from the Central DB. It is important to recognise that the entire process of collecting, collating and analysing OEE information stems from the data held within the Masterdata of the program. This is why it is incredibly vital to define and configure Masterdata correctly. The rest of this chapter will be dedicated to presenting a Masterdata Workshop, which will allow you to become familiar with different terminology used by the software. It will also allow you to understand and define the parameters used by the program. Haldan MES ® User Manual Version 1.0 16 CHAPTER 3: Setting up Masterdata administration: 3.1. Introduction The objective of this chapter is to demonstrate how to configure the Masterdata through administration with Haldan MES®. Only after the parameters, rates, shifts and teams have been defined can Haldan MES® be configured. This means that you will have to enter details including: Plants, machines, products, activities, shift and team definitions; Allocating products and activities to categories; And linking activities and products to a machine. Once you have started and logged onto Haldan MES®, you will be able to see the menu bar at the top of the screen. Ensure that you click on the “Administration” tab so that you can work on the Masterdata. The figure below demonstrates this: Select “Administration” Figure: Administration menu for Haldan MES® The Administration tab is for configuration purposes only. In other words, it is where you enter and edit defined parameters. Once all of the parameters have been entered, you will see a screen similar to the one below: Machine name Machine description Net Plate Capacity Sample size Data Device type Measurement type Figure: Configured Administration home screen Let’s go through the step-by-step process of configuring Masterdata. Haldan MES ® User Manual Version 1.0 23 3.2. Plants The first step in the configuration process is to set up a plant name. This should be done clicking on the “Plants” icon on the administration menu: Once you click on this icon, you will see a drop down menu: Now, select “Add Plant”. This will bring up a pop-up window in the centre of your screen which looks like this: Fill in your company’s information in the spaces provided, and then click “Save”: You should now see your company’s name in the grey, left side pane on your screen. 3.3. Machine groups The next step is to set up the machine groups. This should be done by clicking on the “Machine Groups” icon on the administration menu: Once you click on this icon, you will see a drop down menu, where you must select “Add Group”: Haldan MES ® User Manual Version 1.0 24 CHAPTER 4: Shift Scheduler: The Shift Scheduler is developed to automatically change shifts in Shopfloor Data Collect (SDC). It allows you enter predefined shift schedules, including shift changes. This means that your OEE will be more accurate because it avoids a situation where an operator forgets to enter a shift change. Once you have started and logged onto Haldan MES®, you will be able to see the menu bar at the top of the screen. Ensure that you click on the “Shift Scheduler” tab so that you can configure and use Shift Scheduler. The figure below demonstrates this: Select “Shift Scheduler” Once you have completed the process of configuring the Shift Scheduler, you will see a screen similar to the one below: Task Bar View shifts in weekly or monthly layouts You are able to set different shift patterns to be colour coded Shift time slots List of different shift patterns This screen will allow you to not only view the shifts that are scheduled, but also to add and edit the shift patterns. To begin, the shifts need to be defined. This means, you must provide each shift type with a name and duration (in minutes). Let’s begin with the configuration process: 4.1. Configuration To do this, click on the “Shift Definitions” icon on the Task bar: Haldan MES ® User Manual Version 1.0 55 After this, a window will pop up, in which you can “Add” a block in which to type the name of the shift, and its corresponding length in time. The default shifts (Morning, Afternoon and Night) will already be preloaded onto the program. You should add all of the different types of shifts that occur at the company into this window, as shown in the figure on the next page: Once you have added all of the different types of shifts that may occur at different times, click “Close”. Each shift can now be added to any Shift Pattern you create. The next step is to add Shift Patterns that can be scheduled to run consistently over time. To do this, click on the “Shift Patterns” icon on the Task Bar: Haldan MES ® User Manual Version 1.0 56 Chapter 5: Using Shopfloor Data Collect (SDC): 5.1. Introduction Welcome to the training guide for the Shopfloor Data Collect (otherwise referred to as SDC). SDC has been developed to make OEE data collection easier and more accurate. It can be used on all production processes, whether on discreet production or continuous processes. Please note: This manual only covers the topics required to capture shift data. As each additional phase of the project is completed additional training on those aspects will be undertaken. 5.2. Accessing the SDC Desktop Shortcut To open the SDC, double click on the SDC shortcut on your desktop: The Home Screen The following information is represented on home screen: The machine name The current OEE of machine Current product running on machine Indication of missing information The task bar on the right of the home screen can be used to either minimise or close the SDC. Figure: SDC Home Screen 5.3. Navigating the SDC You can look at OEE details for each machine individually. You do this by clicking on one of the machine blocks (for example, ‘Turning Cell 5’ on the SDC home screen), and you will be taken to a screen that looks like this: Haldan MES ® User Manual Version 1.0 64 Cycle Time: Standard Cycle Time of selected product Unit Count: Green number reflects all good products produced and Red number total scrap captured on the shift. Timer: Current Time of the product Undefined Activities: the number of activity blocks that do not have a downtime code or product code captured. Activity Bar Figure: Machine home screen Timeline 5.3.1. Capturing a Product This is will be done at the beginning of a shift when the operator must select which product is going to be produced. By selecting the Production activity block, from the Activity Bar, the user will be presented with this screen: Figure: Activity page Here, the user will need to click on the grey page icon: It is situated next to the words “Activity: Production”, at the top left of the screen, as indicated by the light blue arrow above. Haldan MES ® User Manual Version 1.0 65 Chapter 6: Manual Collection of Data: In some instances, the operator manually records production and downtime on a paper time sheet. It is then necessary to input this information into the program so that the software can accurately calculate OEE percentages and trends for analysis. 6.1. OEE Work Centre Time Sheet The machine operators are in charge of manually capturing all activities on a time sheet. While some companies may choose to use their own time sheets, an example of a standard and very effective time sheet is the OEE Work Centre Time Sheet. The most important sections that need to be included in any manual data collection time sheet are highlighted below: Date Machine no. Total min Shift Runs Frequency Time sheet Totals Hourly Target and Actual JPH Scrap Figure: OEE Work Centre Time Sheet The following points apply to the information that must be entered on the sheet above: Machine No: Write the machine number or name Date: Write the date of production Shift: Tick Morning shift, Afternoon shift or Night shift Runs: Enter part number being produced (if two parts are produced, enter the second part number by Run2) Time sheet: Highlight the time period of the different activities that occurred during the shift. Each small rectangle represents a 5 minute time duration Haldan MES ® User Manual Version 1.0 74 Total Min: Write the total number of minutes in this column of each activity, in line with each activity type Frequency: Write the number of times each activity occurred during that shift, in line with each activity Totals: Write the totals for Total Min and Frequency Hourly Target and Actual JPH: Record hourly targets and the number of actual jobs per hour produced Scrap: Detail the number of good products and scrapped products The information captured on this OEE time sheet will be used to enter the shift information into the Haldan MES® program. An example of a completed OEE time sheet will look like the following: In the time sheet above, the following information has been added: Machine Name: Quas2 Morning Shift with Rudi as Supervisor Date: 14 October 2013 Products: Run 1 was S18-200.1950.00 and Run 2 was S81-200.2493.00 At 6:00am, there was a 10 minute meeting. Production on Run1 occurred from 06:11am until 10.00am At 10.01am, there was an Idle Break for half an hour, ending at 10:30am At 10:31am, production began again and continued until 11:00am when a Change Over occurred, which lasted for an hour and ten minutes until 12:10pm At 12:11pm, production began on Run 2 until the end of the shift at 13:45pm, when Housekeeping occurred until 14:00pm Total output for Run 1 was 212: including 205 good products and 7 scrapped for reason code S006 Haldan MES ® User Manual Version 1.0 75 Chapter 7: Data Analyser 7.1. Introduction Welcome to the training guide for the use of Data Analyser . Please note: This manual only covers the topics required to analyse data which was captured manually or through the use of ShopFloor Data Collect. As each additional phase of the project is completed, additional training on those aspects will be undertaken. If you are using a computer or device with a screen resolution of 1024x768 or lower, some icons and options may be condensed and will therefore look slightly different to the screenshots presented in this chapter. In this case, you will need to use the drop-down arrows provided under each icon. 7.2. Accessing the Haldan MES® To open the Haldan MES®, double click on the shortcut on your desktop. After doing this, you will be presented with the following screen: All users should have unique usernames and passwords. You must enter your unique username and password into the spaces, and then click on the “Login” button. Haldan MES ® User Manual Version 1.0 82 7.3. The Home Screen The default page for Haldan MES® reflects the shifts of past 24 hours. Please note that at the top of the page, the “Reports and Data Analysis” tab is selected. Filter Panel Shift Filter Run New Shift The following details are relevant to the above tags: Filter Panel: All Reports, Analysis and Trends can be filtered by machine group, machine, specific product, shift type or team. New Shift: This will be used to manually capture information. Run: Click on this icon to execute the report, data analysis or trend graph that you require. Shift Filter: The list of shifts can be filtered according to these headings. 7.4. Reports To view reports, use the list that appears down the left side of the screen, under Reports. Below is an explanation of each item on that list, and what each can be used for. 7.4.1. Period The Period Report provides an opportunity to analyse more than one machine over longer periods (for example, a week or a month). It also provides the user with a list and quantity of the products produced. To view a period report, click on the word “Period” from the list on the left side of the screen, and then click the “Run” icon. You will be presented with the following screen: Haldan MES ® User Manual Version 1.0 83 Chapter 8: Conclusion This manual is a guide to understanding the effect that Overall Equipment Effectiveness (OEE) has on productivity, and how you can use the Haldan MES® software to improve your companies OEE. Its includes instructions on how to use the software’s programs, such as Haldan MES and Shopfloor Data Collect. If you have any further questions regarding anything, do not hesitate to contact a Haldan Consulting: Physical Address: 81B Haupt Street Sidwell, 6061 Port Elizabeth, South Africa Postal Address: PO Box 14208, Sidwell, 6061 Port Elizabeth, South Africa Telephone: +27 (0)41 451 3825 Fax: +27 (0)41 453 1702 Email: [email protected] Website: www.haldanmes.com Haldan MES ® User Manual Version 1.0 102