1
TUGboat, Volume 34 (2013), No. 1
Entry-level MetaPost: On the grid
Mari Voipio
1
Running MetaPost
The basic method for running MetaPost is to create
a file with extension .mp and run MetaPost directly
on the command line: mpost yourfile.mp. In the .mp
file, the code for making graphics is enclosed within
beginfig ... endfig; the result is a PostScript file.
The file extension is the figure number. With this
example, the output would be a file yourfile.1.
beginfig (1) ;
% Draw a line
draw (1cm,2cm) -- (3cm,5cm) ;
endfig ;
end .
If you add outputformat:="svg"; at the very
beginning of the file, the output will be in SVG
format. However, the resulting file will still be named
yourfile.1; depending on your system, you may have
to rename it to yourfile.svg for it to be recognized.
Another method, available in any decent TEX
distribution, is to run MetaPost inside a ConTEXt
file. (I am a ConTEXt user, so I find it handiest to do
it this way.) The file extension is the usual .tex, and
the MetaPost code (the same MetaPost code as when
running standalone) is enclosed inside \startMPpage
... \stopMPpage. I run my files within an editor
with a menu command Typeset, but you can also
typeset the file on the command line with context
yourfile.tex.
\startMPpage
% Draw a line
draw (1cm,2cm) -- (3cm,5cm) ;
\stopMPpage
The output from ConTEXt is (by default) a PDF
file, yourfile.pdf. Graphics code can be included in
any .tex file; you can have text and MP code in one
and the same ConTEXt file.
2
Building up a graphic
To draw anything with MetaPost, you have to have
some kind of idea of where your drawings end up and
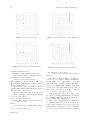
why. Everything is related to a base grid; it doesn’t
usually show, but in our examples here I’ve put a
grid in the background to help you figure out how to
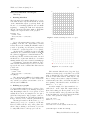
place objects in MetaPost. (A blank grid is shown
in fig. 1. We’ll see how to draw the grid itself later.)
The MP grid extends to all directions, e.g., coordinates (1, 2), (−1, 2), (−1, −2) and (1, −2) all exist.
However, I find it easiest to stay on the positive side
when coding a drawing or an element; objects can
be easily shifted later to their proper locations.
17
10
9
8
7
6
5
4
3
2
1
0
1
2
3
4
5
6
7
8
9
10
Figure 1: MetaPost drawings are made on a grid.
10
9
8
7
6
5
4
3
2
1
0
1
2
3
4
5
6
7
8
9
10
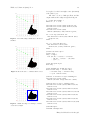
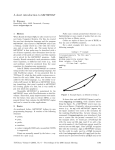
Figure 2: A red dot at the origin.
The basic unit of MetaPost is a “big point” (bp),
and that one is tiny (72 bp = 1 in). There are several
ways of changing the scale: in the examples below
we’ll use a user-defined unit u. That way we only
have to change u if we want to adapt the drawing to
a different size/scale. Here, we’ll define the unit u at
the beginning of the MetaPost file to fit TUGboat:
numeric u ;
u := .5cm ;
As a first example, let’s draw a small red dot —
a filled circle — at the origin. The output is in fig. 2.
(If we had nothing else in the picture, we’d get a
red dot in the middle of the page with some white
around and that’s it; our dot here isn’t in the middle
because of the grid in the background.)
% Set the scale
numeric u; u := .5cm ;
% Draw a red dot at origin
fill fullcircle scaled (1/5u) withcolor red ;
% Add whitespace around the drawing
Entry-level MetaPost: On the grid
18
TUGboat, Volume 34 (2013), No. 1
10
10
9
9
8
8
7
7
6
6
5
5
4
4
3
3
2
2
1
1
0
1
2
3
4
5
6
7
8
9
10
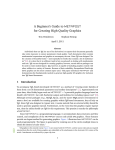
Figure 3: Add a blue dot at (3,5).
0
10
9
9
8
8
7
7
6
6
5
5
4
4
3
3
2
2
1
1
1
2
3
4
5
6
7
8
9
10
Figure 4: Add a green dot, off the integer grid.
setbounds currentpicture to
boundingbox currentpicture enlarged 1/2u ;
Next, let’s add another dot in blue at (3,5):
fill fullcircle scaled (1/5u)
shifted (3u,5u) withcolor blue ;
This command goes after the previous fill, above
the setbounds command (as do our subsequent additions). Output in fig. 3.
We don’t have to use whole numbers; MetaPost
is just as handy with decimals and fractions (fig. 4):
fill fullcircle scaled (1/5u)
shifted ((4u+1/8u),3.25u) withcolor green ;
When something is repeated at regular intervals,
a loop can be used (fig. 5):
for i = 6u step 1/2u until 10u :
draw fullcircle scaled (1/5u) shifted (8u,i)
withcolor red ;
endfor ;
We can change both coordinates inside one loop:
for i = 0 step 1/2u until 3u :
Mari Voipio
2
3
4
5
6
7
8
9
10
Figure 5: Add a vertical series of red dots with a loop.
10
0
1
0
1
2
3
4
5
6
7
8
9
10
Figure 6: Add a diagonal series of green dots.
draw fullcircle scaled (1/5u)
shifted (2*i,(-i+9u)) withcolor green ;
endfor ;
Lines and objects are drawn by connecting two
or more sets of coordinates. Either a straight line
(specified with --) or a curved line (..) is drawn
between the given coordinates. A line is turned into
a closed object with the final command cycle. Only
a closed object can be filled with colour! (See fig. 7.)
fill (5u,1u) -- (7u,5u) -- (7.5u,5u) .. (8u,3u)
.. (9u,3u) .. (7u,1/2u) .. cycle ;
In the next picture (fig. 8) these curve coordinates have been marked with small red dots. If you
are not familiar with Bezier curves, the behaviour of
the curved lines can be surprising.
A line or an object always has a bounding box,
a rectangular frame. MetaPost knows where the
corners of the bounding box are; in fig. 9, the box is
drawn as a line from corner to corner on the black
object (red dots are added later) and the dark blue
TUGboat, Volume 34 (2013), No. 1
19
dot is placed on the lower-right corner (lrcorner)
of the black object.
All of the code we’ve built up follows, and the
output without the background grid is in fig. 10.
10
9
8
7
% -- begin full example -numeric u ; u := .5cm ;
6
5
fill fullcircle scaled (1/5u) withcolor red ;
fill fullcircle scaled (1/5u) shifted (3u,5u)
withcolor blue ;
fill fullcircle scaled (1/5u)
shifted ((4u+1/8u),3.25u) withcolor green ;
4
3
2
1
0
1
2
3
4
5
6
7
8
9
10
Figure 7: Add a filled shape which uses both curves
and lines.
for i = 6u step 1/2u until 10u :
draw fullcircle scaled (1/5u) shifted (8u,i)
withcolor red ;
endfor ;
for i = 0 step 1/2u until 3u :
draw fullcircle scaled (1/5u)
shifted (2*i,(-i+9u)) withcolor green ;
endfor ;
10
9
8
% Define the black object
picture curvy ;
curvy := image (
fill (5u,1u) -- (7u,5u) -- (7.5u,5u)
.. (8u,3u) .. (9u,3u) .. (7u,1/2u)
.. cycle ; );
7
6
5
4
3
% Draw the black object
draw curvy ;
2
1
0
1
2
3
4
5
6
7
8
9
10
Figure 8: Show the curve coordinates with red dots.
% Add dot at lrcorner of object bounding box
fill fullcircle scaled (1/5u)
shifted (lrcorner curvy) withcolor 0.5blue;
10
9
8
7
6
5
4
3
2
1
0
% Draw bounding box around the object
draw llcorner curvy -- lrcorner curvy
-- urcorner curvy -- ulcorner curvy
-- cycle withcolor blue;
1
2
3
4
5
6
7
8
9
10
Figure 9: Outline the shape’s bounding box with a
dot at its lower-right.
% Add red dots at object ‘turning points’
fill fullcircle scaled (1/10u) shifted (5u,1u)
withcolor red;
fill fullcircle scaled (1/10u) shifted (7u,5u)
withcolor red;
fill fullcircle scaled (1/10u) shifted (7.5u,5u)
withcolor red;
fill fullcircle scaled (1/10u) shifted (8u,3u)
withcolor red;
fill fullcircle scaled (1/10u) shifted (9u,3u)
withcolor red;
fill fullcircle scaled (1/10u) shifted (7u,1/2u)
withcolor red;
% Add whitespace
setbounds currentpicture
Entry-level MetaPost: On the grid
20
TUGboat, Volume 34 (2013), No. 1
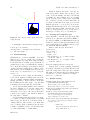
MetaPost draws items in the order they are
defined. If your file compiles, but you only get some
of the objects, the missing ones may be underneath
everything else. Our examples above are carefully
spread out so they don’t overlap, but if you play with
the coordinates, you may encounter this feature. If
you draw several items at the same spot, the first
(highest up) in the code is at the bottom in the
drawing and the last in the file is on top in the final
graphic; it may help to think of the lines and objects
as pieces of paper piled up on top of each other, so
the last piece ends up on top of everything else.
2.2
Figure 10: The complete example figure without the
background grid.
to boundingbox currentpicture enlarged 1/2cm ;
% Scale up to be readable
currentpicture := currentpicture xsized 6cm ;
% -- end full example --
2.1
Troubleshooting
With MetaPost — as well as with TEX — I’ve found
that it is a good idea to compile (typeset) the file
fairly frequently, especially when doing something
for the first time. I carefully “grow” my MetaPost
graphics stage by stage, very much like the examples
above. If my file suddenly stops working, I comment
out the newest lines (with %) and recompile to check
that I haven’t, say, accidentally deleted a semicolon
in the older code, and then proceed to debug the
newest code.
If your file doesn’t compile, the first thing to
look for is an omission: a missing semicolon at the
end of a command, a missing endfig/\stopMPpage,
missing parentheses. If the semicolon on the last
line is missing, the file will compile — but only until
something is added after that line, then it fails.
If you draw something with the fill command,
the item to fill must be a closed path, either a line/
curve closed with cycle, or a circle or square, e.g.
fullcircle. If you try to fill a non-cyclical path,
your file won’t compile because MetaPost hangs at
the “impossible” command.
If your drawing is tiny and needs lots of zooming
to be visible, you may be using MetaPost’s default
unit, the big point. Try the above-mentioned trick of
defining a unit u to suit your taste, or use units with
your coordinates. In the beginning I found it easiest
to think on a millimeter grid, so I defined lines with,
e.g., draw (8mm,20mm) -- (10mm,40mm);.
Mari Voipio
Drawing the background grid
I used Metafun to draw the gray grid in the illustrations above. Metafun comes with ConTEXt, so
if you have ConTEXt, your TEX installation already
includes it. Besides a plain grid, Metafun also supports creating slanted or logarithmic grids (see pages
213–214 in the Metafun manual).
First we define the grid, then draw it:
picture grid ;
grid := image (
width := 10 ;
height := 10 ;
draw vlingrid (0, 10, 1, width, height)
withcolor .8white ;
draw hlingrid (0, 10, 1, height, width)
withcolor .8white ;
) ;
draw grid withpen pencircle scaled 1/20 ;
I put the grid code in the beginning of my MetaPost file(s), and thus it gets drawn first and ends
up in the background, behind all other elements.
The numbers are standard labels, set with the label
("labelname", (x,y)) command. For example:
label ("1", (-1/4u,1u)) ;
2.3
Further reading
Metafun manual: http://www.pragma-ade.com/
general/manuals/metafun-p.pdf.
Many examples work in plain MetaPost.
More graphical than, e.g., the user’s manual.
MetaPost user’s manual: http://www.tug.org/docs/
metapost/mpman.pdf.
MetaPost, a very brief tutorial: http://www.
ursoswald.ch/metapost/tutorial.html.
A more traditional approach to MetaPost.
Click on filenames to get the code!
MetaPost home page: http://www.tug.org/metapost.
Lots of links to other tutorials, examples, articles,
packages, and more.
Mari Voipio
mari dot voipio (at) lucet dot fi
http://www.lucet.fi