Download SvanPC++ User Manual
Transcript
SvanPC++ software USER MANUAL Ver. 2.0 www.svantek.com TABLE OF CONTENTS 1 INTRODUCTION ........................................................................................................................................... 5 1.1 MAIN FEATURES ................................................................................................................................. 5 1.2 REQUIREMENTS .................................................................................................................................. 5 1.3 ABOUT THIS MANUAL......................................................................................................................... 5 2 SOFTWARE INSTALLATION .......................................................................................................................... 6 2.1 USB DRIVERS INSTALLATION .............................................................................................................. 6 2.2 SVAN PC++ INSTALLATION.................................................................................................................. 7 3 CONFIGURING INSTRUMENTS AND DOWNLOADING DATA ....................................................................... 8 3.1 CONNECTION MODES ......................................................................................................................... 8 3.1.1 USB CONNECTION ..................................................................................................................... 8 3.1.2 RS232 CONNECTION .................................................................................................................. 8 3.1.3 ADDITIONAL CONNECTION MODES........................................................................................... 8 3.2 DATA TRANSFER ................................................................................................................................. 9 3.2.1 DOWNLOADING FILES FROM INSTRUMENT .............................................................................. 9 3.2.2 SETTING REAL TIME CLOCK...................................................................................................... 10 3.2.3 MERGING FILES ........................................................................................................................ 11 3.2.4 CORRECTING DATE AND TIME ................................................................................................. 12 3.3 SETUP FILE EDITOR ...........................................................................................................................13 3.3.1 OPENING SETUP FILES ............................................................................................................. 13 3.3.2 SETUP FILE EDITOR VIEW MODES............................................................................................ 14 3.3.3 EDITING THE INSTRUMENT SETTINGS ..................................................................................... 16 3.3.4 MANAGING AND UPLOADING THE SETUP FILES ..................................................................... 18 3.4 INSTRUMENT WIZARD ......................................................................................................................18 3.5 SVAN PC++ FILE TYPES ......................................................................................................................21 4 DATA VISUALISATION AND PLAYBACK ......................................................................................................22 4.1 LOADING DATA AND BROWSING FILES ............................................................................................22 4.2 DATA VISUALISATION MODES ..........................................................................................................23 4.2.1 TABLE VIEW ............................................................................................................................. 23 4.2.2 PLOT VIEW ............................................................................................................................... 27 4.2.3 SPECTROGRAM VIEW .............................................................................................................. 34 4.2.4 TEXT VIEW................................................................................................................................ 35 4.3 DATA-SPECIFIC VIEW SUB-WINDOWS ..............................................................................................36 4.3.1 OPENING VIEW SUB-WINDOWS .............................................................................................. 36 4.3.2 VIEW SUB-WINDOWS TYPES ................................................................................................... 38 4.3.3 ARRANGING THE WORKING AREA........................................................................................... 46 4.4 VIEW CONFIGURATOR ......................................................................................................................48 4.5 AUDIO PLAYBACK..............................................................................................................................51 4.5.1 EVENTS NAVIGATOR ................................................................................................................ 52 4.5.2 WAVE NAVIGATOR .................................................................................................................. 53 5 POST-PROCESSING AND DATA ANALYSIS ..................................................................................................55 5.1 VIEWER MODULE POST-PROCESSING TOOLS ...................................................................................55 5.1.1 UNITS CONVERSION................................................................................................................. 55 5.1.2 ZOOM AND AGGREGATION ..................................................................................................... 56 5.1.3 MARKERS ................................................................................................................................. 58 5.1.4 ACCELERATION, VELOCITY AND DISPLACEMENT .................................................................... 62 © SVANTEK -1- SvanPC++ User Manual 5.1.5 SPECTRUM RECALCULATION ................................................................................................... 63 5.2 TOTAL RMS / LEQ AND CROSS-SPECTRA RECALCULATIONS.............................................................64 5.2.1 SVAN PC++ CALCULATOR TOOL ............................................................................................... 64 5.2.2 TOTAL RMS / LEQ..................................................................................................................... 65 5.2.3 CROSS-SPECTRA ....................................................................................................................... 66 5.2.4 VIEWING CALCULATED RESULTS ............................................................................................. 66 6 DATA EXPORT ............................................................................................................................................69 6.1 MICROSOFT EXCEL ............................................................................................................................69 6.2 MICROSOFT WORD ...........................................................................................................................71 6.3 CSV FORMAT.....................................................................................................................................73 6.4 ASCII EXPORT ....................................................................................................................................74 6.5 AUDIO EXPORT .................................................................................................................................75 6.5.1 EXPORTING LOGGER EVENTS .................................................................................................. 75 6.5.2 EXPORTING WAVE FILES .......................................................................................................... 76 6.6 USING THE CLIPBOARD .....................................................................................................................78 6.6.1 COPYING TABLE VIEW CONTENTS ........................................................................................... 78 6.6.2 COPYING TEXT VIEW CONTENTS ............................................................................................. 78 7 OTHER FEATURES ......................................................................................................................................80 7.1 TOOLBAR CUSTOMISATION ..............................................................................................................80 7.2 SV10x CALIBRATION .........................................................................................................................83 7.3 SHORTCUT KEYS................................................................................................................................84 7.4 ACCESSING ADDITIONAL MODULES .................................................................................................85 7.4.1 RC MODULE ACTIVATION ........................................................................................................ 85 7.4.2 HARDWARE DONGLES ............................................................................................................. 86 8 ENVIRONMENTAL MONITORING MODULE TOOLS ...................................................................................87 8.1 ENVIRONMENTAL CALCULATOR.......................................................................................................87 8.1.1 SPECIFIC NOISE ASSESSMENT .................................................................................................. 87 8.1.2 GENERAL NOISE ASSESSMENT ................................................................................................. 89 8.1.3 VIBRATION MEASUREMENTS BASED CALCULATIONS ............................................................. 95 8.2 OTHER FEATURES .............................................................................................................................98 8.2.1 DATA MANAGEMENT WITH THE USE OF PROJECTS................................................................ 98 8.2.2 USING MARKERS WITH ENVIRONMENTAL NOISE DATA ......................................................... 98 8.2.3 BLOCKS/MARKERS GENERATOR ............................................................................................ 100 9 SVAN PC++ CALCULATOR ........................................................................................................................105 9.1 USING THE CALCULATOR DIALOG BOX...........................................................................................106 9.1.1 CHANNELS AND PROFILES ..................................................................................................... 107 9.1.2 PARAMETERS ......................................................................................................................... 107 9.2 SPECIFYING THE CALCULATION PERIODS .......................................................................................108 10 SVAN PC++ PROJECTS ..............................................................................................................................111 10.1 CREATING PROJECTS.......................................................................................................................111 10.2 USING THE PROJECT BROWSER ......................................................................................................112 10.2.1 PROJECT OBJECTS .............................................................................................................. 113 10.2.2 PROJECT SESSIONS............................................................................................................. 115 10.2.3 PROJECT REPORTS ............................................................................................................. 117 10.3 PROJECTS TOOLBAR........................................................................................................................119 10.4 REPORT TEMPLATES .......................................................................................................................123 10.4.1 CREATING TEMPLATES....................................................................................................... 123 10.4.2 EDITING TEMPLATES .......................................................................................................... 123 © SVANTEK -2- SvanPC++ User Manual 10.4.3 GENERATING REPORTS FROM TEMPLATES ....................................................................... 131 10.4.4 PREDEFINED REPORT TEMPLATES ..................................................................................... 134 10.5 DATA SEARCH .................................................................................................................................136 10.5.1 TAGS .................................................................................................................................. 136 10.5.2 PERFORMING DATA SEARCH ............................................................................................. 138 10.6 OTHER FEATURES OF THE SVAN PROJECTS ....................................................................................141 10.6.1 MULTI-SOURCE SESSIONS.................................................................................................. 141 10.6.2 SAVING CALCULATOR SETTINGS ........................................................................................ 144 10.6.3 USER FUNCTION WIZARD .................................................................................................. 146 10.6.4 EDITING LOGGER CONTENTS ............................................................................................. 150 11 REMOTE COMMUNICATION MODULE ....................................................................................................152 11.1 REMOTE CONNECTION ...................................................................................................................152 MANUAL CONFIGURATION OF CONNECTION SETTINGS................................................... 152 11.1.1 11.1.2 INTERNET CONNECTION TYPES ......................................................................................... 154 11.1.3 REMOTE CONNECTION WIZARD ........................................................................................ 158 11.2 INSTRUMENT MANAGEMENT AND CONFIGURATION ...................................................................160 11.2.1 REMOTE COMMUNICATION CENTER ................................................................................ 160 11.2.2 STATION CONFIGURATION ................................................................................................ 162 11.3 DATA ACQUISITION METHODS .......................................................................................................165 11.3.1 LIVE RESULTS ..................................................................................................................... 166 11.3.2 AUTOMATIC FILES DOWNLOAD ........................................................................................ 168 11.3.3 CONTINUOUS LOGGER DOWNLOAD ................................................................................. 173 11.3.4 REMOTE SESSION .............................................................................................................. 178 11.4 ONLINE DATA EXPORT ....................................................................................................................184 11.4.1 HTML PUBLISHING ............................................................................................................. 184 11.4.2 FTP UPLOAD....................................................................................................................... 186 11.4.3 DRAWING ONLINE CHARTS ............................................................................................... 187 11.5 SVAN RC SERVICE ............................................................................................................................188 11.6 OTHER FEATURES OF THE RC MODULE ..........................................................................................189 11.6.1 ALERTING ........................................................................................................................... 189 11.6.2 SVAN PC++ TRAY ICON....................................................................................................... 192 11.6.3 RC TROUBLESHOOTING TOOL ........................................................................................... 193 11.6.4 DYNAMIC DATA APPENDING ............................................................................................. 194 11.6.5 RC SETTINGS IN MAIN OPTIONS ........................................................................................ 195 11.7 NEW FUNCTIONALITIES IN RC MODULE .........................................................................................197 11.7.1 CHANGES SINCE SVANPC++ 1.6.1 ...................................................................................... 197 11.7.2 UPDATING FROM EARLIER VERSIONS OF SVANPC++ ........................................................ 198 12 BUILDING ACOUSTIC MODULE ................................................................................................................200 12.1 CALCULATION OF REVERBERATION TIME ......................................................................................200 12.1.1 LOGGER OCTAVE TIME INTERSECTION VIEW .................................................................... 200 12.1.2 CALCULATION METHODS AND PARAMETERS ................................................................... 201 12.1.3 RT60 VIEW ......................................................................................................................... 203 12.1.4 RT60 RESULTS DETAILED REVIEW AND MANUAL CALCULATION ...................................... 204 12.2 BUILDING ACOUSTIC PROJECTS ......................................................................................................207 12.2.1 STARTING A BUILDING ACOUSTIC PROJECT ...................................................................... 207 12.2.2 BUILDING ACOUSTIC REPORT TEMPLATES ........................................................................ 208 12.3 SOUND INSULATION WIZARD .........................................................................................................209 12.3.1 DEFINING ROOMS AND PARTITIONS ................................................................................. 210 12.3.2 SELECTION OF SOUND INSULATION TYPE ......................................................................... 211 12.3.3 ASSIGNING MEASUREMENT FILES ..................................................................................... 212 12.3.4 AUTOMATIC CALCULATION OF REVERBERATION TIME .................................................... 213 © SVANTEK -3- SvanPC++ User Manual 12.3.5 CALCULATION OF INSULATION .......................................................................................... 214 12.3.6 REPORTING ON INSULATION CALCULATION RESULTS ...................................................... 218 12.4 BUILDING ACOUSTIC TOOLBAR ......................................................................................................218 INDEX ..............................................................................................................................................................220 © SVANTEK -4- SvanPC++ User Manual 1 INTRODUCTION SvanPC++ software is dedicated for SVAN 95x/97x and SV 10x instruments series. However, it can be also used with old SVAN 94x instrument series if the most recent firmware version is installed in particular instrument. The SvanPC++ program is a sophisticated tool which extends the functionality of the mentioned instrument series. The SvanPC++ Viewer (base) module is available for all users free of charge. Other modules (e.g. REMOTE COMMUNICATION, BUILDING ACOUSTICS) are optional and have to be purchased. 1.1 MAIN FEATURES Downloading measurement results from instruments to PC Data files storage and management in project documents Visualisation of data and instrument settings during measurements Adjusting the instrument settings (wizard and editor modes) Easy direct data export to commonly used applications Data post-processing (e.g. spectra comparison, time-history recalculation) Support for all new SVAN instruments RS 232 and USB interfaces compatible 1.2 REQUIREMENTS MS Windows XP / VISTA / 7 / 8 1.3 ABOUT THIS MANUAL This manual’s structure is designed to show the ways of using the software to: 1. connect and configure Svan instruments, 2. download measurement data, 3. visualise data and playback, 4. post-process and analyse data, 5. data export for reporting. The newest version of this manual in PDF format is available to download on the Svantek website: www.svantek.com. Further information on the SvanPC++ program can be found in the HTML version of the help, available after pressing the F1 button. The structure of the HTML help corresponds to the structure of the program, with detailed descriptions of particular elements of the SvanPC++ graphical user interface, such as menus, dialog boxes etc. 2 SOFTWARE INSTALLATION 2.1 USB DRIVERS INSTALLATION USB drivers installation package can be found at the CD received on purchase of an instrument or it can be downloaded from www.svantek.com (path: SUPPORT - DRIVERS / SOFTWARE - USB DRIVERS). Please follow the installation instructions. To complete the USB drivers installation user should connect the instrument after system reboot and select automatic USB driver installation. It may be necessary to repeat the last step for all USB ports. Important: Installation of USB drivers requires the user to have administrator privileges. © SVANTEK -6- SvanPC++ User Manual 2.2 SVAN PC++ INSTALLATION SvanPC++ software installation can be initiated using provided CD or by downloading the installer file from www.svantek.com (path: PRODUCTS / SOFTWARE / SvanPC++). Please follow the installation instructions. Fig.2-1. SvanPC++ software installer. You will be asked whether to install SvanPC++ for yourself, or for anyone who uses this computer. The choice determines the area in which SvanPC++ settings and shortcuts are stored and hence its availability to users sharing the workstation. © SVANTEK -7- SvanPC++ User Manual 3 CONFIGURING INSTRUMENTS AND DOWNLOADING DATA 3.1 CONNECTION MODES SvanPC++ supports USB and RS232 interfaces for direct communication. Configuration of each interface is different. More remote communication modes are supported as an optional feature, available after purchasing the relevant SvanPC++ module (RC Module). 3.1.1 USB CONNECTION Using the USB interface requires appropriate drivers being installed (see Chapter 2.1: USB Drivers Installation). SvanPC++ will automatically detect instruments plugged-in by USB. 3.1.2 RS232 CONNECTION Configuration of RS232 interface can be done using the RS232 Settings command from SVAN menu. This will activate the RS232 Settings dialog box. It enables to configure the connection parameters and options. Note: Baud Rate must be the same in the SvanPC++ application and in the instrument. After setting RS232 options press the OK button to save changes, Cancel to discard changes or Default to set default values for each parameter. When you attempt to connect a SVAN device to your computer via Bluetooth, two new COM ports will appear. To successfully communicate with the instrument, you have to select the output port. 3.1.3 ADDITIONAL CONNECTION MODES To communicate with instruments using GPRS and Internet connection, you have to purchase the SvanPC++ Remote Communication Module. Multiple advanced tools for data acquisition are also provided with this module. © SVANTEK -8- SvanPC++ User Manual 3.2 DATA TRANSFER 3.2.1 DOWNLOADING FILES FROM INSTRUMENT To download data from a SVAN instrument using SvanPC++ software, you have to do the following: 1. Connect the instrument to the PC. 2. Switch on the instrument. 3. Launch SvanPC++. 4. Manage the files transfer with the use of the SVAN Files dialog box. The SVAN Files dialog box can be opened through the Instrument Wizard (see Chapter 3.4: Instrument Wizard). You can also use the SVAN Files command in the SVAN menu or press the button on the Toolbar. Source selection Display filter buttons Destination selection Files list (Device) Files list (Local) Fig.3-1a. SVAN Files dialog box. To download files in the SVAN Files dialog box, you have to do the following: Select the device from which you want to download files (if multiple devices are connected), as well as the memory type and sub-catalogue used as the source (if multiple sources are supported). Important: Changing the viewed directory in a SVAN 979 instrument to Internal memory also causes to change the instrument’s working catalogue (where the data is being saved) to internal memory (see Fig.3-1b). Select the transfer destination (a local PC / LAN folder or a Svan Project file) and the local destination folder. © SVANTEK -9- SvanPC++ User Manual Select the files to download from the device’s files list and copy them to the target location using the button, or copy only the new files using the button. Fig.3-1b. Changing the viewed catalogue in case of a SVAN 979 instrument to Internal memory also affects its working catalogue. You can use the Results, Logger, Setup, Wave and Other buttons in the Display filter panel to choose the file types to be displayed on the lists. The SVAN Files dialog box is presented in Fig.3-1a. More detailed information on how to use this dialog box can be found in the SvanPC++ HTML help (path: Dialog boxes and sub-windows / SVAN Files dialog box). Note: Uploading files to devices configured for storing on a USB disk is not possible. The exception is SVAN 979, where it is possible to upload files to the SD card or pendrive, if the working catalogue is accordingly configured. 3.2.2 SETTING REAL TIME CLOCK In order to set the Real Time Clock in the instrument the user has to click on the button. The current date and time will be transferred from PC to the connected instrument. “RTC updated” message will appear on the screen. It is also possible to manually set date and time. To do so, press the arrow button next to the Set RTC button and enter the date and time in the Customize RTC dialog box. © SVANTEK - 10 - SvanPC++ User Manual Fig.3-2. Customize RTC button and dialog box. 3.2.3 MERGING FILES Merging files means creating one file (called multifile) from multiple measurement results files. The merging is usually performed on results of measurements in different time moments, leading to a file containing a finite range of the time domain, analogous to a Logger results file. You can merge files when downloading them from measurer in the SVAN Files dialog box. To do so, the following actions are necessary: Select the files you wish to merge on the device’s files list. Toggle the Merge button in the Download type panel. Press the Download selected files button. Files created as an effect of merging downloaded measurement results are automatically given a name of Multifile (1), Multifile (2) etc. Merging result files In case of result files, multifiles are created by appending to a file several other files. In case settings in merged files do not match, after opening such multifile in SvanPC++ an additional list will appear on the files list toolbar where the files with various settings are grouped and can be browsed, as shown in Fig.3-3. However, integration period and calibration factors values may be ignored in that case, according to settings in the Main Options dialog box (path: Tools / Main Options / Multifiles). Fig.3-3. Files list toolbar containing groups of files in a multifile with different measurement settings. © SVANTEK - 11 - SvanPC++ User Manual It is also possible to merge files which are already downloaded. For merging files in a local directory, you have to do the following: Open the files you wish to merge with the use of the File open dialog box (activated with the button on the toolbar or with the Open command from the File menu). When multiple files are selected to open, the Multiple Selection dialog box will appear. To create a multifile, press Merge. Note: The Merge & Open option has the same effect as Merge, but the created multifile will be also automatically opened in SvanPC++. Fig.3-4. Merging files in the Multiple Selection dialog box. In case of a multifile in which files with different settings are merged, data displayed in views of the Merged type are divided into groups corresponding to particular settings, whereas in the Multifile view settings of the measuring instrument are not taken into account; data available in all merged files can be displayed together, ordered only according to channels and profiles. This view is useful in case a change of little significance was done in the instrument setup during measurement. Merging logger files Logger files can also be merged; it is done in a different way than in case of result files. Logger files need to have identical parameters and the should not overlapse in time. They are merged into one file by taking the results of measurement performed least recently and adding subsequent results up until the most recent ones. Pauses are included in the fragments of the time domain for which results are not defined in the merged files. Only the header of the least recent file is kept. Headers of all other files are removed. 3.2.4 CORRECTING DATE AND TIME Since version 2.1.0 of the SvanPC++ software it is possible to correct the date and time of measurement start in files downloaded from Svantek instruments. In order to save a file with different date and time than that set by the instrument, use the Export » Export with corrected date & time... command in the File menu. In the dialog box that appears, specify the desired date and time and press OK. You will then be able to specify a new location and name for the file with corrected date and time. © SVANTEK - 12 - SvanPC++ User Manual Fig.3-5 Correcting the measurement date and time in downloaded files. 3.3 SETUP FILE EDITOR The Setup File Editor is a SvanPC++ extension that gives its users an easy access to SVAN instruments’ setup files. Thanks to the clear visualization, similar to the menu displayed by the instruments, the user may configure the instruments’ settings in a quick and efficient way and upload them to the instrument. The configured settings can be saved in external .svt files for a possible future reference. 3.3.1 OPENING SETUP FILES The Setup File Editor works in the section of SvanPC++ responsible for the communication between the instrument and computer. The program uses setup files that can already be found in the instrument. That is why before any modification is done to a setup file, it needs to be downloaded first. For details on downloading files from the instrument, see Chapter 3.2: Data Transfer. In order to edit a setup file (.svt), you need to select it in the files list of the SVAN Files dialog box and press the Setup file editor button, located in the top right corner of the window, as shown in © SVANTEK - 13 - SvanPC++ User Manual Fig.3-6. You can also double click on a setup file. In this case, a temporary file on a local drive will be first created, and then opened in the Setup file editor. 2 1 Fig.3-6. Opening .svt files with the Setup file editor. The file format is automatically checked during opening. In case of incompatibility, an error will be reported. Otherwise a new window will be opened, containing the SVAN instrument’s settings in a configuration similar to its internal menu structures. 3.3.2 SETUP FILE EDITOR VIEW MODES In the Setup file editor, you can choose one of three view modes – Tree, List and Wizards View. To select the most convenient, press the corresponding button. Fig.3-7. Setup file editor view modes buttons. The default, Tree View, is presented in Fig.3-8. It offers the settings arranged in a form of a tree, resembling structure of settings in SVAN instruments. Names in capitals only denote menu tabs, while the others – particular settings. The settings are sorted in accordance to menu structures accessible through display panels of the instrument. © SVANTEK - 14 - SvanPC++ User Manual Fig.3-8. Instrument settings presented in Tree View in the Setup file editor. The List View is presented in Fig.3-9. It shows settings (and only settings, not menu tabs) in the form of a list, containing names of the settings and their current values. The settings are sorted in alphabetical order and any changes made to the settings are automatically updated in the list. Fig.3-9. Instrument settings presented in List View in the Setup file editor. The Wizards View contains a list of general areas of the instrument settings that can be customized, as presented in Fig.3-10. It enables to configure the instrument settings in a simplified way. To do so, select the area you wish to customize (e.g. Auto-Save, Basic Settings) and follow the steps supported by the program. The Cancel Wizard button enables to quit the current Wizard without applying the changes made with it. © SVANTEK - 15 - SvanPC++ User Manual Fig.3-10. Instrument settings presented in Wizards View in the Setup file editor. 3.3.3 EDITING THE INSTRUMENT SETTINGS By selecting a particular setting in any of the three view modes (e.g. Measurement Mode), the user gains the access to a related group of controls visible in the top right corner of the window (Fig.3-11). These controls enable viewing and editing the selected setting. Settings configuration controls Fig.3-11. Controls for viewing and editing the instrument settings in the Setup file editor (here: check-box-type controls) © SVANTEK - 16 - SvanPC++ User Manual Depending on the selected setting following controls are available: text control – permits editing settings that contain a plain text – user inputs the setting value directly from keyboard (e.g. Server Address or SMS Text for Wireless Communication) scrollable combo box - user modifies the setting value by selecting the desired option from a list supported by the instrument (e.g. Measurement Mode or Integration Time). check-boxes – ticking the checkbox activates or deactivates the function (e.g. Logger results). Some settings are related to each other. It means that one works only when the other is set to a certain value. For example, the Auto Save option is available only if Integration Time value is equal or bigger than 10 seconds (unless the repetition cycle is equal to 1). If settings of related options are not corresponding, the setup is not available for editing. In the mentioned example, the Auto Save will not be possible to edit if the Integration Time is set to 9 seconds or less. When lack of correspondence occurs, the editor asks for confirmation. When user chooses to continue the change in spite of the incorrespondence the related setting will be set to a value which will not cause any discrepancy (default). Fig.3-12. Confirmation box – the user has selected to change Integration Time to 5 seconds, while Auto Save is set to ON. In our example, during any attempt to change the Integration Time to a value lower than 10 seconds when Auto Save is on, the module will ask for confirmation. If user proceeds, the Auto Save function will be switched off. © SVANTEK - 17 - SvanPC++ User Manual 3.3.4 MANAGING AND UPLOADING THE SETUP FILES The Setup filename field, located in the top right corner of the window, allows to change the original filename. This filename is the one seen by the device after the file is uploaded to its internal flash memory. Changing this filename allows to store numerous setup files in the device with different filenames. Note: Uploading a setup file with a filename which already exists will overwrite the old setup file. The filename is limited to 8 characters. Buttons, placed in the bottom of the window, are responsible for the file management: Print and Print to file – allow the user to output the data into either printer or a text file. For both of these options, the data will be arranged in a way similar to the List View, alphabetically, with corresponding values right next to it. The list will have an added label with the type of the instrument for which the setup file has been prepared for. Finally, the data will be sent to either printer (through Printer dialog) or written into selected file in simple text format. Open file – loads a selected local file to the Setup file editor, allowing the user to modify it. Save file – saves the currently opened setup file to a selected local file. Upload setup – clicking this button will upload the file with current settings to the connected Svan instrument. Upload setup and activate – clicking this button triggers a similar procedure as above, but additionally sends to the instrument a command to load the settings from the uploaded file. During the upload, the device type and software version are compared with the file's information and any incompatibilities are reported. If the uploaded file’s software version is different from the instrument’s, the Setup file editor will offer either aborting or upgrading (or downgrading) the file to the format accepted by the device. If multiple devices are connected, the selector in the bottom of the window enables to choose the device for the upload. 3.4 INSTRUMENT WIZARD The Instrument Wizard provides an easy access to various features of SvanPC++, concerning a connected device. It is opened automatically every time when the software detects connection with a Svan instrument for which the Wizard is available. Most Svantek instruments are currently supported by the Instrument Wizard, excluding only the SVAN 94x series and the SVAN 912AE instrument. Note: To disable the automatic opening of the Instrument wizard, uncheck the Show wizard when connecting an instrument control via Main options / Instrument autodetection. You can also manually show / hide the Instrument Wizard window, using the Instrument Wizard command in the View menu or the © SVANTEK icon on the Toolbar. - 18 - SvanPC++ User Manual Fig.3-13. The Instrument Wizard dialog box for SVAN 956. Depending on the instrument connected, there are various buttons available in the Instrument Wizard window, as listed in Table 3-1. © SVANTEK - 19 - SvanPC++ User Manual Table 3-1. Buttons available in the Instrument Wizard. Button Function synchronizes the connected instrument's real time clock with the real time on the PC. opens the SV100/101 Calibration dialog box. compares the firmware version installed on the device with the latest version available. opens the SV100/101 Options configurator window. opens the Remote Communication Center window. opens the Connection configuration wizard window. opens the Setup file editor window. opens the SVAN Files dialog box. Note: The Check for Updates button serves only to search for newer versions of firmware. However, it is not possible to download new firmware using the Instrument Wizard. For more information on the Instrument wizard, please refer to SV 100 / 102 or other relevant instrument's quick start guide available on the SVANTEK Website: www.svantek.com. © SVANTEK - 20 - SvanPC++ User Manual 3.5 SVAN PC++ FILE TYPES Since the release of the SV 979 measurer, files downloaded from the Svan instruments may have various extensions in order to achieve a better distinction of the file contents. All SvanPC++ file types are listed in Table 3-2. Table 3-2. SvanPC++ file types. Icon – – © SVANTEK Extension Description .svn Files created in devices older than SV 979 and multifiles generated with the use of the SvanPC+X software. .svl Logger files or files of new format, containing both time history and summary results. (They can be generated by e.g. SV 103, SVAN 971, and SVAN 977 instruments.) .svt Instruments’ setup files. .svr Results files. .svs Station wizard settings (RC) files. .srt Real-time analysis results files. .sts SvanPC++ application settings files. .svp Svan Project files. .svu User files, such as e.g. functions generated using the User Function Wizard. .svmt Files containing Measurement tracking data, generated using the SvanMobile Android app. - 21 - SvanPC++ User Manual 4 DATA VISUALISATION AND PLAYBACK The base module of the SvanPC++ software suite – Viewer – enables to visualise the measurement results downloaded from the Svan instruments. 4.1 LOADING DATA AND BROWSING FILES After downloading a data file (see Chapter 3.2.1: Downloading Files from Instrument) you can open it directly from the SVAN Files dialog box by simply clicking twice on its name in the files list. This will cause the SVAN Files dialog box to close and the selected file will be opened in the Viewer module. It is also possible to open files downloaded earlier, which are stored in the PC. To do so, press the button or use the Open command from the File menu and find the desired file using the File open dialog box. It is possible to open multiple files in the Viewer module simultaneously. To choose between the opened files you can use the Files list toolbar, located in the top-left corner of the SvanPC++ window, below the Main toolbar. Fig.4-1. Files list toolbar. To expand the list of currently opened files, click on the mark. To select the file you wish to work with, click on its name on the list. To close a file, select its name on the list and press the Close file button. You can decide whether to show or hide the Files list toolbar, using the Files List command in the View menu. It is also possible to change the location of the Files list toolbar. To do so, click somewhere in its area with the left mouse button and drag it without releasing to the desired location. © SVANTEK - 22 - SvanPC++ User Manual 4.2 DATA VISUALISATION MODES The SvanPC++ Viewer module enables to visualise the data in one of four different modes: Table View, Plot View, Spectrogram View, Text View. You can choose between different view modes to find an optimal form for reading and analysing data. To switch the views, you can use the corresponding buttons on the View Toolbar (located at the top of each view sub-window) or the corresponding commands in the View menu, as shown in Fig.4-2. Table Plot Spectrogram Text Available view modes Fig.4-2. Controls for switching the view modes in the View Toolbar (left) and in the View menu (right). The availability of the view modes depends on the type of currently active data. For example, Header information data can be only viewed in the Table or Text mode, while results of measurements in the time domain can be viewed as a Table or Plot, but neither can be presented as a Spectrogram. If a view form is available for the currently active data, its icon is drawn in colors instead of grayscale. Each of the view modes has its own tools which serve to customise the way data is displayed in order to achieve a desired form of visualisation. Features of particular view modes are described in Chapters 4.2.1–4.2.4. 4.2.1 TABLE VIEW In the Table View, numeric and text data are displayed in the form of a table. This mode is used for viewing the Header information as well as measurement results such as Main results, Statistics, Logger results etc. in numeric form. © SVANTEK - 23 - SvanPC++ User Manual Fig.4-3. An example of the Table View. Normal / Transposed view In general, when the Normal view is set, the table rows contain different time samples while columns contain results of different measurements or calculations. Switching to the Transposed view sets the inverse configuration. The Transposed view is particularly useful if you need to view many variables in few points of time. To enable the Transposed view you can do one of the following: Click on the button. Use the Table view pulldown menu, available from the Main toolbar. Use the Table view command from the View menu. Copying with headers The Copy with headers tool is available via Edit menu or from the pulldown menu opened by clicking with the right mouse button. It copies the selected data to the clipboard together with describing it headers from above and left-hand side of the selection. © SVANTEK - 24 - SvanPC++ User Manual Fig.4-4 The Copy with headers tool. Cell types There are different types of cells in the table: Cells with gray background contain headers, describing the current data, which will be copied when you use the Copy with headers tool. Cells with yellow background also contain descriptions for the data values, but they are not copied by the Copy with headers tool. Cells with white background contain the data values. Adjusting the view To configure the way data is displayed in the Table view, you can use the following buttons: Table Font Size (on the Main Toolbar) – sets the size of the text displayed in the table. AutoSize Columns (on the View Toolbar) – sets the column widths equal the longest text string. Configuration of the Table view settings is also available in the Table View tab of the Main Options dialog box. You can open the Main Options dialog box using the button on the Main toolbar or the Main Options command from the Tools menu. This tab is composed of 3 panels: The Font and colors panel enables to configure the way text is displayed in the Table view. To select the text font press the Choose button. A font selection window will appear, allowing to © SVANTEK - 25 - SvanPC++ User Manual set the font you prefer. To select the text color, press the color button. A color choice window will appear allowing to select the preferred color. The Display panel enables to configure the way functions are displayed in the Table view when viewing multiple functions of different steps. The continuously repeating values option causes the fields where the values are not defined, because a function has a greater step than other displayed functions, to be filled with the last available value. The show single value at start time of greater step option causes to display values only at the beginning of a greater step, leaving the other fields empty. The Marker set of values panel enables to configure the way markers are displayed in the Table view. Markers contain ranges of the time domain specified by the user or created automatically. They can be displayed in the Table view as a function. You can select the value displayed in the table corresponding to data contained / not contained in the marker (Existence value / Not existence value). Units conversion You can easily convert the unit of displayed results in terms of the power prefix using the menu opened by clicking with the right mouse button on the header of a column in the normal view, or of a row in the transposed view. Fig.4-5 Converting the units in a Table view. Limiting the time domain The Limit time domain to tool enables to display only a limited range of the time domain, specified by a selected function or marker. In order to enable this option, you have to select the desired function / marker in the View configurator and press the Limit time domain button. In order to remove the limit, press the Clear time domain limit button. In Fig.4-6 the time domain is limited to the range of Marker 1. More detailed information about the View configurator can be found in Chapter 4.4: View configurator. © SVANTEK - 26 - SvanPC++ User Manual 2 1 Fig.4-6. Limiting the time domain. 4.2.2 PLOT VIEW In the Plot view, parameters measured in the time or frequency domain, such as e.g. Logger results or 1/3 Octave, are presented in the form of a 2D plot. Fig.4-7. An example of the Plot view. To scroll the view along an axis, you can: use the green sliders, click with the left mouse button on the axis and move the mouse without releasing. To scale an axis, click on it with the right mouse button and move the mouse without releasing. Window configuration The Plot view window is composed of 3 parts (Fig.4-8): Central part – the plot together with the axes and additional controls, © SVANTEK - 27 - SvanPC++ User Manual Upper part – a table containing information about the active function, the secondary y-axis etc., Lower part – a table containing the positions of cursors and selections as well as a list of results of measurements and calculations. You can show or hide the particular parts, using the buttons, located at the left side of the window. You can also use the Plot view pulldown menu or press the between 3 available modes: Normal – all parts visible; Data and results (Maximize data) – upper part hidden; Only data – only the middle part visible. button to switch Upper part (additional information) Show / hide upper part Central part (plot) Show / hide lower part Lower part (selections and results lists) Fig.4-8. Parts of the Plot view window. Contents of the plot view All the functions displayed on the plot are listed in the table in the lower part of the Plot view window. After clicking on a function name in the list, its representation in the plot area becomes highlighted so you can easily recognize it when many functions are plotted at once. The / buttons serve for showing / hiding the functions. Color used for plotting a function can be selected by clicking on the square located next to the function’s name. The contents of the table below the plot can be customized using the context menu, opened by clicking with the right mouse button anywhere in the table area. The menu contains the following commands: Set font... – enables one to select the font used in the table below the plot, Autosize columns [off / fit in window / fit in column] – enables one to automatically adjust the table columns’ width: the ‘fit in window’ option causes the columns to fill the whole width of © SVANTEK - 28 - SvanPC++ User Manual the panel, while the ‘fit in column’ resizes the columns to fit exactly the width of the contained text. Anytime you manually resize a column, the ‘Autosize off’ option becomes automatically selected. Show start / stop / duration – enables one to show or hide the columns of the table representative of the information about the time ranges specified by block and cursor selections and markers. Show whole data / inside blocks / outside blocks / individual blocks – enables one to show or hide the rows of the table representative of various ranges of the time domain: ‘whole data’ corresponds to all the available time history, ‘inside blocks’ correspond to the accumulated ranges of all block selections, ‘outside blocks’ correspond to the ranges of all the fragments of the time domain which are not included in block selections, and ‘individual blocks’ correspond to separate block selections, displayed individually (as Block 1, Block 2 etc.). Fig.4-9 Customizing the contents of the table below the plot. You can also choose the currently active function, used to define the primary y-axis and the main cursor domain, as well as the parameter to be represented on the secondary y-axis, using the Active function selector and the Secondary y-axis selector, located in the upper part of a plot view. © SVANTEK - 29 - SvanPC++ User Manual Primary y-axis selector Secondary y-axis selector List of displayed functions Fig.4-10 Elements of interface related to configuring the contents of a Plot view. Note: Some functionalities of the table below the plot are only available after activating the Environmental Monitoring module. Graphic options The graphic options such as the backgroud color and the style of grid lines of a particular, currently opened Plot view can be configured using the Local Plot Settings dialog box, opened with the Local Plot Settings command, available in the View menu and in the pulldown menu opened by clicking in the plot area with the right mouse button. Similar options, but concerning all plot views in SvanPC++, can be configured using the Graph View options in the Main Options. You can also specify the way functions are drawn on the plot using the Drawing mode buttons / located on the left side of the window. / Axis auto scaling The Y-axis auto scaling tool serves to automatically scale the y-axis to make the function values fill the plot area. To enable the Y-axis auto scaling, use the / buttons, located at the left-hand side of the Plot view window. Analogously, the X-axis auto scaling tool serves to automatically increase or decrease the number of pixels per sample to make all samples visible in the whole plot area. If displaying 1 pixel / sample is still insufficient for the current number of samples and window size to view all the data, the algorithm applies aggregation by time of minimum sufficient level (X-axis auto-scaling does not apply aggregation by frequency). To enable the X-axis auto scaling, use the / buttons, located at the left-hand side of the Plot view window. You can also automatically scale the x-axis so that only a selected interval of time is displayed using the ‘Auto scale x settings’ dialog box, accessed by selecting the ‘Auto scale x settings...’ command in the context menu opened by clicking with the right mouse button anywhere in the © SVANTEK - 30 - SvanPC++ User Manual plot area. It also allows for expanding the range of measurement results in order for the x-axis to start at a selected hour. Fig.4-11 The Auto scale x settings. Another method of automatic scaling of the x-axis is available by clicking with the right mouse button in the plot area and selecting the ‘Auto scale x to selection’ command, which scales the xaxis according to the current block selection. The displayed range of the time history may contain unselected fragments if the block selection is non-continuous. Fig.4-12 Auto-scaling the x axis to a selected range of the time history. Note: If you scroll or scale an axis when the corresponding auto-scaling tool is enabled, it will be automatically disabled. © SVANTEK - 31 - SvanPC++ User Manual Selection of data To select data, you can use the cursors or block selections. Each cursor allows to select one element of the data at once, while blocks enable the selection of multiple elements at once. Main cursor When you open a window with the plot view, only the Main cursor is present. You can set its position by clicking in the plot area, by using the left and right arrow keys or by using the buttons located in the upper part of the SvanPC++ window. You can also switch the Main cursor off, clicking on the icon next to its name in the table below the plot. When passive, the cursor's icon turns to . By default, the current position of the Main cursor is marked on the plot with a vertical line in inverted background color. #1 and #2 cursors There are two additional cursors available, called Block cursor #1 and #2. You can set their positions by clicking somewhere in the plot area with the right mouse button and choosing the Put #1 or Put #2 command in the pulldown menu, or by pressing CTRL+1 or CTRL+2 keys. The selected cursor position is then set at the current position of the Main cursor. By default, the positions of the additional cursors are marked on the plot with vertical lines in inverted background color with numbers written next to them. You can clear the selections of additional cursors by clicking on the icons next to their names in the table below the plot. Block selections To set a block selection you have to click in the plot area and drag the mouse without releasing until all the elements you need are selected. When you select two different blocks, the selections will be added (previous selections are not removed). The selected area is represented with a gray background. To deselect blocks, click on the icons next to their names in the table below the plot, or click in the plot area with the right mouse button and choose the Deselect block(s) option. You can deselect the current (last selected) block or all blocks at once. You can also invert the block selection. Choosing this option removes the current selection and selects all the remaining data in the file. Additional features The #1 and #2 cursors can be used for precise selection of blocks. When both block cursors are located on the plot: o Pressing ENTER will create a new block selection between the two block cursors; o Pressing ESC will deselect the part of a block selection from between the cursors (if the area between the cursors contains a fragment of a block). When you click on a block with the main cursor, the slider in the table below the plot will be moved automatically to the field containing the range of the selected block. Note: This feature can be disabled in the Local plot settings dialog box. Pressing ESC if the #1 and #2 cursors are not placed will remove a block selection containing the Main cursor. If the Main cursor is not located within any blocks, pressing ESC will remove all the selections (you will be asked for confirmation). The selected data is listed in the table in the lower left corner of the Plot view window (it is not visible if you select the Only Data mode). In case of the cursors, the point of their position is given. © SVANTEK - 32 - SvanPC++ User Manual In case of block selections, the points of begin and end of all separate blocks are given. The Main cursor position is also marked below the X-axis of the plot. Additional cursors Block selection Main cursor Fig.4-13. Types of data selection in the Plot view. The selected data is listed in the table in the lower left corner of the plot view window (not visible if you select the Only Data mode). In case of the cursors, the point of their position is given. In case of block selections, the points of begin and end of all separate blocks are given.In case of the cursors, the point of their position is given in the “Start” column. In case of block selections, the points of begin and end of all separate blocks are given in the “Start” and “Stop” columns. For each cursor and block selection, these points can be edited by entering the time values manually after double-clicking corresponding fields of the above mentioned columns. Fig.4-14 Manually editing the position / range of selections in plot views. Note: In order for the “Start” and “Stop” columns to be shown, corresponding options have to be enabled in the table’s context menu; for details, see this topic. With the Environmental Monitoring module activated you can also generate block selections according to complex criteria using the Blocks/markers generator. For details, see Section 8.2.3. © SVANTEK - 33 - SvanPC++ User Manual 4.2.3 SPECTROGRAM VIEW The Spectrogram can be used to show the 3D variation of time, frequency and amplitude on a 2D plot. The x-axis represents the time domain, the y-axis represents the frequency domain and the color variation shows the amplitude domain of the currently selected function. The time scale is linear while the frequency scale is logarithmic. The range of the color scale is shown down the right hand side of the plot area. Fig.4-15. An example of the Spectrogram view. To scroll the time axis you can use the green slider above the spectrogram area, or click on the axis below the spectrogram area with the left mouse button and move the mouse without releasing. In contrary to the Plot view, axis scaling is not available in the Spectrogram view. The configuration of the Spectrogram view window is analogous to the Plot view window; for details, see Chapter 4.2.2: Plot view. Adjusting the view You can choose the parameter visualised on the spectrogram by using the Active function selector in the upper part of the Spectrogram view window. This selector is visible only in the Normal mode, it is hidden in Data and Results and Only Data modes. The selected function defines the values on the z-axis. Fig.4-16. The Active function selector. The Auto-scale z tool serves to scale the z-axis to fit the range of currently displayed data. When browsing the time domain, the scale will be modified automatically. When you disable the Autoscale z option, the scale will remain unchanged. © SVANTEK - 34 - SvanPC++ User Manual Fig.4-17. The Auto-scale z control in the View Toolbar. You can modify the profile of the z-axis to set the optimal contrast for the range of data that you need. To do so, click on the color bar representing the z-axis, on the right side of the Spectrogram view window. Then click on one of the displayed squares to move the range in which the chosen color will be displayed. You can set 4 points of the profile to adjust the color dynamics as needed. Modifying the color profile does not change the scale of the z-axis. Fig.4-18. Examples of z-axis color profiles in the Spectrogram view. Selection of data A point of the spectrogram can be selected with the use of the Main cursor. To select a point, simply click somewhere in the spectrogram area. You can also modify the position of the cursor using the arrow keys and the buttons above the Spectrogram view window. The current position of the Main cursor is represented as the point of crossing of grey lines, drawn in the spectrogram area. The table below the spectrogram area describe the position of the Main cursor in the time and frequency domains, as well as the results value in the selected point. You can hide / show the Main cursor clicking on the below the spectrogram area. / icon next to its name in the table 4.2.4 TEXT VIEW The Text view can be used for viewing the Header information and measurement results in the text form. Data is presented as simple text with additional descriptions (if available). The text can be copied with the use of the pulldown menu, opened by clicking with the right mouse button, or with the relevant Edit menu commands. © SVANTEK - 35 - SvanPC++ User Manual Fig.4-19. An example of the Text view. 4.3 DATA-SPECIFIC VIEW SUB-WINDOWS 4.3.1 OPENING VIEW SUB-WINDOWS After opening a file, downloaded from a Svan instrument or stored on the PC, a View sub-window is opened automatically. It is displayed in the working area of the SvanPC++ window, as shown in Fig.4-20a. © SVANTEK - 36 - SvanPC++ User Manual Navigator bar Minimize, maximize, close the sub-window View sub-window Fig.4-20a. A View sub-window and related controls. Close Restore Restore Minimize Maximize Close Fig.4-20b. A minimized View sub-window. Fig.4-20c. Buttons for minimizing, restoring and closing of a maximized View sub-window. To move a sub-window, click on its title bar with the left mouse button and move the mouse without releasing within the working area. To minimize a sub-window, press the button. A minimized sub-window is automatically located in the lower-left corner of the working area, as shown in Fig.4-20b. © SVANTEK - 37 - SvanPC++ User Manual To maximize a sub-window, press the button. A maximized sub-window fills the whole working area, hiding all other sub-windows. When a sub-window is maximized, the Minimize / Restore / Close buttons are moved to the SvanPC++ menu bar, as shown in Fig.4-20c. To close a sub-window, press the button. Depending on the type of the loaded data, there are various views available. You can open multiple views from one file simultaneously, e.g. a Header Information View, containing information about the device and measurement, or a FFT Spectrum View, containing results of FFT measurements. To display a desired view, use the buttons located on the Navigator bar (see Fig.4-20a). The icons on the buttons correspond to the particular types of data, represented by the views. You can also choose the type of View sub-window displayed automatically when a file is opened. By default, Header information is always displayed first. To configure the priority of opening the View sub-windows, open the Main options dialog box by using the command in the Tools menu and go to the Views tab. button or the Main options Fig.4-21. The View sub-windows Opening priority settings in the Main Options dialog box. The type of data which is defined as #1 will be opened with the highest priority. If it is not available in the current file, the type of data defined as #2 will be opened if available, and so on. If none of the data specified in the Opening priority list is available, no View sub-window will be opened automatically. You can then open a desired view using the Navigator bar. 4.3.2 VIEW SUB-WINDOWS TYPES Depending on the type of data displayed, various View sub-windows are characterised by different features. For particular types of sub-windows different view modes (see Chapter 4.2: Data visualisation modes) are available, e.g. Header info can be viewed as a table or in text form, but cannot be viewed on a plot or spectrogram. If a particular view mode is available, the corresponding icon on the Main toolbar is drawn in colors. © SVANTEK - 38 - SvanPC++ User Manual The View sub-windows types can be grouped into several categories, each with specific tools and features, as described below. Header information This type of view contains basic information about the opened file, such as the device used for measurement, the instrument settings, name of the file etc. It can be viewed in Table view or Text view. This data is available in each .svn file and by default, this is the View sub-window displayed automatically when a file is opened. Main results This type of view contains the results of a single measurement, together with some additional information such as the instrument settings or time elapsed during measurement. It is advised to view the Main results as a transposed table. The transposition can be easily done by clicking on the button when the Table view is already active. For details, see Chapter 4.2.1: Table View. Spectral results This type of view contains the results of measurements in the frequency domain, concerning the 1/1 Octave, 1/3 Octave and FFT measurements. They can be viewed in a Plot view or in a Table view. Logger / merged results Files containing results of measurements in multiple points of time can be obtained in two ways: downloading results of a Logger-type measurement from instrument, merging several files containing single results. This first type of data is displayed as Logger results, the other as Merged results. Both these types of data present the time history of measurement and can be viewed in analogous ways, in a Plot view or in a Table view. Using the button, you can open a logger file associated with the open result file, or a result file corresponding to the current record time in the open logger file. If the active file is a results file with header indicating the associated logger filename, pressing this button will attempt to open the logger file from the same directory. If the button is marked grey , it means that there is no connected logger file, as stated in the Associated file name field of the Header. If the active file is a logger file which contains a Filename marker (Autosave option in 95X single channel instruments), pressing this button will search for a results file of specified filename, corresponding to the measurement time specified by the current position of the main cursor, in the same directory in which the logger file is stored. © SVANTEK - 39 - SvanPC++ User Manual If the active file is a logger file which contains Wave markers, after pressing this button SvanPC++ will look for the .WAV file which corresponds to the time point currently selected by the main cursor in the same directory in which the logger file is stored. If such file is found, it is opened and the cursor is moved to the same place as selected in the logger view. Note: If file of appropriate name is not found, the directory is searched again in order to find a .WAV file with matching measurement time and instrument parameters, such as type and serial number. Fig.4-22. Opening the Logger file associated to a Result file. Multifile (merged with different settings) The Multifile view serves for displaying (in a single table) data coming from result files generated with different settings of the measuring instrument. This view is therefore available only for multifiles in which such files have been merged. Note: In this view values are always displayed in logarithmic scale (in dB). In case of a multifile in which files with different settings are merged, data displayed in other views of Merged type are divided into groups corresponding to particular settings. In the Multifile view, settings of the measuring instrument are not taken into account; data available in all merged files can be displayed together, ordered only according to channels and profiles. This is useful in case a change of little significance was done in the instrument setup during measurement. © SVANTEK - 40 - SvanPC++ User Manual Logger / Merged spectral results Logger and Merged results can also be obtained in case of spectral measurements. The name of such a view contains then the type of data (Logger or Merged) and the type of measurement (1/1 Octave, 1/3 Octave or FFT), e.g. Logger FFT view. These types of data can be viewed in a Table view, Plot view, as well as a Spectrogram view. Further description of the Spectrogram view can be found in Chapter 4.2.3: Spectrogram View. While working in a Plot view, the spectrum is displayed in a selected point of time. The history of the spectrum can be browsed using the buttons located on the View Toolbar, below the Navigator bar, as shown in Fig.4-23. Scroll to the beginning Current position Previous sample Scroll to the end Next sample Fig.4-23. View Toolbar buttons serving to browse the history of measured spectra. Statistics The Statistics view may be available both for Main results files and Logger files after necessary calculations. Statistical data can be presented in two different modes: Histogram or LN. By default, Histogram is initially presented. To switch the presentation mode, the selector located on the View Toolbar can be used (Fig.4-24). © SVANTEK - 41 - SvanPC++ User Manual Presentation mode selector Fig.4-24. Selection of data presentation mode in the Statistics view. The Statistics view may also concern spectral results, such as the 1/3 Octave statistic view and 1/1 Octave statistic view. While viewing this type of data in the Histogram / LN presentation mode, the statistics are displayed for a selected frequency. To select the displayed frequency value, use the buttons, located on the View Toolbar. / In case of the spectral statistics, another presentation mode, called LN(f), is available. In this mode, the spectrum is displayed for a selected statistical level. The for the selection of the statistical level. © SVANTEK - 42 - / buttons serve then SvanPC++ User Manual Data presentation mode Current frequency Frequency selection Fig.4-25a. Viewing the Statistics for spectral data in Histogram or LN mode. Data presentation mode Current statistical level Level selection Fig.4-25b. Viewing the Statistics for spectral data in LN(f) mode. © SVANTEK - 43 - SvanPC++ User Manual Time intersection The Time Intersection view is available in case of spectral data, containing measurement results in multiple points of time, such as Logger / Merged 1/1 Octave, 1/3 Octave or FFT results. It can be recognized by “TSect” added to the name of the view. This type of view allows to display data corresponding to one particular value of frequency, as a function of time. The displayed frequency can be selected using the the View Toolbar. / buttons, located on In case of the Time Intersection views, the Data Smoothing tool is available. You can enable / disable it using the Smoothing is ON / OFF button, located next to the frequency selection buttons. Configuration of the data smoothing settings is available in the RT60 tab of the Main Options dialog box. It is possible to configure: the size of the sample set used for smoothing, the response time value used for background detection in RT60 calculations. This view is particularly useful for the Building Acoustics module users. Note: Selecting a point of the time domain in the Time intersection view will automatically change the time point displayed in the corresponding spectral Logger / Merged view. Logger / Merged combined results Some types of results cannot be presented on a plot. The Combined results view enables to display all available results gathered togerher in the Table mode. It is useful if various types of measurements have been performed in the Logger mode or if various types of results have been merged in a Multifile, e.g. PEAK, MIN, MAX, P-P results together with METEO results. Marked periods Totals This type of view is available only for functions recalculated with the Total values parameter set in the Calculator tool (in contrary to Running values). This view can be displayed only in the Table mode. When a function with Total values is viewed in a Table view of type other than Marked periods Totals, its values are repeated in multiple rows that belong to the same calculation period. The repeated values are marked with grey background. However, in the Marked periods Totals view you can view all these functions with their values displayed only once for each period, together with information about the period’s start time, duration and name. In addition, the Marked periods Totals view allows to sort the displayed periods by start time or by name. To do so, click with the right mouse button and in the pulldown menu choose the Sort by start time or Sort by name command. © SVANTEK - 44 - SvanPC++ User Manual In the Marked periods Totals view it is possible to display results in Cumulated view. Cumulation can be performed on results, functions, or both. You can switch the mode in the Marked periods Totals window's View Toolbar. Fig.4-26. Switching the mode of displaying the Marked periods Totals view with the use of the View Toolbar. Cumulation of results causes the following effects: Functions calculated on block selections or markers without the Cumulate results parameter are not displayed. Functions calculated on block selections or markers with the Cumulate results parameter are displayed in one line in which the start time of the first period and the combined duration of all periods are given in the Start time and Duration columns. For interval calculations, the Start time value equals the start of the interval. The Duration column contains then information about the interval length; all functions calculated with the same interval start time and length are displayed in the same row. For the Ltm5 function, the start time and duration values are displayed according to the selection instead of the resulting values, so it can be contained in the same row with the other functions calculated on the given selection. Cumulation of functions causes all the calculated functions of the same type to be displayed in one column. It is useful when e.g. SEL is calculated for two types of events, denoted with two different markers; after the cumulation of functions, results of all calculations of SEL will be displayed in a single column. It is possible to enable cumulation of results and functions at the same time. Cumulate results on Cumulate results off Fig.4-27a. An example of Marked periods Totals in Standard view. Fig.4-27b. An example of Marked periods Totals in Cumulated view. © SVANTEK - 45 - SvanPC++ User Manual Wave results This type of view enables to display audio data in .wav format. It can be viewed in Table or Plot mode. When such a view is opened, the Wave Navigator window is automatically activated. For details, see Chapter 4.5: Audio Playback. Other views There are several types of View sub-windows representing results of special types of measurement, such as: LN, Tonality, Loudness, Meteorological or RT60 measurements. These views do not have any special features and can be displayed in Table or Text mode. 4.3.3 ARRANGING THE WORKING AREA When multiple views of several documents are opened simultaneously in the SvanPC++ application, the particular sub-windows can be arranged in the working area in various ways. You can use the Window menu commands listed in Table 4-1. to obtain the optimal arrangement. Fig.4-28. Window menu commands. © SVANTEK - 46 - SvanPC++ User Manual Table 4-1. Window menu commands serving for arrangement of sub-windows. Command Function New Window Creates a new window with the same data as the currently active window. Cascade Arranges windows in an overlapped fashion. Tile Horizontally Causes the currently opened windows to fill the whole working area, tiled horizontally without overlapping. Tile Vertically Causes the currently opened windows to fill the whole working area, tiled vertically without overlapping. Arrange Icons Arranges only the minimized sub-windows in the lower-left corner of the working area. Auto arrange Arranges windows automatically to use all free space of the screen. When the Auto arrange tool is enabled, / icons appear in the topright corner of each sub-window. They can be used to lock the visibilty of particular sub-windows. When the icon is in position, it will remain visible when a new sub-window is opened. Common results window Displays the results / functions table, usually presented below the plot in the Plot view window, as a separate window. Comparison windows 1, 2, ... © SVANTEK Opens the Logger or Frequency results comparison window, which enables to compare the values of two or more functions in a table. To use this tool (Fig.4-29): 1. Select the functions you wish to compare in the functions list. 2. Press the right mouse button and in the pulldown menu select the Add selected functions to comparison window command. 3. The function values are available to compare in the table. Separate comparison windows are opened for Logger- and Frequencytype functions. Allows to select the active sub-window from the list of all currently opened sub-windows. - 47 - SvanPC++ User Manual 3 1 2 Fig.4-29. Using the Results comparison window. 4.4 VIEW CONFIGURATOR The View Configurator enables to select results displayed in a Table, Plot or Text view. To show or hide it, use the button, located on the View Toolbar (located at the top of each view subwindow), or the View Configurator command in the View menu. It can also be hidden using the Hide button in the upper-right corner of the View Configurator sub-window. © SVANTEK - 48 - SvanPC++ User Manual View configurator Fig.4-30 Selecting results displayed in a view with the use of the View configurator. There are two methods of selecting multiple objects simultaneously: Selecting an object with the CTRL button pressed will cause the selection of all available objects of the same type, e.g. selecting the Time history MIN results in Profile 1 will also cause the selection of Time history MIN results in other profiles, as well as Summary MIN results in all profiles. Selecting one object, and then selecting another object in the same subtree with the SHIFT button pressed will cause the selection of all objects in the subtree that are displayed between the two objects. These two methods are illustrated in Fig.4-31. 1 Selecting this 3 object... ...also causes the selection of objects between them. Selecting this object with the CTRL button pressed... 2 ...also causes the selection of this object and all other objects of the same type. a) Using the CTRL button (or with the Lock results option on) ...and then selecting this object with the SHIFT button pressed... b) Using the SHIFT button Fig.4-31 Methods for the selection of multiple objects simultaneously in the View Configurator. © SVANTEK - 49 - SvanPC++ User Manual Note: The same effect as using the CTRL button can also be obtained by turning on the Lock results option in the Options menu. By default, the View Configurator is presented in the tree structure (Channel » Profile » Function). By activating the Options » Flat view command, you can view the configurator as a plain list, not representing the structure of data. This also enables to select all the available data at once by selecting the Flat results checkbox. Check to select all available data Fig.4-32b. The View Configurator’s list in Flat view mode. Fig.4-32a. The View Configurator’s list in Tree view mode. It is possible to save the View Configurator’s settings for later use. The settings are saved in a package including: selection of data to be displayed, colors of the plots. To save the current configuration, use the Save button, located above the list of available results. All saved settings are listed in the box above that button. They can be loaded by selecting one of them or deleted using the Delete button, located next to the Save button (Fig.4-33 and 4-34). © SVANTEK - 50 - SvanPC++ User Manual Fig.4-33 Buttons for saving and deleting View Configurator settings. Fig.4-34 List box for loading View Configurator settings. Note: The Limit time domain tool, accessible via the View configurator, enables one to display a selected range of data in the Table view. It is described in Section 4.2.1. 4.5 AUDIO PLAYBACK The audio playback in SvanPC++ comprises two main aspects: Logger events playback, WAVE files support. The SvanPC++ tools which allow for playback are the Events Navigator and the Wave Navigator. It is possible to choose the device for audio stream playback as well as the buffer length. To do so, open the Main Options dialog box using the Tools » Main Options command or the the Main toolbar and go to the Audio Playback section. © SVANTEK - 51 - button on SvanPC++ User Manual Fig.4-35. Audio playback settings in the Main Options dialog box. 4.5.1 EVENTS NAVIGATOR The Events Navigator appears on top of the View configurator when a file with one or more audio events (e.g. recorded during measurement by an SV 104 instrument) is opened. It consists of a set of buttons which allow for managing the playback of the attached audio data. The functions of these buttons are described in Table 4-2. Events Navigator Fig.4-36 The View Configurator with the Events Navigator. © SVANTEK - 52 - SvanPC++ User Manual Table 4-2 Buttons of the Events Navigator. Icon Function Play event Pause/resume event Stop event Jump to previous event (press this button and CTRL simultaneously to jump to first event) Jump to next event (press this button and CTRL simultaneously to jump to last event) Show options (described below) Several options are available for the Events Navigator after pressing the Show options button: The Maximum Level slider allows for setting the audio signal boost level. 0 dB leaves the signal at its original level. The Automatic Gain Control tool serves to automatically adjust the signal boost. With this option enabled, fragments of audio data will be constantly analysed in order to maximize the signal dynamics, given the Maximum Level slide bar is left at 0 dB. The length of analysed fragments can be specified in Main Options » Audio Playback » Buffer Length. The minimum value of the Maximum Level parameter depends on signal bit depth, e.g. 144 dB for 24 bit, 96 dB for 16 bit. Differences below 12 dB between subsequent fragments of audio data will not affect the boost level. The algorithm is designed to reduce the boost level faster than when increasing it, so that sudden loudness is avoided. The Play event from beginning option alters the behaviour of the Play button, automatically moving the Main cursor to the beginning of current event before starting playback. The Synchronize All Views option allows for simultaneous movement of the data selection tools in all views which contain the audio record (comprising the Main cursor in case of Plot view and the selection bar in case of Table view). If the Play all events option is enabled, after reaching the end of an event, playback will automatically continue from the beginning of the next event. Otherwise it will stop. 4.5.2 WAVE NAVIGATOR The Wave Navigator appears on top of the View configurator in Wave Results views, available when a .WAV file is opened. It consists of a set of buttons which allow for managing audio playback. The functions of these buttons are described in Table 4-3. © SVANTEK - 53 - SvanPC++ User Manual Wave Navigator Fig.4-37 The View Configurator with the Wave Navigator. Table 4-3. The Wave Navigator’s buttons. Icon Function Start playback of .WAV file Pause/resume playback Stop playback Show options (described below) Several options are available for the Wave Navigator after pressing the Show options button: The Maximum Level slider allows for setting the audio signal boost level. 0 dB leaves the signal at its original level. The Automatic Gain Control tool serves to automatically adjust the signal boost. With this option enabled, fragments of audio data will be constantly analysed in order to maximize the signal dynamics, given the Maximum Level slide bar is left at 0 dB. The length of analysed fragments can be specified in Main Options » Audio Playback » Buffer Length. The minimum value of the Maximum Level parameter depends on signal bit depth, e.g. 144 dB for 24 bit, 96 dB for 16 bit. Differences below 12 dB between subsequent fragments of audio data will not affect the boost level. The algorithm is designed to reduce the boost level faster than when increasing it, so that sudden loudness is avoided. The Mix to mono option allows for mixing the signal from all channels to be played equally in all output channels. The Loop playback option causes the .WAV file to be played from the beginning again when the end of file is reached. © SVANTEK - 54 - SvanPC++ User Manual 5 POST-PROCESSING AND DATA ANALYSIS ‘ Except of the tools for data visualisation and playback described in Chapter 4, the base Viewer module of the SvanPC++ software suite offers several ways of data post-processing, such as: Units conversion, Data aggregation by time and frequency, Using markers for selection of data, Recalculation of various VLM parameters, Conversion of the spectral data domain. In addition, some features of the Calculator tool are available in the basic SvanPC++ module, such as: Total LEQ and Total RMS recalculation, Transfer function and coherence recalculation with cross spectrum result files. More data analysis-related tools are available after purchasing an additional module of SvanPC++, such as e.g. the Environmental Monitoring module. 5.1 VIEWER MODULE POST-PROCESSING TOOLS 5.1.1 UNITS CONVERSION While visualising the data in the Viewer module, you can easily recalculate logarithmic to linear and linear to logarithmic units. In case of VLM results, it is also possible to display the values in linear non-metric units. The available units are shown in Table 5-1. Table 5-1. Units for displaying SLM and VLM results available in SvanPC++. VLM results SLM results Acceleration Velocity Displacement Logarithmic [dB] [dB] [dB] [dB] Linear [Pa] [m/s2] [m/s] [m] Linear non-metric - [g] [ips] [mil] To select the units for sound level results you can use the pulldown menu available in View menu » SLM Units. To switch between the units, you can also press the © SVANTEK - 55 - button on the Main toolbar. SvanPC++ User Manual Analogously, to select the units for vibration level values, go to View » VLM Units. Pressing the button will also switch between the available units. 5.1.2 ZOOM AND AGGREGATION The Zoom serves to adjust the amount of displayed data. In case of Plot views, this concerns manipulating the number of pixels per sample. In case of Table views, increasing the zoom from the original level cannot affect the way data is displayed. However, in each display mode, the zoom can be reduced in reference to the original level, meaning that multiple samples are represented by one pixel or cell. This requires the application of data aggregation algorithms. The so-called aggregation degree denotes the number of data represented by one element (sample in a plot / cell in a table). Note: It is possible to display more than one pixel per sample with aggregation degree higher than one at the same time. To reduce / increase the aggregation degree, use the / buttons located on the Toolbar. In case a Plot view is currently active and aggregation is not applied, using these buttons you can increase / decrease the number of pixels per sample. You can set the aggregation degree manually using the Set aggregation level command from the pulldown menu, opened by clicking on the button next to the Zoom Plus / Minus buttons. The aggregation degree can be then entered in the Set aggregation level dialog box. The maximum value of the aggregation degree equals the number of samples in the current data. Fig.5-1 Setting the aggregation level manually. Another possibility is to set the aggregation degree by time interval. The degree will automatically be set to a value for which a single element (a pixel or a cell) will correspond to a selected time interval. For example, for measurement results in which each datum corresponds to measurement time of 1 second, selecting the aggregation time interval as 1 minute will set the aggregation degree to 60. © SVANTEK - 56 - SvanPC++ User Manual Fig.5-2 Setting the aggregation level by time interval. Using the same pulldown menu you can also decide whether aggregation should be applied to the time or frequency domain, if it is available in the currently viewed data. Aggregation can be applied to the currently viewed panel only (if ‘Apply time aggregation to active view only’ is checked), or to each panel generated using the same data as the currently viewed one (otherwise). Aggregation algorithms The value of an aggregated sample is calculated using the set of original samples according to a formula selected on the basis of the function type: Maximum value – functions: MAX, PEAK, MAX(MAX), MAX(PEAK), LMAX Minimum value – functions: MIN, LMIN Root mean square – functions: RMS, LEQ, Lden, Ldn, Ld, Le, Ln, SEL, VEC, Ltm3, Ltm5 4-degree generalized mean – function: VDV Maximum modulus value, keeping the original sign – function: WAVE. All the calculations used for aggregation are executed on linear values. In the aggregated data, the aggregated sample time is equal to the time of the last sample in the block for which the aggregation was calculated. © SVANTEK - 57 - SvanPC++ User Manual Setting an aggregation level affects all the views of the current data, except of Marked Periods Totals. The aggregation is performed conforming to the following rules: Aggregation is always executed on the basis of the whole time domain in the file and the least common multiple of the data / pauses length (for multifiles, at least 1s), or the logger step (for logger, at least 2ms). The lengths of non-continuities in the logger are mathematically rounded to the length of the logger step. The selection of blocks, in the configurator and the time domain limit tool do not affect the aggregation. When you use the Toolbar buttons, the aggregation degree is modified according to the relation between the least step in the file and the least step currently displayed, so that the changes are effective for the displayed function of the least step. Results shown in the table and on the plot are identical. When the step is reduced for the function after aggregation, a warning message box will appear during every consecutive redrawing. You can turn this messages off by checking the control signed "Do not show this in the future". You can turn it back on using the Activate all warnings command. Calculator actions are always executed on non-aggregated data even if the current view represents data after aggregation. Sometimes the results of calculations cannot be presented in aggregated mode. The maximum available aggregation degree depends on the number of samples. 5.1.3 MARKERS Markers can be used as a tool for data classification in the Viewer module. They constitute binary functions defined in the time domain. A marker denotes a certain range of data, specified automatically or selected by the user. They can be stored in a file by a Svan instrument, or created in the SvanPC++ software. Note: This tool is especially useful and applicable in the Plot view mode. However, markers can also be used in the other modes, e.g. for time domain limiting in the Table view. For details on visualisation modes in SvanPC++, see Chapter 4.2: Data Visualisation Modes. Creating markers Markers divide into two types: Block markers, Point markers. The block markers contain a finite range of data, while point markers only contain one sample. To create a block marker: 1. Define a data block selection in the plot area, simply dragging the mouse with left button pressed. © SVANTEK - 58 - SvanPC++ User Manual Note: A block marker does not have to be continuous, i.e. it can be composed of several separate ranges. 2. Press the right mouse button to open a pulldown menu. 3. In the menu, select Edit markers » Use selected blocks » New marker. 4. Specify the desired name and color for the new marker in the Create New Marker dialog box. 1 4 2 3 Fig.5-3. Creating a block marker. While creating point markers, instead of making block selections in the plot area you only have to place the Main cursor at the desired location (simply clicking with the left mouse button). The rest of the process is analogous to the creation of block markers, the only difference being the path in the pulldown menu: Edit markers » Point marker » New marker. Note: With the Environmental Monitoring module activated, you can also create markers according to complex criteria using the Blocks/markers generator (for details, see Section 8.2.3). Markers visualization Markers are visible in the Plot view as horizontal lines below the plot area, above the x-axis. In case of point markers, semi-transparent vertical lines are also drawn. Each marker has its own color, chosen during its creation. The created markers are listed in the table below the plot. To show or hide markers, click on the / icons, located next to their names on the list. Note: In case the Show individual blocks option is enabled (cf. Section 4.2.2, paragraph Contents of the plot), all the separate ranges of block markers are also listed in the table. In that case you can © SVANTEK - 59 - SvanPC++ User Manual use the buttons to remove ranges from markers. To show/hide separate ranges of a marker, double click on its name. Point marker Block marker Click to hide/show markers on the plot Click to remove individual blocks from marker Fig.5-4. Visualization of markers in the Plot view. In the Table view, markers are considered as one of the functions available for displaying. You can select the values displayed in the table for data contained / not contained within the range of a marker using the Table view options in the Main Options. Editing markers To modify the ranges of markers, you can use the pulldown menu opened by clicking with the right mouse button somewhere in a plot area, when working with a Plot view. Following commands are available: Edit markers » Use selected blocks » Add selection – adds the current block selection to a chosen marker. Edit markers » Use selected blocks » Remove selection – subtracts the current block selection from a chosen marker. Edit markers » Point marker » Add cursor position – adds the sample at the current position of the Main cursor to a chosen marker. Edit markers » Point marker » Remove cursor position – subtracts the sample at the current position of the Main cursor from a chosen marker. Edit markers » Delete marker – deletes a chosen block or point marker. Every time you modify or delete a marker, the Choose marker window will appear. It serves for selecting the marker you wish to modify or delete. You can select multiple markers, clicking on their names with CTRL pressed. You can also select several successive markers, clicking on the first one and then the last one with SHIFT pressed. © SVANTEK - 60 - SvanPC++ User Manual Fig.5-5. The Choose Marker dialog box. A marker need not be continuous—it can be composed of several disconnected continuous fragments. Such an individual fragment is called a ‘range’ of the marker. Note: A group of ranges can be selected in order to perform some operations on several markers simultaneously. To select/deselect a range, click on it of them with the SHIFT button pressed. You can also use the Add/remove marker range to/from selection to select/deselect ranges. Selected ranges are drawn in black. You can easily modify ranges in the following ways: Clicking with the left mouse button in the middle of a range and moving the mouse without releasing will move the selected range within the time domain. When the mouse is in a position allowing for moving a range, the marker’s name and the number of the range is displayed (Fig.5-6a). Note: If multiple ranges are selected, moving one of them automatically moves the whole group. Clicking with the left mouse button on one of the ends of a range and moving the mouse without releasing will resize the selected range. When the mouse is in a position allowing for resizing a marker range, the <<, >> signs are added to the name of the marker (Fig.5-6b). a) Clicking and moving mouse will move the range. b) Clicking and moving mouse will resize the range. Fig.5-6 Labels that appear when the mouse is in a position allowing for the modification of a marker range. Clicking with the right mouse button on a marker range activates a pulldown menu, containing the following commands (all these commands can be used for a group of selected ranges): Open comment file – opens the comment file that the selected marker corresponds to. Add marker range to selection – selects the range that was clicked. Remove marker range from selection – deselects the range that was clicked. Selected ranges to blocks – adds the selected ranges to the block selection on the plot. © SVANTEK - 61 - SvanPC++ User Manual Add selected ranges to another marker – adds the selected ranges to a chosen marker. Remove current range from marker – removes the range that was clicked from the marker that it belonged to. Remove all selected ranges from marker – removes the selected ranges from a chosen marker. Quick markers adding You can add markers using right ALT + [0...9] convention. A new point marker of the name M[0...9] will be automatically created in the current location of the Main cursor. If a cursor of the selected number already exists, the sample selected with the Main cursor will be added to the selected marker. Special markers Some markers are created automatically and cannot be edited. This includes: The Audio marker shows the time ranges containing audio data, if available in the currently viewed data. The Whole data marker contains the whole time domain. The Pause or Break marker shows the time ranges containing pauses or breaks, if available in the currently viewed data. The Block selection marker denotes the current block selection. The High vibration marker, generated by SV 104 units, denotes fragments of data where the measured vibration level exceeds a threshold value. The Overload marker, denoting ranges of time in which overload has occurred. Note: The Overload marker is set for a record if at least one of the results is overloaded, even though some instruments append information about overload independently for each type of measurement result. Note: The Whole data marker and the Block selection marker is only applicable in Table view. 5.1.4 ACCELERATION, VELOCITY AND DISPLACEMENT In case of VLM spectra measurement results SvanPC++ Viewer offers the recalculation of three parameters: Acceleration, Velocity, Displacement. This concerns the files where spectral data is given, e.g. 1/3 Octave results. To select the parameter you wish to display, use the pulldown menu opened next to the button for VLM units selection on the Main toolbar. © SVANTEK - 62 - SvanPC++ User Manual Click to open the menu Parameter selection Fig.5-7. Selection of the displayed VLM parameter. Acceleration, velocity and displacement can all be displayed simultaneously. In the Plot view the particular parameters can be recognized in the functions list below the plot by “Acc” for acceleration, “Vel” for velocity and “Dil” for displacement added to the name of the function. Fig.5-8. Functions list containing the same function for various VLM parameters. 5.1.5 SPECTRUM RECALCULATION Conversion from FFT to 1/3 octave spectrum and from 1/3 octave to 1/1 octave spectrum can be easily done in SvanPC++ Viewer. If a FFT- or 1/3 octave-based function is available in the current data file, you can display the same measurement results in another domain by doing the following (as illustrated on Fig.5-9): 1. 2. 3. 4. Go to Plot view by clicking on the icon. Select the function(s) you wish to convert in the list below the plot. Click with the right mouse button to open the pulldown menu. Choose Octaves 1/3 or Octaves 1/1 from the Show results based on the selected functions menu. © SVANTEK - 63 - SvanPC++ User Manual Fig.5-9. Recalculation of 1/1 octave and 1/3 octave spectrum from FFT spectrum. The new function will be opened in a new view sub-window, e.g. a 1/3 Octave view or a 1/1 Octave view sub-window. 5.2 TOTAL RMS / LEQ AND CROSS-SPECTRA RECALCULATIONS SvanPC++ enables the recalculation of various functions, based on the measurement data downloaded from a Svan instrument or saved in a Svan file. In the base Viewer module of SvanPC++ the recalculation of running Total RMS and LEQ is available, as well as Transfer function and Coherence for cross spectrum results files. 5.2.1 SVAN PC++ CALCULATOR TOOL You can gain access to the Calculator using the Calculator pulldown menu, opened by clicking on the icon on the Main toolbar or through the Tools » Calculator menu. The base module of SvanPC++ enables the application of two Calculator sub-modules: Total RMS / LEQ, Cross-spectra. If a type of recalculation is not supported for the currently opened data, the corresponding command will be disabled. When you click on a command related to a Calculator sub-module, the Calculator dialog box will appear. © SVANTEK - 64 - SvanPC++ User Manual 5.2.2 TOTAL RMS / LEQ Functions list 1 2 Available measurement data Press to start calculation 3 Fig.5-10. Calculator dialog box for Total RMS / LEQ recalculations. The recalculations can be carried out by doing the following: 1. Select the function you wish to recalculate on the list at the left side of the Calculator dialog box. To select a function, click on the check-box next to its name. Note: You can recalculate both functions simultaneously. 2. Select the measurement data on which the recalculation should be performed. All the available measurement channels and profiles are displayed in the Channels and profiles panel at the right side of the dialog box. The enabled check-boxes correspond to the data for which the selected function is supported. 3. Press the Calculate button. Note: The Parameters, Calculation period(s) and Options are not available to configure in the free (Viewer) module of SvanPC++. The recalculation is performed for the current block selection made in the Plot view of the analysed data. To perform calculation on the whole available data, remove the block selection. For details on data selection, see Chapter 4.2.2: Plot view. © SVANTEK - 65 - SvanPC++ User Manual 5.2.3 CROSS-SPECTRA Functions list Cross-spectrum selection 1 2 3 Press to start calculation Fig.5-11. Calculator dialog box for Cross-spectra recalculations. Calculation of functions available in the Cross-spectra sub-module proceeds similarly to the Total RMS / LEQ sub-module, the only difference being the selection of data made in the Parameters panel instead of the Channels and profiles panel. 1. Choose whether you wish to calculate the Transfer function, Coherence or both in the functions list at the left side of the Cross-spectra calculator dialog box. 2. In the Parameters panel select the cross-spectrum for which the calculations should be performed. 3. Press the Calculate button. 5.2.4 VIEWING CALCULATED RESULTS When recalculation is done, the resulting functions are automatically displayed in the current view. They are also listed in the View configurator, allowing to hide and show them, where they can be recognized by “Calculated” added to their names (see Fig.5-12). © SVANTEK - 66 - SvanPC++ User Manual Fig.5-12. View configurator list containing calculated functions. In the Plot view, the calculated functions are listed in a separate table below the plot area, next to the Functions list. As with the other functions, you can decide whether to display them or not using the / icons. Calculated functions list Fig.5-13. Plot view containing calculated functions. Calculated results sub-window To manage the results of calculations, you can use the Calculated results sub-window, which can be opened in two ways: Using the Calculated results button in the lower-left corner of the Calculator dialog box, Clicking twice on the name of a calculated function on the Calculated functions list in the Plot view. © SVANTEK - 67 - SvanPC++ User Manual Calculated functions list Calculation parameters for the selected function Delete selected / all functions Return to Calculator Highlight the selected function on the plot Fig.5-14. Calculated Results sub-window. All the calculated functions are listed at the left side of the window, grouped by measurement channels and profiles. You can select a function to view the parameters used for its calculation in the panel at the right side of the window. You can also delete a selected function or all calculated functions using the Delete / Delete All buttons at the bottom of the window. Pressing the Show button switches to the Plot view, closing the Calculated Results sub-window, and highlights the selected function so it can be recognized among all the plotted functions. To close the Calculated Results sub-window and return to the Calculator tool, press the Calculator button located in the lower-left corner of the window. © SVANTEK - 68 - SvanPC++ User Manual 6 DATA EXPORT 6.1 MICROSOFT EXCEL You can use the Send to MS Excel command to export the viewed data directly to a Microsoft Excel worksheet: Send to MS Excel Table view 1 3 2 Data selection Fig.6-1. Exporting data from Table view to Microsoft Excel. 1. Go to Table view by clicking on the 2. Select the data you wish to export. icon. 3. Press the / button, located on the Main toolbar. 4. If you use this tool for the first time, the Send To Microsoft Excel dialog box will appear, allowing to configure the export settings. In the panel on the left side of the Send To Microsoft Excel dialog box you can select the target Microsoft Excel worksheet. All currently opened worksheets are displayed on the list. The New Worksheet option enables to create a new Microsoft Excel worksheet for the exported data. On the right side of the window you can decide whether the data should be inserted beginning from the first free column in the worksheet, from the first free row or from the currently selected cell. You can also decide whether table headers or the Header information should also be copied. © SVANTEK - 69 - SvanPC++ User Manual Fig.6-2. Configuration of data export to Microsoft Excel settings. If you enable the Remember this choices and don’t ask again option, the next export will be done with the same settings and the Send To Microsoft Excel dialog box will not appear. The same can be obtained using the Use Last Settings command from the pulldown menu opened next to the icon. Fig.6-3. Saving the last settings for later data exports to Microsoft Excel. icon means that the settings have to be configured. icon means that the last settings are remembered. After the export, Microsoft Excel will be automatically opened with selected data pasted to worksheet. In case the amount of data exceeds Microsoft Excel’s rows or columns number limit, it will be split to more than one worksheet. © SVANTEK - 70 - SvanPC++ User Manual 6.2 MICROSOFT WORD Results in text or picture form can be exported directly to Microsoft Word: Send to MS Word View mode selection 1 3 2 View configuration Fig.6-4. Exporting data from Plot view to Microsoft Word. 1. Go to the desired view mode, e.g. Plot or Table view. 2. Configure the exported data: a. In case of a table, select the cells to be exported. b. In case of a plot, use the customisation tools as described in Chapter 4.2.2: Plot view to obtain the optimal visualisation. The whole sub-window will be copied to Microsoft Word unchanged, including tables below and above the plot area. 3. Press the / button, located on the Main toolbar. 4. If you use this tool for the first time, the Send To Microsoft Word dialog box will appear, allowing to configure the export settings. Note: Logger and Merged-type views cannot be exported to Microsoft Word in table form, only as plots. Pictures are exported as Windows meta-files. © SVANTEK - 71 - SvanPC++ User Manual Fig.6-5. Configuration of data export to Microsoft Word settings. In the panel on the left side of the Send To Microsoft Word dialog box you can select the target Microsoft Word document. All currently opened documents are displayed on the list. The New Document option enables to create a new Microsoft Word document for the exported data. On the right side of the window you can decide whether the data should be inserted below the current document contents (Insert at document end) or at the current position of the cursor in the opened document (Insert at cursor position). You can enable to automatically select the newly inserted data in Microsoft Word (Select inserted data). If you enable the Remember this choices and don’t ask again option, the next export will be done with the same settings and the Send To Microsoft Word dialog box will not appear. The same can be obtained using the Use Last Settings command from the pulldown menu opened next to the icon. Fig.6-6. Saving the last settings for later data exports to Microsoft Word. icon means that the settings have to be configured. icon means that the last settings are remembered. After the export, Microsoft Word will be automatically opened with selected data pasted to the selected document. © SVANTEK - 72 - SvanPC++ User Manual 6.3 CSV FORMAT SvanPC++ Viewer also supports the data export in CSV (comma separated values) format. To save the currently opened data in a .csv file, use the Save Current View command in the File menu. After activating this command, the Save current view dialog box will appear, enabling to select the name and location of the created .csv file. To configure the formatting of the exported CSV data, open the Main Options dialog box using the button located on the Main toolbar or the Main options command from the Tools menu and go to Formatting values tab. Note: These settings also affect the way numbers are displayed in SvanPC++ Viewer. 1 Main options Configuration of CSV output settings 2 Configuration of ASCII output settings Fig.6-7. Configuration of the formatting of data exported as .csv files. This dialog box enables the configuration of the following settings: Format (Fixed-point / Scientific) and precision (1-5) of the displayed linear and frequency values, Enable / disable the Center to decimal point in table view option, Note: this option sets the location of linear values in cells so that the decimal point is located in the middle of the column. Otherwise the numbers are aligned horizontally in cells. Sign used as decimal separator in all displayed numbers (. / , / system default), Precision of displaying logarithmic values (dB resolution) as 0.1dB / 0.01dB. © SVANTEK - 73 - SvanPC++ User Manual Note: The display resolution does not affect the precision of calculations, Symbol used as field separator in CSV output data (; / : / . / , / tabulator / space). 6.4 ASCII EXPORT Data can also be exported according to ASCII standard as .csv files. To do so, use the File » Export » ASCII Export » Export command. Save data in ASCII format ASCII export settings Fig.6-8. Exporting data in ASCII format. In the ASCII Export pulldown menu the following settings are available: Punctuation signs: dot as decimal separator and comma as field separator or comma as decimal separator and semicolon as field separator, Block offset: hexadecimal / decimal / none, Note: Displaying the offset may help to compare the data position in the file in binary and ASCII form. Allow to place comments or not in output ASCII file, Splitting long lines of data or leaving them unchanged (Wrap long lines) Reserved as Hex – present undocumented fragments of binary file in hex format or not. The same settings can be configured in the Values formatting tab of the Main Options dialog box (see Fig.6-7). © SVANTEK - 74 - SvanPC++ User Manual 6.5 AUDIO EXPORT SvanPC++ supports exporting audio data in WAV file format. This includes exporting Audio events contained in the currently opened Logger data as well as wave data currently opened in the Viewer. 6.5.1 EXPORTING LOGGER EVENTS To export events included in active logger view, use the File » Export » Logger events command. After activating this command, the Export Events dialog box will appear. Logger events available in the current data are listed in the upper part of the window. You can set the target directory for the output wave files by clicking on the icon next to the Path field. To export the Events as WAV files, press the Export button located at the bottom of the window. Available events list Wave export settings Press to export events with configured settings Fig.6-9. Export Events dialog box. This dialog box also enables the configuration of following settings: Filename prefix – text string with which the output filename will start, Naming convention – select between appending the number of the event or its start time to the filename, Output Files Format – the format of created file, Note: Currently only WAV file format is supported. Settings – wave parameters settings (Compression, Sampling Rate [Hz], Channels, Bits Per Sample), Gain control – select whether to use no signal boost, constant-level signal boost or Automatic gain control smart signal boosting mechanism, © SVANTEK - 75 - SvanPC++ User Manual Note: Further information on SvanPC++ audio signal boosting can be found in Chapter 4.5.1: Events Navigator. Play – playback of the last selected audio event. It is also possible to generate a new logger file, containing only some of the audio events present in the original file. Use the Export >> Strip Events command, available in the File menu, to open the 'Strip events from logger file' window. Select events to be removed Fig.6-10 ‘Strip events from logger file’ dialog box. Select audio events that you wish to remove from the logger file using the checkboxes in the Remove column of the table located in the upper part of the window. Press the Export button to create a new logger file with selected events removed. You can also select whether to use no signal boost, constant level signal boost or 'Automatic gain control' smart signal boosting mechanism (cf. Section 4.5.1 about the Events Navigator) using the selector located at the bottom-left corner of the window. 6.5.2 EXPORTING WAVE FILES To export .wav files from wave data opened in SvanPC++, use the File » Export » Wave command. After activating this command, the Export wave dialog box will appear. Audio channels available in the current data are listed in the upper-left part of the window. You can set the target filename and directory for the output wave files by clicking on the icon next to the Filename field. © SVANTEK - 76 - SvanPC++ User Manual List of available audio channels Wave format settings Gain options Uncheck to mix channels to mono Target filename and directory Press to export wave files with configured settings Fig.6-11. Export wave dialog box. You can select a set of channels to be exported as well as WAV tag format. EXTENSIBLE format should be used, especially if Bits per sample parameter exceeds 16 bits, unless the device or software supposed to handle the exported files supports only standard PCM format. You can also select whether to use no signal boost, constant-level signal boost or Automatic gain control smart signal boosting mechanism. Further information on SvanPC++ audio signal boosting can be found in Chapter 4.5.1: Events Navigator. The Manual range control option, also available in the list-box related to gain options (Fig.6-11) allows for scaling the wave signal according to range values specified manually for each channel separately. This possibility might turn out useful in case of .WAV files generated by different instruments, in which ranges in particular channels do not match—in such case, you can use the Manual range control to scale the ranges in order to be able to compare values stored in different .WAV files. When this option is selected, double-click the name of a channel in the list located in the top-left corner of the window to open the Edit wave range dialog box, in which you can specify new range for the selected channel. Fig.6-12 The Edit wave range dialog box. © SVANTEK - 77 - SvanPC++ User Manual Selected channels are by default exported to separate files. You can decide to mix all channels to one mono channel by unchecking the Export each channel individually as new file option. To export the wave files, press the Export button located at the bottom of the window. 6.6 USING THE CLIPBOARD Data can also be easily exported from SvanPC++ with the use of the clipboard. 6.6.1 COPYING TABLE VIEW CONTENTS You can export the contents of Table view to a text editor application using the clipboard by doing the following: 1. Select the data you wish to export in the Table view. 2. Press the right mouse button to open a pulldown menu. 3. Choose Copy or Copy with headers command. 4. Go to the text editor application and use the Paste command. Fig.6-13. Copying the Table view contents using the clipboard. The Copy with headers option includes the header cells, marked with grey color, in the copied data. 6.6.2 COPYING TEXT VIEW CONTENTS Contents of a Text view can be easily copied directly to a text editor application by doing the following: 1. Selecting the data to copy. 2. Clicking on it with the left mouse button. 3. Drag the selection without releasing to the text editor application. 4. Drop the selection in the target document. © SVANTEK - 78 - SvanPC++ User Manual Fig.6-14. Using the drag & drop technique to export the contents of Text view. © SVANTEK - 79 - SvanPC++ User Manual 7 OTHER FEATURES 7.1 TOOLBAR CUSTOMISATION The Toolbar is displayed at the top of the SvanPC++ application window, below the menu bar. It provides quick access to many tools used in SvanPC++. To hide / show the Toolbar, use the View » Toolbar command. Fig.7-1. The Toolbar. It is possible to choose the buttons displayed on the toolbar with the use of the Toolbar configurator dialog box. It can be activated in two ways: Using the Tools » Customize toolbar command, Clicking twice with the right mouse button in the Toolbar area. Check to enable toolbar customisation Drop icons here Pick icons from here Press to confirm changes Fig.7-2. Toolbar configurator dialog box. To use a custom selection of toolbar buttons, enable the Use customized toolbar option, using the checkbox located at the upper-left corner of the Toolbar configurator window. To use the default configuration, uncheck this option. To select buttons, you can use one of two following methods: Drag-and-drop icons from the Available buttons list located at the right side of the window to the Custom toolbar list located at the left side of the window, as illustrated in Fig.7-2. © SVANTEK - 80 - SvanPC++ User Manual Double-click on an icon in the Available buttons list to add it to the custom toolbar, or doubleclick on an icon in the Custom toolbar list to remove it. Note: Different toolbar configurations are used when a document is currently opened and when there are no opened documents in SvanPC++. You can customise both toolbar configurations separately. You can also use default settings for one of the configurations and custom settings for the other. All buttons available for displaying on the Toolbar are described in Table 7-1. Table 7-1. Buttons available for displaying on the Toolbar. Icon Name Function New Window Creates a new view sub-window with the same contents as the one currently active. Open Save file Save view Saves an open file. Exports the curretly active view in CSV format. Print Prints the currently active view. Cut Deletes selected data and moves it to the clipboard. Copy Copies selected data to the clipboard. Paste Inserts data from clipboard. Instrument wizard SVAN Files RC Module group Calculator Blocks/markers generator © SVANTEK Opens a selected file. Shows / hides the Instrument wizard dialog box. Opens the SVAN Files dialog box. Enables to access SVAN Files, Remote Communication Center and Connection Configuration. Enables to access Calculator sub-modules. Opens the Blocks/markers generator (only available if Environmental Monitoring module is activated). - 81 - SvanPC++ User Manual Data search Send to MS Excel Enables to export data to Microsoft Excel. Send to MS Word Enables to export data to Microsoft Word. Change SLM units Enables to choose units for displaying SLM results. Change VLM units Enables to choose units for displaying VLM results. Zoom in Decreases the number of samples per pixel. Zoom out Increases the number of samples per pixel. Table Font Size Main options © SVANTEK Opens the Data search dialog box (only available if Svan Projects are activated) Enables to adjust the size of numbers displayed in Table view. Opens the Main options dialog box. About SvanPC++ Displays information about the used version of SvanPC++. Remote settings Enables to select connecion type and communication mode between SvanPC++ and a SVAN unit. Remote Communication Center Opens the Remote Communication Center dialog box. Remote Connection Wizard Opens a Wizard enabling to easily configure the connection. SV 100/101/103 calibration Enables to calibrate a SV100/101 unit connected to PC via USB. SV 100/101/103/104 Options Configurator Enables to configure the settings of a SV100/101 unit connected to PC via USB. SV 100/101/103 group Enables to access the SV100/101/103 calibration and the SV100/101/103/104 Options Configurator. - 82 - SvanPC++ User Manual Alarms/status Add file User Function Wizard Opens the Alarms/status sub-window. Adds a file to the Project Objects list. Opens the User Function Wizard (only available in the Projects module). 7.2 SV10x CALIBRATION The SvanPC++ software enables to easily calibrate a SV100, SV101 or SV103 unit connected to the computer via USB. You can activate the calibration function in various ways: using the SV100/101/103 Calibration (USB) command from the SVAN menu, clicking on the icon available on the Toolbar, Note: This icon is not available in the default Toolbar configuration. For details on the available Toolbar icons, see Chapter 7.1: Main Toolbar Customization. pressing the Calibration button in the SV100/101/103 Instrument Wizard. Each of these actions opens the SV100/101/103 Calibration dialog box. Fig.7-3. SV100/101/103 Calibration (USB) dialog box. If there are multiple instruments connected to the computer, you can use the Select instrument pulldown menu, located in the lower-right corner of the window, to choose the device you wish to calibrate. You can manually set the Calibration Factor, as well as the calibration measurement profile settings, such as: Calibration Level, Filter, © SVANTEK - 83 - SvanPC++ User Manual Detector, for each separate measurement channel, using the controls grouped in the Channel X / Y / Z panels, below the Measurement progress bar. It is also possible to configure the Measurement Time Settings and choose units for the vibration measurement results. The settings are automatically downloaded from the instrument when you open the SV 100/101/103 Calibration dialog box. You can also download them manually using the Read Settings button, located at the bottom of the window. The Send Settings button serves for sending the configured settings to the instrument. You can start measurements with the current instrument settings using the Start Measurement button. The results of the RMS measurement for each channel, downloaded from the SVAN 100/101 device, are displayed in the panels at the top of the window, above the Measurement progress bar. The values are automatically updated during the measurement process. Pressing the Start Calibration button: sends the configured settings to the instrument, sets the calibration mode in the instrument, starts calibration measurement. To send the Calibration factor value to the connected instrument, press the Save Calibration button (individually for each measurement channel). You can use the Terminate button to terminate the current action, such as downloading settings from the instrument etc. Note: A short guide in PDF format, explaining how to work with a SV 100 instrument is available on the SVANTEK website: www.svantek.com. 7.3 SHORTCUT KEYS The key combinations available in SvanPC++ are listed in Table 7-2. © SVANTEK - 84 - SvanPC++ User Manual Table 7-2. Shortcut keys in SvanPC++. Key combination Function CTRL + C Copy selection. CTRL + V Paste from clipboard. CTRL + Z Undo last action. F1 Access help. CTRL + P Print. CTRL + O Open a file. Left ALT + F, E, ... Access to menus (F – File, E – Edit etc.). Shift + F1 Enables to use the mouse to open help page related to a selected control. CTRL + F6 Show next opened sub-window. ESC In Plot view, delete the block selection containing the current position of the Main cursor / delete the only existing block selection / delete all block selections. 7.4 ACCESSING ADDITIONAL MODULES Except of the free Viewer module, the SvanPC++ software suite comprises several additional modules available for purchase, such as: SvanPC++ Remote Communication SvanPC++ Environmental Monitoring SvanPC++ Projects SvanPC++ Dose Measurements SvanPC++ Building Acoustic There are two ways of activating SvanPC++ additional modules: Entering an activation code, Using a hardware dongle. 7.4.1 RC MODULE ACTIVATION The Remote Communication Module is licensed separately for each SVAN instrument. To access this module, you have to purchase an activation code for each instrument you wish to use with SvanPC++ RC and enter it in the Enter Activation Keys window in the SvanPC++ application. © SVANTEK - 85 - SvanPC++ User Manual Type the code here Fig.7-4. Entering codes for RC Module activation. 7.4.2 HARDWARE DONGLES The EM, DM and BA modules can be activated with the use of hardware dongles. Fig.7-5. A hardware dongle. The dongles contain keys which serve to activate additional SvanPC++ modules. When you plug a dongle to a USB port of your computer, the key is automatically unpacked and you gain access to the modules. Removing the dongle will block the access to the modules. There can be multiple SvanPC++ modules activated with one dongle. Keys contained in the dongle are connected with its serial number. Therefore, a key copied from the dongle will not work without the dongle being plugged into the computer. Note: If after attaching the dongle you still do not have access to the additional modules, this might be due to an older version of SvanPC++ being previously installed on your computer. It is then necessary to first uninstall SvanPC++ and then install the newest version of the software, available on the Svantek website. When using a terminal server, the dongle is available for one user at a time. © SVANTEK - 86 - SvanPC++ User Manual 8 ENVIRONMENTAL MONITORING MODULE TOOLS SvanPC++ Environmental Monitoring is an additional module of the SvanPC++ software suite, designed for processing data from noise or vibration measurements, including long period unattended environmental monitoring. The EM Module enriches the SvanPC++ software with the following features: Advanced recalculation tools, Data management in form of measurement projects, Saving analysis results and data views, Tools for reporting, including templates, User Function Wizard (→ Section 10.6.3), Blocks/markers generator, The possibility to edit logger contents (→ Section 10.6.4), Extended functionality of the table below the plot (→ Section 4.2.2, paragraph Contents of the plot). 8.1 ENVIRONMENTAL CALCULATOR SvanPC++ Environmental Monitoring provides tools for the assessment of noise, concerning recalculations based on measurement results. In this chapter the functions available for recalculation will be considered. Methods of using the advanced recalculation tools are described in Chapter 9: SvanPC++ Calculator Tool. 8.1.1 SPECIFIC NOISE ASSESSMENT The Environmental Monitoring Calculator sub-module provides several tools for specific noise assessment. Peak and harmonics detection The detection of peak and harmonics in FFT data is provided by the Peak detection and Harmonic detection functions in the Result FFT group of the EM Calculator. Fig.8-1. Peak and harmonics detecion functions on the Calculator functions list. These two functions are available for recalculation only if FFT Result – type data is available in the currently opened file. © SVANTEK - 87 - SvanPC++ User Manual Note: Harmonic detection will be performed using main cursor position as the starting point. It is advised to first perform peak detection, then place main cursor at the desired peak and launch harmonic detection calculation. You can adjust the Peak / Harmonic detection criterion between 1dB and 30dB. Tonality analysis The tonality analysis is provided in the EM Calculator in two modes: for FFT data – the Tonality analysis function in the Result FFT group for 1/3 octave data – the Tonality analysis (Simple) function in the Result 1/n octave group. Fig.8-2. Tonality analysis functions on the Calculator functions list. The Tonality analysis function enables the assessment of tonality in selected FFT data with selected criterion. As a result of calculations, a dialog box will appear containing information about the necessary penalty factor. In case of this function the following parameters are available for configuration: Standard: Nordic (according to ISO 1996-2:2002 standard) or German Maximum tone bandwidth: 5% - 25% Tone seek criteria: 1 dB – 5 dB Regression range: 0 – 100% Tone bandwidth: 1 dB – 6 dB. The Tonality analysis (Simple) function enables the assessment of tonality in selected 1/3 octave data. As a results of calculations, a dialog box will appear containing information about the audible tones found. In case of this function, no parameters are necessary to configure. Impulsivity analysis The impulsivity of a logger-stored signal can be evaluated with the use of the Impulse analysis function from the Logger group. © SVANTEK - 88 - SvanPC++ User Manual Fig.8-3. Impulsivity analysis function on the Calculator functions list. The recalculation is performed according to the norm UNI/BS 9432:2002 on the basis of measured MAX function. As a result of calculations, a dialog box will appear containing information about the impulsivity of the evaluated signal. To enable the Impulse analysis recalculation, the following requirements must be fulfilled: The analysed Logger file must contain MAX function measurement results. The measurement must be conducted in 3 profiles with the use of following detector types: Fast, Impulse and Slow. The logger step must be smaller than 1 s. No additional parameters are available to configure in case of this function. 8.1.2 GENERAL NOISE ASSESSMENT Except of the specific noise assessment, the Environmental Monitoring Calculator provides also tools for general noise assessment. LEQ – Equivalent Continuous Sound Level The total Equivalent continuous sound level value in a given period can be calculated on the basis of LEQ measurement results according to the formula: (8-1) – sample index in given set of data. This is realised by the LEQ function from the Logger » Acoustics group. Fig.8-4. LEQ function on the Calculator functions list. The EM Calculator provides various types of LEQ recalculations, such as: Total / spectral (averaging), In intervals, Finding max and min levels, Statistical levels, © SVANTEK - 89 - SvanPC++ User Manual The spectral LEQ is available in the Logger 1/n octave » Acoustics group. In the Parameters settings for this function you can choose whether to calculate the 1/1 octave or 1/3 octave spectrum. Note: In case of spectral logger-based calculations, the calculation is performed separately for each logged frequency. Calculating a spectral function automatically opens a 1/3 or 1/1 octave logger recalculated sub-window containing the calculation results. Sound Exposure Level Minimal / Maximal LEQ Result LEQ statistics LEQ-based functions for spectral data LEQ spectrum statistics Fig.8-5. LEQ-based functions on the Calculator functions list. © SVANTEK - 90 - SvanPC++ User Manual SEL – Sound exposure level The SEL result is essentially a subset of the LEQ function. (8-2) – sample index in given set of data. – measurement time. It is possible to calculate the SEL function in intervals by setting the start and stop time of the calculation period, using the Calculate in selected time period option in the Parameters panel. The SEL function is available in the Logger » Acoustics group. For spectral data it can also be calculated using the SEL function from the Logger 1/n octave » Acoustics group. Maximum and Minimum LEQ You can recalculate the highest and lowest LEQ level within the measuring period using the LMAX and LMIN functions, correspondingly, which are available in the Logger » Acoustics group. These functions are also available for spectral data under the same names in the Logger 1/n octave » Acoustics group. In case of spectral LMIN and LMAX, the choice between 1/1 octave and 1/3 octave spectrum is available in the Parameters panel. Minimum / maximum values will be found across the calculation range independently for each frequency band. Statistics Statistics may be calculated for several logger- or multifile-type functions. All available statistical recalculations are listed in the Logger » Statistics group and in the Logger 1/n octave » Statistics group in case of spectral data. For example, you can use the Logger » Statistics » LEQ stats function to obtain LEQ calculation results statistics. Calculating a Statistics-type function automatically opens a Statistics logger recalculated subwindow containing the calculation results. The statistical results can viewed in two modes: Histogram mode presents the percentage participation of each dB level in the given function values at 1 dB resolution. LN mode has the following interpretation: x% of samples have values equal or greater than the LNx value. In case of spectral statistics, LN(f) mode of view is also available, as described in the Statistical Views section of Chapter 4.3.2.: View sub-windows types. LEQ Averaged Spectrum To calculate the time-averaged spectrum of selected LEQ data, use the Spectrum averaging function from the Logger 1/n octave group. You can choose between averaging the 1/1 octave and 1/3 octave spectrum. © SVANTEK - 91 - SvanPC++ User Manual This function is available only for files containing spectral data in multiple time points such as Logger or Merged spectral data. It is not available for Results files. Day / Evening / Night level functions The Ld, Le, Ln, Ldn and Lden functions are descriptors of noise level based on the LEQ results for the day, evening, night, day-night and day-evening-night periods correspondingly, with penalty factors for particular parts of day. They can be accessed in the Logger » Acoustics group. Fig.8-6. Lden family of functions on the Calculator functions list. (8-3) (8-4) (8-5) (8-6) (8-7) – day-time start point, – evening-time start point, – night-time start point, – evening-time penalty, – night-time penalty, – sample index in given set of data, – k-sample measurement time. © SVANTEK - 92 - SvanPC++ User Manual In the Parameters panel for Lden family functions you can adjust the values of following parameters: Day-time start point [hh:mm:ss], Evening-time start point [hh:mm:ss], Night-time start point [hh:mm:ss], Evening-time penalty factor [dB], Night-time penalty factor [dB]. Note: Start points of the day parts are given in absolute time, independently of Main options settings. If the Calculate in intervals option is enabled, the common part of the intervals and the selected day parts will be used for recalculation. For details on calculation in intervals, see Chapter 9.2: Specifying calculation periods. You can also choose to calculate the described functions using a specified reference time. This option is particularly useful if you perform calculations on a shorter range of the time domain. If the Calculate using reference time option is enabled, the recalculation consists of the following steps: 1. LEQ is calculated for separate events, selected by the user with blocks or markers. 2. Calculations are performed according to the following formulae: (8-8) (8-9) (8-10) (8-11) – reference time (day) – reference time (evening) – reference time (night) – LEQ for event j – duration time of event j – number of events in day-time – number of events in evening-time – number of events in night-time © SVANTEK - 93 - SvanPC++ User Manual If recalculation is performed in intervals, for each interval the calculations are performed independently with specified reference time. Ltm5, Tm5 – Takt-Maximum levels The Ltm5 and Tm5 functions in the Logger » Acoustics group allow to calculate the Takt-Maximum levels according to German standard TA Lärm. Fig.8-7. Takt-Maximum level functions on the Calculator functions list. The calculations are performed in 5-seconds time intervals, beginnings from the file start, independently on the intervals set in the Calculation periods settings. The Ltm5 and Tm5 values are calculated only for ranges of data where the whole 5-second period is selected for calculation. If a part of a period is not contained within the selection, calculation for a period of length < 5 s will never be performed. Maximum value calculation It is possible to calculate the maximum value of functions measured by the SVAN instruments, such as MAX and PEAK, with the use of MAX(MAX) and MAX(PEAK) functions from the Logger » Acoustics group, accordingly. These functions simply return the maximum value of given measurement results. © SVANTEK - 94 - SvanPC++ User Manual Fig.8-8. Maximum value functions on the Calculator functions list. 8.1.3 VIBRATION MEASUREMENTS BASED CALCULATIONS RMS-based calculations The averaged RMS value for a vibration measurement signal can be calculated using the Total RMS function in the Logger » Vibrations group. It is analogous to the LEQ function in case of acoustic measurements. The maximal and minimal RMS value can be calculated with the use of LMIN and LMAX functions from the Logger » Vibrations group in an analogous way as in case of LEQ-based calculations for acoustic measurements, the only difference being that LEQ values are replaced with RMS values. Consequently, the RMS statistics as well as the RMS spectrum statistics can also be calculated analogously to how it is described in the Statistics section of Chapter 8.1.2: General noise assessment. © SVANTEK - 95 - SvanPC++ User Manual Minimal / Maximal RMS Result RMS value calculation RMS statistics RMS spectrum statistics Fig.8-9. Vibration RMS signal based functions on the Calculator functions list. VECTOR function The VECTOR function, available in the Logger » Vibrations group, is calculated with the use of Total RMS data measured in different channels, according to the formula: (8-12) – channel number, – sample index in given set of data. – vector coefficients, which can be adjusted in the Parameters panel. In case of this function, the selection of measurement channels used for calculations is only available in the Parameters panel. © SVANTEK - 96 - SvanPC++ User Manual Fig.8-10. VECTOR function on the Calculator functions list. Total VDV – Total Vibration Dose Value The Total VDV function is calculated with the use of VDV results, according to the formula: (8-13) – sample index in given set of data. It is available in the Logger » Vibrations group. Fig.8-11. Total VDV function on the Calculator functions list. © SVANTEK - 97 - SvanPC++ User Manual 8.2 OTHER FEATURES 8.2.1 DATA MANAGEMENT WITH THE USE OF PROJECTS Except of the recalculation tools described in Chapter 8.1: Environmental Calculator, the activation of the Environmental Monitoring Module also unlocks the SvanPC++ Projects tool. It enables to: Group multiple files of various types in a project file, Organize source data, Compare data and perform analysis, Save your work for later continuation, Quickly create reports. Svan Projects are described in Chapter 10: Working with SvanPC++ Projects. 8.2.2 USING MARKERS WITH ENVIRONMENTAL NOISE DATA Markers can be defined on selected ranges of the measurement data as a tool for classification. Details on using the markers can be found in Chapter 5.1.3: Markers. In case of the Environmental Monitoring Module, the markers in conjunction with the advanced Calculator tool can serve to simplify the work with noise events. To post-process a period separately or to process data excluding an unwanted fragment: 1. Go to Plot view. 2. Create a marker containing the desired event and name it, e.g. Event1. 3. Activate the Environmental Monitoring Calculator. 4. Go to the Calculation period(s) panel of the Calculator dialog box. 5. For processing only in the marked range, in the periods list find the created marker, and select it to perform calculations only in its range. 6. For removing the marked event from the range of calculations, in the periods list find the inverted marker’s range, e.g. Event1 (inverted). Select it to perform calculations only outside of the marker’s range. 7. Calculate the desired functions using the selected period. This procedure is illustrated in Fig.8-12. © SVANTEK - 98 - SvanPC++ User Manual 1 3 2 4 5 6 7 Fig.8-12. Using markers with environmental data. © SVANTEK - 99 - SvanPC++ User Manual 8.2.3 BLOCKS/MARKERS GENERATOR The Blocks/markers generator allows for determining ranges on the time axis according to one or more complex conditions, and using them for creating block selections and markers. To open the Blocks/markers generator, you can use either the corresponding command in the Tools menu or the button on the Toolbar. Note: The Blocks/markers generator is only available when a panel containing results defined in the time domain (e.g. Logger results) is currently active. The procedure of generating blocks and markers is divided into three steps: 1. Specification of the time range in which any further conditions will be considered. 2. Specification of one or more conditions, according to which blocks/markers will be generated. 3. Specification of the output, which can take form of new blocks/markers or changes in existing ones. Step 1 Fig.8-13 Step 1 of the Blocks/markers generator. In Step 1, you should declare a time range—in general, wider than the target one—in which conditions that you will specify in the next step will be considered. Various conditions can be used in this step, all of which are connected by logical AND (adding any condition can only reduce the resulting time range). The possibilities include: © SVANTEK - 100 - SvanPC++ User Manual using existing block selections and markers (as well as their inversions), or the entire time history of results stored in the currently open file (“Whole data”), by checking the corresponding checkboxes in the list located at the top of the window; filtering the time history according to time of day, by checking the Time period checkbox and specifying the start and stop time of the period to be considered; filtering the time history according to days of week, by checking the Day of week checkbox and checkboxes corresponding to days of week which you want to be considered; filtering the time history according to months, by checking the Month checkbox and checkboxes corresponding to months which you want to be considered; using a particular period of time between selected values of year, month, day of month, hour, minute and second, by checking the Date checkbox and specifying the start and stop dates in the fields below. After specifying all necessary conditions, proceed to Step 2 by pressing the Next button. Step 2 Fig.8-14 Step 2 of the Blocks/markers generator. In Step 2, more specific and complex conditions can be configured. Three conditions are available, of which at least one—the Trigger condition—should be specified (otherwise the whole range selected in Step 1 will be used for block/marker generation). The meaning of the pre- and post-trigger conditions can be understood by analyzing the procedure of selection of time ranges according to the three conditions (Fig.8-15): 1. A point on the time axis, for which the Trigger condition is satisfied, is found. © SVANTEK - 101 - SvanPC++ User Manual 2. The time history is browsed towards earlier time values until a point satisfying the Pre-trigger condition is found. 3. The time history is browsed towards later time values until a point satisfying the Post-trigger condition is found. 4. The range between points found in steps 2 and 3 is selected (Note: if the pre- and post-trigger conditions are not specified, only the point found in step 1 is selected). 5. Steps 1–4 are repeated until all points satisfying the Trigger condition have been considered. Ranges selected in subsequent iterations are accumulated. 6. Continuous selected ranges which have duration shorter than specified Minimum duration or longer than specified Maximum duration are rejected. Trigger condition satisfied Pre-trigger condition satisfied Post-trigger condition satisfied Resulting time range (whose length will yet be compared with min and max duration) Fig.8-15 An illustration of the procedure for selecting a single time range according to conditions specified in Step 2 of the Blocks/markers generator. The test for the Trigger condition may consist in: comparing the value of a measured parameter to a specified fixed value or the value of another measured parameter, or the value of another measured parameter offset by a specified fixed value, comparing the value of the gradient of a measured parameter to a specified constant value, both the above mentioned comparisons, connected by a logical conjunction or disjunction. Specify another parameter for comparison, or None to compare Specify fixed value for comparison only with fixed value. Select parameter to be compared Select relational operator Check to test the value of a selected parameter. Check to test the value of the gradient of a selected parameter. Specify logical relation between the two tests (if both are enabled). Select parameter whose gradient will be compared Fig.8-16 Specifying the Trigger condition in Step 2 of the Blocks/markers generator. The tests for the Pre- and Post-trigger conditions may consist in comparing the value of a measured parameter to a specified constant value or the value of another measured parameter, or simply measuring a fixed time from the trigger point (if the Fixed time option is selected). © SVANTEK - 102 - SvanPC++ User Manual The relational operators available for comparing parameters with fixed values and other parameters are: = (equal to), < (less than), <= (less than or equal to), >= (greater than or equal to), > (greater than), <> (not equal to). After specifying the conditions, as well as (optionally) minimum and maximum duration of time ranges, proceed to Step 3 by pressing the Next button. Step 3 Fig.8-17 Step 3 of the Blocks/markers generator. In Step 3 you can select how you want to use the time ranges generated using conditions specified in previous steps. The possibilities include: creation of a new marker of a specified name, creation of a new block selection (previous block selection will be cleared), adding the time ranges to the current block selection, removing the time ranges from the current block selection, adding the time ranges to a selected marker, removing the time ranges from a selected marker. After you specify the output, press the Finish button. © SVANTEK - 103 - SvanPC++ User Manual Note: For details on block selections, see Section 4.2.2, paragraph Selection of data. For details on markers, see Section 5.1.3. Note: You can press the Finish button in earlier steps of the Blocks/markers generator. In such case, various things may occur: If you configure settings in Step 2 or 3, then go back to some earlier step using the Back button and press Finish, all the settings you configured are taken into account. If you press Finish in Step 1 or 2, not entering to Step 3 at all, Create new block selection is automatically selected as the output option. If you press Finish in Step 1, not entering to Step 2 at all, no conditions are set except of the general ones selected in Step 1, and Create new block selection is automatically selected as the output option. © SVANTEK - 104 - SvanPC++ User Manual 9 SVAN PC++ CALCULATOR The Environmental Monitoring, Dose Measurements and Building Acoustics modules provide more advanced tools for data analysis and recalculations in relation to the basic Calculator tool, described in Chapter 5.2: Total RMS / LEQ and Cross-spectra Recalculations. It is realised by unlocking additional features of the Calculator, disabled in the free version of SvanPC++. This chapter is devoted to the discussion of these further possibilities of the Calculator tool and methods of using them. After the EM, DM or BA Module has been activated, the corresponding command in the Calculator pulldown menu is enabled. To use the recalculation tools specific for the purchased module, open the Calculator pulldown menu by using the Tools » Calculator command or by clicking on the icon on the Main toolbar and choose a sub-module from the menu. Sub-modules available in the free version of SvanPC++ Sub-modules available after activating relevant SvanPC++ modules Fig.9-1. Accessing the module-specific Calculator tool. The icon displayed next to a module’s name means that the module is not activated and the functions related to it are unavailable. Note: For details on viewing the results of calculations, see Chapter 5.2.4: Viewing Calculated Results. © SVANTEK - 105 - SvanPC++ User Manual 9.1 USING THE CALCULATOR DIALOG BOX After selecting a Calculator sub-module, the Calculator dialog box will appear. Sets of options available for configuration Functions list Channels and profiles settings Press to browse the results of recalculations Press to start calculation Fig.9-2. The Calculator dialog box. All the functions available for recalculation are displayed on the list located at the left side of the window. By clicking on the check-boxes next to the names of the functions you can select / deselect the functions you wish to calculate. You can select multiple functions for simultaneous calculation. The functions are displayed in tree mode, grouped by cathegories. By selecting a branch containing multiple functions, you can select all the functions belonging to the relevant cathegory. For each function various settings are available. Some settings are common to all functions, but all of them can be configured separately for each function. The right side of the Calculator dialog box enables the configuration of settings for a particular function after selecting it from the list, or simply after clicking on its name if it is already selected. Configuration of the Calculator settings is divided into 4 sets of options: Channels and profiles, Parameters, Calculation period(s), Options. You can select a set of options by clicking on a tab in the upper-right part of the window. © SVANTEK - 106 - SvanPC++ User Manual 9.1.1 CHANNELS AND PROFILES The Channels and profiles settings enable to choose the data set which will serve for recalculations. All the available measurement channels and profiles from the currently opened data are listed in this panel. The elements marked in grey represent data for which the selected calculation is unavailable. To select data, click on the corresponding check-boxes. Clicking on a check-box next to the name of a channel will select all profiles available for the selected channel. Analogously, clicking on a check-box next to the name of a profile will select all channels available for the selected profile. Note: In case of some functions, calculated on specific data, this mode of data selection is disabled. For example, in case of Cross-spectra calculations, you can only choose the crossspectrum data in the Parameters settings. 9.1.2 PARAMETERS The Parameters panel enables to configure the function-specific parameters of calculations. The set of parameters available to configure depends on the currently selected function. For details on the functions available in a particular SvanPC++ module, see the chapter related to that module. Fig.9-3. Parameters panel of the Calculator dialog box for the Lden function. © SVANTEK - 107 - SvanPC++ User Manual 9.2 SPECIFYING THE CALCULATION PERIODS The Calculation period(s) settings enable to select the range of the time domain for which the calculations should be performed. Available periods Time ranges contained in the period selected on the list Type of results Check to enable calculation in intervals Intervals settings Total available time range Fig.9-4. Calculation period(s) panel of the Calculator dialog box. Press to set interval start/stop = file start/stop Periods The Period panel enables to choose subset of data used for calculations. The Whole data marker is always available, enabling to perform calculations on the whole data. If a Block selection has been made in the current view, you can choose to perform calculations only on the selected data. You can also choose the inverted selection, meaning that calculations will be performed on all the data outside of the current block selection. If there are Markers defined on the data, you can perform calculations in the time periods specified by the markers or outside of them. You can select multiple periods. The selected function(s) will be calculated for each period separately. The table below the Period panel shows the begin and end points of all separate time ranges contained in the selected period. © SVANTEK - 108 - SvanPC++ User Manual Note: You can use the Inverted block selection to remove a selected fragment of data from the calculations. It is also possible to use the Period data selection mode with calculation on intervals mode simultaneously. Running / Total values The buttons in the middle of the window enable to choose whether Running values, Total values or both should be calculated. Running values – this option should be used if changes of the calculated function values during each interval / period are considered. Total values – this option should be used when only the final results of the calculations are considered. Note: In case of Total values recalculated functions, a specific View sub-window type is available, where function values are displayed once for each calculation period together with information about the period. It is described in Chapter 4.3.2: View Sub-windows Types. Cumulation of results The possibility of cumulation of results concerns calculations performed on non-continuous blocks of data. In non-cumulating mode, the selected function(s) will be calculated for each separate block of data independently, starting the calculation again at the start points of every data block. In cumulating mode, the function(s) will be calculated as if all the separate blocks of data formed one continuous selection, without restarting the calculation. You can acquire cumulated and non-cumulated results simultaneously by selecting the Both option. Note: For some functions this option is not available. It is also not possible to perform calculation on intervals with the Cumulate option. To make the Cumulate option available, uncheck the Calculate in intervals check-box. Intervals You can also choose to perform the calculations in intervals. To do so, click on the check-box signed Calculate in intervals. You can then choose the start and stop time of the intervals and the interval period. The range of the time domain available in the currently opened file is displayed at the bottom of the window. Pressing the Reset start/stop button will set the interval start/stop time equal the file start/stop time. If you choose to perform calculation on intervals, the common part of the adjusted intervals and the selected periods will be used for calculation. Note: If the selected interval start time does not correspond to the logger step, it will be adjusted automatically. After reopening the Calculator dialog box, the last settings of the interval start/stop time and period will be reloaded, if possible. If the last used settings do not fit the available range of data, they will be automatically set within the limits of the available data. If the Fixed start time option is enabled, the specified start time is remembered by SvanPC++ together with other calculator © SVANTEK - 109 - SvanPC++ User Manual settings. Therefore, even though another file may contain results of measurement performed on different dates, the start time of intervals will be automatically set as specified, e.g. at 6:00 AM. Note: With the Fixed start time option the start time can also be stored in saved calculator settings (saving calculator settings is only possible in the Projects module, → Section 10.6.2). Periodic functions In case of some functions, settings related to the calculation period are also available in the Parameters panel, e.g. Lden, Ldn, Ld, Le, Ln functions. The time period used for calculations is then equal the common part of the Parameters and Calculation period(s) settings. Time display mode You can decide whether to work with absolute or relative time values. To do so, open the Main Options dialog box using the Tools » Main options command or clicking on the icon on the Main toolbar. Then go to the General settings and use the buttons of the Time panel. General settings Time mode selection Fig.9-5. Time settings in the Main Options dialog box. © SVANTEK - 110 - SvanPC++ User Manual 10 SVAN PC++ PROJECTS The SvanPC++ Projects feature is a useful tool, which enables to manage multiple files of various types, modify and save data views, as well as create reports, using the measurement data contained in project. This feature is not included with the free Viewer version of the SvanPC++ software. It is available after activating the Environmental Monitoring or Building Acoustics module. A Svan Project is a structure in the form of a .svp file, containing files downloaded from Svan instruments and other types of files. 10.1 CREATING PROJECTS To create a new project, use the New project command from the File menu. The created project will be empty. You can also create a new project from the files currently opened in SvanPC++. This also allows to save any actions that have been done in the Viewer module. To do so, use the Convert to project command from the File menu. When you begin to work with a Svan Project, all other files will be closed. Once a project is created, you can import data to it from another project. To do so, use the Import » Data from another project command, available in the File menu. When you do that, the 'Import data from another project' window will appear. Fig.10-1 Importing data from another project. © SVANTEK - 111 - SvanPC++ User Manual The imported data may include Objects, Sessions and Reports. Note: When a session is imported, the Object that was used for its creation is be imported as well. To import data, select it on the list at the right hand side of the window and press the To change project from which data is imported, press the Open project button. button. 10.2 USING THE PROJECT BROWSER When a Svan Project is opened, the Project Browser will automatically be displayed. It can also be manually shown / hidden with the use of the Project Browser command from the View menu. Fig.10-2. The Project Browser. Managing files A list of files, contained in the current project, is displayed in the Project Browser. It is divided into three parts: Project Objects – files containing measurement results data and other related information, used in the project. This can also be calculation results, view, photos, graphics, pictures, report templates etc. Project Sessions – sessions used for displaying data in the form of tables, plots etc., such as the ones described in Chapter 4.3.2, which you can modify and save. Project Reports – Microsoft Word text files, containing measurement data, results etc. Moving the Project Browser You can change the location of the Project Browser in two ways: clicking with the left mouse button somewhere on the border of the Project Browser and moving the mouse without releasing the button, or using the Dock left / Dock right commands in the pulldown menu opened by clicking anywhere in the Project Browser area with the right mouse button. © SVANTEK - 112 - SvanPC++ User Manual Fig.10-3. Commands serving to dock the Project Browser. 10.2.1 PROJECT OBJECTS Adding data You can add data files to the project in several ways: using the Add button, located at the left end of the Toolbar - when you are working with a project, this button serves for selecting files to be added to the Project Objects list. simply clicking with the left mouse button on the desired file in the explorer and dragging it without releasing to the Project Objects list, using the Add file command, available after clicking with the right mouse button on Project Objects or a folder contained within this list. This command will activate the Open File dialog box where you can choose the file you want to add. Fig.10-4. Adding files to the Project Objects. Managing data You can manage the files in the Project Objects list in sub-catalogues. To create a new folder, click on Project Objects or on the name of an already existing folder with the right mouse button and choose New folder from the menu. The new folder will be created inside the selected location. To place a file in a folder, click on it with the left mouse button and move it without releasing to the desired location. To rename a file, click on its name with the right mouse button and choose the Rename option. You can also use the F2 button or click twice slowly on the file name. © SVANTEK - 113 - SvanPC++ User Manual To delete a file from the project, click on its name with the right mouse button and choose the Delete option. You will be asked for confirmation. Note: Any changes you make on the files contained in the project, such as renaming, will not affect the original files. When you delete a file from the current Svan Project, the original file is not deleted. Note: When you attempt to delete an object that had been used for creation of sessions contained in the current Project Sessions, you will be asked for additional confirmation. You can also choose whether SvanPC++ should automatically remove the session folders which remain empty after the deletion of the object or not. To set this option, check the Remove empty sessions checkbox. Fig.10-5. Removing empty views from the Project Objects. Creating sessions from data To start working with a results file and open a session, you can do one of the following: Clicking on the file name with the right mouse button opens a menu, containing all the view types (described in Section 4.3.2) available for the selected file. Choosing one of them opens a session of the selected type. Clicking on the file name with the right mouse button and choosing Create default session creates a view according to the priority specified in Main Options » Views settings. If none of the types specified in the Opening priority list is available for the selected file, a Header Info view will be created. The same can be done by clicking twice with the left mouse button. When you create a session using the Project Objects, a view is automatically created in the Working Area. A corresponding folder is created in the Project Sessions list. © SVANTEK - 114 - SvanPC++ User Manual Fig.10-6. Creating sessions using the Project Objects list. 10.2.2 PROJECT SESSIONS The Project Sessions list is filled with folders containing data which are displayed in SvanPC++ sessions, created in the current Svan Project using Project Objects. A feature of the Svan Projects module, unavailable in the free version of SvanPC++, is that modifications made while working with sessions can be saved and then reloaded when you open the project. Creating sessions New sessions can be created using the measurement results data through the Project Objects list, as described in the Creating sessions from data section of Chapter 10.2.1: Project Objects. When there is at least one session in the Project Sessions list, you can create a copy of it. To do so, click on the session’s name with the right mouse button and choose the Duplicate session option. A new session folder, identical with the duplicated one, is then put on the list. Fig.10-7. Duplicating a Project session. © SVANTEK - 115 - SvanPC++ User Manual Managing sessions The sessions are grouped in separate folders, which contain all the types of sessions available for the measurement results, listed in the Data sub-catalogue. When sessions are created, they are named automatically as "Session (#)", where # is the lowest unoccupied number. You can change the name of a session folder in 3 ways: Clicking on the folder name with the right mouse button and choosing the Rename option, Clicking on the folder name with the left mouse button twice slowly, Pressing F2 with the folder name selected on the Project Browser list. Note: The session folders names cannot contain any of the following characters: / \ : * ? " < > | You can delete a session folder, clicking on its name with the right mouse button and choosing the Delete option. You can also press the Delete button with the folder selected on the Project Browser list. All the data contained within this folder will be then deleted. However, the corresponding measurement results file (contained in the Project Objects list) will remain unchanged. You can also delete multiple sessions at once. To do so, select all the folders you wish to delete (clicking on their names with CTRL or Shift pressed) and press the Delete button. Opening sessions To open a session window in the working area, you can do one of the following: Clicking on a session folder in the Project Browser with the right mouse button opens a pulldown menu with the names of all the view types available for the data used for creating the selected session. Choosing a view type from the menu creates a view of that type. Choosing the Show session option in the same pulldown menu creates a view of the type specified in Main Options » Views settings. If none of the types specified in the Opening priority list is available for the selected data, a Header Info view will be opened. The same can be done by clicking twice on a session folder. All the available views are also listed inside the session folder. To open a selected view, click on its name twice with the left mouse button or choose the Show session option, available after clicking on the session name with the right mouse button. Fig.10-8. Opening sessions using the Project Sessions list. © SVANTEK - 116 - SvanPC++ User Manual When a view is created, you can work with it in the same way as in the free Viewer module. However, all the modifications can be saved. 10.2.3 PROJECT REPORTS A report is a file in the Microsoft Word format, created with the use of objects and sessions contained in the project. Note: Microsoft Word 2003 or newer must be installed on your PC to work with reports. Creating reports To create a new report, click on Project Reports in the Project Browser with the right mouse button and choose the New report option. Microsoft Word will be opened and a new, empty document will be automatically created. A new object will also appear on the Project Reports list, called "Report (#)", where # is the lowest unoccupied number. This name may be manually edited afterwards. Fig.10-9. Creating a new report. The report can only be viewed in Microsoft Word. If you close the report document, you can reopen it by clicking on the report name with the right mouse button and choosing the Show report option. Fig.10-10. Reopening a report. To delete a report, select it in the Project Reports list and press the Delete button. You will be asked for confirmation. © SVANTEK - 117 - SvanPC++ User Manual Adding data You can add files of various types to the report document, clicking on the files in the Project Browser area and dragging them on the name of the report file in the Project Reports list. Adding objects such as pictures, text etc. will simply paste them into the document. Adding contents of sessions from the Project Sessions list can be performed in two modes, selected via Projects Toolbar: as bitmaps - in this mode the session is represented in a stable picture form, but cannot be modified; as metafiles - in this mode modifications of the session are possible in Microsoft Word, but its representation may not be stable. The objects added to the report are pasted at the current location of the cursor in the report document. The easiest way to add contents of sessions or graphic files to the report is to simply drag them from the Project Browser directly to the Microsoft Word document, as shown in Fig.10-11. Fig.10-11. Adding data to report by dragging objects from the Project Browser to Microsoft Word. © SVANTEK - 118 - SvanPC++ User Manual 10.3 PROJECTS TOOLBAR The Projects Toolbar contains useful tools, specific for working with projects and building reports. You can show / hide the Projects Toolbar using the Projects Toolbar command from the View menu. The controls available in the Projects Toolbar are listed in Table 10-1. Table 10-1. Projects Toolbar buttons. Icon Name Select merging mode User function wizard (→ Section 10.6.3) Data search (→ Section 10.5) Switch dragging mode Switch dragging of current spectrum from active logger spectrum view on/off Include table header Drag table selection Include fonts and colors Drag plot as bitmap Drag plot as metafile Keep templated objects when generating report from template (→ Section 10.4.3) Automatically create missing sessions when generating report (→ Section 10.4.3) Tile app and report horizontally Show Report templates browser (→ Section 10.4.4) © SVANTEK - 119 - SvanPC++ User Manual Generate report for current project (→ Section 10.4.4) Include map when copying Measurement Tracking views to reports Merging mode The Select merging mode pulldown menu enables to specify the way data is merged when creating multi-source views. For details, see Chapter 10.6.1. Dragging mode The Dragging mode is a tool which enables one to easily add data to report. To switch the dragging mode on/off, use the turn to . button. When the dragging mode is enabled, the mouse cursor face will With the dragging mode enabled, you can grab the contents of a Plot view and drag them to the window of another application, such as e.g. Microsoft Word. Dragging current spectrum The Dragging of current spectrum from active logger spectrum tool enables one to drag the currently displayed spectrum from a Logger 1/3 octave view and drop it in another view subwindow as a reference spectrum. Note: When using this tool, only a single spectrum corresponding to the currently displayed moment of time is dragged, as opposed to the default action which is dragging the entire spectral logger. To enable/disable dragging current spectrum, use the button. It is particularly useful if you need to select a time history of spectral results with another, single spectrum. Include table headers button The button can be used to configure the parts of the table view that are copied to the report. If the Include table header button is pressed, when you add a Table view to a report, it will be copied together with the columns and rows with information about the table contents. If it is not pressed, only the cells with numerical data will be copied. © SVANTEK - 120 - SvanPC++ User Manual Fig.10-12. Parts of the Table view, which are copied only if the Include table header button is pressed (marked in red). Table dragging modes The mode of adding Table views to the report can be switched using the button. There are two modes available: Drag table selection mode - in this mode only the selected cells are copied to the report. If there is no current selection in the table view, the whole table will be copied. This mode is active if the Drag table selection button is pressed. Drag whole data mode: In this mode the whole table is copied to the report, even if there are cells currently selected in the table view. This mode is active if the Drag table selection button is not pressed. Include fonts and colors button The can be used to configure the settings of copying Table views to the reports. If the Include fonts and colors button is pressed, Table views will be copied to the reports keeping the current table font style and color settings. Otherwise, tables added to the report will include the font and color currently active in Microsoft Word. Plot dragging modes The / can be used to set the mode of exporting sessions to reports. There are two modes available: Drag plot as bitmap (BMP), Drag plot as metafile (EMF). © SVANTEK - 121 - SvanPC++ User Manual In the BMP mode, the sessions are represented in a stable picture form, but cannot be modified. In the EMF mode, modifications of the session are possible in Microsoft Word, but its representation may not be stable. Tile horizontally button The button can be used to set the screen configuration easier to work with SvanPC++ and a report simultaneously. After pressing this button, the SvanPC++ application window will fill the left half of the screen, while the Microsoft Word report document window will fill the right half of the screen. Measurement tracking views Measurement tracking views can be opened by creating sessions using imported .SVMT files. (Note: .SVMT files can be created using SvanMobile, an application for mobile devices running on Android. For details, visit: http://svantek.com/software/svanmobile-new.html) Fig.10-13 A Measurement tracking view. A Measurement tracking view contains supplementary information about the measurement, such as location, photos, voice comments etc. Using the button, available on the Projects Toolbar, you can enable / disable enclosing maps containing locations of measurement together with other measurement tracking information when exporting Measurement tracking views to reports. © SVANTEK - 122 - SvanPC++ User Manual 10.4 REPORT TEMPLATES The Report templating is a special feature useful for creating reports. The report templates have the same form as a report, however, they may contain templated objects. When you generate a report, based on a report template, all the templated objects are replaced with views, parameters or results, taken from objects contained in the current Svan project. 10.4.1 CREATING TEMPLATES The report templates, contained in the current Svan project, are listed in the Project Browser » Project Reports list. To create a new report template, click with the right mouse button on the Project Reports list name (or a sub-catalogue) and select the New report template command. Fig.10-14. Creating a new report template. The report templates are created as Microsoft Word documents (same as reports), of names "Report template (#)" where # is a number. When you create a report template, the corresponding Microsoft Word document is automatically opened. 10.4.2 EDITING TEMPLATES The constant parts of the report templates are edited directly in Microsoft Word. The Microsoft Word document, corresponding to the report template, is automatically opened when you create a new template. To manually open the corresponding document, click with the right mouse button on the name of the template you wish to open and select the "Show report" command. Fig.10-15. Opening a report template in Microsoft Word. © SVANTEK - 123 - SvanPC++ User Manual To edit the templated objects, you can use the Report Template Editor dialog box. This dialog box is opened automatically when you create a new template. To manually open the Report Template Editor, click with the right mouse button on the name of the template you wish to edit and select the "Edit report template" command. Fig.10-16. Opening the Report Template Editor. Note: The templated objects are added to the Microsoft Word document in the form of comments, assigned to the text "SvanPC++". These comments contain code understandable by the SvanPC++ application; it is advisable to edit templated objects with the use of the Report Template Editor and not to modify the corresponding comments directly in Microsoft Word. Report Template Editor Fig.10-17. Report Template Editor dialog box. © SVANTEK - 124 - SvanPC++ User Manual The currently edited template's name is displayed in the "Current template" field, at the top of the window. The templated objects, contained in the current report template, are listed in the Templated objects list, located at the left side of the window. To add a new templated object, you can do one of the following: Press the Add button. Select a templated object on the list and press the Duplicate button. A copy of the selected object will be created. Select an object from the Project Browser list and drag it to the Templated objects list. The new objects can be added: at the current location of the cursor in Microsoft Word or at the end of the report template document To decide, use the buttons in the panel signed Place templated object at, located at the right side of the window. Note: If a Microsoft Word warning window appears, saying that comments must be added to the main text, it means that the cursor in Microsoft Word is currently located in a comment text, where it is impossible to add templated objects. To add a templated object, you must move the cursor in Microsoft Word outside of the comments. To edit the templated objects, use the Template object editor. It is opened automatically when you add a new templated object or drag an object from the Project Browser and drop it to the Templated objects list. You can also activate it manually by selecting a templated object from the list and pressing the Edit button. It allows for specifying the data source and parameters of the templated object. There are several types of data sources for the templated objects: View – a SvanPC++ view, such as described in Section 4.3. Parameter – the value of a measurement parameter Special result – the result of calculations, representing a single value (e.g. penalty factor in case of tonality measurements) Result – the result of measurement or calculations Tag value – the value of a tag, of specified category, assigned to a particular object. Template constant – a parameter that will be constant for all reports generated using the particular template. Microsoft Excel Chart – a chart in Microsoft Excel format. You can select the source type for the current templated object using the Source type menu. If the Path option is checked, object from the specified path will be used as the source for the templated object. Otherwise, all the objects satisfying the specified criteria will be searched. The Path field is filled automatically when a templated object is created by dragging an object from the Project Browser to the Report Template Editor. © SVANTEK - 125 - SvanPC++ User Manual Fig.10-18 The Template object editor. The source parameters can be configured to specify the data source for the templated object. Various parameters are available for different source types. If you want use one of the parameters to define the source, check the control next to its name and select the desired value. Table 10-2 Source parameters available in the Template object editor. Parameter name Source types Function Window type View Enables to select one of the view sub-window types with which the templated object should be replaced. View type View Enables to select one of the view forms in which the view should be displayed. Parameter type Parameter Enables to select the parameter with which the templated object should be replaced. Special result Special result Enables to select the kind of special result with which the templated object should be replaced. Spectrum type Parameter, Result, Special result, Tag value Enables to select the domain of the data used as the source for the templated object. © SVANTEK - 126 - SvanPC++ User Manual Function type Parameter, Result, Special result, Tag value Enables to select the function (measured or recalculated) which should be used as the data source. Value type Parameter, Result, Special result, Tag value Enables to select with what type of result the templated result should be replaced: Standard - value received from a Svantek instrument, Running / total - values obtained with the use of the Calculator tool. Channel Parameter, Result, Special result, Tag value Enables to specify the channel number used for the measurements of which results should be used. Profile Parameter, Result, Special result, Tag value Enables to specify the profile number used for the measurements of which results should be used. Result type Parameter, Result, Special result, Tag value Enables to specify whether logger or simple results should be used. Calculated result Parameter, Result, Special result, Tag value Enables to specify whether results of calculations should be used or not. Cumulated result Parameter, Result, Special result, Tag value Enables to specify whether cumulated results of calculations should be used or not. Marker name Parameter, Result, Special result, Tag value In case you wish the templated object to be replaced with the results of calculations performed in time periods determined by a marker, this parameter enables to specify the name of this marker. Time range Result Enables to specify a range of the time domain from which the results should be taken. The time range can be configured using the Time range dialog box. Frequency range Result, Excel Chart Enables to specify a range of the frequency domain from which the results should be taken. The frequency range should be specified by typing the minimum and maximum frequencies in Hz, separated by a hyphen. It is possible to select multiple ranges, separated by a comma. (e.g.: “1.000-2.000,8.000-16.000”) © SVANTEK - 127 - SvanPC++ User Manual LN range Result, Excel Chart Enables to specify a range of the LN domain from which the results should be taken. The LN range should be specified by typing the minimal and maximal LN values, separated by a hyphen. It is possible to select multiple ranges, separated by a comma. (e.g.: “L80,L90,L95-L99”) RT60 results filter Result, Excel Chart Enables to select methods for reverberation time calculation of which results will be enclosed in the report. Logger total result Parameter, Result, Special result Enables to specify whether logger total results should be used or not. Tag category Tag value Enables to specify the category of tag for which value will be enclosed in the report. Tags query All Enables to specify a query for finding source objects using Data search tools, described in Section 10.5. Name Template constant Name of the template constant parameter. Value Template constant Value of the template constant parameter. The time range can only be specified using the Time Range dialog box (Fig.10-19). It can be given in absolute or relative time values: Absolute - time values represent the actual measurement time, as saved in the results file. Relative - the first sample time is set as 00:00:00 of the first day of the measurement and all the later sample times represent the time passed since the measurement of the first sample. To select the time type, use the buttons in the upper part of the window. Moreover, the time range can be composed of several separate time periods. To add a time period you have to: 1. Specify the Begin time of the new period: To select the date, use the button, which activates the calendar window. To select the time, click on the hours, minutes or seconds and increase / decrease the value using the buttons. Note: In case of relative time values, the date is unavailable. 2. Specify the End time of the new period in the same way as the Begin time. 3. Press the Add button. © SVANTEK - 128 - SvanPC++ User Manual 
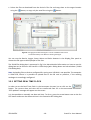
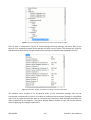
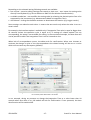
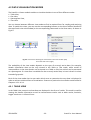
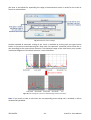
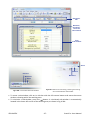
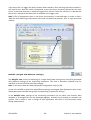
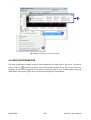
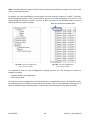
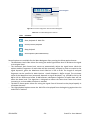
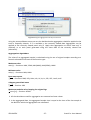
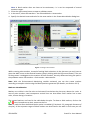
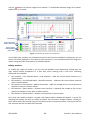
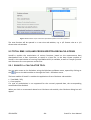
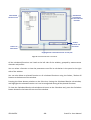
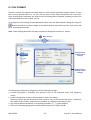
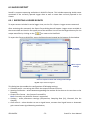
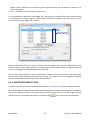
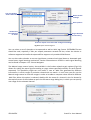
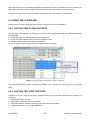
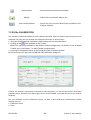
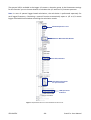
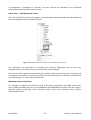
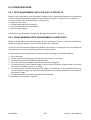
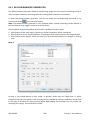
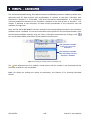
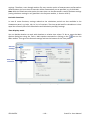
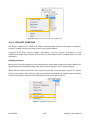
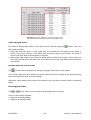
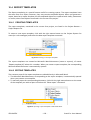
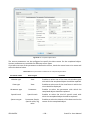
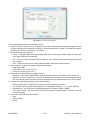
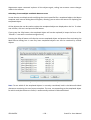
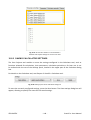
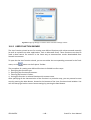
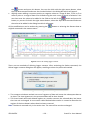
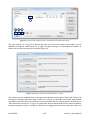
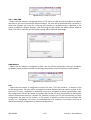
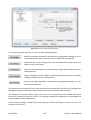
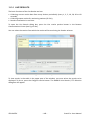
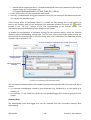
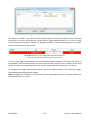
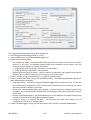
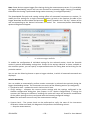
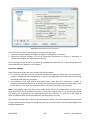
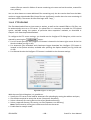
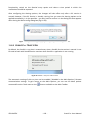
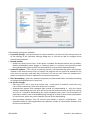
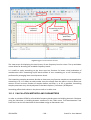
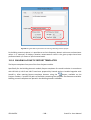
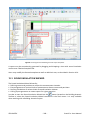
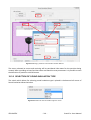
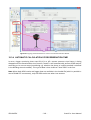
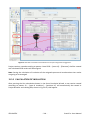
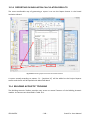
Fig.10-19 The Time range dialog box. The Formatting parameters tab enables one to: Specify a text string that will be enclosed in the report instead of the templated object in case no data satisfying the conditions specified in Source parameters is found. To enable this option, check the If no source is matched... checkbox. Select to format the results as: o Table - a standard Microsoft Word table with rows containing individual data and columns referring to different information, o List - a list of results with each data in separate lines, different information being separated by a comma, o Text - results in raw text form with individual data contained in separate lines. Select the unit in which the results should be displayed: o Logarithmic (dB) o Linear metric (Pa, m/s2, m/s, m) o Linear non-metric (g, ips, mil) Select the time domain type in logger results: o Absolute - time values represent the actual measurement time, as saved in the results file. o Relative - the first sample time is set as 00:00:00 of the first day of the measurement and all the later sample times represent the time passed since the measurement of the first sample. Configure the following settings of the values display: o Format (Fixed-point / Scientific) and Precision of the displayed numbers, o The symbol used as the decimal separator in all displayed numbers ( , / . / system default), o dB resolution - the precision of displaying logarithmic values (0.1dB / 0.01dB) o Time span format - the way time values are formatted, including hours, minutes, seconds and milliseconds. Select the information to be included: o Unit, o Result header, o Result. © SVANTEK - 129 - SvanPC++ User Manual The View parameters are available if the source type for the templated object was specified as View. The Plot parameters allow for configuring graphic options, such as axis limits and background color, in case the source is a Plot view, if you want them to differ from the options configured in Main Options / Graph view and Local Plot Settings. The Units panel allows for selecting units in which sound and vibration levels will be presented in this template object. The Visible results query allows for filtering the data using Data search tools. To save the settings and close the Template object editor, press the OK button. Pressing the Cancel button will discard the changes and close the Template object editor. Including templated Microsoft Excel charts In order to include a Microsoft Excel chart in a report template, it is necessary to go through the following steps: Insert an Microsoft Excel Chart object in the Microsoft Word document corresponding to the edited report template (Insert >> Object >> Object >> Microsoft Excel Chart). Still in Microsoft Word, define data series for the chart and configure the look of the chart. Select the chart in Microsoft Word. Note: The chart should not be opened in editing mode in Microsoft Word; you have to quit editing and simply click on the chart in order to select it. In the Report Template Editor, add a new Templated object and in the Template object editor define its Source type as Microsoft Excel Chart. Specify the chart's parameters in the Source parameters tab and assign SvanPC++ tag queries to Excel's data series in the Excel chart parameters tab. To add/remove a serie, use the Add and Remove buttons located below the series list. To edit serie parameters using Data search tools, use the panel located to the right of the series list. In order to specify the function that will constitute the source of data for an Excel chart's data series, the Source function tag query should have the form: Results = [...] It is also possible to add further conditions for the data series, such as e.g.: Results = PEAK AND Filter = C Upon generation of reports, SvanPC++ fills the charts with data by using tag queries to search for measurement results that fit to Excel's data series. In the Formatting tab you can also decide whether to include also units, headers, and results (Fig.10-20). If you decide to include headers, the names of the series will modified. © SVANTEK - 130 - SvanPC++ User Manual Fig.10-20 Formatting parameters of a templated Microsoft Excel chart. 10.4.3 GENERATING REPORTS FROM TEMPLATES The main purpose of using report templates is to easily create reports, containing constant text parts together with templated objects, depending on the results files and other project objects. To generate a report based on a report template, drag a session that you want to use with the template from the Project Sessions branch and drop it on the template in the Project Reports branch. If there is only one file/session in the current project, you can also use the Generate report from template command, available after clicking on the template with the right mouse button. Fig.10-21. Generating reports from templates. After the generation of a new report, it will be placed in the Project Reports list. The corresponding Microsoft Word document will be automatically opened. All the templated objects will be replaced with proper text, tables, pictures etc. The report can also be generated in the PDF format by using the Generate PDF report from template command. The Regenerate report command generates the report again, replacing all the templated objects that have not been replaced during its previous generation. No new report file is created; if there are no non-replaced templated objects, the Regenerate report command has no effect. Note: If the report was generated with the Keep templated objects when generating report from template option (it is available in the Projects Toolbar, described in Section 10.3), information about templated objects is stored in the report even if they have been replaced; in that case, the © SVANTEK - 131 - SvanPC++ User Manual Regenerate report command replaces all the objects again, taking into account recent changes made in the sessions. Selecting from multiple available data sources In case there are multiple results satisfying the criteria specified for a templated object, the Report template multi sources dialog box will appear, allowing you to select the source for replacing the templated object. All the objects that can be used to replace the templated object are displayed on the list. To select one of them, click on it and press the OK button. If you press the Skip button, the templated object will not be replaced (it keeps the form of the "SvanPC++" text with a comment assigned to it). Pressing the Skip all button will skip the current templated object and prevent from activating the Multi-sources dialog box in case any later templated objects can also be matched by several objects. Fig.10-22. Report template multi sources dialog box. Note: To see which of the templated objects is currently considered, look in the Microsoft Word document containing the used report template. The text, corresponding to the templated object for which multiple sources are found, is automatically selected in Microsoft Word. © SVANTEK - 132 - SvanPC++ User Manual Generating reports series A series of reports can be generated separately for multiple different datasets at once by using the "Generate reports serie" command. The selection of Project Objects, for which reports will be generated, can be done using a dialog box which appears after activating this command. Fig.10-23. Dialog box allowing for the selection of Project Objects used for generation of a project series. Objects can be selected by checking the checkboxes next to their names in the list located at the right hand side of this dialog box. This list is filtered according to a tag value selected in the Select tag category listbox. Reports in the series can be generated in the PDF format; to do so, enable the Convert reports to PDF option. Additional options You can enable / disable the Keep templated objects when generating report from template option using the button, available in the Projects Toolbar. If it is enabled, the Microsoft Word comments that serve for storing templated objects are not removed during the generation of reports. Therefore, the generated reports remain valid report templates, although templated objects are replaced with proper data and figures. The Automatically create missing sessions option can be used to specify the program's behaviour in case none of the sessions contained in the current project fits the parameters of a templated object of View type: if this option is disabled, the templated object is skipped. if this option is enabled, SvanPC++ will try to generate a new session to fit the templated object's parameters. To enable/disable this option, use the button. Note: The automatic generation of sessions is done according to tag queries, defined in the Tags query and View parameters >> Visible results query fields in the Template object editor. Results that fit these queries are searched and used for the creation of a new session. © SVANTEK - 133 - SvanPC++ User Manual 10.4.4 PREDEFINED REPORT TEMPLATES Except of report templates that you can create by yourself using methods described in previous sections, several predefined templates are also provided in SvanPC++. To gain access to them, open the Report Templates Browser using the button (available on the Projects Toolbar) or using the Report templates browser command available in the menu opened by clicking with the right mouse button on Project Reports in the Project Browser (Fig.10-24). Fig.10-24 Opening the Report templates browser. To use a predefined report template, find it on the list and click on its name with the right mouse button. The menu that appears allows for the following options: Copy template to project - includes the selected report template in the Project Reports list of the current project, so you can work with it in the same way as with any other report template. Generate report from template / Generate PDF report from template / Generate report serie creates a report / a report in PDF format / a series of reports, respectively, using the selected predefined template, in the same way as in case of ordinary report templates, as described in Section 10.4.3. The Preview panel, located at the right hand side of the Report templates browser window, displays the selected report template. Note: You can also add your own, custom report templates by dragging them from the Project Browser to the Report templates browser's list. © SVANTEK - 134 - SvanPC++ User Manual Fig.10-25 The Report templates browser. The predefined report templates can also easily be applied for generation of reports using the Generate report Wizard. You can open it using the button, located on the Projects Toolbar. Fig.10-26 The Generate report wizard. To generate a report, simply select a folder in the list of available reports templates and press Next; the Wizard automatically finds data that fit the templates in the selected folder. Note: A report can be generated using the Wizard only if a template fits the data in 100%, i.e. all the templated objects can be replaced. Otherwise the template is considered as not matching the results in the current project and the report is not generated. © SVANTEK - 135 - SvanPC++ User Manual 10.5 DATA SEARCH The Data Search tool serves to find files contained in the current project, satisfying specified conditions, such as a certain filename or measurement time. The files are searched with the use of tags, assigned to them automatically or manually. 10.5.1 TAGS Each tag consists of two objects: a category and a value. The category specifies the type of information given in the tag, while the value contains the specified data for the object, to which the tag is assigned. There are three types of tags, defining the type of provided data: Text, Number and Date. The tags are divided into two groups: Automatically assigned tags - these tags are created automatically and contain information about the measurement and the file. This group of tags cannot be modified. User tags - these tags are assigned to the object manually and can contain any category or value, defined by the user. Note: Tags are only used by the Data Search tool. Tags can be added to objects from the Project Objects list (files, folders, channels) and to Project Sessions. To view or edit tags for a selected object, click with the right mouse button on its name in the Project Browser list and in the pulldown menu choose the Tags command. Fig.10-27. Opening the Tags dialog box. After activating the Tags command, the Tags dialog box will appear. © SVANTEK - 136 - SvanPC++ User Manual Fig.10-28. Tags dialog box. The Automatically assigned tags and User tags lists are automatically filled with tags assigned to the object currently selected in the Project Browser list. It is possible to assign a new tag to the selected object, edit a User tag already assigned to it or remove an already assigned User tag, using the buttons located at the bottom of the window. You can also remove a selected User tag from all the sub-items, contained in the selected Project Object. To create a new User tag, use the User tags definition dialog box. It can be opened by pressing the Edit user tags definition button, located at the lower-left corner of the Tags dialog box. © SVANTEK - 137 - SvanPC++ User Manual Fig.10-29. User tags definition dialog box. This dialog box can also be opened with the User tags definition command from the Tools menu. The list on the left side (Category) contains all the tag categories already defined by the user. The list on the right side (Values) contains all the values available for the selected category. The Values list and the corresponding buttons are only available if a category is selected in the Categories list. You can use the Add, Edit and Delete buttons located below both lists to modify their contents. 10.5.2 PERFORMING DATA SEARCH To perform the search, use the Data search dialog box. It can be opened in two ways: using the Data search command from the Tools menu, using the © SVANTEK button from the Main toolbar. - 138 - SvanPC++ User Manual Search criteria configuration Press to perform search Current search query Results Fig.10-30. Data search dialog box. To use the Data search tool, you should do the following: 1. Specify a search query. 2. Perform the search using the Find now button. 3. Browse the search results, displayed at the bottom of the window. Building a search query A search query is conformed by several search criteria, each describing one category. An example of a search criteria could be: “Results class” = “Logger 1/3 Octave”. An example of a search query could be: “Results class” = “Logger 1/3 Octave” OR “Results class” = “Logger FFT”. To add a search criteria to current query, the following steps are necessary: 1. Specify a tag category. You can choose a category such as Measurement time start or File type from the list of all the available tag categories, created automatically as well as defined by the user. 2. Specify the condition type. You need to select the type of condition that has to be satisfied by the tag value. In case of tags with text values, you can choose whether the value should be given precisely or contain a given string. In case of tags with number / date values, you can select a numerical comparison operator. 3. Specify the tag value. There are 3 ways of specifying the value of the search criteria: a. Value - allows to choose a value from the list of all available values. b. User value - allows to type any value; this is particularly useful in case of the contain conditions. © SVANTEK - 139 - SvanPC++ User Manual c. Value between - allows to specify the range of the tag value, if the between condition has been selected in step 2. 4. Select the logical operator. If there already is a search criteria in the current query, you need to decide about the logical relation between the new and the already existent criteria. Note: The new criteria is only added at the end of the query with AND or OR; to create a more complex logical structure, you need to edit the text form of the query in the Search query field. 5. Press the Add search criteria button. The query is also displayed in text form in the Search query field. You can modify the query simply editing the text in this field: adding search criteria in the form: "<Tag category name>" <condition> "<Tag value>" adding logical operators: OR / AND adding brackets. Note: Manually adding brackets to the search query text is the only way to build a logically more complex search query. Using the search results You can use the results of the search in two ways: Clicking twice on a position in the Search results list will select it in the Project Browser and close the Data search dialog box. You can then work with the file using the Project Browser. Clicking on a position in the Search results list with the right mouse button will open a pulldown menu, containing various options, depending on the type of the result (object / session). The menus work in an analogous way to those described in Chapter 10.2: Using the Project Browser. Fig.10-31. Using the search results. When you open a session using the search results, the Data search dialog box will automatically be closed. © SVANTEK - 140 - SvanPC++ User Manual 10.6 OTHER FEATURES OF THE SVAN PROJECTS 10.6.1 MULTI-SOURCE SESSIONS When working with a Svan Project, you can view data contained in multiple files simultaneously. To create a multi-source session, select all the desired data files on the Project objects list, click with the right mouse button and select the data you wish to view. Fig.10-32. Creating a multi-source session. It is also possible to manually add data from any file to a session by using the drag-and-drop technique: 1. Select the data on the Project Objects list, from the Channel or Profile folder attached to a results file. 2. Move the data without releasing the mouse button to the name of the desired view on the Project Sessions list. 3. The data will appear in the Data folder attached to the particular session. 1 2 3 Fig.10-33. Manually adding data from a Project Object file to a Project View. © SVANTEK - 141 - SvanPC++ User Manual Merging modes The multi-source data can be merged in three different modes: Multifile, Absolute, Relative. To select the merging mode, you can use the button, located on the Projects Toolbar. In the Multifile mode, files are merged in the same way as in case of multifiles (see Chapter 3.2.3: Merging files), allowing to plot the results of a measurement in different time points, stored in separate files. The Absolute and Relative modes allow to display and compare the results of various measurements stored in separate files, e.g. logger-type results from different measurers, in the same session. In the Absolute mode, the actual time of measurement is considered, enabling to compare the differences between different measurements performed in the same time. In the Relative mode, the start point of all measurements is equalized. It allows to compare multiple measurements in one session when the actual measurement time is not significant. The scale of the time axis is relative, common for all viewed results. Viewing multi-source data When multi-source data is viewed on a plot, the source file of currently viewed functions is specified in the functions list below the plot area, as presented in Fig.10-34. The file name as well as its location in the current project is given in the Source column. Fig.10-34. List of viewed functions in case of multi-source sessions. In the View configurator list, an additional branch containing information about the source of data is added on the top of the hierarchy for each viewed file, as illustrated in Fig.10-35. © SVANTEK - 142 - SvanPC++ User Manual Fig.10-35. View configurator for multi-source data. In the table located above the plot area, the name of the file being the source of data in the active function is also given. Fig.10-36. Data source specified in the Active function table. Calculations on multi-source data When performing calculations with the use of a multi-source session, the Channels and profiles settings of the SvanPC++ Calculator enables to select which files should be used for the calculations. To select data for calculations, check the boxes next to the desired filenames. For details on the Calculator tool, see Chapter 9: SvanPC++ Calculator tool. © SVANTEK - 143 - SvanPC++ User Manual Fig.10-37. Source files selection in the Calculator’s Channels and Profiles settings for multi-source data. 10.6.2 SAVING CALCULATOR SETTINGS The Svan Projects tool enables to store the settings configured in the Calculator tool, such as functions selected for calculations, their parameters, calculation periods etc. for later use. It can be realised with the use of the Settings panel, located in the upper part of the Calculator dialog box. For details on the Calculator tool, see Chapter 9: SvanPC++ Calculator tool. Fig.10-38. Settings panel of the Calculator dialog box. To store the currently configured settings, press the Save button. The Save settings dialog box will appear, allowing to specify the name for the saved settings. © SVANTEK - 144 - SvanPC++ User Manual Fig.10-39. Save Settings dialog box. After saving the settings, they are available to load by using the <select saved settings> pulldown menu, containing a list of settings with the names specified during saving. The settings can also be loaded any time for calculations in another Svan project. Pressing the Delete button deletes the currently selected settings. Pressing the Clear settings button deselects all functions and sets all options to default. The Calculator Settings Toolbar provides quick access to saved calculator settings. You can show/hide it using the Calculator Settings Toolbar command, available in the View menu. Fig.10-40 The Calculator Settings Toolbar. Different settings can be assigned to each of the four buttons. If a button has no settings assigned to it yet, only a number is displayed in its center (3 and 4 in figure above). Press the button to assign settings to it. In case of buttons which already have settings assigned to it, name of settings is displayed instead of the number (1 and 2 in figure above). Click with left mouse button to run calculations according to the saved settings. Click with right mouse button to assign different settings. When you assign (or reassign) settings to a button, the Calculator settings dialog box appears. Select desired settings and press the OK button, or select <not defined> to leave the button without settings assigned to it. © SVANTEK - 145 - SvanPC++ User Manual Fig.10-41 Assigning settings to a button of the Calculator Settings Toolbar. 10.6.3 USER FUNCTION WIZARD The User function wizard serves for creating user-defined functions with values entered manually (as well as copied from other applications, such as Microsoft Excel). These functions can then be used as data source for sessions in the same way as measurement results downloaded from Svantek instruments. To open the the User function wizard, you can use either the corresponding command in the Tools menu, or the button on the Projects Toolbar. The procedure of creating user-defined functions is divided into four steps: 1. Specifying the function type. 2. Specifying the function parameters. 3. Entering the function’s values. 4. Saving the function in selected location with custom name. After specifying all the characteristics of the function in a particular step, you can proceed to next step by pressing the Next button, located at the bottom of the User function wizard window. You can also always go back to correct some settings by pressing the Back button. © SVANTEK - 146 - SvanPC++ User Manual Step 1 Fig.10-42 Step 1 of the User function wizard. In Step 1 you can select the type of quantities (sound level/vibration level) and particular parameter (e.g. Leq or the range of a marker) that will be represented by the values of the new function, as well as the function’s domain (time—for Logger-mode functions—or frequency: 1/1 Octave, 1/3 Octave or FFT). © SVANTEK - 147 - SvanPC++ User Manual Step 2 Fig.10-43 Step 2 of the User function wizard. In Step 2 you can specify parameters of the new function, viz. the units in which its values will be entered and several parameters describing the function’s domain and target set, as well as simulating the configuration of a measuring instrument. © SVANTEK - 148 - SvanPC++ User Manual Step 3 Fig.10-44 Step 3 of the User function wizard. In Step 3, you can enter the values of the function. You can do it in two different ways: Typing the numbers manually; after entering a value you can proceed to subsequent cell by pressing ENTER or the Add new value button. Copying values from another application, e.g. Microsoft Excel or a text-processing application. In order to do so, copy selected numbers from the other application to the clipboard, then go back to the User function wizard, select a cell and press CTRL+V. The copied series of numbers should have the form of a table column, or numbers separated by the End-of-line character. You can also copy a fragment of the function from the User function wizard itself. Note: Before copying, the table cell in which the copied series should start has to be selected, i.e. it should be highlighted in blue, but it should not be in text-editing mode (which is marked by the presence of the text cursor flashing in its center). You should not leave any field empty or enter text strings that do not represent numbers; otherwise you will not be able to proceed to next step. © SVANTEK - 149 - SvanPC++ User Manual Step 4 Fig.10-45 Step 4 of the User function wizard. In Step 4 you can specify a name for the new function and select location where it will be stored (the Project Objects catalogue or one of its subcatalogues). After pressing the Finish button, the new function is created and ready for using it in a session. The user-defined functions are displayed in the Project Objects list of the Project Browser in the same way as imported files. They are stored in the form of .SVU files. 10.6.4 EDITING LOGGER CONTENTS With the Projects module activated it is possible to modify logger-type data downloaded from a Svantek instrument. There are three ways in which logger data may be modified: deleting, clipping, shifting. The effects of editing concern all the data if no block selection has been made. If there is a block selection, the modifications only concern the selected data. The Delete tool affects all the functions in the selected time range, while the Clip and Shift tools only affect the visible functions (the ones selected in the View Configurator). To delete data, select a range of time and press the button, or click with the right mouse button and select the Delete data command. Clipping means truncating all data above a specified threshold; the truncated values are replaced with the threshold value. To clip data, enter the threshold in the field to the left of © SVANTEK - 150 - SvanPC++ User Manual the button and press this button. You can also click with the right mouse button, select the Clip data command and enter the threshold value in the dialog box which will appear. Shifting means adding a constant positive or negative value to a range of data. To do so, first select a point or a range of data to be shifted using the main cursor or blocks of selection. You can then enter the value to be added in the field to the left of the button and press this button, or you can click with the right mouse button, select the Shift data command and enter the value to be added in the dialog box which will appear. All the modifications can be undone by pressing the original command in the context menu. button or selecting the Restore data to Fig.5-15 Controls for editing logger contents. There are two methods of deleting logger contents. After activating the Delete command, the Delete logger contents dialog box will appear, enabling to select the preferred method. Fig.5-16. Delete logger contents dialog box. The compress timebase method cuts out a fragment of data and moves the subsequent data to its place. The time signatures in the processed data will be then altered. The insert breaks and mark deleted regions as a marker removes the selected data, but leaves the time axis unchanged. A new marker called Deleted data marker is created to describe the regions of the time domain where data has been removed. Note: The data is removed only in the active view. The source files remain unchanged. © SVANTEK - 151 - SvanPC++ User Manual 11 REMOTE COMMUNICATION MODULE SvanPC++ Remote Communication is an additional module of the SvanPC++ software suite that focus on remote acquisition and presentation of data coming from Svantek measuring instruments in continuous operating mode. To use this module, it is necessary to acquire Remote Communication key for each instrument that is to be used with the module. The RC Module enriches the SvanPC++ software with the following features: On-demand and automatic remote data download from SVAN instruments, Measurement status monitoring and verification, system check, alerting, Remote instrument configuration and control, Tools for data export and publishing. Most of the RC module functionalities can be accessed from the Remote Communication Center window. To open it, use the Remote Comm Center command in the Remote Communication ( ) pulldown menu available on the Toolbar, or the SVAN menu » Remote Communication... » Remote Communication Center command. This window is described in more detail in Section 11.2.1. Several interactive guides to the RC module are available on the Svantek website. 11.1 REMOTE CONNECTION The RC Module supports the following connection methods: Direct connection by RS232 (single device) or USB cable (many devices), Internet (GPRS), Wi-Fi/LAN (MOXA), Bluetooth, ZigBee. The connection settings can be configured manually. You can also use the Remote Connection Wizard, a tool which allows to configure both instrument (or monitoring station) and PC for communication using Internet or Local Area Network / Wi-Fi. 11.1.1 MANUAL CONFIGURATION OF CONNECTION SETTINGS The settings concerning all SvanPC++ remote communication modes can be configured with the use of the Remote Settings dialog box. It can be opened using the SVAN menu » Remote communication... » Advanced Settings... » Remote Settings command from the SVAN menu, or by using the button in the Remote Communication Center. Note: Any changes made in the remote connection settings while an RC session is running will only take effect after the session is restarted. © SVANTEK - 152 - SvanPC++ User Manual Connection type Selecting a connection type affects all aspects of remote communication in SvanPC++. Choosing one of the five connection types enables a set of options available for the particular connection type. Fig.11-1 The Remote Settings dialog box. For USB and RS232 connections, it is possible to set: Buffer size for block operations - concerns the situation when file downloading from the SVAN instrument is supported in block parts instead of downloading whole files at once. The adjusted value determines the size of the file parts downloaded at once. Timeouts – determine the time limits for retrying a reading or writing action if it cannot be successfully accomplished due to connection problems. In case of Harvest GPRS Modem connection, the Read settings and Send settings buttons can be used to exchange the current settings with the instrument / monitoring station. For Internet connection, it is possible to set: Buffer size for block operations and Timeouts (same as in case of direct connection), Local IP – determined manually or automatically using the Check IP button, Note: If multiple network cards are available, the automatic checking will result in setting the number of the first of available cards. You can manually modify the number after setting it automatically. Timeouts – determine the time limits for retrying a reading or writing action if it cannot be successfully accomplished due to connection problems. Particular options for UDP and TCP protocols, such as the port number etc. Note: Different sub-types of Internet connection are available and can be selected for each station independently. For details, see Section 11.1.2. © SVANTEK - 153 - SvanPC++ User Manual For ZigBee connection, it is possible add, remove and configure networks, and set timeouts. Simple mode In the Simple mode, USB connection is automatically detected. If no instruments are connected via USB, the active connection type (Internet or Local area network) is set as selected in the Connection configuration wizard. It is mentioned in the message on the bottom of the window. Simple mode uses the list of instruments defined by Remote Connection Wizard and does not allow for adding or removing defined instruments outside of the wizard functionality – it's only valid for Internet connection type. Moreover, setting the Simple mode disables the Internet settings. These settings are configured automatically. Note: If you use the Remote connection wizard to connect instruments, the Internet settings will be configured and the Simple mode will be enabled automatically. Common settings In the Remote Settings dialog box it is also possible to set: Retry Counter and Retry timeout – if the connection is lost, the service will try to reconnect only the number of times given in the Retry counter field and not longer than the time specified in the Retry timeout field. If the number of trials or amount of time before a successful reconnection exceeds the specified limits, the application will quit to reconnect. Station AS password – password used by the service when connecting to the Svantek server if communication in the AS system is enabled. 11.1.2 INTERNET CONNECTION TYPES Since the release of version 1.6.1 of SvanPC++, the RC module supports communication with multiple stations using different types of Internet connection simultaneously. (For details on the consequences of updating the RC module, see Section 11.7.) The available connection types include: TCP/IP (Address Server or AS), TCP Client, TCP Manual, TCP / UDP CRP, UDP Manual, FTP. The connection type is defined for each station separately at the moment the station is added in Remote Communication Center (described in Section 11.2.1) or Svan Files windows. © SVANTEK - 154 - SvanPC++ User Manual 1 2 3 4 Fig.11-2 Connection-type-related controls in the Remote Communication Center. The Type column (‘1’ in Fig.11-2) denotes the type of the internet station. New station can be added by clicking the “Add” button (‘2’ in Fig.11-2). Upon clicking it, a new window will appear, in which you can select the type of the station (Fig.11-3). Fig.11-3 Selecting the internet connection type for a station. The stations can be modified later by using the two buttons to the right of the “Add” button. By clicking the “Change connection type” button (‘3’ in Fig.11-2), the Select connection type window will appear and you will be able to select a new connection type for existing station. By clicking the “Edit instrument” button (‘4’ in Fig.11-2), you will be able to change details of the station based on selected connection type. It should be noted that changing the connection type alone does not © SVANTEK - 155 - SvanPC++ User Manual adjust any settings and, most likely, editing the station’s details is also required afterwards. The particular connection types are described below. TCP/IP (Address Server) – means that the station is configured as TCP Server and is to provide its address on Svantek Address Server. Upon selecting this type, the user will be presented with a window, in which they must input unit type, unit number and AS password. Such station will be communicated with by first downloading the current IP address from Svantek server and then by connecting to it. The AS password can be read from the Svantek instrument using the AS station password dialog box, accessible from the Remote Settings window (described in Section 11.1.1). Note: This connection type is denoted as “TCP AS” in the Remote Communication Center. Fig.11-4 Adding a TCP AS station. TCP Client – means that the station is configured to initiate connection to the client’s PC. Upon selecting it, a window that is listening for incoming connection will be presented to the user. Regardless of whether it is enabled in Remote Settings or not, it will listen on designated port for incoming TCP connections and adjust the setting accordingly should a station connect successfully during the procedure – once it happens, the connected station will be added as TCP Client. Fig.11-5 Adding a TCP Client station. TCP Manual – means that the station is configured as TCP Server. The user will be prompted to enter an IP address (or domain name) and port number for direct TCP connection. Note: This connection type should be selected in case of stations registered in DynDNS (SV 200). © SVANTEK - 156 - SvanPC++ User Manual Fig.11-6 Adding a TCP Manual station. TCP / UDP CRP – means that the station is configured either as TCP Server or UDP and will provide its IP address and port via the use of Connection Request Packets. The user will be presented with a window, in which the software will listen for incoming UDP packets on designated port, regardless if the option is enabled in Remote Settings. Upon receiving the CRP packet, the station will be added as either TCP CRP or UDP CRP and the proper setting will be adjusted accordingly. Fig.11-7 Adding a TCP / UDP CRP station. UDP Manual – means that the station is configured as UDP. The user will be prompted to enter an IP address (or domain name) and port number to exchange data packets with the station via UDP protocol. Fig.11-8 Adding a UDP Manual station FTP – means that the station is configured to utilize FTP push / FTP pull protocol – a feature of the SV 200 instruments. The user will be prompted to provide station type and number, as well as the name of FTP server, credentials to authorize access to it and paths to where measurement data and configuration file will be stored. The station will use the FTP push functionality to periodically upload measurement data to a known FTP location and will use FTP pull functionality to fetch configuration file from an FTP location. A FTP station in SvanPC++ means that the software will connect to a designated FTP server and download data (in SvanFiles and remote sessions) or upload the station’s configuration (in Station Configuration). © SVANTEK - 157 - SvanPC++ User Manual Fig.11-9 Adding an FTP station. 11.1.3 REMOTE CONNECTION WIZARD The Remote Connection Wizard automatically detects the capabilities of connected devices and chooses the optimum method for exchanging data. It then adds the configured stations to a list of devices, which is used as reference in all remote communication features. The only requirement is to know the APN – mounting point of the SIM card that is used with the station – and select between Internet and Local Area Network connection types. To open the Wizard, use the Connection configuration wizard command from the SVAN menu or from the pulldown menu opened with the the icon located on the Toolbar, or simply clicking on icon, if it is available on a customized Toolbar. Fig.11-10 The Remote Connection Wizard window. © SVANTEK - 158 - SvanPC++ User Manual The Remote Connection Wizard facilitates the configuration of connection with Svantek instruments by the following means: Internet When the Wizard is used for configuring Internet connection, all Internet settings are configured automatically and the Simple mode is enabled; see also: Remote settings. Ethernet (wired LAN) In this mode the Wizard allows for specifying the station's network address. Wi-Fi (in infrastracture and ad-hoc modes) In this mode the Wizard assists in the selection of network or its creation (only ad-hoc). To change the connection system, press the New connection system button (in the bottom-left corner of the window). The Select system type... dialog box will appear. Fig.11-11 The Select system type... dialog box of the Remote Connection Wizard. By pressing the More... button you can access more available connection systems. To hide them again, press the Simple button. Note: In case of Internet connection, the Wizard applies the same algorithm for each connected station independently in order to select connection type: first, the station is configured for TCP AS communication, and then it is determined whether the station can work as TCP Server or not (in the latter case, the configuration is changed to TCP Client). More instructions on how to connect your device using this Wizard are available on the SVANTEK website in the form of video tutorials. © SVANTEK - 159 - SvanPC++ User Manual 11.2 INSTRUMENT MANAGEMENT AND CONFIGURATION 11.2.1 REMOTE COMMUNICATION CENTER The Remote Communication Center dialog box is the heart of remote communication in SvanPC++ software. It allows for: managing instrument configuration, configuring and start automatic data acquisition methods, accessing alarm configuration, checking instrument status (measurement state or more detailed information, such as e.g. remaining logger space) and display its parameters, starting and stopping measurement in a connected instrument. To open the Remote Communication Center, use the corresponding command from the SVAN menu or from the customization). pulldown menu, or click on the icon (available only after Toolbar Fig.11-12a Remote Communication Center dialog box. The Instruments panel contains a list of connected instruments / stations. To fill the list with units you want to communicate with, initiate the connection using the Remote Connection Wizard (available from the SVAN menu). The AFD, CLD, LR and RS columns denote if a station is active in Automatic Files Download, Continuous Logger Download, Live Results and Remote Session respectively. (These tools for data acquisition are described in Section 11.3.) In case of Internet connection, the Type column is also displayed in the Instruments table to denote each station’s connection type. For details, see Section 11.1.2. Note: To connect a new instrument, you must assure that no RC sessions are currently in progress. If Simple Mode is enabled via Station Settings, adding or removing instruments outside of the © SVANTEK - 160 - SvanPC++ User Manual Remote Connection Wizard is not allowed. If direct cable connection is currently active, the list is updated automatically at the moment of connection / disconnection. The background of the Status field for the connected stations flashes in green in case when measurement is in progress. When the measurement is stopped, the background color of the Status field turns to red, as shown in Fig.11-12b. Fig.11-12b A row in the Instruments table in the Remote communication center. Flashing green background of the Status field means that measurement is currently in progress, while static red one – that the measurement is stopped. The buttons at the right side of the window allow for: Configuring the instrument’s settings (Station configuration), Downloading files from the instrument (SVAN Files) Communicating with instruments using various types of RC sessions (Automatic files download, Live results preview, Remote session, Continuous logger download), Configuring online alarms settings (Alarms), Stopping all the current RC sessions (Terminate RC service). To remotely start measurement in selected connected instruments, use the Start measurements button. To update the current measurement status of the connected instruments, use the Check instrument(s) status button. In case of stations connected via USB, the status is updated automatically. You can also display more detailed information about connected instruments by pressing the Toggle mode button. An additional part of the Remote Communication Center window is then opened, containing the values of several parameters such as free space, battery state etc. You can copy all the displayed data to the clipboard for later use pressing the Copy to clipboard button. © SVANTEK - 161 - SvanPC++ User Manual Fig.11-13 The details display in the Remote Communication Center. 11.2.2 STATION CONFIGURATION Station Configuration, accessible from the Remote Communication Center, is an extensive tool that allows configuration of an instrument/monitoring station. The availability of particular sets of options depend on the type of configured Svantek instrument. During the opening of this dialog box, the stations’ settings are downloaded automatically so you can work on the current settings. All the connected devices are listed on the left side of the window. The set of options available for configuration depends on the device. © SVANTEK - 162 - SvanPC++ User Manual Fig.11-14 Station(s) configuration dialog box. To communicate with stations, you can use the following buttons: sends the settings adjusted in the Station(s) configuration dialog box to all connected devices of the same type (e.g. all SVAN 979 instruments). downloads the current settings from the connected device and sets all the options to the read values. sends the settings adjusted in the Station(s) configuration dialog box to the selected device. opens a dialog box which enables to communicate with the station manually sending commands in the SVAN protocol. sends the settings adjusted in the Station(s) configuration dialog box to all the connected devices. The settings can be stored in a file in the local memory and restored in the Station(s) configuration dialog box using the Load Setup / Save Setup buttons (at the bottom of the window). To configure a connected station, select it from the list on the left side of the window and choose the type of settings you wish to modify. The settings available for configuration are grouped into several categories, described below. In the General settings, available after selecting the instrument/station’s name on the list, it is possible to (Fig.11-14): © SVANTEK - 163 - SvanPC++ User Manual Set a name for each connected station, Add a comment for each connected station, Set a Remote serial number different than the instrument’s S/N (this does not affect the device nor the connection), Enable the configuration of External interface settings (this control is enabled/disabled automatically during connection), Modify the set of available options (using the Instrument selector) – after the change, the particular options become available as if the selected instrument was connected and all settings are reset to default values, Set the Remote Control Mode, disabling all the device’s automatic messages, requiring manual control. The Measurement setup panel enables one to configure various measurement settings, such as: measured function, filter/detector for particular channels and profiles, logger settings of the connected instrument or station via your PC. The measurement settings are grouped into 5 subcategories: general measurement setup, Channels, Logger, Advanced and External I/O settings. Note: In case of measurers which enable configuration of audio recording options (e.g. SVAN 956, 957 or 959), Audio Events settings are also available as a subset of Measurement setup / Logger settings. This category of settings enable to configure various parameters of Wave and Event recording, such as sampling, format etc., reflecting the device’s functionalities. The Alarm settings panel enables one to configure the alarms in the form of SMS or e-mails, sent automatically when a specified level is obtained by the selected measured function. To enable SMS / e-mail sending, configure the SMS / e-mail and alarm activation settings and switch on the Send SMS / Send e-mail control. Note: If the Station with controller control is checked in the Station(s) configuration dialog box, different options are available. The alarm configuration is then available in the External interface tab. The External interface panel enables one to configure the settings of an external controller, connected with the Svan device. It is available only if the Station with controller control is checked in the Station(s) configuration dialog box. Note: The selection of alarm source and level value s based on settings in the instrument; alarm level value is displayed in proper units. The Remote communication panel enables to configure the connection settings, related to Internet connection and registration options. To enable configuration of these settings, uncheck the Skip remote connection configuration checkbox. Warning: Changing these settings through working Internet connection may cause the instrument to become unresponsive if settings are entered incorrectly. In case an SV 200 instrument is being configured, several sets of options specific for that type of instrument are also available: External I/O – enables one to configure an external device supporting the SV 200 monitoring station: a User Interface (for which Baud Rate and Timeout of serial transmission settings are available), or a Meteo module (for which the number of wind direction sectors can be specified). © SVANTEK - 164 - SvanPC++ User Manual Remote communication – for SV 200 instruments equipped with a LAN/Wi-Fi modem different settings are available than for other types of instruments, enabling one to configure wired connection (LAN) or wireless connection (in Infrastructure or Ad-hoc mode). Note: These settings are available for this type of instruments only if they are connected by USB; if they are connected remotely, the Remote communication tab is not displayed at all. Internet services – enables one to configure the Web Interface (select between static/dynamic mode, configure authorization settings, logins and passwords for admin and guest), and FTP (including server, login, PUSH and PULL frequency/path settings). System events – enables one to configure parameters related to alarms, activated in special situations that may occur for SV 200 instruments. If you leave the Station Configuration window without by pressing Cancel or ESC, the changes will not be applied for Automatic Files Download and/or Continuous Logger Download settings verification process. For this reason, a warning message is displayed and confirmation is requested to prevent accidental cancelling of the station configuration (Fig.11-15). Fig.11-15 A warning message displayed when cancelling the Station(s) Configuration changes. 11.3 DATA ACQUISITION METHODS The RC Module enables one to use remote connection modes for acquisition of measurement data from Svantek instruments. For manual data acquisition, you can use the SVAN Files dialog box, accesible from the Remote Communication Center or using the icon on the Toolbar. This tool is described in Chapter 3.2.1: Downloading Files from Instrument. In case of remote connection, the selection of instrument can be done by pressing the Change button and selecting a remote station from the list. The RC Module also provides several methods for acquiring data automatically: Live Results – allows for remote viewing of current results. Automatic Files Download – allows for downloading files periodically. Continuous Logger Download – allows for downloading logger results during measurement. Remote Session – allows for performing programmable measurement sessions. © SVANTEK - 165 - SvanPC++ User Manual 11.3.1 LIVE RESULTS The basic functions of the Live Results tool are: Collecting current results data from many devices periodically (every 1, 2, 5, 10, 20, 30 or 60 seconds), Collecting meteo results for monitoring stations (SV 21x), Results visualization in real time. To open the Live Results dialog box, press the Live results preview button in the Remote Communication Center (see Fig.11-12a). You can select the station from which the results will be read using the Station selector. Fig.11-16. Live Results dialog box. To view results in the table in the upper part of the window, you must select the results to be displayed. To do so, press the Configure results button. The WWW & Live Results / FTP Selection dialog box will appear. © SVANTEK - 166 - SvanPC++ User Manual Fig.11-17. WWW & Live Results / FTP Selection dialog box. This dialog box allows to: Select data to be displayed, Select data to be contained in HTML exported files, Select file types used for automatic uploading to an FTP server. During the opening of this dialog box, the current settings are downloaded from the device and the list is automatically filled with all the currently measured functions. To display a function in the Live Results Preview, check its corresponding Show in Live Results option. The data is refreshed automatically with the step adjusted in the Read step selector. To start / stop a Live results session, use the / button. The results will be updated when the selected reading time is reached. The button can also be used to stop a session, but in contrary to the Stop button it causes an immediate termination of the current action instead of waiting for its finishing. You can enlarge the displayed results simply by clicking on a cell in the results table. The Results focus window will appear, containing the enlarged data, as well as information about the displayed function (instrument, measurement settings, units). You can open multiple Result focus windows simultaneously. © SVANTEK - 167 - SvanPC++ User Manual Fig.11-18. An example of Live results enlarged view window. HTML publishing and FTP upload functions are available after activating the corresponding checkboxes in the lower part of the window. For details, see Chapter 11.4: Online Data Export. 11.3.2 AUTOMATIC FILES DOWNLOAD The basic functions of the Automatic Files Download tool are: Periodic result and/or logger files download with configurable period (hourly, daily, monthly or custom – with minimum step of 1 minute), Downloading files from pendrive, System check functionalities for monitoring stations (SV 21x), Periodic instruments' file storage clearing – with different period setting than for downloading, Log on all commands sent to the meter. Fig.11-19. Automatic files download dialog box. To open the Automatic files download dialog box, press the Automatic files download button in the Remote Communication Center (see Fig.11-12a). © SVANTEK - 168 - SvanPC++ User Manual The list in the upper-left part of the window contains information about the connected stations. Stations can be added to the list using the Remote Communication Center. The table in the upperright corner of the window contains information about an instrument selected on the list. Downloading files To start / stop the Automatic files download session, use the Start AFD / Stop AFD button in the lower-left corner of the window. The files will not be downloaded immediately, but only when the specified downloading time is reached. The Terminate button can also be used to stop a session, but in contrary to the Stop button it causes an immediate break of the current action instead of waiting for its finishing. It also terminates a single upload that is in progress at the moment of pressing the Terminate button, not waiting for its completion. You can also download the files without waiting by pressing the Download now button. This single download does not affect the automatic download process if it is started. To select the types of files to be downloaded (results / logger / stored on a pendrive), as well as to set the downloading time period (from 1 minute to 1 month), press the Options button in the lower-right corner of the window. The Automatic files download options dialog box will appear. Fig.11-20. Automatic files download options dialog box. You can also configure: The path where the downloaded files will be stored, Files naming mode: o use original file name – the downloaded files keep the same name as on the device, but an additional folder is created. The name of the folder is set using a specified prefix, the unit name and serial number, e.g.: C:\Program Files\Svantek\SvanPC++\AutoDownloadedFiles_SVAN_959_11295\01JAN0.svn © SVANTEK - 169 - SvanPC++ User Manual o append S/N to original file name – the downloaded filed names are created using the original name and the unit serial number, e.g.: C:\Program Files\Svantek\SvanPC++\01JAN0_SVAN_959_11295.svn Folder prefix used in the use original file name mode, Save log – enable/disable saving the command history for the automatic files download session in a .log file of a specified name. These settings affect all connected stations. To modify the files settings for a single station, go back to the stations table of the Automatic files download window and press the button, located in the “File Cnf.” column of the row corresponding to the desired station. The Instrument/station downloading options dialog box will appear. To enable the configuration of individual settings for the selected station, check the Override session’s general downloading settings box. The file path, naming and folder prefix settings are identical with the ones available in the File saving panel of the Automatic files download options (compare Fig.11-20 and 11-21). Press to configure settings for particular instrument Check to enable configuration Files downloading settings Fig.11-21 Modifying the files downloading options for a single instrument or station in an Automatic files download settings. The instrument individual options also enable to group the downloaded files from the same day or month: in a separate subcatalogue, named as year-month-day (e.g. 20140123) or as year-month (e.g. 201401), or as a multifile – in this mode only results files are grouped (logger files cannot be grouped in this mode). Clearing files The downloaded result and logger files can be removed from the instrument memory after downloading. © SVANTEK - 170 - SvanPC++ User Manual To enable automatic clearing, press the Options button and set the types of files to be removed (result / logger) as well as the clearing period (from 1 minute to 1 month) in the Automatic files download options dialog box (see Fig.11-20). The clearing period must be equal or longer than the downloading period. To manually download the files and clear all the already stored files, use the Download and clear now button. This single download / clear does not affect the automatic download process if it is started. System check The system check can be performed to verify the state of the instrument calibration. This diagnostic tool stops the measurements, modifies the instrument settings to fit a calibration measurement, performs instrument calibration and then resets the device to previous settings and restarts the measurements. Note: The system check is only available dor instruments with SLM functionality. To enable system checks, press the Options button and activate the Perform system checks (if configured) checkbox (see Fig.11-20). Once it is enabled, the Sys. Chk. column appears in the table in the Automatic Files Download window, containing buttons allowing for the configuration of system checks. Fig.11-22 The System check configuration button and window in the Automatic Files Download session. In the System check configuration window you can specify: when should system checks be performed (at files clearing or at particular time of day), values of system check parameters (background value for day and night, periods acknowledged as day and night, timeout value and maximum acceptable deviation of the calibration factor), © SVANTEK - 171 - SvanPC++ User Manual what should be done after system check (the calculated calibration factor can be sent to the station, depending on the success/failure of the system check), whether or not an alarm should be generated if calculated calibration factor is outside acceptable range. You can also manually run a system check using the Perform system check button at the bottom of the Automatic files download window. The system check interferes with measurements performed by the station; for this reason, you will be asked for confirmation before manually starting a system check. The table describing station’s details, at the top-right corner of the Automatic Files Download window, contains i.a. a field related to results of system checks: the Last sys. check status property. It may take the following values: “N/A” – means that system check has not yet been performed for this station. “Success (1.56 dB)” – means that system check has been successfully accomplished and the calculated calibration factor is in acceptable range; the number in brackets is the calculated value of the calibration factor. “Failed (4.78 dB)” – means that system check has been successfully accomplished, but the calculated calibration factor is outside of the acceptable range. “Failed (N/A)” – means that a system check was performed but has not been successfully accomplished. The reason for failure might be too high a level of background noise or other, unpredicted factors (the procedure stops repeating system check attempts after the amount of time specified in the background noise timeout field in the system check configuration window). Fig.11-23 Field related to the results of system checks in the table describing station details in the Automatic Files Download window. Except of the system check, it is possible to automatically perform system validation, which can be composed of: Time synchronization – updates the unit’s clock to the PC time, Verify settings – checks if the device settings are the same as specified in the Stations configuration dialog box; if not, updates the device’s settings. Note: The alerting feature allows for sending an e-mail alarm if instrument settings do not match while performing the Verify Settings procedure. For details on alerting, see Section 11.6.1. The system validation can be performed after each system check or after each automatic files clearing, as configured in the System validation panel of the Automatic files download options dialog box. © SVANTEK - 172 - SvanPC++ User Manual Data export You can enable to save the downloaded files in HTML format every time when files are downloaded from the instrument. The downloaded files can also be automatically uploaded to a specified directory on an FTP server. The HTML publishing and files uploading settings are available after pressing the Options button (see Fig.11-20). For details, see Chapter 11.4: Online Data Export. Note: When you enable the Publish HTML or the FTP upload option, two additional columns will appear in the Stations table. The WWW column contains buttons, which enable to select the data from the particular station to be published in HTML and the files to be uploaded to an FTP server. The WWW/FTP column contains information about the enabled data export options for the particular station (None / WWW / FTP / WWW FTP). Fig.11-24. Station table in the Automatic files download dialog box with columns concerning online data publishing. 11.3.3 CONTINUOUS LOGGER DOWNLOAD The Continuous Logger Download tool serves for short-period remote data acquisition from current logger, also enabling daily logger merging as well as verification of settings and system checking. To use the Continuous Logger Download data acquisition method, press the Continuous Logger download button in the Remote Communication Center (see Fig.11-12a). The Logger download session dialog box will be opened. Downloading logger results When you start a logger download session, all the logger files found in the instrument’s memory will be downloaded to the computer. If a logger-mode measurement is currently performed, a file containing all the already saved results is created for the current logger, and then it is continuously extended with the latest results during the measurement. The application also reacts when the logger measurement is stopped and a new one is started. © SVANTEK - 173 - SvanPC++ User Manual Fig.11-25a. Logger download session dialog box. The Station list table in the center of the window contains information about all the connected instruments / stations and about the current state of logger download activity. If an error occurs concerning connection with a station, the background color of the corresponding row in the table turns to red, as shown in Fig.11-25b. Fig.11-25b. Station list in the Logger download session dialog box. Red color indicates that a connection error has occurred. To start / stop logger downloading, use the Start/Stop button located in the lower-left corner of the window. The Terminate button can also be used to stop a session, but in contrary to the Stop button it causes an immediate break of the current action instead of waiting for its finishing. To configure the logger downloading options, press the Options button. The Continuous logger download options dialog box will appear. Note: Configuration of options is only possible if the downloading session is stopped. Otherwise, the Options button is inactive. © SVANTEK - 174 - SvanPC++ User Manual Fig.11-26. Continuous logger download options. The Logger downloading and saving panel enables to: Set the logger downloading period (1s ÷ 23h), Select the directory for the downloaded logger files, Select the file naming mode: o Use original file name – the downloaded files keep the same name as stored in the station memory. In this case, an individual folder needs to be created for every station. You can select one of two modes for naming the folders: a. Folder prefix (user-specified) + unit name + serial number b. Folder prefix (user-specified) + index number o Append S/N to original file name – the file name is created from the original name and the station's serial number. Folders are not created in case of this option. Enable - disable saving commands log in a .log file of specified name, Enable / disable daily data saving to a specified directory – the following additional options for daily data saving are available: o Auto daily merge - instead of saving all individual logger files, the files from the current day are automatically merged into one file. Its filename is composed of the measuring unit name and serial number and the current date. o Delete files from download folder after copying - the files which are already copied to the computer can be automatically deleted from the download folder when daily data saving is performed. o Archive downloaded loggers - the downloaded files can be copied to an archive folder except of the one selected for the daily data saving destination. o Compress archive to monthly ZIP files - the archived files from each month can be compressed in the form of a single ZIP file Enable / disable loggers clearing in the range where their results are already downloaded. © SVANTEK - 175 - SvanPC++ User Manual Note: Some devices support logger files clearing during the measurement process. If it is available, the logger downloading session will use this function for automatic logger clearing (if enabled). Otherwise the clearing is performed during station summary (in configured periods). The downloaded files path and naming settings affect all connected instruments or stations. To modify the files settings for a single instrument/station, go back to the Stations list table of the Logger download session window and press the button, located in the “File Cnf.” column of the row corresponding to the desired instrument or station. The Instrument/station downloading options dialog box will appear. Fig.11-27. Instrument/station downloading options dialog box for Continuous logger download. To enable the configuration of individual settings for the selected station, check the Override session’s general downloading settings box. Except of the settings identical to those available in the common options, you can specify a separate destination for saving data and archiving for the particular station. You can use the Show log button to open a Logger window, in which all executed commands are displayed. Station Summary You can enable to automatically perform station summaries in selected time periods during the logger downloading session. The summaries can consist of the following actions (as configured): Synchronize time – updates the unit's clock to the PC time. Verify settings – compares the current station settings with the settings configured in the Stations configuration dialog box (see Chapter 11.2.2: Station Configuration). If during the summary the settings are different, enabling this option will cause the automatic modification of the station settings so they correspond with the remotely configured settings. Note: The verification concerns only the measurement settings. System check – The system check can be performed to verify the state of the instrument calibration. When activated, this diagnostic tool performs the following actions: o Stop the measurements, © SVANTEK - 176 - SvanPC++ User Manual o Modify the instrument settings to fit a calibration measurement, o Perform a calibration measurement, o Reset the device to previous settings, o Restart the measurement. Note: The system check is only available for instruments with the SLM functionality. After enabling system checks, the System Check column appears in the table in the Continuous Logger Download window, containing buttons which allow for configuration of system checks. Fig.11-28 The System check configuration button and window in the Continuous Download session. In the System check configuration window you can specify: whether or not system checks should be performed at every Station Summary (if not, they will only be performed when requested manually), values of system check parameters (background value for day and night, periods acknowledged as day and night, timeout value and maximum acceptable deviation of the calibration factor), what should be done after system check (the calculated calibration factor can be sent to the station, depending on the success/failure of the system check), whether or not an alarm should be generated if calculated calibration factor is outside acceptable range. You can also set a time limit of waiting for the completion of the daily download. If the daily downloading is not finished within the specified amount of time, this action will be terminated and the summary actions will be performed (except if the Wait until daily download is complete option is set to "No timeout"). Publish WWW / SVN upload You can enable to automatically export the downloaded logger results to HTML format. The downloaded files can also be automatically uploaded to a specified directory on an FTP server. The © SVANTEK - 177 - SvanPC++ User Manual HTML publishing and files uploading settings are available after pressing the Options button. For details, see Chapter 11.4: Online Data Export. Note: When you enable the Publish HTML or the FTP upload option, two additional columns will appear in the Stations list table. The WWW column contains buttons, which enable to select the data from the particular station to be published in HTML and the files to be uploaded to an FTP server. The WWW/FTP column contains information about the enabled data export options for the particular station (None / WWW / FTP / WWW FTP). Fig.11-29. Stations list table in the Logger download session dialog box with columns concerning online data publishing. Note: Loggers that are not currently written by the instrument can also be exported in HTML/CSV format. 11.3.4 REMOTE SESSION The Remote Session consists of a programmable remote measurement session carried out over a specified time period, also allowing to: Display and download results, Download and clear logger results, Perform system check and verification of the station’s settings. To activate a Remote session, press the Remote session button in the Remote Communication Center (see Fig.11-12a). The Remote Session Settings dialog box will appear. © SVANTEK - 178 - SvanPC++ User Manual Fig.11-30 Remote Session Settings dialog box. The list on the left side of this window is composed of two parts: 1. Common settings enable to configure the general settings for all sessions. 2. Below the Common settings a list of all connected instruments or stations is displayed. It enables to configure the measurement settings. All the settings can be saved in .txt format and loaded later with the use of Save Setup and Load Setup buttons at the bottom of the window. Common settings In the Common settings tab you can select the Session Mode: The Transmit and receive mode stands for standard functioning, where after the instrument / station is configured and measurement is started, the application will acquire data by sending commands and collecting responses. The Configure, start and receive only mode means that after the instrument / station is configured and the measurement is started, the application will passively wait until data is sent by the device (in this case the application does not control the data to be received). Note: The Configure, start and receive only mode can be useful in a situation where results have to be acquired from one or multiple measurers in short time intervals (e.g. 0,5 s). Sending commands and waiting for responses by the application would be ineffective, in contrary to the mode in which the device sends results automatically, allowing better accuracy. The Common settings also enable to set the directory where the results obtained during remote sessions will be stored. Except of setting the path, you can also choose to create subcatalogues for the downloaded files. © SVANTEK - 179 - SvanPC++ User Manual You can choose one folder for all sessions (with a given name, with or without appended date and time). You can also choose to create an individual folder for each session. Its name is created from a given prefix and the Remote address of the session. There is also a possibility to automatically remove the subcatalogues where no files are saved during the remote sessions (Remove empty directories). The Commands logger enables one to save the commands exchanged during a remote session in a .LOG file of selected name. The Incoming connections and CRP packets option serves for automatic creating of new sessions triggered with incoming connections and CRP packets. The Result Web Publishing panel contains options for exporting the results into the HTML format and for uploading the files to an FTP server. In case logger files are selected for publishing, you can select the length of the time period from which the data will be uploaded using the selector in the Logger Web Publishing panel. The HTML publishing and FTP uploading tools are further described in Chapter 11.4: Online Data Export. Individual settings To set the start and stop time of the measurement session for a single instrument/station, select it on the list and go to Measurement settings. You can also start a session without specifying a time period: the session will start immediately after pressing the Start button, and stop only when requested to do so. Check to start session immediately instead of programmed date 1 2 Fig.11-31. Setting the start and stop time of a programmable remote measurement session. Except of the common file downloading options set in the Common settings tab, for each of the stations you can configure individual downloading path and naming convention which will be used instead of the common settings. To do so, click on the unit name on the list and in the General settings panel press the Configure individual file downloading options button. © SVANTEK - 180 - SvanPC++ User Manual The Instrument/station downloading options dialog box enables to set individual preferences for a selected station after enabling the Override session’s general downloading settings option. The settings are identical to those available in the Common settings. Note: The preferences set in the Common settings will still affect all instruments / stations where the Override session’s general downloading settings option has not been enabled. The configuration of individual downloading settings is illustrated in Fig.11-32. Select a station on the list Press to open the options window Check to enable the configuration of individual settings Set the preferred path and naming Fig.11-32. Configuring individual files downloading settings for a single instrument in the Remote session. All the other available individual station settings in the Remote sessions are identical to the features of the Station configuration tool, described in Chapter 11.2.2: Station Configuration. Results preview In case of the Remote Sessions it is possible to display the selected results of current measurements performed by a chosen connected device within a specified time interval. To do so, © SVANTEK - 181 - SvanPC++ User Manual go to the General settings of a chosen instrument or station (by selecting its name on the list in the Remote Session Settings dialog box) and press the Results preview button. The Results preview window will appear. Fig.11-33. Results preview window. The results downloaded from the instrument/station are displayed in the upper part of the window. The Interval selector enables to set the time period in which results are read. The Channel/profile selector enables to select the results to be displayed. In the lower part of the window the exchanged commands are listed. Pressing the Terminate button serves for breaking the current action without waiting for its finishing. Managing Remote Sessions After you configure your preferences in the Common settings as well as the measurement settings and the time period of the remote sessions for all devices you with to use, you can activate the measurements using the Start button in the lower-left corner of the window. The Remote Session dialog box will be opened. © SVANTEK - 182 - SvanPC++ User Manual Fig.11-34. Remote session dialog box. The lower part of the window contains a list of all currently connected devices. After selecting a position on the list, detailed information about the remote session will be shown in the upper part of the window. To start, stop or terminate the remote session for one of the instruments or stations, click on it with the right mouse button and choose the appropriate command from the pulldown menu. Fig.11-35 Commands for starting, terminating and stopping a remote session. You can also start, stop or terminate all sessions at once using the Sessions control buttons in the upper-right corner of the window. The Remote Session can be configured to download running logger measurements or to acquire the current results and save a results history in a special file (both can be later opened in SvanPC++ and viewed as a set of results). Setting the particular options in the Options panel at the right side of the Remote Session window causes the application to automatically open these files and update them automatically during sequential download steps. © SVANTEK - 183 - SvanPC++ User Manual 11.4 ONLINE DATA EXPORT 11.4.1 HTML PUBLISHING Results downloaded with the use of tools for automatic data acquisition, available in the Remote Communication module, can be saved in the form of .HTML files of selected names and directories. To create HTML files, it is necessary to enable the Publish HTML option, available among the options of particular data acquisition methods, as described in Chapter 11.3: Data Acquisition Methods. After activating the HTML publishing option, you also have to select the data to be contained in the created HTML files. This can be done using the WWW / FTP Selection dialog box, which is opened in various ways for different acquisition methods: In case of Live results preview, the data for HTML publishing is selected together with the displayed results after pressing the Configure Results button (see Fig.11-17). In case of Automatic files download and Continuous logger download, the data can be selected for each unit separately, using the buttons. In case of Remote session, you can only select the source for publishing files (Current results / RAMfile). If no data is selected, files will not be published even if the publishing option is enabled. You can use the Results selection list to select measurement results data which will be contained in the created HTML files. During the opening of this window, the current settings are downloaded from the device and the list is automatically filled with all the currently measured functions. To select a function for publishing, check the control next to its name. In case of the Live results preview and Continuous logger download sessions, Write data to .csv option is also available. Checking this option enables to export the data published in HTML format also to CSV format. The created .csv files are of the same name and directory as the .html files. If you decide to upload HTML files via FTP, you can select types of files to be downloaded: data files, history files – all files of which name ends with the “_history.html” suffix, structural files – files supporting website functioning, such as additional indexes, javascript files for charts etc. map files – additional HTML files, created if the Create additional files containing last results option is enabled. Similarly, when uploading CSV files, you can select the following types of files: data files, history files – all files of which name ends with the “_history.csv” suffix. © SVANTEK - 184 - SvanPC++ User Manual Fig.11-36 WWW / FTP Selection dialog box. It is also possible to specify an individual folder for the particular station by checking the Upload data files to individual folder option (at the bottom of the window) and specifying the folder name in the field next to it. Note: In the Live results preview sessions this window also serves to select the data displayed in the Live results preview window. In this case every function name works as a toggle instead of a checkbox, allowing both adding the data to the preview window and to the published HTML files. To select data for HTML publishing, select Add to WWW. You can choose one of the options or both. Fig.11-37 Selecting data for HTML publishing in case of Live Results Preview. The files can be published in the following modes (available to configure in the options panels of particular data acquisition methods): Current results in one file for all stations - merges the files containing the current results from all the units to one HTML file. Current results in individual file for each station - creates one HTML file for each station, containing the current results (the name of the created file contains the unit name and serial number). Current results and archive individually for each station - creates a new HTML file for every current result and one index HTML file containing links to all the archived results for each © SVANTEK - 185 - SvanPC++ User Manual station (files are stored in folders of names containing unit name and serial number, created for every station). You can also choose to create additional files containing only the last results data from the Main results or Logger downloaded files (these files are significantly smaller than the ones containing all the latest results). The names of these files begin with "map_". 11.4.2 FTP UPLOAD The files downloaded from an instrument or station, as well as the created HTML or CSV files, can be automatically sent to an FTP server. To upload files it is necessary to enable the FTP upload option, available among the options of particular data acquisition methods, as described in Chapter 11.3: Data Acquisition Methods. To configure the FTP server settings, you should use the Configure FTP dialog box, which can be opened by pressing the button: For Live results preview, the Configure FTP button is located in the lower-right corner of the Live Results window (see Fig.11-16). For Automatic files download and Continuous logger download the Configure FTP button is located in the Options window, available after pressing the Options button (see Fig.11-20 and 11-26) For Remote Session the Configure FTP button is available in the Common settings. Fig.11-38 Configure FTP dialog box. With the use of this dialog box, it is possible to: Specify the FTP server to be used for automatic file uploading by setting the address and port, Set the data required to access the server (Username, Password), Select a directory for storing files on the server (Remote directory), Select a separate directory for storing .svn files (Separate .svn directory), Note: The directories of the given names must exist on the server. Enable Passive transfer mode, © SVANTEK - 186 - SvanPC++ User Manual Enable automatic deletion of .html files before the upload Note: This option is useful in case of FTP servers not allowing to overwrite files. It is enabled / disabled automatically when you activate the Test FTP tool. The Test FTP button serves for performing an FTP server test with the use of configured settings. A warning will appear if connection is not possible or if directories of the given names cannot be found on the server. It also checks the necessity of automatic .html files deleting. After activating the FTP uploading option, you also have to specify which files should be uploaded. This can be done using the WWW / FTP Selection dialog box (see Chapter 11.4.1: HTML Publishing and Fig.11-36). The types of files available for uploading are: HTML files, Result files, Logger files, Binary files, CSV files. You can select multiple file types using the relevant check-boxes located in the lower part of the WWW / FTP Selection dialog box. Note: The FTP configuration is available only if the FTP upload option has been enabled. 11.4.3 DRAWING ONLINE CHARTS In the Remote Communication Module it is also possible to enable drawing charts in the HTML files created with the use of the Publish HTML option. To do so, press the Draw chart button, available in the published HTML files. You can also set the Auto-draw option, which causes to automatically redraw the chart each time when files are updated. The Online Chart view will be opened. 5 1 7 4 8 9 10 3 2 6 Fig.11-39. An example of an Online Chart created with the use of the Publish HTML option. 1. The header contains information about the currently used device and the current measurement. © SVANTEK - 187 - SvanPC++ User Manual 2. The Toggle auto-draw button can be used to start/stop the automatic redrawing of the chart. If the Auto-draw option is active, the chart, as well as the current result, will be updated each time when new results are received. 3. The displayed range of the y-axis can be modified by typing the minimal and maximal value in the Range fields and pressing the Update Range button. 4. You can also use the Auto-scale option, which works in an analogous way to the axis autoscaling tools in the Plot View (see Chapter 4.2.2: Plot view). When checked, this option sets the displayed y-axis limits as the minimal and maximal value of the currently displayed data. 5. This interactive view cannot be easily printed or copied. If you need to print or copy the chart, use the Report view tool to open a new window containing the chart and its header in a printable form. 6. Clicking with the left mouse button on the chart will place a cursor at the selected location. Value of the data at the location of the cursor is displayed next to it. 7. Pressing the Place cursor at current result button will place the cursor at the right side of the chart, where the newest data is displayed. 8. Pressing the Clear cursor button will remove the cursor from the chart. The cursor can be placed again by clicking on the chart with the left mouse button. 9. When the Synchronize cursor with time option is enabled, the cursor will move automatically as new data is drawn to the chart, so its value remains the same. Otherwise, the location of the cursor on the chart will remain constant but its value will be modified as new data is received. 10. The Current result value is the latest received measurement result. 11.5 SVAN RC SERVICE The data acquisition methods available in the Remote Communication Module are performed with the use of the SvanRC Service, a separate application that works as Windows Service. It runs in the background, which means that once a remote communication session (such as the ones described in Chapter 11.3: Data Acquisition Methods) is applied, SvanPC++ can be closed and the session itself will continue running with all defined parameters. At any moment, by accessing session window via SvanPC++, the session's state can be browsed and changed (stopped, terminated, etc.). The service can also be used to run many sessions of different types running simultaneously. For instance, it can run Automatic Files Download and Remote Live Results at the same time. In such case, the following priority list applies: 1. Automatic Files Download / Continuous Logger Download (equal priority) 2. Remote Session 3. Live Results Preview 4. Other commands sent to instrument The list describes priority order for a single instrument with the lowest number having the highest priority. Actions with lower priority need to wait until all actions with higher priority are complete before being resolved. For instance, if Automatic Files Download session starts downloading files from an instrument, Live Results Preview will not be able to access this instrument until AFD completes the downloading cycle. © SVANTEK - 188 - SvanPC++ User Manual The service is activated when needed by SvanPC++ and continues running until disabled (manually or by uninstalling SvanPC++). Since it's a Windows Service, it runs on low-permission Local User account that is automatically logged in at Windows start – it's possible for the service to run even if no standard user is logged in. It's automatically shutdown upon SvanPC++ application closing it has no sessions configured to run. As long as the service is activated and any remote communication session is running, all SvanPC++ communication through the connection type defined for the service (e.g. USB, Internet) is routed through the service application. In such situation, it is subject to the priority list mentioned earlier, allowing to send commands only if no session is currently exchanging data with the instrument the user wishes to communicate with. Note: If the Service is currently running a Remote Communication session using USB or RS2 connection, the instrument autodetection in main window will be disabled. 11.6 OTHER FEATURES OF THE RC MODULE 11.6.1 ALERTING The SvanPC++ RC Module enables to activate alarms to alert the user of events such as e.g. high or low noise level, loss in connection, low disk space etc. To configure the alarms, go to the Remote Communication Center and press the Alarms button (see Fig.11-12a). The Alarm config dialog box will appear. There are 3 types of alarm-triggering events: System events – warnings sent by a controlling unit connected to a station or a SV 200 station itself, concerning events such as high / low temperature, loss of AC/DC external power etc. Data transfer alarms – warnings concerning connection problems. Measurement threshold alarms – activated if a measured value exceeds a given range. Measurement performance alarms – related to hardware problems. The system and measurement alarms conditions checking time corresponds to the data downloading time period in the current remote data acquisition session. If the data downloading time step is longer than the adjusted maximal query delay time, the service will check the alarms conditions more frequently, in the time intervals given in the Query period field. © SVANTEK - 189 - SvanPC++ User Manual Fig.11-40 Alarm config dialog box. To set a Measurement alarm, use the Alarm configuration tab in the Stations configuration dialog box (see Chapter 11.2.2: Station Configuration). 1 2 3 Fig.11-41 Configuring measurement alarm settings in the Station configuration dialog box. © SVANTEK - 190 - SvanPC++ User Manual To enable the configuration of measurement alarm, you have to disable the Skip alarm configuration option (“2” on Fig.11-41). The following settings are available: Active level (Low / High) – determines whether the alarm will be activated when the evaluated function reaches values below or over the chosen limit level. Source – determines which function will be taken under consideration in alarm condition checking. Source type – determines whether current or periodic values of the selected function will be compared with the adjusted alarm level. Alarm level - the value of the measured function below / over which the alarm will be activated. The Data transfer alarm is activated if the communication absence time exceeds the limit specified in the No response time field. Note: In case of Continuous logger download sessions (see Chapter 11.3.3: Continuous Logger Download), a Data transfer alarm is also activated if no logger data is incoming from the unit during time longer than the specified No response time. Activation of an alarm may be followed by automatic sending of an e-mail notification from a chosen account to a chosen address. The e-mail sending configuration is enabled only if you check at least one of the Send e-mail notification for options. After you configure the e-mail sending options, you can check the performance of the automatic e-mail sending by pressing the Test e-mail settings button. A test e-mail will be then sent with the configured settings. Multiple alarms from a single query can be sent as a single e-mail or as multiple separate e-mails; you can select the preferred option using the Send multiple alarms from the same instrument as single e-mail checkbox (at the bottom of the window). Messages can also be shortened for easier forwarding in the form of SMS; to enable this feature, check the Create short event(s) details checkbox, located below the Send multiple alarms [...] checkbox. You can also enable the automatic sending of summaries of the activity of the RC service every day / week / month. These reports contain information such as: a list of active RC services together with the used Svan devices, a list of disks where the data is stored and the amount of memory available on these disks. The summaries are sent by e-mail with the configured settings, at 0:00. To enable the summary reports sending, switch the RC service summary report option on and select the sending period. The measurement performance errors, for which alarms can be configured, are related to potential hardware problems. If this option is enabled, every Query period the remote AFD and CLD sessions download METEO results and LEQ values measured in all profiles in order to analyze whether their value averaged over the last hour is a reasonable one (i.e. whether it falls in an acceptable range). If any unacceptable value is obtained, it is notified by activating an alarm. This type of alarms is particularly useful for cases of e.g. microphone damage or loss of connection between individual components of a meteo station, when erroneous data is sent by the station. It is also possible to configure automatic sending of an e-mail notification when the amount of available disk space reaches values below a specified level. To do so, switch on the Low free disk space control and type the desired level in MB. The e-mail notification can be also repeated automatically in specified time periods once the alarm has been activated. To enable this © SVANTEK - 191 - SvanPC++ User Manual functionality, switch on the Remind every option and select a time period in which the notifications should be repeated. After configuring the alerting options, the changes will take effect only after a RC session is started. However, if the RC Service is already running, but you want the alerting options to be applied immediately, it is also possible – you only have to confirm it in the dialog box that appears after closing the Alarm config dialog box (Fig.11-42). Fig.11-42 Dialog box allowing for applying alerting changes to a running RC Service. 11.6.2 SVAN PC++ TRAY ICON By default, the SvanPC++ tray icon is created every time a SvanRC Service session is started. It can be used to work with SvanRC Service sessions when SvanPC++ application is not running. Fig.11-43 SvanPC++ tray icon and its menu. The automatic creating of this tray icon can be enabled / disabled in the Main Options / Remote communication settings. To gain access to the Main Options, you can use the Main options command from the Tools menu or the © SVANTEK button available on the Main Toolbar. - 192 - SvanPC++ User Manual 2 1 Fig.11-44 Configuring the SvanPC++ tray icon settings in the Main Options dialog box. Clicking twice with the left mouse button on the SvanPC++ tray icon opens the SvanPC++ application (unless it is already running). Clicking with the right mouse button on the SvanPC++ tray icon opens a menu, containing the following commands: SvanRC Service state – displays whether a SvanRC Service is currently running or not. Edit session settings with SvanPC++ – runs SvanPC++ and automatically opens the Remote Communication Center dialog box. Stop / Start Svan RC service - stops / starts the SvanRC Service. Terminate Svan RC service - stops the Svan RC Service immediately (without waiting until the current action is finished). Note: When SvanPC++ software is running, these options are not available. Exit - hides the SvanPC++ tray icon. When a session is stopped with the use of the SvanPC++ tray icon, you can later start it in the same way. As long as Svan RC Service is running, the SvanPC++ tray icon is also added to the automatically started programs of each user of the computer. If this is not possible due to administrative reasons, the icon is only added to the automatically started programs of the current user. 11.6.3 RC TROUBLESHOOTING TOOL The Remote Communication Troubleshooting tool available in the SvanPC++ RC Module serves for reporting problems concerning data exchange with Svan instruments. The idea of using the Troubleshooting tool is to easily create and send e-mails to Svantek, containing automatically collected information which helps to find a solution to the problem. © SVANTEK - 193 - SvanPC++ User Manual To use the Troubleshooting tool, open the Remote communication center, press the Toggle mode button to enable additional options and press the Troubleshooting button, located at the bottom of the window. The Remote Communication Troubleshooting Tool dialog box will appear. Fig.11-45 Remote Communication Troubleshooting Tool dialog box. E-mails containing reports are sent using your default e-mail configurations. The recipient’s address and the subject are automatically filled. However, you can add more recipients in the CC(s) field. Attached to the report is automatically generated information about the RC Service activity as well as zipped files, such as: current SvanPC++ settings, Remote Communication Center log, remote communication sessions log. You can also write a description about the problem in the User information field or attach any additional files you find necessary using the Add files button. Any details you can add to the report might be helpful for Svantek to find a solution to the problem. To send the report, use the Send button. 11.6.4 DYNAMIC DATA APPENDING Some additional functionalities of the Remote Communication module are also available via the File » Dynamic Appending (RC) menu. © SVANTEK - 194 - SvanPC++ User Manual Fig.11-46 Dynamic Appending (RC) options in the File menu. The marks signify options which are currently enabled. To enable / disable an option, simply click on its name. If the Auto Refresh function is enabled, SvanPC++ will automatically check every 1s if new data is available in the currently opened files (e.g. if an RC session is currently active, new logger results can be automatically downloaded). If there are new results available, the currently opened views will be automatically updated. If the Synchronize function is enabled and if the Auto refresh function is enabled, every time the views are updated with newly downloaded results, the visible cursor will be automatically placed at the position of the latest downloaded sample (in the Table View as well as Plot view). 11.6.5 RC SETTINGS IN MAIN OPTIONS You can configure some settings related to the Remote Communication module using the Main Options. In order to do so, press the button or activate the “Main Options...” command in the Tools menu, and select “Remote communication” in the list of available categories of settings (at the left hand side of the Main Options window). © SVANTEK - 195 - SvanPC++ User Manual Fig.11-47 Remote communication settings in Main Options. The following settings are available: Controller Settings - use these buttons to choose whether you will have fully manual access to all the settings in the Controller Settings dialog box, or you will be able to configure these settings using a Wizard. Remote Session: o Enable live results view at start - if this option is enabled, the Remote Session will, by default, display downloaded results (logger or summary) when it is started, and synchronize them during downloading (this function can be disabled in each particular Remote Session). Automatic updates - if this control is checked, SvanPC++ will automatically search for firmware updates in the Internet every time it is started. The program will only search for updates for the units that are currently used with Svan RC Service. You can use the "Check for updates now" button to manually search for updates for connected instruments. Files downloading - allows for automatic adjustment of downloaded files' timestamp according to Daylight Saving differences in local time. RC Service settings: o Place Svan PC++ icon in tray at RC service start - if this option is enabled, a Svan PC++ tray icon will be created every time Svan RC Service is started. o Automatically append new catalogue data instead of redownloading it - with this option enabled, downloading files with Svan RC Service will be performed only for the files missing on your PC, instead of downloading the whole catalogue every time. This functionality is particularly useful in case of downloading big catalogues, as well as when there are problems in transmission, which may cause frequent restarts of the downloading. o Data exchange between Svan RC Service and SvanPC++ requires confirmations - this checkbox allows for selecting between two different modes of transmission between Svan RC Service and SvanPC++: © SVANTEK - 196 - SvanPC++ User Manual When it is enabled, a confirmation of receipt is expected for each command sent, and in case the confirmation is not received, the command is retransmitted. Therefore, the transmission is more reliable but at the same time slower. When it is disabled, the confirmations are not sent nor expected, so the transmission is faster but less reliable. Note: By default, transmission with confirmations is used and it is advisable to enable it in most cases. The other mode of transmission might turn out useful in cases when multiple stations are used and lots of data are frequently downloaded - if results are not updated with sufficient speed, try disabling the confirmations. o Service address and port - allows for setting manually the IP address and port at which the RC Service can be accessed. Note: It is recommended to restart the Svan RC Service after modifying settings in the RC Service settings category so they can take effect (except for the one concerning the tray icon). 11.7 NEW FUNCTIONALITIES IN RC MODULE Some fundamental changes have been introduced in the RC Module with the release of version 1.6.1 of SvanPC++. This section is devoted to an explication of what has changed and its consequences for users that update the software from a version earlier than 1.6.1. The new functionalities are described in previous sections, as they apply currently in the latest version of the software; therefore, the following text is irrelevant for users who started using SvanPC++ in version 1.6.1 or later. 11.7.1 CHANGES SINCE SVANPC++ 1.6.1 With version 1.6.1, SvanPC++ introduces new way of declaring remote stations. Before, communication parameters for Internet stations were strictly defined. In Remote Settings… the user was obliged to select between TCP Client, TCP Server and UDP communication; furthermore, for TCP Client they had to choose between Manual, CRP Packets or Address Server and for UDP – between Manual and CRP Packets. This meant that the particular installation of SvanPC++ software could only work with one type of Internet stations – if, for instance, a TCP Server was chosen, it meant that all stations had to be configured as TCP Clients to properly communicate with the software. Starting with 1.6.1, SvanPC++ moves beyond such limitation. Most settings are gone from SvanPC++ – there’s no longer global fixed selection between TCP Client, TCP Server and UDP and option for listening for incoming connection and CRP packets can be now triggered regardless of any other settings. The obvious advantage is the ability of the software to work with differently configured stations. The particular type of the station is now defined at the moment the station is added in Remote Communication Center or Svan Files windows. © SVANTEK - 197 - SvanPC++ User Manual Fig.11-48 New “Remote Settings...” window Remote Connection Wizard has also changed slightly to work with the new concept. With old design, the first station that was configured defined the connection type for all other instruments. Now, for each station, the same algorithm is applied – the wizard configures it for TCP AS communication and then determines whether the station can work as TCP Server or not (it changes its configuration to TCP Client in the latter case). 11.7.2 UPDATING FROM EARLIER VERSIONS OF SVANPC++ Updating from earlier versions of SvanPC++ may result in a conflict with previously defined stations. Since the information about the connection type of each station are not available in station definitions in SvanPC++ versions of 1.6.0 and earlier, the system will be unable to recognize via which method it should connect to each of the stations (the Type column may display “N/A” in such case). The software has several procedures that will assist in overcoming this problem. First, upon entering RCC or SvanFiles, the software checks if any station has connection type information missing. If so, it will display a warning message (Fig.11-49). © SVANTEK - 198 - SvanPC++ User Manual Fig.11-49 A message displayed when missing information is detected. If accepted, all stations that have missing connection type will either become TCP AS stations (if they had AS password entered) or TCP Manual (all other). At this point, the user should verify whether the stations are properly defined – they can use “Change protocol type” to adjust any inconsistencies. If a user had any TCP Client stations defined manually, they can go to Remote Settings and ensure that “Listen for incoming connections” is enabled. Then, in RCC, by clicking “Listen for incoming connections” a listening window will appear and wait for incoming connections. Once a station connects, its connection type will be automatically updated to “TCP Client”. If a user had any TCP CRP or UDP CRP stations defined, they can go to Remote Settings and ensure that “Listen for incoming CRP packets” is enabled. Then, in RCC, by clicking “Listen for incoming CRP packets” a listening window will appear and wait for CRP packets. Once a station connects, its connection type will be automatically updated to either “TCP CRP” or “UDP CRP”. If the stations were configured via Remote Connection Wizard and SvanPC++ continues to operate in Simple Mode, Remote Communication Center will automatically listen for incoming connections and update connection types accordingly once the station(s) connect. © SVANTEK - 199 - SvanPC++ User Manual 12 BUILDING ACOUSTIC MODULE SvanPC++ Building Acoustic module (BA) extends basic SvanPC++ functionality offering easy to use environment and tools for reverberation time and insulation calculation and reporting. The Building Acoustic includes tools which allow for: Calculate reverberation time (RT60), o based on decay or impulse octave band time history logger, o in 1/1 octave or 1/3rd octave band, o with EDT, RT20, RT30 and manual methods. Calculate insulation index with: o defining rooms and partitions plan, o arranging numerous measurement files, o usage of imported data, o results of Airborne R, Dn, DnT, R45, D2m,n, D2m,nT, impact Ln, LnT and ratings o reporting with preinstalled and manually created report templates, o accordance with ISO 140-4, 140-5, 140-7, 717-1, 717-2 standards. Note: In order to use the reporting templates functionality, Microsoft Word and Excel 2003 or newer is required. 12.1 CALCULATION OF REVERBERATION TIME Basic edition of SvanPC++ is able to display SVAN instrument calculated RT60 results with dedicated RT60 view. SvanPC++ Building Acoustic additionally provides tools to calculate reverberation time (RT60) based on SVAN measurement file containing short step Leq spectrum. The calculation may be performed over decay or impulse octave band time history logger, in 1/1 octave or 1/3rd octave band, with EDT, RT20, RT30 and manual methods. The calculation can be initiated using any Logger-type view; however, it is recommended to open a Logger Octave TSect (Time Intersection) view, since in this case additional features are available in the Building acoustic Toolbar (see Section 12.4). 12.1.1 LOGGER OCTAVE TIME INTERSECTION VIEW After opening a file containing short step Leq spectrum, use the Navigator toolbar in order to open the Logger 1/1 Octave TSect or Logger 1/3 Octave TSect subview. © SVANTEK - 200 - SvanPC++ User Manual Frequency selection Smoothing on/off switch Smoothing samples parameter adjustment Fig.12-1 Logger time intersection subview. The view serves for displaying the time history of one frequency band at a time. The up and down arrows allow for browsing the available frequency bands. It is useful to apply smoothing to the short step Leq function for better visual evaluation of reverberation time. Smoothing on/off switch allows to turn smoothing on or off. Smoothing is performed by averaging linear sound pressure levels. The Smoothing samples parameter decides on how many Leq function samples are averaged when smoothing is on. It is always an odd number since the sample from the point in time is taken into account as well as even number of samples before and after it, as far as possible. Smoothing samples parameter may also by adjusted in the Main Options / Calculator / RT60 panel. Smoothing affects both values in the plot as well as in table view. 12.1.2 CALCULATION METHODS AND PARAMETERS In order to calculate RT60 for all available frequency bands open the Building Acoustic Calculator using the Calculator >> Building Acoustic command in the Tools menu. Tick Reverberation Time from the list on the left hand side of the window and go to Parameters tab. © SVANTEK - 201 - SvanPC++ User Manual Fig.12-2 Calculation of RT60 in the Building Acoustic Calculator. In the parameters tab the user may select according to which methods the calculation should be performed. EDT, RT20 and/or RT30 may be selected; if custom markers have been previously created using the RTuser tool available on the Building Acoustic Toolbar, the RT User option is also enabled. The choice between Decay and Impulse methods is important and should be made according to the type of measurement that has been performed. In case of using the omnidirectional sound source the Decay method should be the right choice. By default RT60 calculation is performed based on non-smoothed data, even if smoothing has been turned on in Logger time intersection subview. It is however possible to run calculations based on smoothed data. © SVANTEK - 202 - SvanPC++ User Manual The Response time parameter may be adjusted in Main options / Calculator / RT60 or in the Building Acoustic Toolbar. This parameter helps SvanPC++ find the time period in which the sound source is switched off and sound pressure level goes down to stable background noise. It is recommended to set the Response time parameter two times longer than expected reverberation time. Fig.12-3 Adjusting the response time using the Building Acoustic Toolbar. In order to run calculations press the Calculate button. After reverberation time calculations the RT60 view will automatically be opened. Note: In case the RT60 calculator is used repeatedly, the previous results of calculation will not be available anymore. 12.1.3 RT60 VIEW The RT60 view is automatically opened when calculation of reverberation time is completed. It serves for displaying the results of calculation in the form a table. Fig.12-4 The RT60 view. © SVANTEK - 203 - SvanPC++ User Manual The last column—RTResult—provides the most precise result in the given frequency considering the order of calculation quality as following: RTUser, RT30, RT20, EDT. The values in RTResult column may be corrected by experienced user. Double click a cell to edit. Note: The RT60 results may also be plotted using the Logger 1/1 Octave or Logger 1/3 Octave view. In case a cell from EDT, RT20, RT30 or RTUser column is double clicked, the Logger octave time intersection view shall be opened at selected frequency band and corresponding method will be active, as shown in Fig.12-5. 12.1.4 RT60 RESULTS DETAILED REVIEW AND MANUAL CALCULATION After double clicking a cell with calculation results in RT60 view or after clicking one of the EDT, RT20, RT30, user buttons from Building Acoustic Toolbar, a corresponding set of markers and levels will become available in Logger octave time intersection view. RT60 analysis method selection RT60 measurement method selection Fig.12-5 RT60 analysis in given frequency band. A number of functions and markers will become available in the View configurator, including: L1: ‘noise on’ level in case of decay method and last value of backward integrated curve in case of impulse method © SVANTEK - 204 - SvanPC++ User Manual L2: L1-5dB level (RT20, RT30) or L1-10 dB (EDT) L3: L2-20 dB (RT20) or L2-30 dB (RT30) level L4: ‘background noise’ level ‘Noise on’ marker, averaged level when omnidirectional sound source is operating, decay method ‘Decay start’ marker, detected moment of time when the sound source was turned off, decay method ‘Top level’ marker, at the point where impulse Leq value was highest and the last sample where backward integrated curve has been calculated, impulse method ‘Background noise’/’t4’ marker (detected moment of time when reaching stable background noise) ‘-10dB point’ marker for EDT method indicating reaching 10 dB below L1 level (reaching L2 level) ‘-5dB point’ marker for RT20 and RT30 methods indicating reaching 5 dB below L1 level (reaching L2 level) ‘-25dB point’ and ‘-35dB point’ markers indicating reaching respectively 20dB (for RT20) and 30 dB (for RT30) below L2 (reaching L3) ‘t2’ and ‘t3’ markers for user mode which indicate the range of samples representing the decay or backward integrated curve 1/n Octave Slope line: linear approximation of samples of Leq (decay method) or backward integrated Leq (impulse method) between ‘t2’ and ‘t3’ (user mode) or between ‘-5dB point’ and ‘-35dB point’ (RT30 method) or between ‘-5dB point’ and ‘-25dB point’ (RT20 method) or between ‘decay start’ and ‘-10dB point’ markers (EDT method) 1/n Octave Schroeder curve: backward integrated Leq (impulse method) After switching to ‘user’ mode in the Building Acoustic Toolbar it is possible to adjust positions of ‘t2’ and ‘t3’ markers in order to select the most representative set of samples for the decay curve (decay method) or backward integrated curve (impulse method). In order to adjust the positions of a marker you need to move mouse cursor to the bottom of the line representing the marker. A frame in the colour of the marker should appear, you can drag and drop the marker left or right from its original position. The value of function ‘RTUser’ as well as ‘RTResult’ will be recalculated as soon as marker is dropped in a new position, as well as the 1/n Octave Slope line. © SVANTEK - 205 - SvanPC++ User Manual Fig.12-6 Calculation of RT60 in User mode. After manual adjustment for a given frequency band results will be shown in the RT60 view in RTUser column, and the value in the RTResult column will be respectively updated (Fig.12-7). © SVANTEK - 206 - SvanPC++ User Manual Fig.12-7 An RT60 view containing RTUser results. 12.2 BUILDING ACOUSTIC PROJECTS Activation of the Building Acoustic module also unlocks access to Svan Projects, a useful tool for data management that simplifies the usage of SvanPC++ reporting features. General ways of working with projects are described in Section 10. In case of Building Acoustics, the Projects functionality allows for management of numerous measurement files recorded during measurement of reverberation time and sound insulation. It is necessary for Sound Insulation Wizard. It provides unique functionality of limiting range of frequency bands to be displayed and analysed in the software, narrowing it down to the standard used in sound insulation assessment. With the Projects functionality it is also possible to import measurement functions not recorded by SVAN instrument, but e.g. coming from table of typical RT60 values for a room of given size and construction. The User function wizard, described in Section 10.6.3, serves for this purpose. 12.2.1 STARTING A BUILDING ACOUSTIC PROJECT After activating the New project command in the File menu, the New Project Wizard dialog box will appear. © SVANTEK - 207 - SvanPC++ User Manual Fig.12-8 Using the New Project Wizard for starting a Building Acoustic project. For building acoustic projects it is possible to set limit frequency domain minimum and maximum values. It is necessary to declare whether measurements used in the given project have been performed with 1/1 octave of 1/3rd octave bands. 12.2.2 BUILDING ACOUSTIC REPORT TEMPLATES The Report templates form part of the Svan Projects module. Specifically for the Building Acoustic module, Report templates for sound insulation in accordance with ISO 140-4, 140-5 and 140-7 have been prepared by Svantek and are installed together with SvanPC++. After opening Report templates browser using the button, available on the Projects Toolbar, a system file path to the folder containing the template files becomes available. Building acoustic templates are placed in the Building Acoustic subfolder. © SVANTEK - 208 - SvanPC++ User Manual Fig.12-9 Accessing the list of Building Acoustic report templates. A report may be conveniently generated by dragging and dropping a view with sound insulation results onto a desired template file. Users may modify the Svantek templates as well as add their own, as described in Section 10.4. 12.3 SOUND INSULATION WIZARD The Sound Insulation Wizard allows for: Defining rooms and partitions to reflect the measurement situation Easy assignments of various kinds of measurement data to rooms and partitions Running calculation of various kinds of sound insulation indexes Calling report generator to create report for a given partition In order to start the Sound Insulation Wizard use the button located on the Building Acoustic Toolbar or select the Sound Insulation Wizard command in the Tools menu. It is only available when working with a Building Acoustic Project. © SVANTEK - 209 - SvanPC++ User Manual 12.3.1 DEFINING ROOMS AND PARTITIONS The first thing to do after starting Sound Insulation Wizard is defining rooms. The Add room button is located in the top left corner of the window. Fig.12-10 Defining a room in the Sound Insulation Wizard. It is obligatory to fill in at least Room (room identification) and Room volume parameters. Other are optional and function as additional notes. Note: With the Add façade button it is also possible to define the area outside the building in case façade sound insulation is analysed. As soon as at least two rooms are defined it is possible to select them as source room and receiving room from the measurement of a newly defined partition. The Add button in Partition section in the top middle section of the Sound Insulation Wizard window will allow to define a partition. © SVANTEK - 210 - SvanPC++ User Manual Fig.12-11 Defining a partition in the Sound Insulation Wizard. The rooms selected as source and receiving will be considered side rooms for the partition being created. After providing at least Partition name and Partition area parameters it is possible to save the definition of partition with OK button. 12.3.2 SELECTION OF SOUND INSULATION TYPE The switch which allows for selecting sound insulation type is placed in the bottom left corner of Sound Insulation Wizard window. Fig.12-12 Selection of sound insulation type for rooms. © SVANTEK - 211 - SvanPC++ User Manual The possible options are: Airborne R: Apparent sound reduction index according to ISO 140-4, Field measurements of airborne sound insulation between rooms Airborne Dn: Normalized level difference according to ISO 140-4, Field measurements of airborne sound insulation between rooms Airborne DnT: Standardized level difference according to ISO 140-4, Field measurements of airborne sound insulation between rooms Impact Ln: Normalized impact sound pressure levels according to ISO 140-7, Field measurements of impact sound insulation of floors Impact LnT: Standardized impact sound pressure levels according to ISO 140-7, Field measurements of impact sound insulation of floors In case a façade is selected as the source, types of sound insulation of façades are available: Airborne R45: Apparent sound reduction index according to ISO 140-4, Field measurements of airborne sound insulation of façade elements and façades Airborne D2m,n Airborne D2m,nT Fig.12-13 Selection of the sound insulation type for façades. 12.3.3 ASSIGNING MEASUREMENT FILES As soon as a partition and Sound insulation type are selected it is possible to assign to rooms measurement files of sound pressure level in a source room, sound pressure level in a receiving room, reverberation time and/or background noise level. Note: Only summary results are used, if available. Time history results are used only if a particular object, corresponding to this type of data, is dragged from a branch of the Project Objects list (not a whole file or channel), or in case summary results are not available in the selected file. In case of Reverberation time section those can be RT60 result files from instrument (in case there are few in a file the averaged will be taken), RT60 results files defined by User function wizard of SvanPC++ or results of RT60 analysis performed with SvanPC++, but also loggers containing short step Leq 1/1 or 1/3rd octave spectrum time history may be dropped. To assign a group of files select them (or whole folder) in the Project Browser and then drag and drop them to the proper section in the Sound Insulation Wizard. © SVANTEK - 212 - SvanPC++ User Manual Fig.12-14 Assigning measurement files to rooms in the Sound Insulation Wizard. 12.3.4 AUTOMATIC CALCULATION OF REVERBERATION TIME In case a logger containing short step LEQ 1/1 or 1/3rd octave spectrum time history is being dropped onto the Reverberation time section, SvanPC++ will automatically perform RT60 analysis according to its current setup (considering e.g. whether the decay or impulse method is selected in the Building Acoustic toolbar). This type of data is then visible as "Auto RT60" in the lists. Note: When both RT60 results and logger data are available in the loaded file (which is possible in case of SVAN 977 instruments), only the RT60 results are taken into account. © SVANTEK - 213 - SvanPC++ User Manual Fig.12-15 Automatic calculation of reverberation time upon assignment of logger files. Project sessions named according to pattern ‘Auto RT60 – [room id] – [filename]’ shall be created and calculated RT60 results will be assigned. Note: During the calculation of insulation all the assigned spectra and reverberation time results are going to be averaged. 12.3.5 CALCULATION OF INSULATION After pressing the Run calculations button in the Sound Insulation Wizard, a new session named according to pattern ‘SI – [type of insulation] – [partition id]’ will automatically be created in Project Browser and a dialog box, shown in Fig.12-16, shall appear. © SVANTEK - 214 - SvanPC++ User Manual Fig.12-16 Basic results of calculation of insulation. This dialog box presents the basic results of calculation of sound insulation. After clicking OK button the 1/1 Octave or 1/3 Octave view of the newly created 'SI - …' session shall be displayed. Note: If the difference of average sound level in the receiving room and in the background is lower than 10dB for some frequencies, a warning message is displayed at the bottom of this window and a correction is added to the sound levels in the receiving room. The view presents by default the 1/n octave sound insulation curve, norm curve and shifted norm curve. Additionally the view configurator will allow to display a subset of the following supporting functions: 1/n octave averaged source room (result of averaging spectrums assigned to source room) 1/n octave averaged receiving room 1/n octave averaged background noise (from the receiving room) 1/n octave delta Lsrc-Lrcv (the dB difference between sound pressure levels in the source room and the receiving room) 1/n octave delta Lrcv-Lbkgnd (the dB difference between sound pressure level in receiving room when the omnidirectional sound source or tapping machine was operating in the source room and the background noise in this room) Aver RT60 (averaged RT60 results from the receiving room) © SVANTEK - 215 - SvanPC++ User Manual Fig.12-17 The Sound Insulation view – plot of sound insulation curve, norm curve, shifted norm curve. Double clicking any of the functions in the table below the plot opens Calculated Results dialog box. It presents calculation parameters and basic results. It is possible to select the text for copying to clipboard. The Run calculations button in the Sound Insulation Wizard may be used multiple times for a single partition. The Show results button opens the last generated view with calculation results. © SVANTEK - 216 - SvanPC++ User Manual Fig.12-18 Reviewing calculation parameters and resulting indexes. Summary Sound Insulation views Commands available in the pulldown menu accessible via the Run calculations button enable one to create a single Sound Insulation view gathering results of calculation for all types of airborne or impact insulation. Note: The generation of such a Summary Sound Insulation view is possible only if appropriate files are available and assigned to rooms/partitions. © SVANTEK - 217 - SvanPC++ User Manual 12.3.6 REPORTING ON INSULATION CALCULATION RESULTS The most comfortable way of generating a report is to use the Report button in the Sound Insulation Wizard. Fig.12-19 Generating report from Sound Insulation Wizard. A report named according to pattern ‘SI – [partition id]’ will be added to the Project Reports section and the file will be opened with Microsoft Word. 12.4 BUILDING ACOUSTIC TOOLBAR The Building Acoustic Toolbar provides easy access to several features of the Building Acoustic module. Its contents are described in Table 12-1. © SVANTEK - 218 - SvanPC++ User Manual Table 12-1 Contents of the Building Acoustic Toolbar. Control Description Sound Insulation Wizard – allows for opening the Sound Insulation Wizard. (cf. Section 12.3) RT60 analysis methods buttons – after clicking one of these buttons, corresponding set of markers and levels will become available. (user – enables adjustable 't2' and 't3' markers.) Decay / Impulse switch – allows for selecting the RT60 measurement method. Response time field – it is recommended to set the Response time parameter two times longer than expected reverberation time. (cf. Section 12.1.2) Note: You can show / hide the Building Acoustic Toolbar using the Building Acoustic Toolbar command, available in the View menu. © SVANTEK - 219 - SvanPC++ User Manual INDEX .svn file................................................................ 21 activation code ............................................. 85–86 active function .............................................. 28, 34 audio events ..................................... 51–52, 75–76 block ..................................... 32–33, 58–62, 65, 85 calculated results .......................................... 66–68 calculator .................................... 44, 55, 64–68, 81 CSV format .............................................. 72–74, 81 data transfer ................................................... 9–12 decimal point ................................................ 73, 74 installation ........................................................ 6–7 LEQ .......................................................... 55, 64–65 limit time domain ................................... 26–27, 51 logger results .................................... 11, 23, 39–41 main toolbar ............................... 23, 25, 38, 80–83 marker .............................................. 26, 55, 58–62 merging files ........................................... 11–12, 39 © SVANTEK MS Excel ................................................. 69–70, 82 MS Word ................................................ 71–72, 82 multifile .............................................11–12, 21, 44 playback ................................................. 51–54, 76 plot .......... 23, 27–33, 38, 47, 53, 58, 63, 67, 71, 85 real time clock...............................................10, 20 RMS ........................................................ 55, 64–65 RS232 ................................................................... 8 setup file ...........................................13–18, 20, 21 shortcut keys...................................................... 84 spectrogram ......................................23, 34–35, 38 spectrum ......................... 39–44, 55, 62, 63–64, 66 statistics ................................................. 23, 41–43 table ........ 23–27, 38, 53, 58, 60, 62, 69, 71, 78, 82 text ...................... 17, 18, 23, 25, 35–36, 38, 71, 78 USB .......................................................... 5, 6, 8, 82 view configurator ............................. 48–50, 66–67 - 220 - SvanPC++ User Manual