1
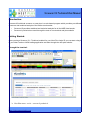
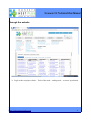
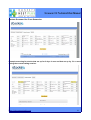
Omnesys Technologies
Nest Plus Screener IQ - Technical User Manual
June 2013
https://plus.omnesysindia.com
1
Document Information DOCUMENT CONTROL INFORMATION
DOCUMENT
Nest Plus – Screener IQ - Technical
User Manual
VERSION
1.0.0.0
VERSION NOTES
This
document
explains
the
features and functionalities of the
Screener IQ - Technical screener in
Nest Plus.
KEYWORDS
Proprietary Notice
This document contains confidential information of Omnesys Technologies Pvt Ltd,
which is provided for the sole purpose of permitting the recipient to evaluate the
deployment document submitted herewith. In consideration of receipt of this
document, the recipient agrees to maintain such information in confidence and to not
reproduce or otherwise disclose this information to any person outside the group
directly responsible for evaluation of its contents, except that there is no obligation to
maintain the confidentiality of any information which was known to the recipient prior
to receipt of such information from Omnesys Technologies Pvt Ltd, or becomes
publicly known through no fault of recipient, or is received without obligation of
confidentiality from a third party owing no obligation of confidentiality to Omnesys
Technologies Pvt Ltd.
https://plus.omnesysindia.com
2
Introduction:
Screener-IQ techinical screener on nest plus is a web based program which provides pre-defined
screeners and technical analysis of the Indian stock market.
•
Screener-IQ provides statistical and technical analysis for all the NSE listed stocks.
•
Screener Iq technical are used through the nest or now terminal and plus website
Getting Started:
Once you have Screener IQ – Technical enabled for your Nest Plus Login ID you can start using it
in your Nest Trader or NOW trading application and also through the nest plus website.
Through the terminal:
➢ Nest Plus menu – tools – screener Iq technical.
https://plus.omnesysindia.com
3
Through the website
➢ Login to the nest plus website – Tools of the trade – trading tools – screener iq techincal.
https://plus.omnesysindia.com
4
EOD Screener Use Case Scenarios:
Click on any of the predefined screeners to find the NSE listed stocks meeting the pre-defined
screening criteria.
• The user is presented with the list of the stocks that are down for three days in row.
• You will find the signal description at the bottom of the page (not shown in the above screen
shot).
• The user is presented with Preference, # Trades, #Wins, # Losses % Wins, Profit Factor and
More Columns.
https://plus.omnesysindia.com
5
The description:
Preference: This column will have either of the two entries, i.e. ‘long’ or ‘short’. If it is ‘long’, it
means going long would have been profitable; conversely, if it is ‘short, going short would have
been profitable.
Long/Short are arrived at historical backtesting report over 4 years based on the most profitable
action by summing the change% details.
Entry Price: Price at which the trading strategy triggered. For BTST/STBT(Buy Today Sell
Tomorrow, Sell Today Buy Tomorrow) it is usually the price around 3.15 p.m(the idea is for the
users to front the all the screeners before the market is closed and take action accordingly).
ScreenerIQ refreshes the value after the market is closed around 5 p.m.
For Intraday Trade-Ideas the entry price usually a referenceable price point like Previous day’s
high/low, Current Open, Current Open+/- certain percentage, various pivot points to name a few.
# Trades: Number of trades generated by the trading strategy on a stock over the last four years.
Look for a sample of a minimum of 16 trades in last four years in order to support the statistical
significance of back-testing results.
#Wins: Number of winning trades generated by the trading strategy.
# Losses: Number of losing trades generated by the trading strategy.
% Wins: Number of winning trades expressed as percentage.
Profit Factor: Profit factor is the system’s gross profit in rupee terms divided by gross loss in
rupee terms. Look for trading systems that have a profit factor of 2.5, or higher. The above fields
are generated via historical backtesting, assuming the trade is exited at the next day close, and
the default test period is 4 years.
More: will take the user to a detailed backtest report page.
https://plus.omnesysindia.com
6
Example detailed backtest for TITAN when the Stock is down for 3 days
down in row:
•
User can change the lookback period by selecting the “lookback period” dropdown menu
(can select, over last 1, 2, 3, 4 years).
•
User can change the exit period by selecting the “exit after “drop down menu (can select,
1, 2, 3,4,5,10,20 days).
•
User is presented on the right hand side with all the previous instances(dates) when the
trading signal triggered in the historical backtesting period. The change and change%
details for the particular symbol and the next 1,2,3,4,5,10, 20(depending on the user
selected values, default is 1 day) days, for that particular trading strategy.
The detailed backtest report will have the following fields and the description below:
•
Symbol : Stock Symbol on NSE.
•
Signal: This is the Trading Strategy the user has selected.
•
LookBack Period: can be set to either 1,2,3,4 years, the default value is 4 years if the
user doesn’t select any value.
https://plus.omnesysindia.com
7
•
Exit After: can be set to either 1, 2, 3,4,5,10,20 days, the default value is 1 day if the user
doesn’t select any value. If the user selects 2 years as look back period and 5 days as the
exit after, values, the back test report will be performed over the last 2 years on the stock
for the selected predefined screener, assuming the exit period is after 5 trading days at
close.
•
Total # Trades: Number of trades generated by the trading strategy on a stock over the
last four years, or if the user selects any other look back period like 1,2,3,4 years.
•
Preference: Long or short, based on the Historical Backtesting Report. Arrived at summing
all the change% values and if negative usually going short was profitable, if positive going
long was profitable.
•
Percent Profitable: Number of winning trades expressed as percentage.
•
# Win Trades: Number of winning trades generated by the trading strategy.
•
# Loss Trades: Number of losing trades generated by the trading strategy.
•
Avg Trade (%): The average profit per trade (in percentage) for all the trades has been in
the last four years, minus commission and slippage.
•
Avg Win / Avg Loss (%): Also referred as Payoff Ratio, Payoff Ratio is the system’s
average profit in percentage terms per winning trade, divided by the average loss in
percentage terms per losing trade. Unless the trading system has a particularly high
win/loss ratio, look for payoff ratios of more than 2. StocksIQ filters the trades with payoff
ratio of minimum of 2.
•
Average Win Trade (%) : The average profit per winning trades for all the winning trades
has been in the last four years, minus commission and slippage. The average Win Trade is
sum of the percentage profits for all the winning trades divided by number of winning
trades.
•
Average Loss Trade (%) : The average profit per losing trades for all the losing trades has
been in the last four years, minus commission and slippage. The average loss trade is sum
of the percentage profits for all the losing trades divided by number of losing trades.
•
Median : in probability theory and statistics, median is described as the numerical value
separating the higher half of a sample, a population, or a probability distribution, from the
lower half. The median of a finite list of numbers can be found by arranging all the
observations from lowest value to highest value and picking the middle one. If there is an
even number of observations, then there is no single middle value; the median is then
usually defined to be the mean of the two middle values.
The median can be used as a measure of location when a distribution is skewed, so, it’s
important to view the median profit per trade (and profit percentage per trade as well) to be
in trading strategies favour. For example if the average profit per trade is, let’s say 0.5%
and median profit per trade is -0.2%, avoid the system.
https://plus.omnesysindia.com
8
•
Largest Win Trade (%): This is more important than the largest single losing trade. Why?
Suppose, for example, your total hypothetical profit was 40%, and say 20% of this is
attributed to only one trade, and then what you have is a distorted average trade figure. It’s
often a good idea to remove such an exceptional single trade from the overall results and
re-compute the system performance in order to confirm whether the trading system is
actually good enough to trade. In real life trading, be as realistic as possible and be
prepared that you may never encounter that largest winning trade derived from the back
tested results.
•
Largest Loss Trade (%): This measure indicates how much of the drawdown the result of
a single losing trade is. In real-life trading, this helps you adjust the initial stop loss.
For example, if the average losing trade was 1% and the largest single losing
trade was 3% as you would readily guess, a good portion of the average losing trade is
borne by the largest losing trade.
If you had a better way of managing the largest loser, your overall system
performance would be considerably better. In real life trading be prepared to encounter an
even higher largest loss, than thrown up by back tested results and brace yourself to
handle such situation.
•
Max Consec Wins: The maximum number of consecutive winning trades generated by
the trading strategy.
•
Max Consec Loss: The maximum number of consecutive winning trades generated by
the trading strategy.
•
Profit Factor: Profit factor is the system’s gross profit in rupee terms divided by gross loss
in rupee terms. Look for systems that have a profit factor of 2.5, or higher.
•
Outlier Adj Prof Factor: With any trading system, you are going to have one or two
exceptional wins. The chances of these trades recurring in the future are very slim and
shouldn’t be considered in the overall performance summary. It is often a good idea to
remove the largest single winning trade while calculating the outlier adjusted profit factor.
https://plus.omnesysindia.com
9
Intraday Screener Use Case Scenarios:
•
Do note that ScreenerIQ screens for only stocks in the Nifty, Junior Nifty , Midcap Nifty and
few highly traded(as measured by the average 3 month volume) for the intraday screeners
and is run is 15 minutes delayed data feed.
•
All the entry points are assumed on the previous day’s daily OHLC bar, other than the
Open, which is current trading days open.
https://plus.omnesysindia.com
10
Example screening for stocks opening with minus 1% gap down:
• The user is presented with the list of the stocks that are opening with 1% gap down from the
previous closing price.
• You will find the signal description at the bottom of the page (not shown in the above screen
shot).
• The user is presented with Preference, Entry, # Trades, #Wins, # Losses % Wins, Profit Factor,
and More Columns.
The description:
Preference: This column will have either of the two entries, i.e. ‘long’ or ‘short’. If it is ‘long’, it
means going long would have been profitable; conversely, if it is ‘short’, going short would have
been profitable. Long/Short are arrived at historical backtesting report over 4 years based on the
most profitable action by summing the change% details.
Entry Price: Price at which the trading strategy triggered, For Intraday Trade-Ideas the entry price
usually a reference-able price point like Previous day’s high/low, Current Open , Current Open+/certain percentage, various pivot points to name a few.
https://plus.omnesysindia.com
11
# Trades: Number of trades generated by the trading strategy on a stock over the last four years.
Look for a sample of a minimum of 16 trades in last four years in order to support the statistical
significance of back-testing results.
#Wins: Number of winning trades generated by the trading strategy.
# Losses: Number of losing trades generated by the trading strategy.
% Wins: Number of winning trades expressed as percentage.
Profit Factor: Profit factor is the system’s gross profit in rupee terms divided by gross loss in
rupee terms. Look for trading systems that have a profit factor of 2.5, or higher. The above fields
are generated via historical backtesting, assuming the trade is exited at the next day close, and
the default test period is 4 years.
More: will take the user to a detailed backtest report page.
https://plus.omnesysindia.com
12
Example backtest report for JSWISPAT Gap down with 1% from previous close, assuming
entry at open and exit at close:
The Backtest report is generated assuming the exit is at the closing price of the current
trading day, from the entry point the trading strategy triggered(usually open , open+/- ,
previous day’s high /low , Pivot points etc).
All the points or more or less same as in the backtest report for EOD screeners except the user
can only select the exit at the same day’s close.
https://plus.omnesysindia.com
13
Custom Screener Use Case Scenarios:
Example screening for stocks that are up for 3 days in row and that are up by 1% or more
during the current trading session:
https://plus.omnesysindia.com
14
•
•
User can select any combinations of various trading strategies and upon clicking the show
results button, are presented with the stocks meeting the user selected criteria.
Upon clicking the Backtest link, user is presented with the detailed backtest report and the
explanation of the parameters presented are same as in detailed back test report.
Rankings Use Case Scenarios:
On the Ranking page user can select, the following options to see how the NSE listed stocks are
ranked for the selected item.
•
1 Day Change %: One trading day change of the Stock.
•
1 Week Change %: One trading week change of the Stock.
•
1 Month Change %: One trading month (20 trading days) change of the Stock.
•
Quarter Change %: One trading quarter (62 trading days) change of the Stock.
•
Half Year Change %: Change% of the stock of over the last six months(125 trading days).
•
Year Change%: Change% of the stock of over the last one year(250 trading days).
•
1 Day Relative Performance %: measures how a stock is performing relative to a Nifty 50
index over one 1 day.
•
1 Week Relative Performance %: measures how a stock is performing relative to a Nifty
50 index over one trading week (5 trading days).
https://plus.omnesysindia.com
15
•
1 Month Relative Performance %: measures how a stock is performing relative to a Nifty
50 index over one trading month(20 trading days).
•
Quarter Relative Performance %: measures how a stock is performing relative to a Nifty
50 index over one trading quarter (62 trading days).
•
Year Relative Performance %: measures how a stock is performing relative to a Nifty 50
index over one trading year(250 trading days).
•
20 Day High %: Change from 20-day High.
•
20 Day Low %: Change from 20-day Low.
•
Year High %: Change from 52 Week High.
•
Year Low %: Change from 52 Week Low.
•
SMA 20%: Change from 20-day Moving Average.
•
SMA 50%: Change From 50-day Moving Average.
•
SMA 200%: Change From 200-day Moving Average.
•
Alpha: alpha is calculated as:
- the stock return over last one year
- the market ( Nifty Index)return over the last year.
- the risk-free rate of return and ( risk free returns is assumed at 6% p.a)
- the beta of the stock.
Jensen's alpha = Portfolio Return − [Risk Free Rate + Portfolio Beta * (Market Return − Risk
Free Rate)]
https://plus.omnesysindia.com
16
Beta 1Year: The formula for the beta of an stock is where ra measures the rate of return of the
stock , rb measures the rate of return of the nifty 50 index, and cov(ra,rb) is the covariance
between the rates of return. ScreenerIQ calculates the Beta by using one day change% of the
stock and Nifty Index over the last 250 trading days.
Correlation 1 Year: Stocks correlation with Nifty Index over the last one year Standard Deviation
1 Year : measure of volatility of the stock, calculated as a standard deviation of the price change%
over the last one year multiplied by Sqrt(250).
End of Document
https://plus.omnesysindia.com
17