1
Operation Manual
Thorlabs Instrumentation
Optical Power Meter
PM100A
2009
Version: 17655-D02 REV A
Date:
24.04.2009
Copyright© 2009, Thorlabs, Germany
Contents
1 page
General Information
1.1 Safety
1.2 Ordering Codes and Accessories
2 Getting Started
3 Unpacking
3.1 Preparation
3.2 Physical Overview
3.2.1 Front Panel
3.2.2 Side Panel
3.2.3 Rear Panel
3.2.4 Bottom
3.2.5 Display
5 6 8 9 9 9 10 10 10 11 11 12 4 13 13 13 13 13 15 15 15 16 17 18 18 19 19 20 Operating the PM100A
4.1 Connecting a Power Sensor
4.2 Controlling the PM100A
4.2.1 Navigating the Menus
4.2.2 System Settings
4.2.3 Power Measurement
4.2.3.1 Range and Scale Control
4.2.3.2 Wavelength Correction
4.2.3.3 Zeroing
4.2.3.4 Setting an Attenuation / Gain Factor
4.2.3.5 Relative Power Measurement
4.2.4 Display Options
4.2.5 Sensor Dependent Functions
4.2.5.1 Photodiode Sensors
4.2.5.2 Thermal Power Sensors
4.3 Analog Output
4.4 Tune Sound
4.5 Battery Charging
5 Measurement Considerations
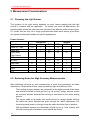
5.1 Choosing the right Sensor
5.2 Reducing Noise for High Accuracy Measurements
5.3 Power Measurement of Pulsed Signals
5.4 Line width of Light Sources
5.5 Temperature Effects on Thermal Sensors
5.6 Ambient and Stray Light
5.7 Back Reflection
22 22 23 24 24 24 25 25 25 26 26 5.8 Beam Diameter vs. Active Sensor Area
5.9 Fiber Based Measurements
6 Computer Interface
6.1 PM100 Utility Software
6.1.1 Front Panel
6.1.2 Description of the Front Panel Elements:
6.2 Firmware Update
6.3 Simple LabVIEW Example using SCPI Commands
6.4 Using the Instrument Drivers
6.5 SCPI Commands
6.5.1 An Introduction to the SCPI language
6.5.2 IEEE488.2 Common Commands
6.5.2.1 Command summary
6.5.2.2 Command reference
6.5.2.3 PM100D specific SCPI Command Reference
6.6 Maintenance and Repair
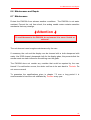
6.7 Maintenance
6.8 Troubleshooting
7 Appendix
7.1 Warranty
7.2 Certifications and compliances
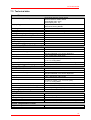
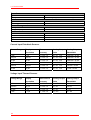
7.3 Technical data
7.4 Pin Assignment of the Sensor Connector
7.5 Thorlabs ‘End of Life’ policy (WEEE)
7.5.1 Waste treatment on your own responsibility
7.5.2 Ecological background
7.6 List of figures
7.7 Addresses
2
26 27 28 28 29 29 32 33 37 38 38 41 41 42 43 53 53 54 55 55 56 57 59 60 60 61 62 63 We aim to develop and produce the best solution for your application in the
field of optical measurement technique. To help us to live up to your
expectations and develop our products permanently we need your ideas and
suggestions. Therefore, please let us know about possible criticism or ideas.
We and our international partners are looking forward to hearing from you.
Thorlabs
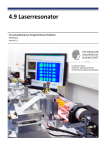
This part of the instruction manual contains every specific information on the PM100A
handheld optical power meter. A general description is followed by explanations of
how to operate the unit manually. You will also find information about a simple
remote control of the unit.
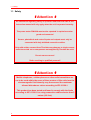
Attention
This manual contains ‘WARNINGS” and ‘ATTENTION” labels in this
form, to indicate danger for persons or possible damage to equipment.
Please read these advises carefully!
NOTE
This manual also contains ‘NOTES” and ‘HINTS” written in this form.
3
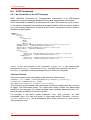
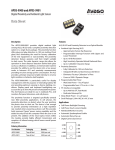
1.1 Safety
1 General Information
The PM100A Handheld Optical Power Meter is designed to measure the optical
power of laser light or other monochromatic or near monochromatic light sources and
the energy of pulsed light sources.
The space-saving, battery powered design and compatibility to all Thorlabs “C-Type”
Photodiode, Thermal, Pyroelectric sensors, and custom Photodiode, Thermal and
Pyroelectric detectors, featured with a fast USB device interface open a wide range
of applications in Manufacturing, Quality Control, Quality Assurance, and R&D for
stationary and field use.
The unit combines a precise 4 digit power readout with a mechanical, mirror
supported analog needle meter to perform laser tuning tasks or watching trends.
Please refer to the user manual on the data carrier supplied with the unit for detailed
function description.
The provided software, including drivers and applications for LabVIEW and C makes
it easy to integrate the instrument in test and measurement systems.
A rechargeable lithium polymer battery allows long intervals between the charging
cycles. The unit can be recharged with the supplied AC adapter or via USB
connection to a PC or laptop.
5
1.1 Safety
1.1 Safety
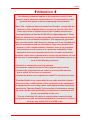
Attention
All statements regarding safety of operation and technical data in this
instruction manual will only apply when the unit is operated correctly.
The power meter PM100A must not be operated in explosion endangered environments!
Sensor, photodiode and control inputs and outputs must only be
connected with duly shielded connection cables.
Only with written consent from Thorlabs may changes to single components be carried out or components not supplied by Thorlabs be used.
Do not remove covers!
Refer servicing to qualified personal!
Attention
Mobile telephones, cellular phones or other radio transmitters are
not to be used within the range of three meters of this unit since the
electromagnetic field intensity may then exceed the maximum
allowed disturbance values according to IEC 61326-1.
This product has been tested and found to comply with the limits
according to IEC 61326-1 for using connection cables shorter than 3
meters (9.8 feet).
6
1.1 Safety
Attention
The following statement applies to the products covered in this
manual, unless otherwise specified herein. The statement for other
products will appear in the accompanying documentation.
Note: This equipment has been tested and found to comply with the
limits for a Class B digital device, pursuant to Part 15 of the FCC
Rules and meets all requirements of the Canadian InterferenceCausing Equipment Standard ICES-003 for digital apparatus. These
limits are designed to provide reasonable protection against harmful
interference in a residential installation. This equipment generates,
uses, and can radiate radio frequency energy and, if not installed and
used in accordance with the instructions, may cause harmful interference to radio communications. However, there is no guarantee
that interference will not occur in a particular installation. If this
equipment does cause harmful interference to radio or television
reception, which can be determined by turning the equipment off and
on, the user is encouraged to try to correct the interference by one or
more of the following measures:
▪ Reorient or relocate the receiving antenna.
▪ Increase the separation between the equipment and receiver.
▪ Connect the equipment into an outlet on a circuit different from
that to which the receiver is connected.
▪ Consult the dealer or an experienced radio/T.V. technician for help.
Thorlabs GmbH is not responsible for any radio television interference caused by modifications of this equipment or the substitution
or attachment of connecting cables and equipment other than those
specified by Thorlabs GmbH. The correction of interference caused
by such unauthorized modification, substitution or attachment will
be the responsibility of the user.
The use of shielded I/O cables is required when connecting this
equipment to any and all optional peripheral or host devices. Failure
to do so may violate FCC and ICES rules.
7
1.2 Ordering Codes and Accessories
1.2 Ordering Codes and Accessories
Order Code Description
PM100A
Handheld Power Meter Console
Photodiode Power Sensors:
Order Code Type
S120C
S120VC
S121C
S122C
S130C
S130VC
S132C
S140C
S144C
S142C
S145C
S145C
S150C
S151C
S154C
S155C
Compact Sensor
Compact Sensor
Compact Sensor
Compact Sensor
Slim Sensor
Dual Range
Slim Sensor
Dual Range
Slim Sensor
Dual Range
Integr. Sphere (1”)
Integr. Sphere (1”)
Integr. Sphere (2”)
Integr. Sphere (2”)
Integr. Sphere (2”)
Fiber Head
Fiber Head
Fiber Head
Fiber Head
Detector Aperture
mm
Si
∅ 9.5
UV-Si
∅ 9.5
Si
∅ 9.5
Ge
∅ 9.5
Si
∅ 9.5
Wavelength
nm
400 - 1100
200 - 1100
400 - 1100
700 - 1800
400 - 1100
UV-Si
∅ 9.5
200 - 1100
Ge
∅ 9.5
Si
InGaAs
Si
InGaAs
InGaAs
Si
Si
InGaAs
InGaAs
∅ 5.0
∅ 5.0
∅ 12
∅ 12
∅ 12
3.6 x 3.6
3.6 x 3.6
∅ 2.0
∅ 2.0
700 - 1800
1200 - 1800
350 - 1100
800 - 1700
350 - 1100
800 - 1700
800 - 1700
350 - 1100
400 - 1100
700 - 1700
700 - 1700
Power
W
50n - 50m
50n - 50m
500n - 500m
50n - 40m
5n - 5m
500n - 500m
5n - 5m
50n - 50m
5n - 5m
500n - 500m
1µ - 500m
1µ - 500m
10µ - 20
1µ - 3
10µ - 20
100p - 5m
1n - 20m
100p - 5m
1n – 20m
Aperture
mm
∅ 12
Wavelength
nm
190 - 25000
Power
W
100µ - 2
∅ 20
∅ 25
∅ 25
∅ 40
190 - 25000
190 - 10600
190 - 10600
190 - 1100
and 10600
400 - 5200
10m - 10
10m - 60
100m - 250
10m - 60
Thermal Power Sensors:
Order Code Type
S302C
S310C
S314C
S322C
S350C
S370C
Thermally Stabilized
Thermal Absorber
Thermal Surface Absorber
Thermal Surface Absorber
Thermal Surface Absorber
Thermal Surface Absorber
Excimer Coating
Thermal Volume Absorber
for high peak power lasers
∅ 25
10m - 15
Please visit our homepage http://www.thorlabs.com for various accessories like fiber
adapters, posts and post-holders, data sheets and further information.
8
3.1 Preparation
2 Getting Started
3 Unpacking
Inspect the shipping container for damage.
If the shipping container seems to be damaged, keep it until you have inspected the
contents and you have inspected the PM100A mechanically and electrically.
Verify that you have received the following items within the hard-case:
1. PM100A power meter console
2. Plug-In power supply with Interchangeable primary plug for USA, UK, Europe,
and Australia
3. USB cable, type ‘A’ to ‘mini-B’
4. Quick-start guide
5. USB memory stick with instrument drivers, user application and operation
manual
6. Certificate of Calibration
3.1 Preparation
Configure the plug-in power supply with the primary plug for your local power supply.
Connect a suitable power or energy sensor.
Turn the unit on by pressing the power button in the side panel.
After switching on the unit, the graphics display will show the device status and then
jump to the last measurement screen before power down.
The PM100A is immediately ready to use after turning on.
9
3.2 Physical Overview
3.2 Physical Overview
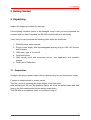
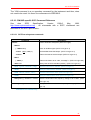
3.2.1 Front Panel
Function Keys:
Navigation:
TSWX
Enter/Edit:
Wavelength:
OK
λ
Relative Measure: Δ
Backlight Key:
Analog Meter
Needle Zero Adjust
(Switch off unit prior to adjusting!)
Figure 1
Graphics Display
Physical Overview Front Panel
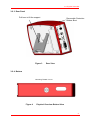
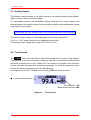
3.2.2 Side Panel
On/Off Switch USB Connector
DC Input (Charger)
Figure 2
10
Sensor Connector (DB9 female)
Analog Output (SMA)
Physical Overview Side Panel
3.2 Physical Overview
3.2.3 Rear Panel
Pull here to lift the support
Figure 3
Removable Protective
Rubber Boot
Rear View
3.2.4 Bottom
Mounting Thread 1/4“-20
Figure 4
Physical Overview Bottom View
11
3.2 Physical Overview
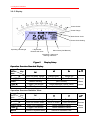
3.2.5 Display
Power Scales
Power Range
Delta Power Scale
Power Scale Setting
Operating Wavelength
4 digit Power
Readout with units
Menu Items (Soft Buttons)
Information, Status and
Warning Indicators
Figure 5
Display Setup
Operation Overview Standard Display:
Function
Key
OK
W
X
R _.__ _W
Auto set Meas. Range
Range Down
Range Up
S _.__ _W
Auto set Needle Scale
Zoom In Scale
Zoom Out Scale
Menu
Item
ZERO
TUNE ;
MENU
ST
Browse
Perform Zeroing
(No Function)
Menu
Toggle Tune Sound
Reset Maximum Power Value
Items
Enter/Exit System Menu
Switch to Statistics View
Operation Overview Statistics View:
Menu
Item
Function
Key
OK
W
X
R _.__ _W
Auto set Meas. Range
Range Down
Range Up
S _.__ _W
Auto set Needle Scale
Zoom In Scale
Zoom Out Scale
HOLD / RUN
TUNE ;
MENU
12
ST
Browse
Hold / Run Statistics
Reset Statistics Values
Menu
Toggle Tune Sound
Reset Statistics Values
Items
Enter/Exit System Menu
Switch to Standard View
4.1 Connecting a Power Sensor
4 Operating the PM100A
4.1 Connecting a Power Sensor
The PM100A supports all Thorlabs ‘C-Series photodiode and thermal sensors. These
can easily identified against older versions of Thorlabs power sensors by their red
connector housing. The console will not recognize sensors from the ‘A’ and ‘B’ series.
Please contact Thorlabs for the upgrade of old sensors with ‘C-Series’ connectors.
To plug or remove a sensor slightly press on the two bolts in the connector housing,
that fix it by resilience. Sensors can be ‘hot-swapped’ to the console, after
recognizing a new valid sensor the type and calibration data will be downloaded to
the console in approximately 2 seconds, and the unit is ready to operate with the new
sensor.
The PM100A also supports custom detectors, please refer to chapter 4.2.2 for the
console measurement settings and chapter 7.4 for the connector pin-out.
4.2 Controlling the PM100A
4.2.1 Navigating the Menus
The measurement screens contain of five menu items (soft buttons) that are
arranged in a column in the right of the graphics display. These can be navigated
with the up and down (ST) keys and controlled by the left and right (WX) keys
and/or the enter/edit (OK) key
The focus is always on the button in inverse presentation .
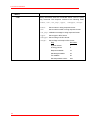
4.2.2 System Settings
After navigating to the bottom soft button MENU and confirming it with the OK key
the system menu can be scrolled with the S or T keys. To perform the initial
adjustments the settings can be edit or changed with the W or X keys on ring
controls or by using all navigation keys for numeric controls.
The menu is arranged on three pages with four lines each. The items depend on the
connected sensor. To leave the system menu press the OK key or navigate down or
up to the ‘EXIT’ item and confirm with OK.
Page 1: Measurement Settings
13
4.2 Controlling the PM100A
Bandwidth
Accelerator
Attenuation
Line Filter
Adapter Type
Sets input bandwidth to High or Low (WX)
(only visible with connected photodiode sensor)
Enables/disables the speed up circuit (WX)
(only visible with connected thermal sensors)
Includes a filter or beam splitter for the power calculation.
The input is in dB. When an attenuation is set, the value is
displayed in the status indicator. (WXST)
Sets the unit to the local line frequency 50Hz/60Hz
to avoid aliasing effects (WX)
Sets the PM100A into the mode to measure photo current
or thermal voltage. Please refer to the chapters 4.2.5.1.2,
4.2.5.2.2 and 7.4 for connecting custom sensors. (WX)
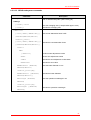
Page 2: Console Settings
Interface
Backlight
Battery Timer
Firmware Upload
Shows the remote status. Press W or X to set the unit
back to local mode.
Sets the brightness of the LCD and key backlight.
The setting range is 0 (off) – 100% (maximum). (WXST)
The unit automatically powers off in battery operation after
a certain time without user action. This feature can be set
to 10 or 60 minutes, or switched off; and is not active
when an external power supply (AC adapter or USB) is
connected. (WX)
Needs to be set to ‘ON’ before uploading a new firmware
version. The function will automatically reset to ‘OFF’ after
powering down. (WX)
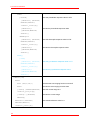
Page 3: System Information
Console InformationX Shows device type, serial number and calibration date.
(WX)
Sensor InformationX Shows type and serial number of the connected
power sensor. (WX)
Tau
Sets the time constant for custom thermal sensors. (only
visible with connected custom thermal sensor) (WXST)
EXIT
Aborts the system menu and switches back to the last
measurement screen. (OK)
14
4.2 Controlling the PM100A
4.2.3 Power Measurement
4.2.3.1 Range and Scale Control
4.2.3.1.1 Measurement Range Control
Navigate to the topmost menu item R -.-- -W ; 6 power corresponding current or 4
power corresponding voltage ranges can be adjusted manually with the W or X
keys. Pressing the OK key the unit performs a nonrecurring auto-ranging until the
optimum range has been found for the currently measured power level. The range
control menu item indicates the particular full range value in Watts.
A permanent auto-range mode is only available in remote operation.
4.2.3.1.2 Needle Scale Control
After setting the measurement range the unit automatically selects the needle scale,
where the full power range is covered. To change the needle scale navigate to the
S -.-- -W menu item. With the W or X keys the scale can be optimized to different
end scales for best readability of the power value (zoom function). This adjustment
can also be automated by pressing the OK key. The scale control menu item
indicates the particular full scale value in Watts.
The scales end have a fixed 1 – 2 – 5 grid, therefore it is possible that the full scale
range may be higher than the power range. In such a case, when the power level is
exceeding the power range, the needle will deflect to the right stop and the readout
value will indicate ‘HIGH’.
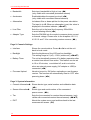
4.2.3.2 Wavelength Correction
λ
Most power and energy sensors show a dependent behaviour in their spectral
response. For accurate measurements it is important to set the PM100A to the
wavelength of the light to measure.
Pressing the λ key leads to a wavelength menu with 8+1 individually configurable
sensor independent settings. The currently set operating wavelenght is indicated by a
following arrow () and has focus when entering the menu. Select the desired
operating wavelength by navigating with the STWX keys and confirming with OK.
The λ key allows to exit without changing the operating wavelength.
15
4.2 Controlling the PM100A
To preconfigure or edit a wavelength item, navigate to it and keep the OK key
pressed until the last digit gets underlined. Set the desired wavelength with the
STWX keys and confirm with OK.
When selecting a wavelength that is not applicable for the connected sensor a
warning sound will appear and the unit will keep the previous wavelength setting.
Wavelength setting in remote operation will overwrite the down to the right value.
Figure 6
Wavelength Correction
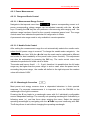
4.2.3.3 Zeroing
Confirming the ZERO menu item with OK, the unit performs an automated zero
adjustment and from now on takes into account this zero level for the power readout
calculation. This feature is used to zeroing thermal sensors, performing dark current
adjustment on photodiode sensors or suppressing small ambient light levels. When
the initial power level is too high, a failure message will appear that is prompting to
cover the power sensor prior to zero adjustment.
Indicator that sensor
needs to be zeroed
Perform zeroing: OK
Figure 7
Zeroing
Do not hold a sensor in the hand, especially a thermal sensor, when
performing a zero adjustment. Temperature effects will influence the
quality of the zeroing result!
When measuring very small power levels dark current of photodiode sensors or zero
voltage on thermal sensors will have an influence on the measurement result and
must be compensated by the zero adjustment. An indicator that a sensor needs to be
zeroed is when with covered sensor either a negative power reading or a reading
much greater than zero is displayed. At negative power readings additionally a
‘ZERO!’ warning appears in the status display.
16
4.2 Controlling the PM100A
After performing a zero adjustment, the detected zero value will be included in all
power readings. The detected zero value may influence the wavelength corrected
calculated full scale power range values in the lower power ranges.
Photodiode sensors emit small current levels, even when no photons hit the active
area – the so called dark current, that is temperature dependent and in the region of
some nA for silicon and InGaAs sensors and up to some µA for germanium sensors.
Thermopile sensors need to be zeroed when thermal differences between active area
(thermal disk) and the sensor heat sink appear when no light hits the active area or
when the heat sink gets hot under light exposure. The zero value will be negative
when the heat sink is hotter than the active area and positive, when the active area is
hotter than the heat sink. When both heat sink and active area are at room
temperature a zero voltage of some µV is normal.
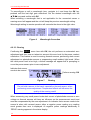
4.2.3.4 Setting an Attenuation / Gain Factor
To set an attenuation or gain factor that will be taken into account when calculating
the displayed power, enter the system menu and navigate to the Attenuation item.
MENU \ Attenuation
When confirming this item with the OK key an attenuation or gain factor from 60 dB
to -60 dB can be entered by the STWX keys. A positive value will set an attenuation
factor. Confirm the setting with OK and quit the menu by W or X.
The attenuation set value in dB will be indicated in the status display above the
measurement value.
This feature can be used to display the origin laser or probe power, with having a
filter or beam splitter in the system; or to enlarge the measurement range of a power
or energy sensor with a calibrated filter.
Attenuation set value
Figure 8
Attenuation
17
4.2 Controlling the PM100A
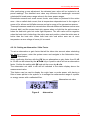
4.2.3.5 Relative Power Measurement
Δ
The Δ key switches on and off the relative measurement mode.
The main display will set to zero and gets signed, the offset and the absolute power
value will be displayed in two sub displays in negative presentation. The analog
needle will deflect to the middle position with bidirectional amplitude (0 at the scale
below the mirror) and change to the next sensitive scale.
P = absolute power level
P0 = offset power level
bidirectional needle
Scale (± 100µW)
signed delta power level
Figure 9
Relative Measurement
4.2.4 Display Options
The PM100A can toggle between the standard measurement screen and a statistics
screen by navigating to the MENU item and pressing one of the W or X keys.
The statistics screen shows the actual, minimum, maximum and average power level.
The HOLD/RUN soft button in the display menu controls this feature. When the item
has focus, the OK button toggles between run and hold mode; in hold mode, the
device samples in the background.
The W or X key resets all items to the actual power level and restarts sampling.
Ranging during the sampling is possible, though once the actual level exceeds the
measurement range, the stored and calculated values will show ‘High’.
Press.
W or X
Figure 10
18
Display Options
4.2 Controlling the PM100A
4.2.5 Sensor Dependent Functions
4.2.5.1 Photodiode Sensors
The PM100A works with all Thorlabs S100C series photodiode power sensors. The
sensor is ready to operate few seconds after plugging to the DB9 connector.
Attention
Refer to the sensor data sheet and pay attention to the optical
damage threshold!
Exceeding these values will permanently destroy the sensor!
For the measurement of power levels from nano-watts up to 20 W Thorlabs offers
photodiode sensors that show big advantages in sensitivity, stability and drift against
thermal sensors. The sensors are built up in a combination of a photodiode and a
neutral density filter or a photodiode in combination with an integrating sphere. They
provide linearity over several decades and show a very good sensitivity at smallest
power levels down to the pW range. Handling fairly small power levels the sensor
size can be held small, further the response time of such sensors is very fast down
to the sub-microsecond range.
Photodiodes, neutral density filters and also integrating sphere materials show a
wavelength dependent behaviour and therefore each sensor is individually calibrated
over the whole spectral working range in 5 or 10nm steps. Thereby the sensors
spectral response data gets stored in a non-volatile memory inside the DB-9 sensor
connector and downloaded to the PM100A when plugged to the unit. To perform an
accurate measurement it is necessary to enter the operating wavelength of the light
to measure so that the PM100A can calculate the laser power from the measured
photo current and the right response value from the wavelength calibration table.
4.2.5.1.1 Bandwidth Setting (Signal Filtering)
The analogue bandwidth setting influences the power reading and the analogue
output.
The bandwidth can be selected in the system menu under MENU \ Bandwidth.
Confirming the menu item with OK, the bandwidth setting will toggle between ‘High’
(range dependent bandwidth up to 100kHz) or ‘Low’ (15 Hz bandwidth).
For measuring CW or average power from pulsed sources the bandwidth should be
set to ‘Low’. When using the analogue output to control external equipment or
19
4.2 Controlling the PM100A
measuring peak power levels the ‘High’ setting is required so that the meter can
follow the signal.
4.2.5.1.2 Power Measurements with Photodiodes
Common photodiodes can be used for power measurements with the PM100A.
Therefore the PM100A needs to be set to the ‘Photodiode’ default setting in the
system menu.
MENU \ Adapter Type \ Photo
To perform measurements, a photodiode and an interlock must be connected to the
sensor input (see chapter 7.4 for the connector pin out); it is important to attend to
the right polarity (the cathode needs to be connected to ground).
The operation is similar to photodiode power sensors with the exceptions that the
response value in A/W is indicated instead of the operation wavelength and when
pressing the λ key the response value (for one wavelength) can be set.
Figure 11
Photodiode Mode
4.2.5.2 Thermal Power Sensors
The PM100A is compatible to the Thorlabs S300C series thermal power sensors.
The sensor will be ready to operate few seconds after plugging to the DB9 connector.
Attention
Refer to the sensor data sheet and pay attention to the optical
damage threshold!
Exceeding these values will permanently destroy the sensor!
Thermal sensors absorb the incident laser power, whereby the developing heat gets
turned into a small voltage caused by heat flow through thermocouple elements
between absorbing area and sensor heat sink. Thorlabs offers with its S3xxC series
thermal sensors that cover a wide range of applications. The sensors are available
with different coatings. Black broad band coating as absorber does not need a
20
4.2 Controlling the PM100A
wavelength correction because the response is nearly flat from the UV to the mid-IR.
Special hard coatings can withstand high power levels and show also a good spectral
flatness. Further Thorlabs offers special heads for Excimer lasers with large beam
diameters and short pulse lasers with coatings for very high peak power levels.
The output voltage of a thermal sensor is linear to the incident laser power, as long
the thermal system is properly zeroed. The main application area for thermal sensors
is the measurement of high power levels from 100mW. Thorlabs offers also a special
thermally isolated thermal head with flat response and on power levels starting in the
µW range.
4.2.5.2.1 Readout acceleration
Thermal sensors show a fairly slow response. When laser power hits the active area
it takes, depending on the sensor type, from some 1 up to 20 seconds until the
system has settled and the power reading shows the right value.
Through special circuitry this time can be shortened to approximately 1-3 seconds by
‘predicting’ the final power value. The PM100A automatically uses the right
adjustment of the electronics to the time constant of the thermal sensor.
Nevertheless this circuitry has the disadvantage of inducing some noise to the
measurement value. Therefore the acceleration circuit can be disabled / enabled in
the system Menu: MENU \ Accelerator On/Off
4.2.5.2.2 Custom Thermal Elements
Custom thermal elements can be used for power measurements with the PM100A.
Therefore the PM100A needs to be set to the ‘Thermopile’ default setting in the
system menu:
MENU \ Adapter Type \ Thermo
To perform measurements, a thermal element and an interlock must be connected to
the sensor input (see chapter 7.4 for the connector pin out). The operation is similar
to thermal power sensors with following exceptions:
- The response value in V/W is indicated instead of the operation wavelength.
- When pressing the λ key the response value (for one wavelength) can be set.
- In system menu on page 3, the time constant (τ0 – 63%) of the connected
thermal sensor can be set. This time constant value adjusts the acceleration
circuit for the measurement prediction.
21
4.3 Analog Output
4.3 Analog Output
The analog output provides on its SMA connector the amplified and buffered photodiode current or thermal sensor voltage.
For photodiode sensors the bandwidth setting influences the output signal; with
thermal sensors the analog output shows the direct amplified and accelerated voltage
response from the sensor.
The signals from the analog output are not wavelength and zero corrected!
The analog output voltage is range dependent and can be calculated to:
UAnalog Out = 2V / power range value x displayed power value
The analog output voltage can range from -0.3V to +2.3V.
4.4 Tune Sound
The TUNE; menu item switches on and off an audible tone for laser tuning support.
The intermitting tone will increase its repetition rate up to a permanent sound at the
maximum reached power level. When the Tune feature is activated, the maximum
level is indicated instead of the operating wavelength. To reset the maximum power
level to the actual level press one of the W or X keys.
Leaving the focus of the ‘TUNE;’ item or pressing OK will stop the sound.
S = maximum power level
Sound on/off: OK
Reset maximum level: WX
Figure 12
22
Tune Sound
4.5 Battery Charging
4.5 Battery Charging
The PM100D is powered by a 1 cell LiPo+ battery that needs to be recharged
intermittently by plugging the AC adapter or plugging the USB cable to a computer.
To fully charge the battery it takes approximately 3-4 hours. A built in charging circuit
automatically regulates and terminates the charging.
Following battery icons in the display header show the charging state from empty to
full battery
The empty battery symbol starts blinking for one minute until the unit shuts off.
When an external power supply is plugged the symbols above change sequent until
the battery is fully charged.
The following icon will appear when a wrong charger is connected or the battery gets
not fully loaded after a given time of approximately four hours. This can happen when
the unit is switched on, the charging is done via USB link and the computer cannot
supply sufficient charging current. The symbol will disappear after 10 seconds when
disconnecting the external power supply and show the actual battery charging state.
Should the ‘arrow icon’ permanently remain there may be a malfunction
either in the battery itself or in the charging circuitry, please refer to
chapter 6.3 for maintenance and repair.
The AC adapter for charging the system battery that comes with the PM100A
provides a wide range power input from 100VAC to 240VAC and an output voltage
from 5VDC. The mains connectors for US, Europe, UK and Australia can be switched
by pressing the lever and pulling off; the new connector easily clicks into the socket.
Do not use other than the provided power supply at the DC input. Higher
input voltages may damage the unit.
When charging the battery via USB link it will take longer until the battery is fully
charged or it never gets completely fully charged. It depends on the connected
computer what charging current can be supplied. The maximum current that can be
drained via USB is limited to 500mA. Some laptop computers just can drive 100mA
via USB interface.
23
5.1 Choosing the right Sensor
5 Measurement Considerations
5.1 Choosing the right Sensor
The question of the right sensor depends on many factors starting with the light
source to measure and the application. No sensor can cover all applications; the
following table shows the main pros and contras of the different power sensor types.
Of course this can only be a rough guide because within each sensor group there
are special models best suitable for specific applications.
Power Sensors:
Photodiode
Light Source
Thermal
Si
Ge
InGaAs
BB
HTC
Volume
+++
+
-
++
-
-
Diode NIR
-
+
+++
++
-
-
High Power
Fiber Lasers
-
-
++
++
++
-
ASE sources
-
-
++
++
-
-
fs Laser
-
+
++
++
+
-
++
-
-
++
+
-
Excimer
-
-
-
-
+++
+
YAG
-
-
-
-
+
+++
LED
+
-
-
+++
+
-
Diode UV - NIR
Gas Laser
5.2 Reducing Noise for High Accuracy Measurements
Main disturbing influence on each measurement is noise from grounding, the cable
capacitance, temperature effects, stray and ambient light and detector noise.
- The housing of power sensors are connected to the digital ground of the meter
and should be linked to earth ground (e.g. via a post); energy sensors should
be mounted isolated, because the housing is connected to the meter analog
ground.
- The sensor cable must handle very small current or voltage signals. Moving
the cable will induce disturbances given through the cable capacitance. For
measuring small power or energy levels the cable should be fixed in position.
- With photodiode sensors the bandwidth should be set to “Low” setting; with
thermal sensors the acceleration circuit should be shut off.
24
5.3 Power Measurement of Pulsed Signals
-
The detector noise is lowest with silicon or InGaAs sensors.
For long term measurements in free space applications it is necessary to
provide constant ambient light conditions, or shielding the beam.
The temperature should be stable over the time of the measurement.
5.3 Power Measurement of Pulsed Signals
The PM100A will read the average value of a pulsed signal when the following
conditions apply: For a thermal sensor pulse length, repetition rate and peak power is
uncritical as long as the peak power is lower than the damage threshold of the
sensor. A thermal sensor reacts very slow and will integrate the power incident on the
active area of the sensor.
With a photodiode sensor that can follow short pulses in the ns range it is important
that the pulse peak power is within the maximum power range of the sensor. It is also
important that the power range is set that accordingly the peak power is within this
range, otherwise the reading will clip at the range end and lead to a wrong average
value. Further it is important to use a power range that can measure the peak value,
therefore the Min-Max function is very helpful. Depending on the pulse length and
repetition rate the bandwidth setting will influence the power reading. It is
recommended to use the ‘LOW’ bandwidth setting for a stable display; when the
pulse should be monitored via the analog output, the bandwidth should be set to
‘HIGH’.
5.4 Line width of Light Sources
The line width of light sources can be neglected only when using a broadband
thermal or pyro-electric sensor. Photodiode sensors show a strong dependency of
the operating wavelength so if the line width of light sources is greater than 10nm
(e.g. LED) there may be an influence on the displayed power. To achieve the best
result for broadband light sources with a photodiode sensor it is necessary that the
response curve is nearly linear over the line width. When entering the center
wavelength of the light source as operation wavelength the PM100A will nearly show
the right optical power for a symmetrical spectral response shape.
5.5 Temperature Effects on Thermal Sensors
Thermal sensors react on any temperature differences that occur between thermal
disc and heat sink. Influence to the measurement result can be caused by airflow
25
5.6 Ambient and Stray Light
disturbances or by heating up the heat sink through long enough exposure of the
laser beam to the thermal disc.
To avoid disturbances it is recommended to shield the sensor as good as possible
from airflow and to zero it properly in the operating condition. That means for short
term measurements zero the cold sensor, for long term measurements zero the
sensor when it is in a state of thermal stability (e.g. after 10 minutes light exposure).
5.6 Ambient and Stray Light
Ambient or stray light can strongly affect the measurement accuracy in free-space
applications. A permanent background light level can be subtracted by conducting a
zero adjustment. More complicated is varying ambient light like daylight or turning
on/off room light. In such cases the only solution is a proper light shielding of the
sensor.
5.7 Back Reflection
Photodiodes, ND filters and even black coatings of thermal sensors show a certain
kind of back reflection of the incoming light. Back reflection for example to a diode or
HeNe laser can distort the power stability of the laser, therefore it is recommended to
slightly tilt the power meter sensor in the laser beam.
When back reflection must be avoided it is advised to use an integrating sphere
based S14xC series sensor where the incoming light gets nearly completely
absorbed in the sensor.
5.8 Beam Diameter vs. Active Sensor Area
Most sensors are not completely uniform in their response over the active area;
except are sensors that are using an integrating sphere as filter and diffuser.
To overcome uniformity issues the incident beam should have a diameter larger than
10% sensor area.
A second topic to follow are the maximum allowed power and energy densities of the
sensor. The maximum ratings are given in the sensor spec-sheet. The PM100A can
display the actual power or energy density for a known beam diameter. For high
power or high energy beams a good efficiency can be reached to chose a detector
that is about 20% - 30% larger than the beam diameter.
26
5.9 Fiber Based Measurements
5.9 Fiber Based Measurements
Laser light emits from an optical fiber in a conical shape, with an angle twice the
acceptance angle of the fiber. The acceptance angle is calculated by the numerical
aperture of the fiber and is defined as the inverse sine of the numerical aperture.
Fore typical single mode fibers the total angle of the emitted light is between 15° and
25°, for an angled connector (APC) the cone shifts by approximately 4° from the fiber
axis.
This expansion of the beam has to be considered to avoid overfilling the detector and
getting wrong results. On the other hand for measurements with high power fiber
lasers a certain gap between fiber tip and detector surface has to be kept to
decrease the power density.
Thorlabs offers fiber adapters with the most common connectors that are verified with
the S12xC series optical sensors and with most thermal sensors.
For large divergence angles or fiber measurements that are critical to backreflections it is recommended to use an integrating sphere based sensor from the
S14xC series.
Another good choice for fiber based measurements are the new ‘Fiber-Heads’ of the
S15xC series. They plug directly to the meter and go without a disturbing cable
between sensor and console.
27
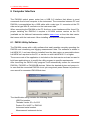
6.1 PM100 Utility Software
6 Computer Interface
The PM100A optical power meter has a USB 2.0 interface that allows to send
commands from a host computer to the instrument. The connection between PC and
PM100A is accomplished by a USB cable with a male type ‘A’ connector at the PC
side and a type ‘Mini B’ connector on the instrument side.
When connecting the PM100A to the PC first time, a new hardware will be found. For
proper installing the PM100A it requires a NI-VISA runtime version on the PC
(available on the National Instruments website www.ni.com or from the data carrier
that comes with the instrument. Allow installing and follow the dialog instructions.
6.1 PM100 Utility Software
The PM100A comes with a utility software that easily enables remotely operating the
PM100A and visualizing and logging measurement data. The software is written in
LabVIEW 8.5.1 and can either be installed from the data carrier as executable where
LabVIEW isn’t required on the PC; or can be run with LabVIEW 8.5.1 or higher.
The source code of the application is included on the data carrier and can be used to
build own applications or to modify the utility program to specific requirements.
After launching the PM100 utility program it will automatically screen for connected
PM100A, PM100D or PM100USB devices. Select the desired device and press o.k.
In case that the connected PM100A is not yet recognized, press Rescan to perform a
new search for connected PM100A devices.
The identification string contains the following items:
USB Port number
Thorlabs Vendor ID = 0x1313
Product ID = 0x8071 = PM100A
Instrument serial number
Measurement instrument device
28
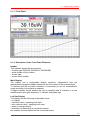
6.1 PM100 Utility Software
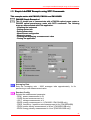
6.1.1 Front Panel
6.1.2 Description of the Front Panel Elements:
Header
This indicator shows the device setup:
- console type (PM100A, PM100D or PM100USB)
- serial number of the console
- sensor type
- sensor serial number
Main Display
The display has a configurable display resolution. Independent from the
measurement range the display always has the full number of the selected digits.
To achieve best AD converter resolution it is necessary to set the measurement
range according to the signal to measure.
A trigger indicator shows whether the unit is sampling data ‘A’ indicator or a new
measurement value gets displayed ‘T’ indicator and green light.
Left Sub Display
The display has the following configurable items:
- no display
- maximum value - sampling until reset
- ratio max/min value - sampling until reset
- power or energy density
- alternate unit depending on connected sensor
the possible choices depend on the connected sensor
29
6.1 PM100 Utility Software
Right Sub Display
The display has the following configurable items, the possible choices depend on
the connected sensor::
- no display
- minimum value - sampling until reset
- frequency or repetition rate
- temperature
- resistance of temperature sensor
Bargraph indicator
The bargraph indicator shows the incidence or the used measurement range.
Statistics screen
Statistical values in linear and logarithmic representation
Data logging screen
Shows the logging history data
Histogram Power / Energy histogram
- displays histogram data
Chart display
Power/Energy Chart with Y auto scale and a 1000 point history length
Range button
Press to open a dialog box for setting the measurement range
The indicator in the button shows the currently used measurement range in the
chosen unit. A green light indicates 'auto-ranging'
Shortcut: [Shift + F1]
Wavelength / Response button
Press this button to open a dialog box for setting the correction wavelength, or in
adapter mode to enter the responsivity value in A/W or V/W.
The currently used parameter is indicated in the button label.
Shortcut: [Shift + F2]
Measurement configuration button
Depending on the connected sensor the following parameters can be set in the
dialog box:
- display resolution - set number of digits
- averaging rate, a rate of 3000 averages the incoming measurement values for
approx. 1 second
- photodiode bandwidth HI and LO
- acceleration circuit for thermal sensors ON and OFF
- trigger level for pyroelectric sensors
- Zeroing for photodiode and thermal sensors
Shortcut: [Shift + F3]
Units / Display button
A dialog box with the following items appears:
30
6.1 PM100 Utility Software
- configure unit of measure, depending on the connected sensor in W, J, dBm, V
and A
- configure the left sub display
- configure the right sub display
Shortcut: [Shift + F4]
Logging configuration button
Open dialog box to:
- set averaging rate for logging
- set interval between samples
- set number of samples
- configure logging into data file
Shortcut: Shift + F5
Start/Stop log button
- start and stop data logging
Shortcut: [Shift + F6]
Reset / Clear button
- reset min/max monitor
- clear power / energy graph
- clear power / energy histogram
- clear power / energy statistics
- clear log screen
Shortcut: [Shift + F7]
Quit button
- stops the PM100 application
- to restart press the white arrow in the tool bar
Shortcut: [Shift + F8]
31
6.2 Firmware Update
6.2 Firmware Update
Firmware upgrades can be done by the user via the USB interface. Therefore install
the DFU (device firmware upgrade) wizard from the distribution data carrier.
Switch on the PM100A and enable the firmware download in the system menu:
MENU \ FW Update \ ON
(This setting will be reset to ‘OFF’ after the unit was shut off.)
Connect the PM100A to an USB port of your PC, the PC will find a DFU device; when
proceeding the DFU wizard the first time a new DFU device will be recognized,
please allow installing.
After then launch the DFU wizard from the start bar. Follow the wizard instructions.
Please refer to www.thorlabs.com for the latest PM100A firmware version that can be
downloaded as a *.dfu file.
Do not switch off the PM100A or disconnect the USB cable while the
firmware is downloading!
32
6.3 Simple LabVIEW Example using SCPI Commands
6.3
.3 Simple LabVIEW Example using SCPI Commands
This example works with PM100D, PM100A and PM100USB
PM100D Simple Example.vi
This VI shows how to communicate with a PM100A optical power meter or
PM100D optical power/energy meter with SCPI commands. The following
steps are demonstrated within this application:
- Initializing the instrument
- Getting system info
- Setting parameters
- Measurement configuration
- Measuring queue
- Fetching and displaying a measurement value
- Closing the application
Averaging Rate
Sets the averaging rate - 3000 averages take approximately 1s for
performing a new measurement value
Readout Config
Selects the measurement parameter
- POW power measurement in W
- CURR current measurement in A
- VOLT voltage measuremetn in V
- ENER energy measurement in J (PM100D / PM100USB only)
- FREQ frequency / repetition rate measurement in Hz (PM100D/USB)
- PDEN power density measurement in W/cm² (PM100D/USB only)
- EDEN energy density measurement in J/cm² (PM100D/USB only)
33
6.3 Simple LabVIEW Example using SCPI Commands
- RES thermistor resistance measurement in Ohm
- TEMP temperature measurement in °C
Stop
Stops application
Timeout [ms]
Sets a timeout value in ms that allows the instrument to sample.
The timeout must be longer than it takes to perform a new measurement.
This has especially to be considered when performing single shot energy
measurements.
Error log
Error indicator, 'no error' is suppressed
Readout string
Formatted measurement value
- limitation to 4 significant digits
- SI notation
- '.' decimal separator
- appended unit according readout configuration
New
Indicator lights up, when a new measurement value is processed
Sensor Flags
Sensor flag bitmap:
1 Is power sensor
2 Is energy sensor
16 Response settable
32 Wavelength settable
64 Tau settable
256 Has temperature sensor
Sensor Name
Name of connected power/energy sensor
Sensor SN
Serial number of connected power/energy sensor
IDN String
Answer from instrument on *idn? command:
- manufacturer
- model number
- serial number
- firmware version
Readout value
Plain readout value in full resolution
34
6.3 Simple LabVIEW Example using SCPI Commands
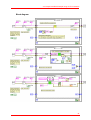
Block diagram
35
6.3 Simple LabVIEW Example using SCPI Commands
PM100D_Initialize.vi
This VI scans for connected devices, that can be selected in a dialog box.
Next steps
- setting timeout
- performing identification query
- configuring the operation register to '512'; flag gets to HI when a new
measurement
value is ready to fetch
- clear operation register
PM100D_Write.vi
Writes a SCPI command to the connected instrument
PM100D_Read.vi
Reads data from the connected instrument. All query commands
according the SCPI command table are terminated by a question mark (?)
PM100D_SensorFlag.vi
This VI queries all relevant sensor info with SYST:SENS:IDN?
- sensor name
- sensor serial number
- calibration message
- sensor type
- sensor sub-type
- sensor flags
PM100D_ConfMeas.vi
- CONFigure measurement; CONF:<parameter> (POW, ENER, etc.)
- ABORt measurement
- Clear operation register with STAT:OPER?
- INITiate measurement
PM100D_SYST-ERR.vi
This VI lists all errors coming from the instrument with the command
SYST:ERR?
'no error' is suppressed
PM100D_Close.vi
Closes the VISA session
Sets the connected instrument in local mode (default option)
36
6.4 Using the Instrument Drivers
6.4 Using the Instrument Drivers
The PM100USB software package contains a set of instrument drivers that allow
conveniently remote controlling the instrument in most common programming
languages. The instrument drivers must be installed, please follow the setup dialog
instructions.
To successfully complete the install of the PM100 USB drivers you
must have Administrator privileges on the PC which you are performing the install.
Prior to connecting the PM100A with the PC, please insert the data carrier that
shipped with the instrument and install the PM100 drivers. When the following
message appears after the installation you have also to install NI-VISA from the
distribution CD or from the National Instruments web site
After successfully installing the software connect the PM100A to a USB port of your
PC. The PC will find a PM100A test and measurement device. Please follow the
instructions of the dialog screens and allow the installing.
37
6.5 SCPI Commands
6.5
SCPI Commands
6.5.1 An Introduction to the SCPI language
SCPI (Standard Commands for Programmable Instruments) is an ASCII-based
instrument command language designed for test and measurement instruments.
SCPI commands are based on a hierarchical structure, also known as a tree system.
In this system, associated commands are grouped together under a common node or
root, thus forming subsystems. A portion of the SENSE subsystem is shown below to
illustrate the tree system.
[SENSe:]
CORRection
:COLLect
:ZERO
[:INITiate]
:ABORt
:STATe?
:MAGNitude?
:BEAMdiameter {MINimum|MAXimum|DEFault|<numeric_value>[mm]}
:BEAMdiameter? [{MINimum|MAXimum|DEFault}]
:WAVelength {MINimum|MAXimum|<numeric_value>[nm]}
:WAVelength? [{MINimum|MAXimum}]
:POWer
[:PDIode]
[:RESPonse] MINimum|MAXimum|DEFault|<numeric_value>[A]}
[:RESPonse]? [{MINimum|MAXimum|DEFault}]
:THERmopile
[:RESPonse] {MINimum|MAXimum|DEFault|<numeric_value>[V]}
[:RESPonse]? [{MINimum|MAXimum|DEFault}]
SENSe is the root keyword of the command, CORRection is the second-level
keyword, and COLLect and BEAMdiameter are third-level keywords, and so on.
A colon ( : ) separates a command keyword from a lower-level keyword.
Command Format
The format used to show commands in this manual is shown below:
CURRent[:DC]:RANGe {MINimum|MAXimum|<numeric_value>[A]}
CORRection:BEAMdiameter {MINimum|MAXimum|DEFault|<numeric_value>[mm]}
The command syntax shows most commands (and some parameters) as a mixture
of upper- and lower-case letters. The upper-case letters indicate the abbreviated
spelling for the command. For shorter program lines, send the abbreviated form. For
better program readability, send the long form.
For example, in the above syntax statement, CURR and CURRENT are both
acceptable forms. You can use upper- or lower-case letters. Therefore, CURRENT,
current, and Current are all acceptable. Other forms, such as CUR and CURREN,
will generate an error.
38
6.5 SCPI Commands
Braces ( { } ) enclose the parameter choices for a given command string. The braces
are not sent with the command string. A vertical bar ( | ) separates multiple
parameter choices for a given command string.
Triangle brackets ( < > ) indicate that you must specify a value for the enclosed
parameter. For example, the above syntax statement shows the range parameter
enclosed in triangle brackets. The brackets are not sent with the command string.
You must specify a value for the parameter (such as "CURR:DC:RANG 50E-6").
Some parameters are enclosed in square brackets ( [ ] ). The brackets indicate that
the parameter is optional and can be omitted. The brackets are not sent with the
command string. In this example [:DC] can be omitted, so the command string can be
shortened to “CURR:RANG 50E-6”. If you do not specify a value for an optional
parameter, the power/energy meter chooses a default value.
Command Separators
A colon ( : ) is used to separate a command keyword from a lower-level keyword.
You must insert a blank space to separate a parameter from a command keyword. If
a command requires more than one parameter, you must separate adjacent
parameters using a comma as shown below:
"SYST:TIME 10, 34, 48"
A semicolon ( ; ) is used to separate commands within the same subsystem, and can
also minimize typing. For example, sending the following command string:
"CORR:BEAM 1; WAVE 1310"
... is the same as sending the following two commands:
"CORR:BEAM 1"
"CORR:WAVE 10"
Use a colon and a semicolon to link commands from different subsystems. For
example, in the following command string, an error is generated if you do not use
both the colon and semicolon:
"CORR:BEAM 1;:AVER 300"
Using the MIN and MAX Parameters
You can substitute MINimum or MAXimum in place of a parameter for many
commands. For example, consider the following command:
CURRent[:DC]:RANGe {MINimum|MAXimum|<numeric_value>[A]}
Instead of selecting a specific current range, you can substitute MIN to set the range
to its minimum value or MAX to set the range to its maximum value.
Querying Parameter Settings
You can query the current value of most parameters by adding a question mark ( ? )
to the command. For example, the following command sets the operating wavelength
to 1550 nm: "CORR:WAVE 1550"
You can query the operating wavelength by executing: "CORR:WAVE?"
You can also query the minimum or maximum operating wavelength allowed as
follows:
"CORR:WAVE? MIN"
"CORR:WAVE? MAX"
Caution If you send two query commands without reading the response from the
first, and then attempt to read the second response, you may receive some data from
39
6.5 SCPI Commands
the first response followed by the complete second response. To avoid this, do not
send a query command without reading the response. When you cannot avoid this
situation, send a device clear before sending the second query command.
SCPI Command Terminators
A command string sent to the power/energy meter must terminate with a <new line>
character. The IEEE-488 EOI (end-or-identify) message is interpreted as a <new
line> character and can be used to terminate a command string in place of a <new
line> character. A <carriage return>
followed by a <new line> is also accepted. Command string termination will always
reset the current SCPI command path to the root level.
IEEE-488.2 Common Commands
The IEEE-488.2 standard defines a set of common commands that perform functions
like reset, self-test, and status operations. Common commands always begin with an
asterisk ( * ), are four to five characters in length, and may include one or more
parameters. The command keyword is separated from the first parameter by a blank
space. Use a semicolon ( ; ) to separate multiple commands as shown below:
"*RST; *CLS; *ESE 32; *OPC?"
SCPI Parameter Types
The SCPI language defines several different data formats to be used in program
messages and response messages.
Numeric Parameters Commands that require numeric parameters will accept all
commonly used decimal representations of numbers including optional signs, decimal
points, and scientific notation.
Special values for numeric parameters like MINimum, MAXimum, and DEFault are
also accepted. You can also send engineering unit suffixes with numeric parameters
(e.g., M, K, or u). If only specific numeric values are accepted, the power/energy meter
will automatically round the input numeric parameters. The following command uses
a numeric parameter:
POWer:REFerence {MINimum|MAXimum|DEFault|<numeric_value>[W]}
Discrete Parameters Discrete parameters are used to program settings that have a
limited number of values (like W, DBM). They can have a short form and a long form
just like command keywords. You can mix upper- and lower-case letters. Query
responses will always return the short form in all upper-case letters. The following
command uses discrete parameters:
POW:UNIT {W|DBM}
Boolean Parameters Boolean parameters represent a single binary condition that is
either true or false. For a false condition, the power/energy meter will accept “OFF” or
“0”. For a true condition, the meter will accept “ON” or “1”. When you query a boolean
setting, the instrument will always return “0” or “1”. The following command uses a
boolean parameter:
CURRent:RANGe:AUTO {OFF|0|ON|1}
String Parameters String parameters can contain virtually any set of ASCII
characters. A string must begin and end with matching quotes; either with a single
quote or with a double quote. You can include the quote delimiter as part of the string
by typing it twice without any characters in between. The following command uses a
string parameter:
DIAG:CALString <quoted string>
40
6.5 SCPI Commands
6.5.2 IEEE488.2 Common Commands
Common commands are device commands that are common to all devices according
to the IEEE488.2 standard. These commands are designed and defined by this
standard. Most of the commands are described in detail in this section. The following
common commands associated with the status structure are covered in the “Status
Structure” section: *CLS, *ESE, *ESE?, *ESR?, *SRE, *SRE?, *STB?
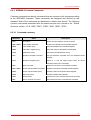
6.5.2.1 Command summary
Mnemonic
*CLS
Name
Clear status
*ESE <NRf> Event enable command
Description
Clears all event registers and Error Queue
Program the Standard Event Enable Register
*ESE?
Event enable query
Read the Standard Event Enable Register
*ESR?
Event status register query
Read and clear the Standard Event Register
*IDN?
Identification query
Read the unit’s identification string
*OPC
Operation complete command
Set the Operation Complete bit in the Standard Event
Register
*OPC?
Operation complete query
Places a “1” into the output queue when all device
operations have been completed
*RST
Reset command
*SRE <NRf> Service request enable command
Returns the unit to the *RST default condition
Programs the Service Request Enable Register
*SRE?
Service request enable query
Reads the Service Request Enable Register
*STB?
Status byte query
Reads the Status Byte Register
*TST?
Self-test query
Performs the unit’s self-test and returns the result.
*WAI
Wait-to-continue command
Wait until all previous commands are executed
41
6.5 SCPI Commands
6.5.2.2 Command reference
6.5.2.2.1 *IDN? – identification query - read identification code
The identification code includes the manufacturer, model code, serial number, and
firmware
revision
levels
and
is
sent
in
the
following
format:
THORLABS,MMM,SSS,X.X.X
Where:
MMM is the model code
SSS is the serial number
X.X.X is the instrument firmware revision level
6.5.2.2.2 *OPC – operation complete - set OPC bit
6.5.2.2.3 *OPC? – operation complete query – places a “1” in output queue
When *OPC is sent, the OPC bit in the Standard Event Register will set after all
pending command operations are complete. When *OPC? is sent, an ASCII “1” is
placed in the Output Queue after all pending command operations are complete.
Typically, either one of these commands is sent after the INITiate command. The
INITiate command is used to take the instrument out of idle in order to perform
measurements. While operating within the trigger model layers, many sent
commands will not execute. After all programmed operations are completed, the
instrument returns to the idle state at which time all pending commands (including
*OPC and/or *OPC?) are executed. After the last pending command is executed, the
OPC bit and/or an ASCII “1” is placed in the Output Queue.
When *OPC is sent, the OPC bit in the Standard Event Register will set after all
pending command operations are complete. When *OPC? is sent, an ASCII “1” is
placed in the Output Queue after all pending command operations are complete.
6.5.2.2.4 *RST – reset – return instrument to defaults
When the *RST command is sent, the instrument performs the following operations:
• Returns the instrument to the default conditions
• Cancels all pending commands.
• Cancels response to any previously received *OPC and *OPC? commands.
6.5.2.2.5 *TST? – self-test query – run self test and read result
Use this query command to perform the instrument self-test routine. The command
places the coded result in the Output Queue. A returned value of zero (0) indicates
that the test passed, other values indicate that the test failed.
6.5.2.2.6 *WAI – wait-to-continue – wait until previous commands are completed
42
6.5 SCPI Commands
The *WAI command is a no operation command for the instrument and thus, does
not need to be used. It is there for conformance to IEEE488.2.
6.5.2.3 PM100D specific SCPI Command Reference
See
also
SCPI
Specification,
Version
1999.0,
May,
1999,
http://www.scpiconsortium.org . All commands with a ’SCPI’ checkmark are
described in the SCPI specification.
6.5.2.3.1 SYSTem subsystem commands
Command
SYSTem
Description
Path to SYSTem subsystem. (SCPI Vol.2 §21)
:BEEPer
[:IMMediate]
Issue an audible signal. (SCPI Vol.2 §21.2.2)
:STATe {ON|1|OFF|0}
Activate/deactivate the beeper. (SCPI Vol.2 §21.2.3)
:STATe?
Return the state of the the beeper (SCPI Vol.2 §21.2.3)
:ERRor
[:NEXT]?
Returns the latest <error code, “message”>. (SCPI Vol.2 §21.8.8)
:VERSion?
Query level of SCPI standard (1999.0) . (SCPI Vol.2 §21.21)
:DATE <year>,<month>,<day>
Sets the instrument’s calendar. (SCPI Vol.2 §21.7)
:DATE?
Query the instrument’s calendar. (SCPI Vol.2 §21.7)
:TIME <hour>,<min>,<sec>
Sets the instrument’s clock. (SCPI Vol.2 §21.19)
:TIME?
Query the instrument’s clock. (SCPI Vol.2 §21.19)
:LFRequency <numeric value>
Sets the instrument’s line frequency setting to 50 or 60Hz. (SCPI
Vol.2 §21.13)
:LFRequency?
Query the instrument’s line frequency setting. (SCPI Vol.2
§21.13)
Commands for PM100D only
43
6.5 SCPI Commands
:SENSor
:IDN?
Query information about the connected sensor. This is a query
only command. The resopnse consists of the following fields:
<name>,<sn>,<cal_msg>,<type>, <subtype>,<flags>
<name>:
Sensor name in string response format
<sn>:
Sensor serial number in string response format
<cal_msg>: calibration message in string response format
<type>:
Sensor type in NR1 format
<subtype>: Sensor subtype in NR1 format
<flags>:
44
Sensor flags as bitmap in NR1 format.
Flag:
Dec.value:
Is power sensor
1
Is energy sensor
2
Response settable
16
Wavelength settable
32
Tau settable
64
Has temperature sensor
256
6.5 SCPI Commands
6.5.2.3.2 STATus subsystem commands
Command
STATus
:MEASurement
Description
Path to STATus subsystem. (SCPI Vol.2 §20)
Path to control measurement event registers
[:EVENt]?
Read the event register
:CONDition?
Read the condition register
:PTRansition <value>
Program the positive transition filter
:PTRansition?
Read the positive transition filter
:NTRansition <value>
Program the negative transition filter
:NTRansition?
Read the negative transition filter
:ENABle <value>
Program the enable register
:ENABle?
Read the enable register
:AUXillary
Path to control measurement event registers
[:EVENt]?
Read the event register
:CONDition?
Read the condition register
:PTRansition <value>
Program the positive transition filter
:PTRansition?
Read the positive transition filter
:NTRansition <value>
Program the negative transition filter
:NTRansition?
Read the negative transition filter
:ENABle <value>
Program the enable register
:ENABle?
Read the enable register
:OPERation
Path to control operation event registers
[:EVENt]?
Read the event register
:CONDition?
Read the condition register
:PTRansition <value>
Program the positive transition filter
:PTRansition?
Read the positive transition filter
:NTRansition <value>
Program the negative transition filter
:NTRansition?
Read the negative transition filter
:ENABle <value>
Program the enable register
:ENABle?
Read the enable register
45
6.5 SCPI Commands
:QUEStionable
Path to control questionable event registers
[:EVENt]?
Read the event register
:CONDition?
Read the condition register
:PTRansition <value>
Program the positive transition filter
:PTRansition?
Read the positive transition filter
:NTRansition <value>
Program the negative transition filter
:NTRansition?
Read the negative transition filter
:ENABle <value>
Program the enable register
:ENABle?
Read the enable register
Return status registers to default states.
:PRESet
6.5.2.3.3 DISPlay subsystem commands
Command
Description
Path to DISPlay subsystem. (SCPI Vol.2 §8)
DISPlay
:BRIGhtness <value>
Set the display birghtness. (SCPI Vol.2 §8.2)
:BRIGhtness?
Return the display birghtness value. (SCPI Vol.2 §8.2)
:CONTrast <value>
Set the display contrast. (SCPI Vol.2 §8.4)
:CONTrast?
Return the display conrast value. (SCPI Vol.2 §8.4)
Commands for PM100D only
6.5.2.3.4 CALibration subsystem commands
Command
CALibration
:STRing?
Description
Path to CALibration subsystem. (SCPI Vol.2 §5)
Returns a human readable calibration string. This is a query
only command. The response is formatted as string response
data.
46
6.5 SCPI Commands
6.5.2.3.5 SENSe subsystem commands
Command
Description
Path to SENSe subsystem. (SCPI Vol.2 §18)
[SENSe]
AVERage
[:COUNt] <value
Sets the averaging rate (1 sample takes approx. 3ms)
[:COUNt]?
Queries the averaging rate
CORRection
[:LOSS[:INPut[:MAGNitude]]]
Sets a user attenuation factor in dB
{MINimum|MAXimum|DEFault|
<numeric_value>}
[:LOSS[:INPut[:MAGNitude]]]?
Queries the user attenuation factor
[{MINimum|MAXimum|DEFault}]
COLLect
ZERO
[:INITiate]
Performs zero adjustment routine
ABORt
Aborts zero adjustment routine
STATe?
Queries the zero adjustment routine state
MAGNitude?
Queries the zero value
BEAMdiameter {MINimum|
Sets the beam diameter in mm
MAXimum|DEFault|
<numeric_value>[mm]}
BEAMdiameter? [{MINimum|
Queries the beam diameter
MAXimum|DEFault}]
WAVelength {MINimum|
Sets the operation wavelength in nm
MAXimum|
<numeric_value>[nm]}
WAVelength? [{MINimum|
Queries the operation wavelength
MAXimum}]
47
6.5 SCPI Commands
POWer
[:PDIOde]
Sets the photodiode response value in A/W
[:RESPonse] {MINimum|
MAXimum|DEFault|
<numeric_value>[A]}
[:RESPonse]?
Queries the photodiode response value
[{MINimum|MAXimum|
DEFault}]
:THERmopile
[:RESPonse] {MINimum|
Sets the thermopile response value in V/W
MAXimum|DEFault|
<numeric_value>[V]}
[:RESPonse]?
Queries the thermopile response value
[{MINimum|MAXimum|
DEFault}]
ENERgy
[:PYRO]
[:RESPonse] {MINimum|
Sets the pyro-detector response value in V/J
MAXimum|DEFault|
<numeric_value>[V]}
[:RESPonse]?
Queries the pyro-detectro response value
[{MINimum|MAXimum|
DEFault}]
CURRent[:DC]
RANGe
AUTO {OFF|0|ON|1}
Switches the auto-ranging function on and off
AUTO?
Queries the auto-ranging function state
[:UPPer] {MINmum|MAXimum|
Sets the current range in A
<numeric_valuje>[A]}
[:UPPer]? [{MINimum|
Queries the current range
MAXimum}]
REFerence {MINimum|
MAXimum|DEFault|
<numeric_value>[A]}
48
Sets a delta reference value in A
6.5 SCPI Commands
REFerence? [{MINimum|
Queries the delta reference value
MAXimum|DEFault}]
STATe {OFF|0|ON|1}
Switches to delta mode
STATe?
Queries the delta mode state
ENERgy
RANGe
[:UPPer] {MINmum|MAXimum|
Sets the energy range in J
<numeric_valuje>[J]}
[:UPPer]? [{MINimum|
Queries the energy range
MAXimum}]
REFerence {MINimum|
Sets a delta reference value in J
MAXimum|DEFault|
<numeric_value>[J]}
REFerence? [{MINimum|
Queries the delta reference value
MAXimum|DEFault}]
STATe {OFF|0|ON|1}
Switches to delta mode
STATe?
Queries the delta mode state
FREQuency
Range
[UPPer]?
Queries the frequency range
LOWer?
POWer[:DC]
RANGe
AUTO {OFF|0|ON|1}
Switches the auto-ranging function on and off
AUTO?
Queries the auto-ranging function state
[:UPPer] {MINmum|MAXimum|
Sets the current range in W
<numeric_valuje>[W]}
[:UPPer]? [{MINimum|
Queries the current range
MAXimum}]
REFerence {MINimum|
Sets a delta reference value in W
MAXimum|DEFault|
<numeric_value>[W]}
REFerence? [{MINimum|
Queries the delta reference value
MAXimum|DEFault}]
STATe {OFF|0|ON|1}
Switches to delta mode
49
6.5 SCPI Commands
STATe?
Queries the delta mode state
UNIT {W|DBM}
Sets the power unit W or dBm
UNIT?
Queries the power unit
VOLTage[:DC]
RANGe
AUTO {OFF|0|ON|1}
Switches the auto-ranging function on and off
AUTO?
Queries the auto-ranging function state
[:UPPer] {MINmum|MAXimum|
Sets the current range in V
<numeric_valuje>[V]}
[:UPPer]? [{MINimum|
Queries the current range
MAXimum}]
REFerence {MINimum|
Sets a delta reference value in V
MAXimum|DEFault|
<numeric_value>[V]}
REFerence? [{MINimum|
Queries the delta reference value
MAXimum|DEFault}]
STATe {OFF|0|ON|1}
Switches to delta mode
STATe?
Queries the delta mode state
PEAKdetector
[:THReshold] {MINimum|
Sets the trigger level in % for the energy mode
MAXimum|DEFault|
<numeric_value>
[:THReshold]? [{MINimum|
Queries the trigger level setting
MAXimum|DEFault}
Commands for PM100D / PM100USB only
50
6.5 SCPI Commands
6.5.2.4 INPut subsystem commands
Command
Description
INPut
[:PDIode]
:FILTer
[:LPASs]
[STATe] {OFF|0|ON|1}
Sets the bandwidth of the photodiode input stage
[STATe]?
Queries the bandwidth of the photodiode inut stage
:THERmopile
:ACCelerator
[STATe] {OFF|0|ON|1}
Sets the thermopile accelerator state
[STATe]?
Queries the thermopile accelerator state
:TAU {MINimum|
Sets thermopile time constant τ(0-63%) in s
MAXimum|DEFault|
<numeric_value>[s]}
:TAU? [{MINimum|
Queries the thermopile time constant τ(0-63%) in s
MAXimum|DEFault}]
:ADAPter
[:TYPE] {PHOTodiode|
Sets default sensor adapter type
THERmal|PYRo}
[:TYPE]?
Queries default sensor adapter type
Commands for PM100D / PM100USB only
51
6.5 SCPI Commands
6.5.2.4.1 Measurement commands
Command
Description
INITiate[:IMMediate]
Start measurement
ABORt
Abort measurement
CONFigure[:SCALar]
[:POWer]
Configure for power measurement
:CURRent[:DC]
Configure for current measurement
:VOLTage[:DC]
Configure for voltage measurement
:ENERgy
Configure for energy measurement
:FREQuency
Configure for frequency measurement
:PDENsity
Configure for power density measurement
:EDENsity
Configure for energy density measurement
:RESistance
Configure for sensor presence resistance measurement
:TEMPerature
Configure for sensor temperature measurement
MEASure[:SCALar]
[:POWer]
Performs a power measurement
:CURRent[:DC]
Performs a current measurement
:VOLTage[:DC]
Performs a voltage measurement
:ENERgy
Performs a energy measurement
:FREQuency
Performs a frequency measurement
:PDENsity
Performs a power density measurement
:EDENsity
Performs a energy density measurement
:RESistance
Performs a sensor presence resistance measurement
:TEMPerature
Performs a sensor temperature measurement
FETCh?
Read last measurement data (SCPI Vol.2 §3.2)
READ?
Start new measurement and read data (SCPI Vol.2 §3.3)
CONFigure?
Query the current measurement configuration.
Commands for PM100D / PM100USB only
52
6.6 Maintenance and Repair
6.6 Maintenance and Repair
6.7 Maintenance
Protect the PM100A from adverse weather conditions. The PM100A is not water
resistant. Prevent the unit from shock, the analog needle meter contains sensitive
mechanics that may misalign.
Attention
To avoid damage to the PM100A, do not expose it to spray, liquids or
solvents!
The unit does not need a regular maintenance by the user.
If necessary the unit and the display can be cleaned with a cloth dampened with
water. Use ‘ESD cleaner’ dampened cloth for the display glass, this prevents that the
needle reacts on static influences like striking over the glass.
The PM100A does not contain any modules that could be repaired by the user
himself. If a malfunction occurs, the whole unit has to be sent back to Thorlabs. Do
not remove covers!
To guarantee the specifications given in chapter 7.3 over a long period it is
recommended to have the unit calibrated by Thorlabs every year.
53
6.8 Troubleshooting
6.8 Troubleshooting
In case that your PM100A shows malfunction please check the following items:
Unit does not work at all (no display at the front):
PM100A turned on?
Press On switch in the left side panel.
PM100A battery discharged / defect
Plug in AC Adapter
Unit automatically switches off
Check auto-shutoff setting
Check battery charging symbol
Plug in AC Adapter
Power reading is negative
A photodiode or thermal sensor is connected
Check if the unit is in relative measurement mode
Conduct the dark current adjustment procedure
A photodiode is connected
Check the polarity of the connected photodiode
A thermal element is connected
Check the polarity of the connected thermal element
Mechanical needle display doesn’t show zero, when unit is switched off
Adjust needle to zero with the screw in the front panel
Check that the unit is switched off prior to adjusting!
Needle deflection doesn’t map with digital read out
The specified accuracy for the analog meter is ±3% full scale, this is 1½
division marks. This accuracy should be given for an temperature operating
range between 10°C to 35°C.
There is a software supplied with the instrument to adjust the needle deflection
to a higher accuracy (< ±1% f.s.) for a specific ambient temperature. Therefore
connect the PM100A via USB to a PC and run the ‘PM100A Needle-Wizard’
software.
If you don’t find the error source by means of the trouble shooting list please first
contact the Thorlabs-Hotline ( [email protected]) before sending the PM100D for
checkup and repair to Thorlabs - Germany.
(refer to section 7.7, ‘Addresses” on page 63)
54
7.1 Warranty
7 Appendix
7.1 Warranty
Thorlabs warrants material and production of the PM100A for a period of 24 months
starting with the date of shipment. During this warranty period Thorlabs will see to
defaults by repair or by exchange if these are entitled to warranty.
For warranty repairs or service the unit must be sent back to Thorlabs or to a place
determined by Thorlabs. The customer will carry the shipping costs to Thorlabs, in
case of warranty repairs Thorlabs will carry the shipping costs back to the customer.
If no warranty repair is applicable the customer also has to carry the costs for back
shipment.
In case of shipment from outside EU duties, taxes etc. which should arise have to be
carried by the customer.
Thorlabs warrants the hard- and software determined by Thorlabs for this unit to
operate fault-free provided that they are handled according to our requirements.
However, Thorlabs does not warrant a fault free and uninterrupted operation of the
unit, of the soft- or firmware for special applications nor this instruction manual to be
error free. Thorlabs is not liable for consequential damages.
Restriction of warranty
The warranty mentioned before does not cover errors and defects being the result of
improper treatment, software or interface not supplied by us, modification, misuse or
operation outside the defined ambient stated by us or unauthorized maintenance.
Further claims will not be consented to and will not be acknowledged. Thorlabs does
explicitly not warrant the usability or the economical use for certain cases of
application.
Thorlabs reserves the right to change this instruction manual or the technical data of
the described unit without notice.
55
7.2 Certifications and compliances
7.2 Certifications and compliances
Certifications and compliances
Category
EC Declaration
of Conformity –
EMC
Standards or description
Meets intent of Directive 89/336/EEC for Electromagnetic Compatibility. Compliance
was demonstrated to the following specifications as listed in the Official Journal of
the European Communities:
Electrical equipment for measurement, control and
EN 61326:1997
laboratory use – EMC requirements:
+A1:1998 +A2:2001
Immunity: complies with immunity test requirements for
+A3:2003
equipment intended for use in industrial locations 1.
Emission: complies with EN 55011 Class B Limits 1,3,
IEC 610003-2 and IEC 61000-3-3.
IEC 61000-4-2
Electrostatic Discharge Immunity (Performance criterion C)
IEC 61000-4-3
Radiated RF Electromagnetic Field Immunity (Performance
Criterion A) 5
IEC 61000-4-4
Electrical Fast Transient / Burst Immunity (Perf. Criterion C)
IEC 61000-4-5
Power Line Surge Immunity (Performance Criterion A)
IEC 61000-4-6
Conducted RF Immunity (Performance Criterion A)
IEC 61000-4-8
Power Frequency Magnetic Field Immunity (Perf. Criterion A)
IEC 61000-4-11 Voltage Dips, Short Interruptions and Voltage Variations
Immunity (Performance Criterion A / C 6)
IEC 61000-3-2
AC Power Line Harmonic Emissions
IEC 61000-3-3
Voltage Fluctuations and Flicker
FCC EMC
Emissions comply with the Class B Limits of FCC Code of Federal Regulations 47,
Compliance
Part 15, Subpart B 1,3.
EC Declaration
Compliance was demonstrated to the following specification as listed in the Official
of Conformity Journal of the European Communities:
Low Voltage
Low Voltage Directive 73/23/EEC, amended by 93/68/EEC
EN 61010-1:2001
Safety requirements for electrical
equipment for measurement, control and
laboratory use.
U.S. Nationally
Safety requirements for electrical
UL 61010-1 2nd ed.
Recognized
equipment for measurement, control, and
Testing
laboratory use.
Laboratory
ISA-82:02.01
Safety requirements for electrical
Listing
equipment for measurement, control, and
laboratory use.
Canadian
CAN/CSA C22.2 No. 61010-1-04
Safety requirements for electrical
Certification
equipment for measurement, control, and
laboratory use.
Additional
IEC 61010-1:2001
Safety requirements for electrical
Compliance
equipment for measurement, control, and
laboratory use.
Equipment Type
Test and measuring
Safety Class
Class I equipment (as defined in IEC 60950-1:2001)
1
Compliance demonstrated using high-quality shielded interface cables shorter than 3 meters.
3
Emissions, which exceed the levels required by these standards, may occur when this equipment is
connected to a test object.
5
MOD IN port capped at IEC 61000-4-3 test.
6
Performance Criterion C was reached at additional test levels according to EN 61326-1:2006 table 2
56
7.3 Technical data
7.3 Technical data
General Data
Detector Compatibility
Display Type
Viewing Area
Display Update Rate (max)
Display Format
Backlight Display and Keypad
Dimensions (H x W x D) Overall
Options
Weight
Operating Temperature
Storage Temperature
Photodiode Sensors S100C Series
Thermal Sensors S300C Series
Photodiodes (max. 5mA)
Thermopiles (max. 1V)
Graphical LCD 132 x 32 pixels +
Mechanical Analog Needle
48.2 x 13.2 mm + 90,0 x 42,0 mm
20 Hz
Numerical, Mechanical Analog Needle
LED
183 x 109 x 40 mm³
Kickstand; 1/4-20 Post thread
<0.5 kg
0°C - +40°C
-40°C - +70°C
Current Input (Photodiode Sensors)
Connector
Units
Measurement Ranges
Display Resolution
AD Converter
Accuracy
Bandwidth
Wavelength Correction
DB9F, left side
W
6 decades; 50 nA - 5 mA
Ranges selectable in W, sensor depending
1 pA / responsivity value (A/W)
16 bit
+/-0.2% f.s. (5µA - 5mA); +/-0.5% f.s. (50nA)
+/-3% f.s. Analog Meter
DC - 100kHz, depending on sensor and settings
nm (A/W)
Voltage Input (Thermopile Sensors)
Connector
Units
Measurement Ranges
DB9F, left side
W
4 decades; 1 mV - 1V
Ranges selectable in W, sensor dependent
Display Resolution
AD Converter
Accuracy
1 µV / responsivity value (V/W)
16 bit
+/-0.5% f.s. (10mV - 1V); +/-1% f.s. (1mV)
+/-3% f.s. Analog Meter
DC - 10Hz, depending on sensor and settings
1s – 30s
Sensor depending; nm, (V/W)
N/A
Bandwidth
Time Constant Correction Range
Wavelength Correction
Beam Diameter Setting
Analog Outputs
Connector
Signal
Voltage Range
Accuracy
Bandwidth
SMA, left side
amplified input signal – not corrected
0 ... 2V
+/-3%
up to 100kHz, depending on sensor and settings
Sensor Temperature Control
Supported temperature sensor
Temperature measurement range
Thermistor
-10°C ... +80°C ( displayed via interface only)
57
7.3 Technical data
Sound
Speaker 300Hz - 5kHz
Laser tuning support, console function support
Type
Function
Interface
USB2.0
Mini USB, left side
Type
Connector
Power Management
LiPo 3.7V 1300mAh
5V/1A
Battery
Charger / DC Input
Accessories
Hardcase
Instrument Drivers on USB Stick
Application Software on USB Stick
User Manual
Current Input Phtodiode Sensors
Current Range
5 mA
500 µA
Display
Measurement
Analog Output
Analog Output
Resolution
Accuracy
Gain
Bandwidth
1 µA
+/- 0.2% f.s.
4 x 10² V/A
100 nA
+/- 0.2% f.s.
100 kHz / 25 Hz
3
100 kHz / 25 Hz
4
4 x 10 V/A
50 µA
10 nA
+/- 0.2% f.s.
4 x 10 V/A
100 kHz / 25 Hz
5 µA
1 nA
+/- 0.2% f.s.
4 x 10⁵ V/A
100 kHz / 25 Hz
6
500 nA
100 pA
+/- 0.2% f.s.
4 x 10 V/A
10 kHz / 25 Hz
50 nA
10 pA
+/- 0.5% f.s.
4 x 10⁷ V/A
1 kHz / 25 Hz
Display
Measurement
Analog Output
Analog Output
Resolution
Accuracy
Gain
Bandwidth
Voltage Input Thermal Sensors
Voltage Range
0
10 Hz
10 Hz
1V
100 µV
+/- 0.5% f.s.
2 x 10
100 mV
10 µV
+/- 0.5% f.s.
2 x 101
+/- 0.5% f.s.
2 x 10
2
7 Hz
2 x 10
3
0.7 Hz
10 mV
1 mV
58
1 µV
0.1 µV
+/- 1.0% f.s.
7.4 Pin Assignment of the Sensor Connector
7.4 Pin Assignment of the Sensor Connector
The PM100A is capable to support custom made detectors. Please read carefully the
following instruction prior to connecting a self made sensor.
5-4-3-2-1
9-8-7-6
Figure 13
Pin assignment of the sensor connector jack (female)
pin connection
3
4
5
8
photodiode ground (anode), thermal sensor ground, analog ground
photodiode cathode
n.c.
thermal sensor +
7
1
6
9
PRESENT connect this pin via a 1kΩ – 10kΩ resistor to Pin 3 (AGND)
+5V
drive max. 50mA from this pin
DGND
n.c.
The following described pin is uniquely used for the memory in the sensor
head and may not be used. Connecting this pin may cause malfunction of
the PM100D.
2
EEPROM Digital I/O
59
7.5 Thorlabs ‘End of Life’ policy (WEEE)
7.5 Thorlabs ‘End of Life’ policy (WEEE)
As required by the WEEE (Waste Electrical and Electronic Equipment Directive) of
the European Community and the corresponding national laws, Thorlabs offers all
end users in the EC the possibility to return ‘end of life” units without incurring
disposal charges.
This offer is valid for Thorlabs electrical and electronic equipment
th
• sold after August 13 2005
• marked correspondingly with the crossed out ‘wheelie bin” logo (see Figure
14)
• sold to a company or institute within the EC
• currently owned by a company or institute within the EC
• still complete, not disassembled and not contaminated
As the WEEE directive applies to self contained operational electrical and electronic
products, this ‘end of life” take back service does not refer to other Thorlabs
products, such as
•
•
•
•
pure OEM products, that means assemblies to be built into a unit by the user
(e. g. OEM laser driver cards)
components
mechanics and optics
left over parts of units disassembled by the user (PCB’s, housings etc.).
If you wish to return a Thorlabs unit for waste recovery, please contact Thorlabs or
your nearest dealer for further information.
7.5.1 Waste treatment on your own responsibility
If you do not return an ‘end of life” unit to Thorlabs, you must hand it to a company
specialized in waste recovery. Do not dispose of the unit in a litter bin or at a public
waste disposal site.
60
7.5 Thorlabs ‘End of Life’ policy (WEEE)
7.5.2 Ecological background
It is well known that WEEE pollutes the environment by releasing toxic products
during decomposition. The aim of the European RoHS directive is to reduce the
content of toxic substances in electronic products in the future.
The intent of the WEEE directive is to enforce the recycling of WEEE. A controlled
recycling of end of live products will thereby avoid negative impacts on the
environment.
Figure 14
Crossed out ‘wheelie bin” symbol
61
7.6 List of figures
7.6 List of figures
Figure 1 Figure 2 Figure 3 Figure 4 Figure 5 Figure 6 Figure 7 Figure 8 Figure 9 Figure 10 Figure 11 Physical Overview Front Panel
Physical Overview Side Panel
Rear View
Physical Overview Bottom View
Display Setup
Wavelength Correction
Zeroing
Attenuation
Relative Measurement
Display Options
Photodiode Mode
10 10 11 11 12 16 16 17 18 18 20 Figure 12 Figure 13 Figure 14 Tune Sound
Pin assignment of the sensor connector jack (female)
Crossed out ‘wheelie bin” symbol
22 59 61 62
7.7 Addresses
7.7 Addresses
Our Company is represented by several distributors and sales offices throughout the
world.
Europe
Thorlabs GmbH
Hans-Boeckler-Str. 6
D-85221 Dachau
Germany
USA
Thorlabs, Inc.
435 Route 206 North
Newton, NJ 07860
USA
Sales and Support
Phone:
+49 (0) 8131 / 5956-0
Fax:
+49 (0) 8131 / 5956-99
Email:
[email protected]
Web:
www.thorlabs.com
Sales and Support
Phone:
1-973-579-7227
Fax:
1-973-300-3600
Email:
[email protected]
Email:
[email protected]
Web:
www.thorlabs.com
Japan
Thorlabs, Inc.
Higashi Ikebukuro Q Building 1st floor
2-23-2, Higashi Ikebukuro, Toshimaku
Tokyo 170-0013
Japan
Sales and Support
Phone:
+81-3-5979-8889
Fax:
+81-3-5979-7285
Email:
[email protected]
Web:
www.thorlabs.jp
Please call our hotlines, send an Email to ask for your nearest distributor or just visit
our homepage
http://www.thorlabs.com
63