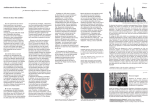
1
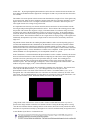
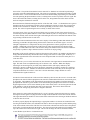
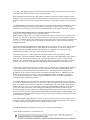
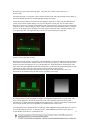
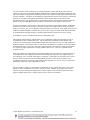
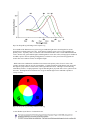
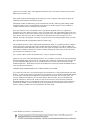
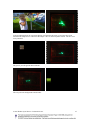
Heather Weaver- Video Signal Identification
General Introduction
In most cases, it is the signal that is recorded onto a videotape that is of greater value than the actual tape.
Although the electronic signal cannot be seen directly, an artist working in the medium of video nearly
always manipulates the electronic signal via camera during image collection and/or via external processing
device to produce the desired visual effect. All of the visual characteristics of a video image are carried
within the video signal and can be altered. A black and white signal can be adjusted to make a scene
appear brighter or darker. It is possible to manipulate the signal in such a way that black or white areas in
an image appear gray. Detail in shadow or highlight areas can be obliterated or enhanced depending upon
the artist’s goal. Additionally, a color video signal can be manipulated to create a more or less colorful
image. Individual colors in a scene can be enhanced or subdued or completely transformed into different
colors.
In the field of video preservation, it has been an accepted (although debated) strategy to migrate a
potentially endangered video signal from its original tape onto a more modern format to ensure the survival
of that signal in perpetuity. When an analog video signal is transferred from one medium to another the
signal is routed through a device called a time base corrector. A time base corrector is a component of
professional video equipment that stabilizes the video signal so that it can be successfully recorded onto
another medium. Time base correctors require the user to adjust the video signal as it passes through,
potentially resulting in a brighter or darker or more or less colorful viewing experience.
While passing through the time base corrector during migration the signal should be adjusted to result in an
image as the maker intended. Human visual perception is highly subjective, and in assessing video,
perception of the image is further influenced by the type of display unit being used and ambient light within
the viewing space. The human eye should not be relied upon as the sole guide in making adjustments to the
video signal.
Specially designed monitoring equipment called waveform monitors and vectorscopes provide a precise
way to monitor the signal while adjustments are being made where the result of even minor adjustments,
often too subtle to be readily detected by the human eye, can be quantified and clearly seen.
Occasionally during migration the video signal may require additional adjustment to fit within the
specifications of the new medium to avoid potential image distortion or clipping. Clipping the video signal
results in a loss of detail in the image, particularly in highlight or shadow areas or in areas of extreme color
saturation. When viewing a series of constantly changing images moving along at the rate of nearly 30
frames per second on a display it is often difficult if not impossible to detect and rectify clipping. When
monitoring the signal using a waveform monitor and vectorscope portions of the signal that are being
clipped are more readily apparent and can be precisely adjusted to avoid loss. In preserving the video
signal through migration it is imperative that the preservation technician has a solid understanding of the
video signal and how to monitor the signal using waveform monitors and vectorscopes.
A basic understanding of video signals and of the theory of operation of devices used to playback, record
and monitor the video signal is a key factor in developing the confidence and ability to identify and assess
potential problems that may be encountered within a collection of tapes. This understanding, coupled with
experience, leads to the ability to distinguish between and potentially isolate the root cause of problems
such as recorded in defects, physical damage, faulty playback or monitoring equipment, etc., potentially
saving valuable time and limited resources in the management of a collection.
While there are a multitude of videotape formats and a wide variety of video signals that have been used
since videotape was invented, newer systems merely expanded upon or enhanced the old. Following both
the development of the black and white and color composite analog video signal facilitated by an
understanding of how that signal relates to human vision will lead to an understanding of video that can be
built upon as technology progresses.
© 2007 Heather Lyon Weaver. Used under license.
1
Exploiting the limitations of the human visual system, video was invented as a means to collect and present
information to a viewer in the form of light. A video signal is an electronic representation of light that
changes over time that may be transduced back into light over time to create the illusion of moving images.
Transduction is the process of changing one form of energy into another. Transduction is a necessary step
in the process because light particles themselves cannot be captured and presented in another place or
time.
Humans are able to see as a result of light rays radiating from a source, such as the sun, bouncing off
objects into our eyes. The lens of each eye gathers the reflected light rays by angling them inward so that
they converge to a point. The light rays then continue on until they are focused onto the retina. The retina
is packed with over one hundred million receptors, called photoreceptors that are sensitive to the brightness
and/or color of the light rays hitting them. Through a photochemical transformation, the photoreceptors
transduce the energy of the light rays into an electronic signal that flows through the optic nerve to the
brain for interpretation.
Because the light rays must be bent to converge to a point by the lens of the eye, the image that is focused
on the retina is actually upside down. It is fortunate that the brain is able to interpret the images that the
retinas relay. Otherwise everything in the world would appear to be upside down.
FROM LIGHT TO ELECTRONS: THE MAKING OF a VIDEO SIGNAL
Like the lens of the human eye the lens of the camera collects light being reflected into it by converging the
rays. In black and white video cameras the light rays continue on to be focused onto a photoelectric surface
inside the camera, creating a much smaller two-dimensional upside down version of the scene. An object
or substance that is photoelectric produces an electronic reaction when exposed to light.
In cameras manufactured through the 1980’s the photoelectric surface employed in video cameras
constituted one end of a cathode ray tube. A cathode ray tube is a cylindrical glass tube that is coated with
a photoelectric substance on one end and contains a cathode at the opposite end. A cathode is a piece of
metal that when heated excretes streams of electrons, called cathode rays, that are directed toward the
photoelectric surface at the opposite end of the tube. The electron streams are referred to as cathode rays
because cathode ray tubes were invented before electrons were clearly identified and named. The
nomenclature has persisted over time.
While different types of tubes were used in different types of cameras, one of the most prevalent types of
tubes used in portable video cameras was the vidicon tube. The photoelectric element employed in vidicon
camera tubes was a photoconductive material. An element that is photoconductive varies in resistance to
the flow of electrons relative to the intensity of light striking it at any given point. In the presence of very
bright light, a photoconductive element offers less resistance to electrons flowing through it so more
electrons are able to pass through in a given amount of time. Conversely in the presence of dim light the
element is more resistant to an electron flow, allowing fewer electrons to pass through it in a given amount
of time.
Inside the vidicon tube the cathode is referred to as an electron gun. The electron gun produces a single,
concentrated stream of electrons that hits the photoconductive surface at the opposite end of the tube. The
height and width of the electron stream is quite small and comes into contact with only a small portion of
the photoconductive surface at any point in time. The beam of electrons is constantly moving, being
guided over time in a pre-determined pattern so that it comes into contact with the entire photoconductive
surface.
The process of directing the electron beam over the photoconductive surface is called scanning. In areas
where the photoconductive surface is brightest, the electron stream emanating from the electron gun is able
to pass through freely. The flow of electrons remains plentiful and strong. In areas where the surface is
dimmer, the electrons meet more resistance therefore fewer electrons are able to pass through creating a
© 2007 Heather Lyon Weaver. Used under license.
2
weaker flow. In passing through the photoconductive surface the once constant electron stream has now
been changed or modulated in direct proportion to the light levels that were present at the time the surface
was scanned.
The number of electrons present in the electron stream determines the strength or force of the signal at any
given point in time. More electrons constitute a stronger signal while fewer electrons constitute a weaker
signal. Because electronic force or strength is measured in volts it is common to describe aspects of a
video signal in terms of its voltage at any point in time.
It is important to note that only one electron stream has been created as the electrons emanate from the
electron gun and pass through the photoconductive surface. The invention of the scanning process made
this possible. The electron flow begins as a single, concentrated beam of a consistent voltage level that
encounters each point of the photoconductive surface in succession over time. At the photoconductive
surface the beam is met with resistance proportional to the amount of light hitting it coming through the
lens of the camera. The beam then continues on as a single stream of varying voltage. Video signals were
intentionally developed this way because a single stream of electrons can be conveniently carried on a
single wire.
The path the electron beam takes in scanning the photoconductive surface was developed by groups of
scientists and standardized in the United States by the National Television Systems Committee and the
Federal Communications Commission to maintain a reasonable amount of picture quality, to overcome
technical issues that arose in the transmission and reception of video signals over the air and to ensure that
video equipment made by various manufacturers would be cross-compatible. In other parts of the world
similar standards were developed but they are not compatible with the U.S. system.
In the United States, it was determined that the photoconductive surface would be scanned by the electron
beam in 525 horizontal lines to collect the information comprising one video frame. In the original black
and white television system this process was repeated 30 times per second. The scanning process
essentially breaks the image focused on the photoconductive surface of the camera tube into picture
elements or pixels. The vertical height of each pixel is 1/525th of the height of the scanned surface. The
width of each pixel is roughly 1/700th of the width of the scanned surface.
The electron beam does not scan the lines sequentially to transduce one video frame. The electron beam
scans only the odd numbered lines (1, 3, 5, 7, etc. through line 525) in its first pass over the
photoconductive surface. The beam is then redirected to scan the even numbered lines (2, 4, 6, 8, etc.
through line 524). The odd numbered lines in a video frame are referred to collectively as field 1 of the
video frame. The even numbered lines in a video frame are referred to as field 2 of the video frame. One
frame of video contains 2 fields. Each field contains 262.5 lines of the video frame.
[ image f12rb is still of all 525 lines. Field 1 is blue. Field 2 is red the half lines aren’t very clear. A
portion of the image could be zoomed in on to illustrate interlace if using the full image doesn’t work][
After the electron beam finishes scanning each line of the surface, the beam is briefly turned off to allow
the beam to be repositioned vertically by the height of two scan lines and horizontally to begin the scan of
© 2007 Heather Lyon Weaver. Used under license.
3
the next line. The period of time that the beam is turned off or “blanked” for horizontal repositioning is
referred to as the horizontal blanking period. The action of repositioning of the beam horizontally is called
horizontal retrace. The electron beam must be turned off or blanked during repositioning to avoid random
electrons spattering the photoconductive surface, resulting in the creation of spurious electronic signal. The
beam is directed in this manner, scanning one line to the next, being blanked out at the end of each line
until one complete field has been scanned.
When the beam has finished scanning the last line of the first field – field 1 - it is blanked out once again so
that the beam may be repositioned vertically to begin scanning the first line of field 2. The period of time
that the beam is turned off or “blanked” for vertical repositioning is referred to as the vertical blanking
period. The action of repositioning the beam vertically is called vertical retrace.
Just as the lenses of our eyes focus an inverted image onto our retinas, the lens of the camera focuses an
inverted image onto the photoconductive surface of the cathode ray tube. To rectify this, the electron gun in
the camera actually scans each line from right to left and begins the scan for each field at the bottom of the
target starting with the last line of each field.
Most video cameras manufactured since the 1990’s employ CCD technology rather than cathode ray tube
technology to transduce the light entering the lens of the camera into an electronic signal. A CCD or
Charged Coupled Device is composed of an array of tiny photoelectric sensors grouped in rows and
columns. When light is focused onto the CCD an electric charge proportional to the amount of light
hitting it is created within each sensor. The electronic charges are transferred from each sensor within the
chip serially to produce a single continuous stream of electrons of varying voltage.
Regardless of the specific technology employed, the purpose of the camera is to transduce the light energy
being collected and focused by the lens into electric energy in the form of a video signal. In this way a
reasonable approximation of the collected scene can be transported and viewed in some other place or at
some other time.
In order for our eyes to view the collected scene, the electronic video signal must be transduced back into
light. This task can be accomplished using a device known as the monitor. While other display
technologies are becoming more prevalent, many modern monitors still employ cathode ray tube
technology. Because a cathode ray tube is the primary component of a monitor, monitors are sometimes
referred to simply as CRTs. Monitors or CRTs differ from televisions in that they do not incorporate the
components that allow televisions to “tune into” television broadcasts, change channels or extract
transmitted video signals from the air.
In both televisions and CRTs the visible end of the cathode ray tube becomes the screen. It is coated with a
phosphorescent material. When a phosphorescent material is bombarded with electrons, the material glows,
or emits light. The brightness of the light emitted is proportional to the number of electrons hitting the
phosphorescent material. A greater number of electrons striking the phosphorescent surface will result in
brighter light emission. Just as in the cathode ray tube in the camera, there is an electron gun at the far end
of the cathode ray tube in the monitor that emits an electron beam. The beam is directed onto the
phosphorescent coating using electrostatic or magnetic deflection.
If the output of a camera collecting light from a live scene is properly connected to the input of a monitor,
the single electronic signal of varying electronic strength created within the camera flows into the monitor.
This signal determines the number of electrons that will be emitted from the electron gun inside the monitor
in discreet intervals of time.
In order to properly display the captured image, as appropriate numbers of electrons are emitted from the
electron gun inside the monitor, the resultant beam must be directed to replicate the position and the pacing
of the electron beam in the camera. The first line of each frame collected in the camera must correspond to
the first line of each frame drawn on the monitor. The electron beam in the monitor begins scanning at the
top of the monitor and scans from left to right. This orients the image the camera collected so that the
© 2007 Heather Lyon Weaver. Used under license.
4
image is displayed right side up. Also, the electronic information comprising one particular line of video
must be drawn on the correct corresponding line on the television monitor from start to finish. If the
electron beam in the television monitor is not synchronized with the electron beam in the camera the image
will appear disjointed or scrambled, possibly beyond recognition. Understanding synchronization will help
the preservationist interpret and potentially correct video playback problems associated with this aspect of
video recording and playback.
Synchronizing information must be added to the video signal as the signal is created. The synchronizing
information conveys to the monitor at what point to redirect the beam horizontally to begin drawing each
line and at what point to redirect the beam to the top of the monitor to begin drawing each field. The
horizontal and vertical blanking intervals in the video signal provide a convenient and logical place to
insert the synchronizing information.
When the electron gun in the camera is blanked for repositioning, this void of electrons is filled with the
blanking signal. The blanking signal is part of the electronic stream created inside the camera that is at a
voltage level that will force an electron gun in the monitor to blank so that it can be repositioned, avoiding
random electrons spattering the photo-emissive monitor surface, resulting in the creation of spurious light.
Synchronizing information is also generated inside the camera by a pulse generator and is inserted into the
video signal during the blanking intervals in the form of specific electronic pulses. In order for the
television monitor to differentiate the electronic synchronizing pulses from the part of the electronic video
signal carrying brightness information the pulses have to be very precise and very distinct. The
synchronizing pulses must not interfere with the portion of the video signal that describes brightness
values, and vice versa, the portion of the video signal that describes brightness values must not interfere
with synchronizing pulses and yet both sets of electronic information must be carried on the same wire
within the same signal.
As specified by the National Television Systems Committee, both the portions of the video signal carrying
brightness information and the portions of the video signal carrying synchronizing signals must not exceed
1 volt combined at any point in time. When brightness information and synchronizing signals are
combined into one signal the brightness information remains within a specific range of relative voltage
levels that do not interfere or overlap with the voltage levels reserved for synchronizing signals. Good
synchronizing pulses, being very precise and very distinct, are always the same strength thus always have
the same voltage level. For example, horizontal synchronizing pulses should always be 286 millivolts
(abbreviated mV) in strength. The portion of the video signal carrying brightness information is permitted
to utilize up to 714 mV. A video signal whose brightness level hits 714 mV would be totally white in those
areas at the maximum allowable brightness level. 714mV + 286 mV = 1,000 mV or 1 volt.
When an electronic video signal is created by a camera and displayed on a monitor, it is not visible. We
see only the result of the signal is displayed in light form. A test and measurement device used in the field
of electronics called an oscilloscope can be used to view a representation of an electronic signal. The
oscilloscopes used to display video signals are called waveform monitors. Understanding the functions and
use of a waveform monitor will enable the preservationist to read signal characteristics from tapes and to
interpret what is being seen on the monitor during playback and recording of preservation masters.
Waveform monitors are also essential when using test signals in the calibration and maintenance of video
systems.
The waveform of a video signal can be thought of as a pictorial representation of its varying voltages over
time. A waveform monitor displays the video signal plotting the strength of the signal on the vertical scale
and time on the horizontal scale. Waveform monitors are capable of displaying the video signal in different
ways to facilitate various common measurements. It is important to remember that a waveform monitor
can only be used to observe the video signal. It does not alter the video signal. To understand how to use a
waveform monitor, it is necessary to be familiar with certain terminology and measurements of signal
characteristics.
© 2007 Heather Lyon Weaver. Used under license.
5
Amplitude is a way to describe the maximum strength of a given signal. On a practical level, we increase
or decrease the amplitude of a signal as we are recording when we adjust the amount of light that enters a
video camera through the aperture of the lens.
The number of electrons present at any given point in the video signal determines the strength of the signal.
A signal representing a brighter image will have greater amplitude than a signal representing a dimmer
image. The strength of the video signal is often referred to as the amplitude of the signal at any given point
in time.
The faceplate of the standard composite waveform monitor is designed to facilitate measurements of signal
amplitude plotted against time and to easily compare the relationship between synchronizing pulses and the
portion of the signal that carries picture information. The faceplate of a waveform monitor is called a
graticule. Most NTSC waveform monitors will provide a horizontal and vertical scale etched into the
graticule. The vertical scale, measuring signal amplitude, utilizes a relative unit of measure, the IRE scale,
which was named after its developer, the Institute of Radio Engineers. (The IRE scale has become so
widely used in the U.S. video industry that many people commonly refer to IRE as if it were an absolute
unit of measure when discussing composite analog video signals.)
The IRE scale is both a positive and negative going scale ranging from -40 IRE to 120 IRE. One IRE is
equal to 1/140th of a volt or 7.14mV. While the IRE scale is both a positive and negative going scale, the
voltage values of a video signal are only negative relative to 0 IRE. The actual absolute voltages are not
negative.
Often, the vertical IRE scale on the left side of the waveform monitor graticule will not label the 120 IRE
mark and there is little or no headroom at the top of the scale to make IRE measurements in excess of 120
IRE without adjusting the vertical position of the waveform on the graticule. Because the standard in the
United States sets the composite video signal at a maximum value of 1 volt (140 IRE) most properly
functioning video recording or playback equipment will not create or record a signal too far out of range
(actual tolerances vary from machine to machine) so there is little point in advancing the scale further.
A technician will use the IRE scale to ensure that the video signal is within voltage level specifications
during the remastering process. If a signal is out of range and it is determined that all equipment is
calibrated and functioning properly, the amplitude of the signal must be adjusted so that detail in the
highlight and shadow areas of the image are not lost.
On the horizontal scale of the waveform monitor, time can be stretched or compressed to make various
measurements. Video signals must move quickly to culminate in creating the illusion of moving images.
We know that 525 lines comprise one frame of video and that 30 frames of video (in the black and white
system) must be displayed every second. 15,750 lines will be drawn on a television monitor every second.
One complete line of video only takes about 63.5 millionths of a second to be drawn or collected. Given the
great speeds at which the video signal must move, time is generally measured in microseconds – or
millionths of a second when evaluating the signal.
Depending on the make and model of the waveform monitor, the way a signal is displayed can be selected
by the user using labeled buttons, switches or a series of menus and submenus. The etched graticule does
not change but the values of the divisions represented will change based upon the view selected.
Many waveform monitors in use today still employ cathode ray tube technology.
The user determines the path and pacing of the electron gun that draws the waveform using the buttons,
switches or menus. Newer waveform monitors are primarily software based, running on specially designed
dedicated hardware. Whether CRT or software based, these devices still employ the same terminology that
references CRT scanning processes.
To view a video signal a cable must be used to connect the video output of the camera or video player to an
input on the back of the waveform monitor. Every device and cable the signal travels through can affect
the signal so it is important that the cable used is intended for video applications, having a connector rated
© 2007 Heather Lyon Weaver. Used under license.
6
at 75 ohms. The signal going into the waveform monitor must continue on to another device or it must be
terminated at the waveform monitor using a 75 ohm terminator.
Before making measurements of the video signal it is prudent to check the waveform monitor for proper
calibration. The user manual will have instructions on how to ensure that the waveform monitor is properly
calibrated. Calibration systems are usually built into the device so calibration techniques vary from unit to
unit.
An understanding of how to display a video signal on a waveform monitor and how that display is altered
based upon the settings selected can also be gained by reading the waveform monitor’s user manual.
Therefore only several settings critical to the overall understanding of the signal will be briefly explained.
WAVEFORM MONITOR SETTINGS AND EXPLANATION OF SETTINGS
[image of cu of controls using a crt style wfm with buttons]
Most waveform monitors have several inputs so that multiple cameras or devices can be connected to it at
one time. It is necessary to instruct the waveform monitor to look at the correct input using the controls
available. Usually the inputs at the connection jacks on the back of the waveform monitor are labeled A, B,
C, etc. or 1, 2, 3, etc. The input selector will likely be a button on the face of the waveform monitor or
embedded in a menu.
The FOCUS, SCALE and INTENSITY controls should be set for optimal viewing. These controls simply
adjust the focus and the brightness of the signal display and of the graticule. For our first examples of
monitoring the video signal the FILTER control should be set to LPASS. This filters out the color
information carried in the video signal. REF should be set to internal.
The primary ways to view a video signal on the waveform monitor can be selected using various
combinations of the MAG, SWEEP and FIELD settings. MAG refers to the magnification of the signal in
terms of its time dimension and influences the value of the horizontal scale of the waveform monitor.
Often the value of the horizontal scale will be displayed in the upper right hand corner of the waveform
monitor. The value of the magnification level depends upon the combination of settings being used.
As noted above waveform monitors were originally a type of cathode ray tube. Imagine that the output of a
camera is hooked up directly to the input of a waveform monitor. The video signal flowing out of the
camera flows into the electron gun in the waveform monitor. The electron beam sweeps across the
phosphorescent face of the waveform monitor in the manner directed by the user. SWEEP refers to the
motion of the electron gun as it sweeps across the phosphorescent surface. Regardless of the type of
waveform monitor being used to evaluate a signal, the SWEEP control is used to direct the manner in
which the signal is painted on the graticule.
The 2LINE SWEEP (sometimes denoted as 2H) setting instructs the electron beam to sweep across the
face of the waveform monitor once for every two lines of video. Remember that horizontal synchronizing
pulses are found between each line of video and are considered part of the video signal even though they
cannot normally be seen on a television monitor. Selecting 2 LINE SWEEP will display a line of active
video (active video is the portion of the video signal containing picture information) followed by the
horizontal blanking interval complete with synchronizing pulse followed by the next line of video. It is the
most useful sweep rate for viewing horizontal blanking and synchronizing pulses. In 2LINE SWEEP with
no magnification selected the horizontal time scale will be set at 10 microseconds per major division on the
waveform monitor graticule.
The 1LINE SWEEP setting instructs the beam to sweep across the face of the waveform monitor once for
every line of video. In 1LINE SWEEP with no magnification selected the horizontal time scale will be set
at 5 microseconds per major division on the waveform monitor graticule.
The 2FIELD SWEEP setting displays all of the lines in each video field sequentially.
© 2007 Heather Lyon Weaver. Used under license.
7
The FIELD button controls which field of video is displayed first on the waveform monitor when using
2LINE SWEEP or 2FIELD SWEEP.
FINALLY! A REAL SIGNAL
Provided the waveform monitor is calibrated, positioned properly and is set up to display a 2LINE SWEEP
at 10 microseconds per division this is what you should see:
[
The part of the video signal describing brightness levels should have positive IRE values ranging from 7.5
IRE through 100 IRE. 7.5 IRE is the standard setting for the darkest allowable portion of active video in
the video signal. 100 IRE is the standard for the maximum allowable amplitude of the video signal. In the
above example, the brightest areas of the image only extend to 91 IRE. While the active portions of the
video signal may extend from 7.5 IRE to 100 IRE, the signal is not required to encompass the entire
available voltage range.
© 2007 Heather Lyon Weaver. Used under license.
8
By isolating areas of the image it is easier to see how the display on the monitor corresponds to the
waveform and how voltage levels of the video signal fluctuate over time. In this example the dim bottom
left edge of the image is isolated to reveal only a small portion of a wall in the dimly lit room, white bed
linens, a dark blanket and a bare shoulder. The portion of the video signal holding the area of the white bed
linens has a maximum amplitude of nearly 40 IRE. The area of the signal containing the dark blanket area
has a maximum amplitude of 30 IRE while the exposed bare shoulder reaches to approximately 59 IRE. In
the following example the brightest portion of the image, the subject’s face, is isolated. This portion of the
video signal has a maximum amplitude of approximately 91 IRE.
Returning to a full view of the image on the waveform monitor, the horizontal synchronizing pulses should
be visible, positioned mid-screen and have negative IRE values ranging from 0 IRE down to -40 IRE.
Using the waveform monitor it is possible to see how the horizontal synchronizing pulses are distinctly
different from the portion of the video signal carrying the active picture information. The waveform of the
horizontal synchronizing pulse is square, indicating an abrupt change in the voltage level of the signal.
Blanking, the portion of the video signal that causes the electron gun to blank out or to discontinue emitting
electrons in a television monitor should be aligned at 0 IRE on the graticule.
Because clear synchronizing pulses are an absolute necessity in recreating an image, in the United States it
was decided that 7.5 IRE of space would be left between the blanking level and the darkest portions of the
signal that describe the image to ensure that picture information is not mistaken for synchronizing pulses by
playback, monitoring or recording equipment.
© 2007 Heather Lyon Weaver. Used under license.
9
By using the MAG button, it is possible to zoom in on the video signal for closer inspection of the
horizontal blanking interval. MAG combined with 2LINE SWEEP results in the horizontal time scale
being set to 1 microsecond per major division on the waveform monitor graticule. (After the MAG button
is selected it may be necessary to use the POSITION controls to center the signal on the graticule.) Every
segment within the horizontal blanking interval has a specific name and function and must last for a
specific amount of time. The timing of each portion of the video signal is standardized and enforced by the
Federal Communications Commission.
The first area within the horizontal blanking interval is called the Front Porch. The Front Porch begins
immediately after the portion of the signal carrying the brightness information of one line has passed. The
signal of the front porch forces the electron gun to blank. This happens when the electron beam in the
television monitor is very near to the right hand edge of the television screen. The Front Porch area will
simply appear to be black, or absent of light, on the television monitor. By pushing the underscan button
on a professional grade monitor it is possible to see that there are portions of the television monitor that are
not illuminated surrounding the image. The front porch only lasts for about 1.3 microseconds.
The horizontal synchronizing pulse is the part of the signal that forces the electron beam to be repositioned
from the right edge of the screen back to the left edge of the screen inside the television monitor. The pulse
should last for about 5 microseconds. The amplitude or strength of the pulse should be 40 IRE.
The Back Porch immediately follows the horizontal synchronizing pulse. Since the Back Porch occurs
after the horizontal synchronizing pulse the back porch is responsible for the black area at the left edge of
the screen on the television monitor. The Back Porch is further divided by the inclusion of color burst in
the composite color video signal. This will be discussed later. The Back Porch lasts for about 4.5
microseconds.
Zooming back out by hitting the MAG button the waveform monitor should be set to display a 2LINE
SWEEP at 10 microseconds per division. In this view it is possible to measure the video signal from
© 2007 Heather Lyon Weaver. Used under license.
10
horizontal sync pulse to horizontal sync pulse. The entire line of video is drawn in about 63.5
microseconds.
The following image is a composite of three separate transfers of the same tape showing how the timing of
horizontal blanking can alter the left and right edge framing of an image.
Unless the waveform monitor is instructed to only display a single line of video using the LINE SELECT
control, the waveform monitor displays every line of video that it is being fed. The waveform monitor
displays 15,750 lines of video per second, drawing each of the 525 lines of video per frame onto the display
in rapid succession. When looking at a frame of video comprised of many identical lines this is not always
obvious. In the sample below, the image of the white square occupies the space of XXXX scanlines and
yet it appears that this video signal has only created a waveform consisting of a single line.
[dsc26 in wfm, whiteSquare in mon]
When the waveform monitor is set to display a 2LINE SWEEP at 10 microseconds per division the electron
beam in the waveform monitor will draw each line of video on top of the next. The beam in the waveform
monitor will create what appears to be a very bright single line. Each identical line comprising the video
frame carries the same amplitude and the same timing relative to the horizontal synchronizing pulse so each
identical line is drawn in the exact same position on the waveform monitor graticule.
The vertical placement of an object does not affect the display of the waveform in this view. [ vert
placement can be illustrated using the white square if an image is necessary]
Reviewing a frame of video comprised of a simple vertical gradient illustrates that every line of the video
frame is being displayed. The portion of each line of the video signal that carries the active picture
information is of slightly different amplitude than the adjacent lines. Each line of the frame is displayed on
the waveform monitor at levels corresponding to its amplitude on the vertical scale.
It is important to make a distinction between choosing 1LINE SWEEP and using LINE SELECT to elect to
view an individual line of video. As stated previously, 1LINE SWEEP instructs the electron beam to
© 2007 Heather Lyon Weaver. Used under license.
11
sweep across the face of the waveform monitor once for every line of video. In 1LINE SWEEP with no
magnification the horizontal time scale on the waveform monitor changes to 5 microseconds per major
division.
LINE SELECT is used to monitor a single line of video. Using the controls provided the user may choose
which of the 525 lines of video to monitor. The chosen line number usually appears in a corner of the
waveform monitor graticule. In 2LINE SWEEP the chosen line will appear first (on the left side) on the
graticule. For example if line 25 is selected using LINE SELECT the waveform monitor will display line
25, the horizontal blanking interval between lines 25 and 26 followed by line 26. Some waveform monitors
display line numbers in relation to field and some display line numbers sequentially. Read the manual of
the particular waveform monitor being used for more detail. The line select function is useful for
determining the number of active lines in a video frame and for isolating areas of a frame for measurement.
The vertical blanking interval contains a series of pulses that prompt the electron gun in the television
monitor to suppress the flow of electrons and to reposition the electron beam from the bottom of the raster
back to the top. The vertical blanking interval occurs every 1/60th of a second, at the beginning of each
field of video.
The vertical blanking interval can be viewed on the waveform monitor in 2FIELD SWEEP using 25 times
magnification. This view of the video signal is quite a bit different than the view used to examine the
horizontal blanking interval. The 2FIELD SWEEP setting with no magnification displays all of the lines in
each video field in field order. The electron beam sweeps over the surface of the waveform monitor only
once for every 2 fields of video. In this view the 525 individual lines in a frame of video are displayed
sequentially side by side in field order.
The horizontal time scale has been significantly compressed in comparison to the time scale value when the
waveform monitor is in 2LINE SWEEP with no magnification. In 2LINE SWEEP with no magnification
each major division on the horizontal scale denotes 10 microseconds. In 2FIELD SWEEP with 25 times
magnification employed each major division on the horizontal scale denotes the passage of about XX
microseconds.
In 2FIELD SWEEP at 25 times magnification the horizontal positioning control must be used to scroll
through the lines of the video signal. All 525 lines do not fit on the graticule at one time in this view. The
positioning control can be used to scroll to the head of the signal. The head of the signal can either be the
lines of the video signal from field 1 or from field 2 as determined by the FIELD control. If the FIELD
control is set to FIELD1 then the vertical blanking interval for field 1 will be displayed followed by the
active lines of the video signal from field 1. Then the Vertical Blanking interval for field 2 will be
displayed followed by the lines of active video comprising field 2.
It is most convenient to examine the entire Vertical Blanking Interval when surrounded by active lines of
video. To examine the Vertical Blanking Interval for field 1 of the video signal set the FIELD control on
the waveform monitor to field 2 and scroll the signal past the active lines of video comprising field 2 until
the Vertical Blanking Interval for field 1 is in view.
© 2007 Heather Lyon Weaver. Used under license.
12
As stated previously, the Vertical Blanking Interval carries a series of pulses rather than 1 distinct pulse to
initiate vertical retrace in a television monitor. In the early days of television it was found that a group of
pulses was needed for the successful reconstruction of the image. Without the extra pulses, called
equalizing pulses, the beam in the television monitor had difficulty properly interlacing the 2 video fields to
create 1 frame of video. Part of the Vertical Blanking Interval contains 6 pre-equalizing pulses followed by
six vertical synchronizing pulses followed by 6 post-equalizing pulses. The vertical synchronizing pulses
are responsible for initiating vertical retrace.
Approximately the first 21 lines in each video field are reserved for the Vertical Blanking Interval. The
equalizing pulses and the vertical synchronizing pulses take the space of the first 9 lines in each field. The
pre-equalizing pulses occupy lines 1 through 3. The vertical synchronizing pulses occupy lines 4-6 and the
post equalizing pulses occupy lines 7 through 9. The vertical synchronizing pulses are about one half line
of video in duration so two pulses fit within the space of one line. This leaves about 10 lines of space in the
Vertical Blanking Interval that can be used to insert data such as Vertical Interval time code, closed
captioning, or a line of video test signal.
Each frame of video contains 525 scan lines. Each field of video contains 262.5 scan lines. When the first
active line of field 1 (line 21) is scanned onto the face of a television monitor the scan begins on the far left
edge of line 21. The last line of field 1 drawn on the television monitor only contains a half line of active
video. The first active line of field 2 is drawn onto the television monitor on line 20 starting in the center of
the line. The last line of field 2 is a full line of video filling line 525 on the television monitor. In 2FIELD
SWEEP at 25 times magnification on the waveform monitor it is possible to examine the differences
between field 1 and field 2 of the video frame.
The duration of the vertical blanking interval affects the vertical positioning and framing of the image on
the monitor. The following is a split screen image of a single original tape that was remastered on two
separate occasions resulting in differences in the vertical blanking interval.
Both the vertical blanking interval and horizontal blanking can be affected during the remastering process.
It is common to route a video signal through a time base corrector to stabilize the image prior to transfer by
replacing weak or degraded synchronizing signals with stable and strong synchronizing signals. But during
this step a signal can potentially be altered. The ability to quantify and compare critical aspects of a video
signal against the predetermined standards gives the technician the tools to evaluate the signal under
migration and the ability to identify potential issues that may adversely affect or alter the image.
THE INTRODUCTION OF COLOR INTO THE VIDEO SIGNAL
THE ONSET OF COLOR
© 2007 Heather Lyon Weaver. Used under license.
13
As early as the late 1930’s scientists were inventing methods to produce and display color television
signals. It wasn’t until 1953 that the Federal Communications Commission permanently authorized color
television broadcast, settling on the standards put forth by the second convening of the National Television
Systems Committee. The choice of the technology employed in the color television system was limited by
the desire to not render existing black and white televisions obsolete and to incorporate the color
information into the video signal in such a way that did not interfere with the black and white signal and
did not increase the bandwidth (the space) needed for transmission of the signal over the airwaves.
Usually created inside a video camera, a video signal is an electronic representation of light. In the black
and white system the camera need only convert the varying levels of light it collects into a proportional
number of electrons. The color of the light entering the camera is not relevant. In the NTSC color system a
method is needed to transduce an infinite array of colors into a single electronic stream that can ultimately
be transduced back into light creating a reasonable approximation of a full color scene for viewing.
A mechanism or process is needed in the camera to differentiate color.
The method a camera employs to differentiate color is remarkably similar to the physiological way in
which humans are able to differentiate color. This is particularly remarkable because the first color
cameras were developed before the mechanisms of the human perception of color were fully understood.
Human perception of color begins in the eye. The retina of the human eye is made up of over one hundred
million photoreceptors. There are 2 main types of photoreceptors: rods and cones. Rods are responsible
for vision in low light situations but are largely unable to detect color. Cones are responsible for the
reception of color.
Each cone contains one of three different pigments that make each cone sensitive to a particular range of
wavelengths in the electromagnetic spectrum. The electromagnetic spectrum is the complete range of
electromagnetic waves of which visible light is a small part. Visible light waves oscillate (move up and
down or vibrate) rapidly, between 300 and 800 trillion times per second. The more rapidly a wave
oscillates, the shorter its wavelength. Wavelength is measured from wave crest to wave crest and can be
quantified in nanometers (nm) or billionths of a meter.
The wavelength of a light wave entering the eye determines its color. Of the three types of cones in the
human eye, short-wavelength cones are most sensitive to blues. Medium-wavelength cones are most
sensitive to greens and long-wavelength cones are most sensitive to reds. Because human sensitivity to
light wavelengths peaks in only 3 ranges, human vision is said to be trichromatic.
© 2007 Heather Lyon Weaver. Used under license.
14
http://www.britannica.com/eb/art-53282/Structure-of-the-retina
[detail drawing of retina with cones labeled SML and rods, R. ]
The perceived color of an object is determined by the wavelengths of light that an object reflects. Light
waves radiating from the sun contain all wavelengths of visible light. Sunlight is often referred to as white
light. When white light hits an object that reflects all wavelengths of light equally, all wavelengths of light
are reflected into the eye from the object. The three different types of cones in the retina that lay where the
object is focused respond equally by sending electro-chemical impulses to the brain via the nervous system.
The brain concatenates the information and perceives the object as being white. Conversely when white
light hits an object that absorbs all wavelengths of light no light is reflected into the eye and focused on the
retina. The three different types of cones in the retina do not respond and the brain perceives the object as
being black. When an object absorbs all wavelengths of light except for wavelengths of light in the range
of 440 nanometers, humans perceive that object as being blue. The cones most sensitive to blues that lay
where the object is focused on the retina react more strongly than the other cones.
The sensitivity of two or more cones will overlap depending on the wavelength of light entering the eye.
For example, a yellow object reflects wavelengths of light around 570 nanometers. The sensitivity of the
red cones peak at 564 nanometers but their sensitivity to wavelengths of light at 570 nanometers is only
slightly diminished. The sensitivity of the green cones peak at 534 nanometers but their sensitivity to
wavelengths of light at 570 nanometers is also only slightly diminished. The red and green cones react
equally to the yellow light wavelengths while the cones most sensitive to blues do not react at all. The red
sensitive cones and the green sensitive cones send impulses to the brain to produce the perception of
yellow. In simplified terms the photoreceptors in the retina are primarily sensitive to red, green and blue
light. Our brain compiles the response of each of the three types of receptors to perceive every color.
© 2007 Heather Lyon Weaver. Used under license.
15
http://en.wikipedia.org/wiki/Image:Cone-response.svg
Even outside of the human nervous system red, green and blue light can be mixed together in various
proportions to replicate nearly any color. In the mixing of light to create color, red, green and blue are
primary colors. A primary color is a color that can be mixed with other colors to create additional different
colors. Because red, green and blue light is added together to create other colors, mixing light is considered
an additive process whereas painting with pigments is a subtractive color process because pigments are
used to filter out or subtract various wavelengths of light.
While other color combinations could have been chosen as the primary colors for use in color video
systems, developers chose to use red, green and blue. If equal proportions of full intensity red, green and
blue light are projected onto a white screen, white light will be the result. Although it is far from being
immediately intuitive, if equal proportions of green and red light are projected onto a screen, yellow will be
the result. The diagram below illustrates how red, green and blue light can be combined to produce a
variety of colors.
http://en.wikipedia.org/wiki/Image:AdditiveColor.svg
© 2007 Heather Lyon Weaver. Used under license.
16
Adjusting the intensity of combinations of red, green and blue light result in the creation of still more
colors. For example, orange light is created with green light at about 50% intensity, red light at full
intensity and blue turned off. The combinations are infinite.
The addition of white light to any color creates a less saturated color. If a red light shines on a screen at
full intensity, fully saturated red light will result. If blue and green light is added at 50% intensity, pink
will result. Remember that red, green and blue light at full intensity produces white light. The addition of
50% blue light and 50% green light to 100% red light has the effect of washing out 50% of the red in the
light.
Because red, green and blue light can be mixed together to replicate nearly any color and since the object of
video is to ultimately be presented in the form of light, even though the world abounds with an infinite
array of colors, a color video camera need only collect the varying amounts of red, green and blue light
being reflected into it.
HOW A MOVING IMAGE IS COLLECTED IN COLOR
The camera must first have a means to extract and separate the wavelengths of light corresponding to red,
green and blue. While there are various methods employed to accomplish this, one of the most common
methods is to place a trichroic prism behind the lens of the camera. A trichroic prism is a set of glass
prisms whose various sides are coated with a substance that filters or reflects light based on wavelengths.
The light entering a camera is separated into three separate beams of wavelength ranges that correspond to
red, green and blue.
http://en.wikipedia.org/wiki/Image:Dichroic-prism.svg
If the light entering the camera was uniformly filtered so that the red filter only permitted light in the range
of 650 nanometers to pass through, the green filter only permitted light in the range of 550 nanometers to
pass through and the blue filter only permitted light in the range of 440 nanometers to pass through,
depending on the range variances of each filter, a yellow object reflecting light at 570 nanometers would
either not exist or may pass through the green filter and become a green object when the scene is
reproduced. Like the cones in the retina of the human eye the trichroic prism must filter light based on an
attenuated response to wavelengths surrounding the primary wavelength affected by each filter. An article
available on the web entitled “A Guided Tour of Color Space” by Charles Poynton is an excellent reference
to learn more about this.
In cameras employing tube technology each beam is then directed onto a separate photosensitive surface.
There are three separate tubes inside the color camera. Each tube is a fully functional tube with its own
surface and its own electron gun. The electron beam in each tube scans its target and is modulated in direct
proportion to the light levels present at the time the surface was scanned.
© 2007 Heather Lyon Weaver. Used under license.
17
Through the process of transduction the camera has created three separate electronic signals that, when
transduced back into light and combined, can produce a full color image. The electronic signals transduced
from the red, green and blue light are often abbreviated and simply referred to as R, G and B respectively.
Full
Red
Green
Blue
The images above show a full color scene separated into its red, green and blue components.
The R, G and B signals are 3 separate signals. If the R, G and B signals were transmitted to homes, each
signal would have to be transmitted separately, taking three times the space of the black and white
composite signal. Black and white televisions capable of receiving only one channel would become
obsolete because neither the R, G or B signal alone carries the combined brightness levels of the entire
scene that the camera collected.
Clearly, more processing is required to meet the goals originally set forth: to incorporate the color
information into the video signal in such a way that the color information does not interfere with the
brightness information so that black and white televisions could still pick up a transmitted signal and to not
increase bandwidth requirements.
HOW WE GET FROM RGB TO NTSC COMPOSITE
The design of black and white television equipment is based on the anatomy and timing of the video signal
as it was originally developed and standardized for broadcast. The black and white television system
requires only brightness or luminance information (and synchronizing pulses) to create an image. A
reasonable first step in assuring black and white television compatibility with a color signal was to extract a
luminance signal from the three separate red, green and blue signals created in the color camera.
A mechanism called a matrix was introduced into the body of the camera capable of extracting a luminance
signal from the R, G and B signals. A matrix is an electronic circuit capable of manipulating an electronic
signal based on mathematical equations.
© 2007 Heather Lyon Weaver. Used under license.
18
The proportion to which the luminance information is derived from the red, green and blue signal
components is based upon the intricacies of the human visual system. Through extensive research studies it
was determined that humans are able to distinguish fine detail (gradations of brightness) more readily in
greens than in other colors. While each of the three different types of cone cells found in the human retina
are most sensitive to a particular range of wavelengths, all cones have some sensitivity to light wavelengths
corresponding to shades of green. In reviewing the cone sensitivity graph on p. XX, it can be seen that, to a
lesser extent, this is also the case with wavelengths corresponding to shades of red while human vision is
the least sensitive to wavelengths in corresponding to blues.
Taking into consideration the sensitivity of the human eye the luminance signal, often denoted as Y, is
derived from the RGB signals using the following formula:
Y = .587G + .299R + .114B
The luminance signal is comprised of approximately 59 percent of the green signal, 30 percent of the red
signal and 11 percent of the blue signal. With the addition of synchronizing pulses, the luminance signal
alone is capable of producing an image on a black and white television monitor.
Because the luminance signal carries a percentage of the information contained in the red, green and blue
signals, if all four signals (R, G, B, Y) were transmitted some information would be redundant and a
significant amount of signal reduction is needed to create a color signal that does not require more
bandwidth than the originally broadcast black and white signal.
The signals can be reduced further by subtracting the luminance signal from each of the red, green and blue
signals mathematically in the following manner: R-Y, G-Y, B-Y.
The luminance signal (Y) is comprised of roughly 11% of the original blue signal (B). The B-Y signal still
contains 89% of the information needed to recreate a full blue signal. The luminance signal (Y) is
comprised of roughly 30% of the original red signal (R). The R-Y signal still contains 70% of the
information needed to recreate a full red signal. The luminance signal (Y) is comprised of roughly 60% of
the original green signal (G). The G-Y signal only contains 40% of the information needed to recreate a
full green signal. Because the G-Y signal contains the least amount of information and since the G signal
can be derived mathematically (thus electronically) from the Y, R-Y and B-Y signals, it is not necessary to
retain the G-Y signal.
Y
R-Y
B-Y
The above images illustrate the result of transcoding the RGB signals into Y, R-Y and B-Y components.
The result of the above manipulations is, once again, 3 signals: Y, R-Y and B-Y. The difference between
the RGB signal group and the Y, R-Y, B-Y signal group is that, after the addition of synchronizing pulses,
the Y component of the signal is capable of producing an image on a black and white monitor and the
overall signal bandwidth has been reduced.
The R-Y and B-Y portions of the signal are often referred to as the color difference components. A
component video signal is a signal where the luminance portion of the signal and the chrominance
portion(s) of the signal (in this case the color difference signals) are stored and travel from device to device
on separate cables. Component video signals are never transmitted through the air. Component video
© 2007 Heather Lyon Weaver. Used under license.
19
signals were not widely used in video applications until the early to mid 1980’s with the invention of the
Betacam tape format in 1982.
More signal reduction and manipulations are required to create a composite video signal carrying both
luminance and chrominance information together.
Through the wonders of mathematics, physics and electronics the R-Y and B-Y signals undergo further
reductions and processing. The information carried in the R-Y and B-Y signals is used to modulate a
3.58mhz electronic sine wave called the color subcarrier.
[The color subcarrier wave is modulated in such a way that the amplitude of the wave signifies the
saturation level or how much color there is at any given point in the video signal and the phase of the wave
determines the hue or what color is present at any given point in the video signal. The amplitude of a wave
is the distance each wave rises above or falls below its horizontal center point. The phase of a wave
indicates where the wave happens to be at any given point in time in traveling through its range of motion.
http://upload.wikimedia.org/wikipedia/commons/e/e9/Wave.png
The modulated subcarrier is then combined with the luminance signal, Y, to produce the NTSC composite
analog video signal. Electronic interference resulted when the first attempts were made to combine the
color information with the luminance portion of the video signal. Developers of the NTSC composite video
signal discovered that the interference could be avoided by reducing the video frame rate from 30 frames
per second to 29.97 frames per second.
[tek “A guide to DTV systems and measurements p. 3 fig 2.2 composite encoding]
Eight to eleven cycles of the unmodulated subcarrier wave is added to every line of the video signal during
horizontal blanking in the back porch area. This quick burst of subcarrier, called color burst, becomes the
reference signal that display devices use for synchronization to extract the color information from the
modulated subcarrier. The difference between the modulated color subcarrier and the unmodulated carrier
is the encoded color information.
VIEWING THE COLOR PORTION OF A VIDEO SIGNAL ON A WFM
It is possible to see the sine waves representing the color information in a video signal using the waveform
monitor. A color bar test signal is a good choice for examination. The waveform monitor FILTER should
be set to FLAT so that the color information is not filtered out of the signal with a low pass filter. Set
sweep to 2LINE and use MAG to zoom in on the signal so that each major division of the horizontal
graticule constitutes 1 microsecond. In this view the color burst can be seen on the back porch in the
horizontal blanking interval. The amplitude of color burst can be measured using the waveform monitor
and should be 40 IRE. If color burst does not meet this requirement, it is likely that a monitor will be
unable to properly reproduce the color information in the video signal.
© 2007 Heather Lyon Weaver. Used under license.
20
Burst with Measurement
The presence or absence of color burst in the signal provides potentially critical clues about the history of a
tape in a collection. The absence of color burst is a clue that the signal under inspection has not been
migrated since color video technology was prevalent. If a black and white signal has been migrated onto
another format using equipment designed for the processing of color video signals it is likely that color
burst would have been added to the signal during the transfer process.
The waveform monitor can be used to measure the amplitude of the chrominance portion of the video
signal. Some waveform monitors can be set to CHRM to monitor only this portion of the video signal. In
the example below a color bar test pattern is displayed on the waveform monitor in CHRM view.
[DSC35 chrm only mon SmpteBar]
In FLAT view both the chrominance and the luminance components of the signal are displayed. The image
below depicts the color bar test signal in FLAT view. This view is sometimes useful to make an overall
measurement of the luminance plus chrominance portion of the video signal combined. When the
luminance and chrominance portions of the video signal combined exceed about 120 IRE, the signal is at
© 2007 Heather Lyon Weaver. Used under license.
21
risk of being clipped during transfer or display resulting in a loss of detail in the high chroma areas of the
resulting image.
VECTORSCOPE INTRO AND DESCRIPTION –how to read basics
Although the waveform monitor is a good choice for measuring color burst, it is limited in its ability to
display the color information embedded in the NTSC composite video signal. The waveform monitor does
not provide an effective display of the phase of the chrominance portion of the video signal and measuring
chrominance amplitudes of particular colors in an image is unweildy. A vectorscope provides a superior
display of the chrominance portion of the video signal for test and measurement purposes. Like the
waveform monitor, the vectorscope is a special oscilloscope designed for use in video applications.
When displayed in graph form a sine wave produces a straight line. The amplitude of the wave determines
the length of the line on the graph. The phase of the wave determines the direction the line points toward.
A vector is the mathematical term given to the line that represents the sine wave graphically. A vectorscope
uses these conventions when plotting the chrominance portion of the video signal on its graticule. The
vectorscope demodulates the color portion of the composite video signal and plots R-Y against B-Y.
The graticule of the vectorscope is etched with a large circle broken up by 360 little marks to facilitate
measurements in units of degree. Phase is measured as an angle in degrees. The phase angle of a sine
wave is measured from 0 degrees. The 0 degree line is in the 3 o’clock position on the face of the
vectorscope. The phase of the sine wave determines the hue it describes. For example, the sine wave
produced by the color green points toward 241 degrees. The sine wave produced by blue points toward 347
degrees.
© 2007 Heather Lyon Weaver. Used under license.
22
BlueSquare.psd? Could not find this image. JP
The amplitude of the chrominance signal determines the length of the line emanating from the center of the
vectorscope. The greater the amplitude of the sine wave, the more highly saturated the color it describes.
The sine wave describing a saturated color produces a line that extends from the center of the graticule of
the vectorscope to the outer edges of the circle. The sine wave of a weak, pastel color produces a shorter
line.
The vectorscope on the left displays the signal created by a red square. The vectorscope on the right
displays the signal created by a pink square. Both the red square and the pink square possess the same hue.
They only differ in the amount of saturation they contain.
[Top: RedSquare.psd below it in column form: DSC 57 / top:PinkSquare.psd below it DSC 59]—either
the vec images need to be fixed or a note must be added:
the note still needs better wording----the video signal used to create these samples was not perfect. Consequently it appears that there is more
than one line emanating from the center of vectorscope graticule.
Just inside the large circle etched onto the graticule of the vectorscope are small boxes called targets
labeled with abbreviated names of colors. These targets are specifically used in conjunction with the color
bar test signal and are also helpful in determining how measurements in degrees correspond to specific
colors. The vectorscope pictured below displays a color bar test signal.
© 2007 Heather Lyon Weaver. Used under license.
23
[mon Smpte Bar next to DES0039]
All lines emanate from the center of the vectorscope display. The horizontal lines connecting some of the
targets are just an effect of the display. When displaying the color bar test signal on the vectorscope a
horizontal line connects the cyan target and the green target. When viewed separately, each bar creates a
vector emanating from the center of the display.
The targets intended for use with color bars are etched onto the graticule of the vectorscope because the use
of the color bar test pattern has become an industry standard in system testing and calibration. One minute
of the color bar test signal is recorded at the head of every professionally produced master. During the
postproduction of a video work where the look of the piece is critical, every piece of equipment that the
video signal flows through will be checked using a color bar test signal using a test signal generator. The
calibration of the monitor is carefully checked daily before color correction begins. The color bar test signal
at the head of a master tape is used as a guide to adjust playback and monitoring equipment so that the
amplitude and phase of the signal can be adjusted to produce an image in the manner intended by the artist.
If the far points of the vectors of the color bar test signal do not reach the targets on the vectorscope
graticule then the amplitude of the color subcarrier in the video signal is weak and must be increased. If the
far points of the vectors of the color bar test signal exceed the targets on the vectorscope graticule then the
amplitude of the color subcarrier must be decreased. The amplitude of the color subcarrier affects how
much color is contained in the image. This is often referred to as chroma.
If the points of the vectors of the color bar test signal are not aligned with the targets on the vectorscope
then the phase of the color subcarrier must be adjusted. The phase of the color subcarrier affects what
colors are contained in the image. This is often referred to as hue.
© 2007 Heather Lyon Weaver. Used under license.
24
In many instances it will not be possible to align all of the vectors of the color bar test signal into their
targets. In this case, it is usually best to align the red vector with its target. Technicians must sometimes
use their best judgement when adjusting a signal for transfer.
The ability to quantify and adjust the video signal using the vectorscope as guide is critical in the
preservation process.
VECTORSCOPE SET UP
An understanding of how to display a video signal on a vectorscope and how that display is altered based
upon the settings selected can often be gained by reading the vectorscope’s user manual. Therefore only
several settings critical to the overall positioning of the signal for proper measurement will be briefly
explained.
For standard viewing of an NTSC color video signal, the vectorscope should be set in VECT mode as
opposed to XY mode. XY mode is used for measuring audio. It is important to instruct the vectorscope to
look at the correct input using the INPUT control. The FOCUS, SCALE and INTENSITY controls should
be set for optimal viewing. REF should be set to INT. The vectorscope display should be optimized for
75% BARS rather than 100% BARS. Choosing 100% bars shrinks the display of the signal relative to the
graticule, affecting the measurement of signal amplitude.
The color burst portion of the video signal can be used to properly position the signal on the graticule of the
vectorscope. The color burst portion of the video signal, being a 3.58 Mhz sine wave with amplitude of 40
IRE, actually describes a yellowish-green color. It is not normally seen on a television monitor because it
occurs during the horizontal blanking interval. The monitor pictured below has been adjusted so that the
horizontal blanking interval is visible. The yellowish-green vertical band is color burst.
© 2007 Heather Lyon Weaver. Used under license.
25
The easiest way to identify color burst on the vectorscope is to do so when the signal contains only black.
Color burst is added to each line of video in the composite video signal so even if the signal appears to be a
black screen on the monitor, color burst should be present. The PHASE control on the vectorscope should
be adjusted so that color burst is aligned with the 180 degree line on the vectorscope. If the face of the
vectorscope were a clock, the 180 degree line would be at 9 o’clock. Color burst is a single sine wave that
creates a single line on the graticule of the vectorscope emanating from the center of the circle.
When no color is present in the video signal the amplitude of the color subcarrier is zero. When the
amplitude of a sine wave is zero the wave is flat. Black, white and shades of pure gray are ranges of
luminance levels. They have no saturation or hue and are not considered colors in the world of video.
Consequently an image containing black, white and / or shades of gray will be displayed on the vectorscope
only as a line of color burst emanating from a small dot in the center of the graticule. On the vectorscope 0
amplitude lies directly in the center of the circle.
Every hue and saturation value contained in each frame of a color video signal will be plotted separately on
the graticule of the vectorscope over time. Every hue and saturation value in the collected image produces
its own sine wave even though the sine waves are all strung together in the chrominance portion of the
video signal. Each pixel comprising a frame of the video signal could theoretically contain a unique hue
and saturation value, creating a separate line on the vectorscope display.
REAL COLOR IMAGES
Pixels of varying amplitude but with the same phase will be piled on top of one another for each frame
displayed. When viewing a typical scene collected by the camera of the real world complete with sky,
vegetation, humans, pets and objects, the video signal displayed is often not unlike an amorphous blob
emanating from the center of the vectorscope display, blossoming out in several directions. Below is a
typical video image and its corresponding vectorscope display.
© 2007 Heather Lyon Weaver. Used under license.
26
To better understand how the vectorscope display corresponds to the image, several areas have been
isolated in the samples below. The hue of the subject’s face lies between yellow and red. The face is not
overly saturated.
The grass is just a bit greener than colorburst.
The rock pile in the background is bluish in hue.
© 2007 Heather Lyon Weaver. Used under license.
27
The ability to translate the amorphous blob that is an electronic representation of the chrominance portion
of the video signal on the vectorscope into something meaningful becomes easier with experience. In
videotape preservation and remastering applications, the vectorscope is an invaluable tool in identifying
potentially problematic video signals that the human visual system is unlikely or completely unable to
recognize. The human visual system is tolerant and very forgiving of uniform discrepancies in hue. Our
brains enable us to quickly adjust to less than optimal color balance in moving images captured in video
and in film.
The image below is a split screen of a single tape transferred on two separate occasions. The image on the
left side is not only highly degraded, it also has a reddish-yellow color cast. When compared to the black
and white version on the right side the color cast is evident. But when the color tape is played, it is often
mistaken as black and white because the image is monochrome. Comparing the vectorscope displays of the
image with a color cast and the true black and white version, the difference is clear. The purely black and
white image only displays a small dot in the center of the vectorscope (except for color burst) while the
image with the color cast displays a vector pointing between red and yellow at about 123 degrees.
© 2007 Heather Lyon Weaver. Used under license.
28
Many early video works were created using basic equipment that did not have built in test signal
generators. Consequently, these works rarely contain a color bar test signal recorded at the head of the tape
to assist the preservation technician in setting video levels for a transfer. In these cases the technician must
review the video signal using the display monitor, a waveform monitor and a vectorscope to determine
whether adjustments need to be made to the signal during the remastering process.
Some video works contain a color bar test signal at the head of the tape but that test signal has no
relationship to the program content. Sometimes artists creating a video knew that it was standard to place a
color bar test signal at the head of a tape but the implications of the test signal were not fully understood. It
was not always known that the test signal would later be used in setting video levels that would affect the
look of the image. After adjusting a video signal using the color bar test pattern at the head of the tape, the
program content should be checked to ensure that the settings have not adversely altered the video signal.
A basic understanding of the NTSC composite video signal coupled with the ability to evaluate and adjust
the signal using waveform monitors and vectorscopes provides the video preservationist with the minimum
tools required to evaluate and transfer NTSC composite video signals. Once these skills have been
mastered, the student of video can build upon this foundation. More intricate knowledge of the use of
waveform monitors and vectorscopes allows the technician to recognize more complex potential issues
within a signal such as linear and nonlinear distortions, etc. Different types of video signals, such as
component formats and digital formats, have different specifications for migration. As technology
progresses new video formats will continue to be introduced. The video preservationist has no choice but
to continue to progress in this endeavor.
(updates to module available at www.nyu.edu/tisch/preservation)
© 2007 Heather Lyon Weaver. Used under license.
29