1
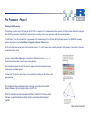
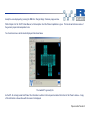
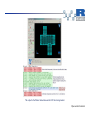
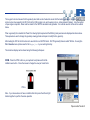
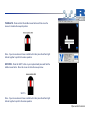
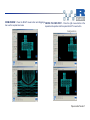
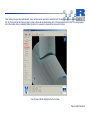
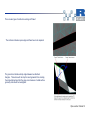
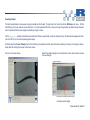
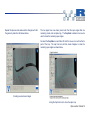
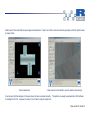
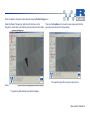
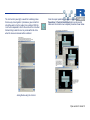
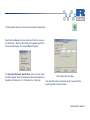
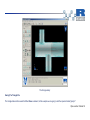
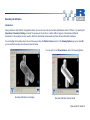
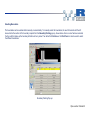
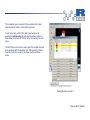
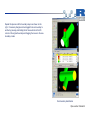
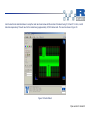
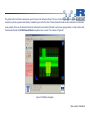
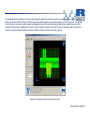
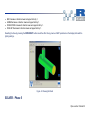
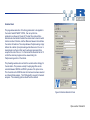
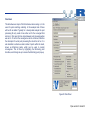
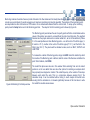
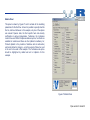
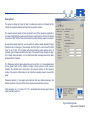
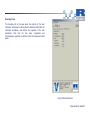
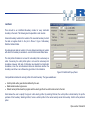
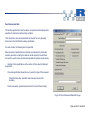
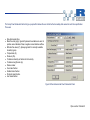
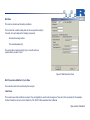
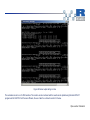
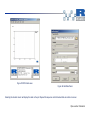
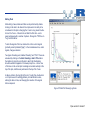
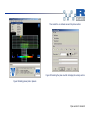
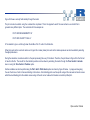
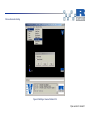
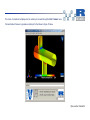
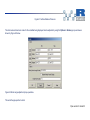
RPLOT
Overview
RPLOT is an interactive plotting package developed by Ricardo to display graphical output from its engineering analysis software tools. The
purpose of this tutorial is to outline the basic features of RPLOT , in order to allow users to produce plots of data generated during the
Basic Operation
Reading Data
Typically the first task when running RPlot is to add axes. For the data produced in this example, a simple X-Y plot is the most suitable. To
perform this, click on the Add > Plot > XY option in the taskbar. The screen should then show a blank set of axes, as in Figure 35.
Data can now be displayed. To do so, click on the Add > Data option in the taskbar, then click on the graph area. A panel will be displayed
from which data can be read in. This is shown in Figure 36.
The raw data to be plotted is stored in the Monitoring files saved during the Phase 5 solver stage. To access these, click on the file icon in
the top right of the Add Data panel. This will bring up a browser where it is possible to load the file. The following instructions guide the user
through the first plot – further plots can be added as desired.
The first plot to be drawn is the relative values, i.e. the values relative to the reference position. This is a good gauge of convergence.
Selecting pipe.JUNCTION_001 will bring up a further Add ASCII Data Panel popup that requires selection of column lists. The monitoring
files are tables (visible using the "more filename" command at the command line or a text editor) of data recorded at each iteration during
Phase 5. You can see what is contained in each column of each output file at the top of the pipej.OUT_001 file.
Pipe Junction Tutorial 45