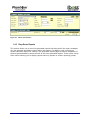
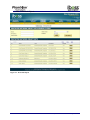
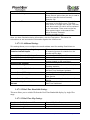
1
Note: Please refer to the User Manual online for the latest updates at www.ibosswebfilters.com. Copyright © by Phantom Technologies Inc. All rights reserved. No part of this publication may be reproduced, transmitted, transcribed, stored in a retrieval system, or translated into any language or computer language, in chemical, manual or otherwise, without the prior written permission of Phantom Technologies Inc. Phantom Technologies Inc makes no representations or warranties, either expressed or implied, with respect to the contents hereof and specifically disclaims any warranties, merchantability or fitness for any particular purpose. Any software described in this manual is sold or licensed "as is". Should the programs prove defective following their purchase, the buyer (and not this company, its distributor, or its dealer) assumes the entire cost of all necessary servicing, repair, and any incidental or consequential damages resulting from any defects. Further, this company reserves the right to revise this publication and make changes from time to time in the contents hereof without obligation to notify any person of such revision of changes. All brand and product names mentioned in this manual are trademarks and/or registered trademarks of their respective holders. www.iBoss.com Open Source Code This product may include software code subject to the GNU General Public License (“GPL”), GNU Lesser General Public License (“LGPL”), or other open-source software licenses. Copies of the GPL and LGPL licenses are available upon request. You may also visit www.gnu.org to view more information regarding open-source licensing. The GPL, LGPL and other open-source code used in Phantom Technologies Inc products are distributed without any warranty and are subject to the copyrights of their authors. Upon request, open-source software source code is available from Phantom Technologies Inc via electronic download or shipment on a physical storage medium at cost. For further details and information please visit www.iphantom.com/opensource. Rev 6.0.23.25: December 17, 2013 Page 2 of 103 Table of Contents TABLE OF FIGURES ................................................................................................................................................ 4 1 ENTERPRISE REPORT MANAGER............................................................................................................. 7 1.1 EXTERNAL ENTERPRISE REPORTER .................................................................................................................. 7 1.1.1 Installing the External iBoss Enterprise Reporter on the network. ..................................................... 7 1.1.2 Setup Steps to Register iBoss to External Enterprise Reporter ........................................................... 7 1.2 ACCESSING THE REPORT MANAGER ................................................................................................................ 8 1.3 LOGGING INTO THE REPORT MANAGER ........................................................................................................... 8 1.4 REPORT GENERATION AND MANAGEMENT ...................................................................................................... 9 1.4.1 Real-Time dashboard .......................................................................................................................... 9 1.4.1.1 1.4.1.2 1.4.1.3 1.4.1.4 1.4.1.5 1.4.1.6 Web Dashboard............................................................................................................................................... 9 Bandwidth Dashboard ................................................................................................................................... 14 Bandwidth Plotter ......................................................................................................................................... 18 Bandwidth Shaping ....................................................................................................................................... 20 Threat Dashboard .......................................................................................................................................... 24 Endpoint Security.......................................................................................................................................... 27 1.4.2 Logs ................................................................................................................................................... 28 1.4.3 Drop-Down Reports .......................................................................................................................... 32 1.4.4 Threat Controls ................................................................................................................................. 38 1.4.5 Report Schedules ............................................................................................................................... 45 1.4.6 Automatic Desktop Monitor/Control/Record (DMCR)...................................................................... 52 1.4.7 Settings .............................................................................................................................................. 55 1.4.2.1 1.4.2.2 1.4.3.1 1.4.3.2 1.4.3.3 1.4.3.4 1.4.4.1 1.4.4.2 1.4.4.3 1.4.4.4 1.4.4.5 1.4.4.6 1.4.5.1 1.4.5.2 1.4.5.3 1.4.5.4 1.4.5.5 1.4.6.1 1.4.6.2 1.4.6.3 1.4.6.4 1.4.6.5 1.4.7.1 1.4.7.2 1.4.7.3 1.4.7.4 1.4.7.5 1.4.7.6 1.4.7.7 1.4.7.8 1.4.7.9 Web ............................................................................................................................................................... 29 Threats & Malware ....................................................................................................................................... 30 Report Types ................................................................................................................................................. 34 Deleting Reports ........................................................................................................................................... 34 Exporting PDF Reports ................................................................................................................................. 34 Generating a Report ...................................................................................................................................... 34 General Settings ............................................................................................................................................ 38 Threat Categories .......................................................................................................................................... 40 Behavioral DLP ............................................................................................................................................ 42 Protected Objects .......................................................................................................................................... 43 Signature Tuning ........................................................................................................................................... 44 Bypass IP/Port............................................................................................................................................... 45 Deleting Report Schedules ............................................................................................................................ 46 Editing Report Schedules .............................................................................................................................. 46 Report Schedule Processing .......................................................................................................................... 46 Report Schedule Types ................................................................................................................................. 46 Creating a Report Schedule........................................................................................................................... 46 Installing VNC .............................................................................................................................................. 52 Registering a Computer to DMCR ................................................................................................................ 52 Video Desktop .............................................................................................................................................. 53 Video Desktop Recordings ........................................................................................................................... 54 Recording Thresholds ................................................................................................................................... 54 General .......................................................................................................................................................... 55 Users ............................................................................................................................................................. 64 Report Groups ............................................................................................................................................... 66 Log Archives................................................................................................................................................. 67 Register Gateways ........................................................................................................................................ 70 Time .............................................................................................................................................................. 72 Network Settings ........................................................................................................................................... 72 SSL ............................................................................................................................................................... 73 Subscription .................................................................................................................................................. 73 1.4.8 Report Manager System Information ................................................................................................ 74 1.5 VIEWING REPORTS ......................................................................................................................................... 74 1.5.1 Report Information Section ............................................................................................................... 75 1.5.1.1 Showing Report Information for Particular Users ......................................................................................... 75 Rev 6.0.23.25: December 17, 2013 Page 3 of 103 1.5.1.2 Quickly switching between reports ............................................................................................................... 76 1.5.2 Web Usage Statistics ......................................................................................................................... 76 1.5.3 Bandwidth Statistics .......................................................................................................................... 94 1.5.4 Threats & Malware ........................................................................................................................... 99 1.5.2.1 1.5.2.2 1.5.2.3 1.5.2.4 1.5.2.5 1.5.2.6 1.5.2.7 1.5.2.8 1.5.2.9 1.5.2.10 1.5.2.11 1.5.2.12 1.5.2.13 1.5.2.14 1.5.3.1 1.5.3.2 1.5.3.3 1.5.3.4 1.5.3.5 1.5.4.1 1.5.4.2 1.5.4.3 1.5.4.4 2 Web Hit Trends ............................................................................................................................................. 77 Web Hits By Category .................................................................................................................................. 77 Time Use By Category .................................................................................................................................. 80 Top Visited Domains .................................................................................................................................... 82 Top Blocked Domain .................................................................................................................................... 82 Top Users By Category Time Use ................................................................................................................ 83 Top Users By Category Web Hits ................................................................................................................. 85 Top Users By Overall Web Hits ................................................................................................................... 87 Top Users By Overall Time Use ................................................................................................................... 88 Top Blocked Users ........................................................................................................................................ 89 Trending Now ............................................................................................................................................... 90 Suspicious ..................................................................................................................................................... 91 Liability......................................................................................................................................................... 92 Filter Avoidance............................................................................................................................................ 93 Graph ............................................................................................................................................................ 94 Top Overall Users ......................................................................................................................................... 95 Top Downstream Users ................................................................................................................................ 96 Top Upstream Users...................................................................................................................................... 97 Domains ........................................................................................................................................................ 98 Top Overall Threats ...................................................................................................................................... 99 Top Outbound Threats ................................................................................................................................ 100 Top Inbound Threats ................................................................................................................................... 101 Top User by Threats................................................................................................................................... 102 REGULATORY STATEMENT ................................................................................................................... 103 Table of Figures Figure 1 - iBoss Reports Login ....................................................................................................... 9 Figure 2 – Web dashboard ............................................................................................................ 10 Figure 2 - Real-time Bandwidth Graph ........................................................................................ 11 Figure 4 – Real-Time Web Hits Graph ......................................................................................... 11 Figure 5 - Current Top Bandwidth Consumers............................................................................. 12 Figure 6 - Current Top Bandwidth Consumers Full List .............................................................. 12 Figure 3 - Real-time URL Access Activity................................................................................... 13 Figure 8 – Current Activity ........................................................................................................... 14 Figure 9 – Bandwidth Dashboard ................................................................................................. 16 Figure 10 – Real Time Activity .................................................................................................... 16 Figure 11 –Data Movement Maps ................................................................................................ 17 Figure 12 – Real Time Bandwidth ................................................................................................ 18 Figure 13 – Real-Time Bandwidth Plotter .................................................................................... 19 Figure 14 – Connection Detail Full List ....................................................................................... 19 Figure 15 – Bandwidth Shaping ................................................................................................... 22 Figure 16 – Downstream Bandwidth Overview ........................................................................... 22 Figure 17 – Upstream Bandwidth Overview ................................................................................ 22 Figure 18 – Unshaped bandwidth ................................................................................................. 23 Figure 19 – Bandwidth Pools........................................................................................................ 24 Figure 20 – Threat dashboard ....................................................................................................... 25 Figure 21 – Real-Time Activity .................................................................................................... 26 Figure 22 – Threat Activity........................................................................................................... 27 Rev 6.0.23.25: December 17, 2013 Page 4 of 103 Figure 23 – Endpoint Security ...................................................................................................... 28 Figure 24 – Web Logs................................................................................................................... 29 Figure 25 – Web Log Search Filters ............................................................................................. 30 Figure 26 - Site Callouts ............................................................................................................... 30 Figure 27 – Threats & Malware .................................................................................................... 31 Figure 28 – Threat Search Filters.................................................................................................. 32 Figure 29 – Drop-Down Reports .................................................................................................. 33 Figure 30 - Generate Report ......................................................................................................... 36 Figure 31 – General Settings......................................................................................................... 39 Figure 32 – Threat Categories....................................................................................................... 41 Figure 33 – Behavioral DLP ......................................................................................................... 42 Figure 34 – Protected Objects ....................................................................................................... 43 Figure 35 – Signature Tuning ....................................................................................................... 44 Figure 36 – Bypass IP/Port ........................................................................................................... 45 Figure 37 - Report Schedules ........................................................................................................ 46 Figure 38 - Create a Report Schedule ........................................................................................... 49 Figure 39 - UVNC Properties ....................................................................................................... 52 Figure 40 - Video Desktop Monitoring ........................................................................................ 53 Figure 41 - Live Desktop MultiView............................................................................................ 54 Figure 42 - Report Manager Settings ............................................................................................ 58 Figure 43 - Report Manager Database Settings ............................................................................ 60 Figure 44 - Report Users ............................................................................................................... 64 Figure 45 - Add Report Manager User ......................................................................................... 65 Figure 46 – LDAP User config ..................................................................................................... 66 Figure 47 - Report Groups ............................................................................................................ 66 Figure 48 - Add Reporting Group ................................................................................................. 67 Figure 49 - Manage URL Log Archives ....................................................................................... 68 Figure 50 - Manage Bandwidth Log Archives ............................................................................. 69 Figure 51 – IPS Logs .................................................................................................................... 69 Figure 52 - Register iBoss Devices ............................................................................................... 70 Figure 53 - Register Gateway ....................................................................................................... 71 Figure 54 - Configure Time .......................................................................................................... 72 Figure 55 - Configure IP Address Settings ................................................................................... 72 Figure 56 - Subscription................................................................................................................ 73 Figure 57 – System Info ................................................................................................................ 74 Figure 58 - Report Information Section ........................................................................................ 75 Figure 59 – Find User ................................................................................................................... 76 Figure 60 - Web Usage Statistics .................................................................................................. 76 Figure 61 – Web Hit Trends ......................................................................................................... 77 Figure 62 – Web Hits by Category ............................................................................................... 78 Figure 63 - Web Category Detail .................................................................................................. 79 Figure 64 - Time Use By Category ............................................................................................... 81 Figure 65 – Top Visited Domains ................................................................................................. 82 Figure 66 – Top Blocked Domains ............................................................................................... 83 Figure 67 – Top Users by Category Time Use ............................................................................. 85 Figure 68 – Top Users by Category Web Hits .............................................................................. 86 Rev 6.0.23.25: December 17, 2013 Page 5 of 103 Figure 69 - Top Users By Overall Web Hits ................................................................................ 87 Figure 70 - Top Users by Overall Time Use................................................................................. 88 Figure 71 – Top Blocked Users .................................................................................................... 89 Figure 72 – Trending Now ............................................................................................................ 90 Figure 73 – Suspicious .................................................................................................................. 91 Figure 74 – Liability ..................................................................................................................... 92 Figure 75 – Filter Avoidance ........................................................................................................ 93 Figure 76- Graph ........................................................................................................................... 94 Figure 77 – Top Bandwidth Users ................................................................................................ 95 Figure 78 – Top Downstream Users ............................................................................................. 96 Figure 79 – Top Upstream Users .................................................................................................. 97 Figure 80 – Domains ..................................................................................................................... 98 Figure 81 – Top Overall Threats ................................................................................................... 99 Figure 82 – Top Outbound Threats............................................................................................. 100 Figure 83 – Top Inbound Threats ............................................................................................... 101 Figure 84 – Top Users by Threats............................................................................................... 102 Rev 6.0.23.25: December 17, 2013 Page 6 of 103 1 Enterprise Report Manager The iBoss is equipped with an advanced report manager capable of tracking and generating statistics and a variety of aspects of network traffic. This includes web statistics such as web sites visited and top visited domains, as well as detailed port and IP Address accesses. The report manager provides a deep drill down capability that can identify potential risks as well as help optimize the network. The high level of report detail also includes a variety of information that can be summarized for all users in a report or information specific to a particular user. This includes bandwidth usage and graphs showing accesses throughout the report period. The report manager is separated into two major subsections. The first deals with report management, scheduling and generation, while the other involves the report viewing. 1.1 External Enterprise Reporter The External Report Manager or Enterprise Reporter is an appliance that offloads the reporting onto a different server appliance. 1.1.1 Installing the External iBoss Enterprise Reporter on the network. Please configure the network settings for the external iBoss Enterprise Reporter before placing it on the network. Please refer to the Network Settings section for the Enterprise Reporter for more information on how to configure these settings. Once the network settings have been configured, the iBoss Enterprise Reporter is ready to be installed on the network. The port you will be using is the “LAN” port located on the back of the iBoss Enterprise Reporter. Place the iBoss Enterprise Reporter on the switch just as a computer would be. For example, add a network cable from your switch to the “LAN” port of the Enterprise Reporter. Do not put the iBoss Enterprise Reporter in line, like you would when setting up the iBoss filter. After setting up the iBoss Enterprise Reporter on the network, do not forget to identify the Enterprise Reporter from within the iBoss Filter web interface and Select “No, Bypass Filtering Rules”. 1.1.2 Setup Steps to Register iBoss to External Enterprise Reporter This section is a quick guide for registering iBoss devices to an Enterprise Reporter. 1. Setup an IP address for the iBoss Web Filter (please refer to the iBoss IP address section to set this) 2. Setup an IP address for the iBoss Enterprise Reporter (please refer to the iBoss Enterprise Reporter Network Settings section to set this) Rev 6.0.23.25: December 17, 2013 Page 7 of 103 3. Log into the report manager and click on Settings General then change the Report Database Password. (please refer to the iBoss Enterprise Reporter Settings section for more information) 4. Click on Register iBoss Devices Add Device Then set the iBoss name, iBoss IP address, iBoss Web Filter subscription key, and copy the Security key. (please refer to the iBoss Enterprise Reporter Settings section for more information) 5. Log into the iBoss device and click on Preferences Configure Report Settings Edit General Report Settings change the ‘Configure iBoss for’ option to “External Report Manager”. (please refer to the iBoss Report Settings section for more information) 6. Enter the IP address, database password, and security key of the iBoss Enterprise Reporter and click Save. (please refer to the iBoss Report Settings section for more information) Note: Please be sure to identify the report manager within the iBoss interface to bypass any filtering rules. 1.2 Accessing the Report Manager You can access the report manager only while on the same network as the iBoss. You can access the iBoss reports from any computer on the network that has access to the iBoss interface. Note: The default IP address of the iBoss Enterprise Reporter is 192.168.1.20. 1.3 Logging into the Report Manager The default username for the report manager is admin. There is no password by default.You will need to change this setting. Additional users are created in the settings portion of the Report Manager. These users can either be local to the reporter or, if LDAP is configured, users from Active directory, eDirectory, or OpenDirectory. You can also configure specific privileges for the user to restrict the types of operations the user can perform within the report manager. Rev 6.0.23.25: December 17, 2013 Page 8 of 103 Figure 1 - iBoss Reports Login 1.4 Report Generation and Management 1.4.1 Real-Time dashboard After logging into the report manager, the iBoss presents a page detailing the current activity. This page contains information regarding what is currently occurring on the network. There are several other sections within the report management section that include viewing and creating generated reports, viewing and creating report schedules, configuring report settings, and viewing system information. 1.4.1.1 Web Dashboard The current activity section shows active real-time information about the network. This information is updated in real-time automatically. Rev 6.0.23.25: December 17, 2013 Page 9 of 103 Figure 2 – Web dashboard Rev 6.0.23.25: December 17, 2013 Page 10 of 103 1.4.1.1.1 Real-time Bandwidth Activity Graph The first section includes real-time Bandwidth Activity that includes Bandwidth in kilobits per second. It is necessary to hover the mouse over the graph to view the numerical data. Figure 2 - Real-time Bandwidth Graph 1.4.1.1.2 Real-Time Web Hits The second section is a graph indicating number of web hits. The yellow graph is the total number of web hits, where the black line is the number of blocked web hits. It is necessary to hover the mouse over the graph to get the numerical data. Figure 4 – Real-Time Web Hits Graph Rev 6.0.23.25: December 17, 2013 Page 11 of 103 1.4.1.1.3 Real-Time Top Bandwidth Consumers This section includes the top consumers of bandwidth updated in real-time. You can click on the “More” button for more details of users. Figure 5 - Current Top Bandwidth Consumers Figure 6 - Current Top Bandwidth Consumers Full List 1.4.1.1.4 Real-time website activity This section shows the current websites being visited. The URLs are updated in real-time as users on the network access website destinations. It will also provide details about the URL access including categories. The list will highlight URLs that were blocked by the iBoss. This list is updated in real-time without the need to refresh the page. This section also has a filter to only show a specific User and/or Action (Allowed or Blocked). You may simply click the username in this list to automatically set the filter to a specific user. You may also click the Pause button to stop the list from scrolling. Rev 6.0.23.25: December 17, 2013 Page 12 of 103 Figure 3 - Real-time URL Access Activity 1.4.1.1.5 Current Activity This section provides, at a glance, information about the overall trends on the filtered network. It is divided up in to cubes, all of which can be tasked to show a different field. Fields available are: Trending Now Suspicious Liability Top Web Categories Top Visited Domains Top Blocked Domains Top Bandwidth Consumers Top Users By Time Top Blocked users Top Threats – Overall Top Threats – Inbound Top Threats – Outbound Top Virus/Malware – Overall Top Virus/Malware – Inbound Top Virus Malware – outbound In addition, all of the fields have a MORE button which brings up more details about the item in question. Rev 6.0.23.25: December 17, 2013 Page 13 of 103 Figure 8 – Current Activity 1.4.1.2 Bandwidth Dashboard This page allows you to view overall trends in your bandwidth usage. Rev 6.0.23.25: December 17, 2013 Page 14 of 103 Rev 6.0.23.25: December 17, 2013 Page 15 of 103 Figure 9 – Bandwidth Dashboard 1.4.1.2.1 Real Time Activity This section has a series of graphs detailing the real time bandwidth activity. Hovering the mouse over the fields will yield additional information. The Real-Time Bandwidth and the Real-Time Connections are identical to the fields on the Web Dashboard. The three bar graphs all look at activity by destination. They list the top five by bytes, connections, and packets. In all three, clicking on the “View All” link yields a full list. Figure 10 – Real Time Activity 1.4.1.2.2 Data Movement Map This section has a pair of maps. The first map shows the data connections and is centered on the physical location of the filter. The second map focuses in on the physical location of the destination consuming the most bandwidth. Both maps can be moved and re-sized to show different locations. Rev 6.0.23.25: December 17, 2013 Page 16 of 103 Figure 11 –Data Movement Maps 1.4.1.2.3 Real-Time Bandwidth This section has a series of graphs detailing bandwidth activity from the perspective of the local hosts. Hovering the mouse over the fields yields more information. The first three fields offer a scatter plot with larger dots representing more bandwidth used. The second three have pie charts showing how the bandwidth is divided up. The last three show the top five sources as opposed to destination. They list the top five by bytes, connections, and packets. In all of them, clicking on the “View All” link yields a full list. Rev 6.0.23.25: December 17, 2013 Page 17 of 103 Figure 12 – Real Time Bandwidth 1.4.1.3 Bandwidth Plotter This section shows a single graph of kbytes/sec vs. number of connections. The larger ‘dots’ indicate more bandwidth being used by the sources identified. This graph, being much larger, gives a great deal more information. Hovering the mouse over the dots reveals details about the source. Rev 6.0.23.25: December 17, 2013 Page 18 of 103 Figure 13 – Real-Time Bandwidth Plotter Clicking on one of the dots brings up details about all of the connections. Figure 14 – Connection Detail Full List Rev 6.0.23.25: December 17, 2013 Page 19 of 103 1.4.1.4 Bandwidth Shaping This page reveals information relating to the bandwidth shaping function of the iBoss SWG Web Filter. Rev 6.0.23.25: December 17, 2013 Page 20 of 103 Rev 6.0.23.25: December 17, 2013 Page 21 of 103 Figure 15 – Bandwidth Shaping 1.4.1.4.1 Downstream Bandwidth Overview This section has three graphs all relating to downstream bandwidth. The first shows the overall downstream bandwidth. The second shows the bandwidth settings in pie chart form. The third shows a similar pie chart detailing how the bandwidth is actually used. The two charts share the same colors for easy comparison. Figure 16 – Downstream Bandwidth Overview 1.4.1.4.2 Upstream Bandwidth Overview This section has three graphs all relating to upstream bandwidth. The first shows the overall upstream bandwidth. The second shows the bandwidth settings in pie chart form. The third shows a similar pie chart detailing how the bandwidth is actually used. The two charts share the same colors for easy comparison. Figure 17 – Upstream Bandwidth Overview 1.4.1.4.3 Unshaped Bandwidth This section has several graphs dedicated to revealing problems with bandwidth that is unshaped by the QoS rules. There are two sets of graphs. The first three are dedicated to Downstream Bandwidth. The second three are dedicated to Upstream Bandwidth. In both Rev 6.0.23.25: December 17, 2013 Page 22 of 103 cases, the first graph details the bandwidth in real time. The second details it over the past hour. The third details it over the past day. Figure 18 – Unshaped bandwidth 1.4.1.4.3.1 Bandwidth Pools The last section on this page deals with the bandwidth pools as detailed in the iBoss SWG Web Filter. The number and shape of the pools will be determined by the number of pools and the rules assigned to them. Similar to the way the Unshaped Bandwidth is displayed in figure 18, each pool, and the rules within each pool, are displayed as a series of graphs. These are Real Time, This Hour, and Today. In addition to the graphs, the bandwidth limits are displayed for easy reference. Rev 6.0.23.25: December 17, 2013 Page 23 of 103 Figure 19 – Bandwidth Pools 1.4.1.5 Threat Dashboard This page is only active if you have linked the Reporter to an iBoss Firewall with Intrusion Detection/Prevention. It allows you to see the threats detected by the ID/PS. Rev 6.0.23.25: December 17, 2013 Page 24 of 103 Figure 20 – Threat dashboard Rev 6.0.23.25: December 17, 2013 Page 25 of 103 1.4.1.5.1 Real-Time Activity This section is a real time display of threats as they come in. It is divided into the top inbound threats, top outbound threats and top overall threats. Figure 21 – Real-Time Activity 1.4.1.5.2 Real Time High Risk Threat Map This section shows where the main threats to your network are coming from on the world map. There is a drop down menu at the top allowing you to display just the highest level threats down to the less severe threats. Figure 22 – Real Time High Risk Threat Map 1.4.1.5.3 Threat Activity This section is a real time scrolling display of events as they occur. The list can be filtered to monitor for specific threats. Rev 6.0.23.25: December 17, 2013 Page 26 of 103 Figure 22 – Threat Activity 1.4.1.6 Endpoint Security This section displays information about the iBoss Endpoint Security system. Please refer to the iBoss Endpoint Security guide for more details about these features. Rev 6.0.23.25: December 17, 2013 Page 27 of 103 Figure 23 – Endpoint Security 1.4.2 Logs This section allows you to view the logs of activity. There are two sections. The first is for web activity. The second is for threat activity. Rev 6.0.23.25: December 17, 2013 Page 28 of 103 1.4.2.1 Web This section displays the logs of web activity from the iBoss Web Filters that are connected to the unit. Figure 24 – Web Logs 1.4.2.1.1 Web Log Search Filters This section contains the filter controls that mold the results displayed below. These filters allow hiding other URLs and only showing results you’d like to see. This makes it easier to diagnose and look through the URLs. You can search for date ranges, users, groups, Mac Rev 6.0.23.25: December 17, 2013 Page 29 of 103 addresses, source IP addresses, computer names, URL or keyword filter, location, category, action and callout. Once you have made these filters, click the “Apply” button above the search filters. You can export this. You may also send this report directly from this page by entering email information under the section for Email This Report Now and clicking the “Send” button. You may also generate a report schedule by clicking on the “Create Report Schedule” button. Figure 25 – Web Log Search Filters 1.4.2.1.2 Site Callouts These are callouts in which site logos are displayed and search terms are tagged. For example, sites like Google will show the logo of Google and the term that was used to search with. Figure 26 - Site Callouts 1.4.2.2 Threats & Malware This section displays the log files from the IPS units that are attached to the reporter. It displays the results in reverse chronological order. Rev 6.0.23.25: December 17, 2013 Page 30 of 103 Figure 27 – Threats & Malware 1.4.2.2.1 Threat Search Filters This section contains the filter controls that mold the results displayed below. These filters allow hiding threats and only showing filters in which you’d like to see. This makes it easier to diagnose and look through the threats. You can search for date ranges, users, groups, Mac addresses, source IP addresses, computer names, protocol, keyword filter, location or class. Once you have made these filters, click the “Apply” button above the search filters. You can export this. You may also send this report directly from this page by entering email information under the section for Email This Report Now and clicking the “Send” button. You may also generate a report schedule by clicking on the “Create Report Schedule” button. Rev 6.0.23.25: December 17, 2013 Page 31 of 103 Figure 28 – Threat Search Filters 1.4.3 Drop-Down Reports This section allows you to view the generated reports that exist within the report manager. You can generate and delete reports within this section. In addition, this is where you access individual reports for viewing. The generated reports page contains a breakdown of the auto-generated daily reports as well as the user generated reports. There is also a drop down menu allowing you to display reports that only pertain to certain reporting groups. Rev 6.0.23.25: December 17, 2013 Page 32 of 103 Figure 29 – Drop-Down Reports Rev 6.0.23.25: December 17, 2013 Page 33 of 103 1.4.3.1 Report Types Generated reports come in two basic types, auto-generated daily reports and user generated reports. Auto-generated daily reports are automatically created by the iBoss. There is one daily report generated per day that includes statistics for usage on that day. User generated reports are reports that are created by the user. These reports can contain custom date ranges, include particular groups, and include only certain statistics among other things. 1.4.3.2 Deleting Reports Reports are deleted as space becomes necessary, but you can select and delete any report on this page by clicking on the “Delete” button next to the report or selecting the checkboxes of the reports you wish to delete and clicking on the “Delete Selected” button. Please note that deleting reports may take a while to process as the iBoss will clean out all related data pertaining to the report. 1.4.3.3 Exporting PDF Reports To export a report, click on the QuickPDF button when viewing the report. This will generate a PDF Report which you can select which options to include in the report. 1.4.3.4 Generating a Report To generate a report, click on the “Generate New Report” button toward the bottom of the list of generated reports. This will lead to a page that presents the options available when creating a report. There are many options available that can be configured when generating a report such as the included group users, the types of statistics you would like to include in the report, as well as the date range for the report. Rev 6.0.23.25: December 17, 2013 Page 34 of 103 Rev 6.0.23.25: December 17, 2013 Page 35 of 103 Figure 30 - Generate Report 1.4.3.4.1 General Report Settings This section contains the general settings for the report to be generated. Below is a description of the options: Report Name Description This is the friendly name for the report. This allows you to enter a description for the report. This is the date from which to start including data for this report. All report statistics within this report will be based on this start date. This is the end date which you wish to stop including data for the report. The end date is not included in the statistics for this report. All data up to this end date is included. The end date must be after the start date. Start Date End Date Include the Following Users and Groups: Delegated Reporting Group # Include All Users & Groups / Include Selected Users & Groups Include Groups Include Users Limit Report to IP Range This allows you to limit the data in the report to the specified reporting group number. Otherwise the entire set of data is used. Selecting Include Selected Users & Groups enables the next two fields. If Include All Users & Groups is selected, the data in the next two fields is irrelevant, and all data is used regardless of user or group. Groups to be included in the report. Multiple groups can be included. Users to be included in the report. Multiple users can be included. If used, all data in the report has to have a local IP address between the start and end IP addresses put in. 1.4.3.4.2 Email PDF Report Recipient This section allows the report to be emailed once generation is complete. Since report generation may take a while to complete, you may choose to configure these settings so that an email can be sent once the email generation process is complete to avoid having to wait for the report to complete. 1.4.3.4.2.1 Email Message Information Rev 6.0.23.25: December 17, 2013 Page 36 of 103 Enter the email information including the recipient, sender, cc, bcc, subject, and message body. This will send the email to another person which looks like it comes from you with a personalized message. 1.4.3.4.2.2 Report Contact Information This information shows up on the cover page of the Emailed PDF Report. Enter the Name, Company Name, Address, City, State, Zip, Email, Phone and Fax. 1.4.3.4.2.3 Report Custom Introduction and Conclusion This information shows up on the second page for the introduction and the last page which is the conclusion. Enter a custom introduction and a custom conclusion. 1.4.3.4.2.4 Additional Information This information shows who the report was prepared by, add a logo, and who it was prepared for. This allows you to customize the report to show that you were the one who prepared it and who it was prepared for. The Logo URL allows you to add a link to an image (.gif or .jpg) to the cover page of the iBoss Report. 1.4.3.4.2.5 Report Type This allows you to choose which type of report to send. There are four options to choose from: Executive, I.T., Full, and Custom. The Executive report has the least information in the report but is used for a quick overview. The I.T. Report show more information such as IP statistics, Port statistics, Application Statistics, and Bandwidth statistics. The Full Report shows all of the contained data. The Custom Report allows you to choose which you may choose which options to include in the report. You may also choose to have the report automatically deleted once it is emailed. Please note that email reports only provide a high level summary of the report. If you would like to keep the report so that you can access the details and all of the drill down capability, do not select this option. Note: You must have a configured SMTP server for the email setting to work. This is configured through “Settings” tab of the report manager. 1.4.3.4.3 Creating the Report Once you have configured these options, click on the “Create Report” button on the bottom of the page. This will trigger the generation of the report and take you back to the Generated Report screen. Please note that only one report generation can occur simultaneously. If there is another report generation in progress, this report will be queued and scheduled for generation. Rev 6.0.23.25: December 17, 2013 Page 37 of 103 You can view the status of the report generation by refreshing the generated reports page. To do this, click on the Generated Reports button on the top of that page. You can access the report while it is being generated, however the data will continue to change as more data is added to the report until the report generation process is complete. If the report includes the current day, statistics will continue to accumulate until the report complete at which point no more data for the current day will be added to the report. 1.4.4 Threat Controls This section defines controls the iboss IPS systems attached to this reporter. More details can be found in the IPS manual. 1.4.4.1 General Settings Rev 6.0.23.25: December 17, 2013 Page 38 of 103 Figure 31 – General Settings Rev 6.0.23.25: December 17, 2013 Page 39 of 103 1.4.4.2 Threat Categories Rev 6.0.23.25: December 17, 2013 Page 40 of 103 Figure 32 – Threat Categories Rev 6.0.23.25: December 17, 2013 Page 41 of 103 1.4.4.3 Behavioral DLP Figure 33 – Behavioral DLP Rev 6.0.23.25: December 17, 2013 Page 42 of 103 1.4.4.4 Protected Objects Figure 34 – Protected Objects Rev 6.0.23.25: December 17, 2013 Page 43 of 103 1.4.4.5 Signature Tuning Figure 35 – Signature Tuning Rev 6.0.23.25: December 17, 2013 Page 44 of 103 1.4.4.6 Bypass IP/Port Figure 36 – Bypass IP/Port 1.4.5 Report Schedules This section allows for the configuration of report generation schedules. Schedules allow you to generate reports for a specified interval of time and have them stored or emailed on a recurring basis. Report schedules also allow for the daily report to be emailed daily to specified recipients. Rev 6.0.23.25: December 17, 2013 Page 45 of 103 Figure 37 - Report Schedules 1.4.5.1 Deleting Report Schedules You can select and delete any report schedule on this page by clicking on the “Remove” button next to the report schedule or selecting the checkboxes of the report schedules you wish to delete and clicking on the “Delete Selected” button. This will terminate the schedule immediately. 1.4.5.2 Editing Report Schedules To edit a report schedule, click on the edit button next to the report schedule you wish to edit. This will take you to the report schedule editing screen. This screen is similar to adding a report schedule which is detailed in the next sections. 1.4.5.3 Report Schedule Processing Report schedules are processed when the “Next Processing Time” has been reached which is detailed next to the report schedule. The scheduler will automatically adjust the next processing time automatically. If there are multiple schedules due to be processed at the same time, only one report schedule will be processed at a time. The others will be queued and each processed one at a time until all of the due schedules have been processed. 1.4.5.4 Report Schedule Types There are two report schedule types, daily report email schedules and custom generated report schedules. Daily report email schedules allow you to email the auto-generated daily reports to specified recipients. It also allows you to enter a customized email message for the email. Custom generated report schedules allow you to create a custom report on a schedule that includes specific statistics, user groups, and more. You can additionally have the custom report emailed whenever a generation occurs. 1.4.5.5 Creating a Report Schedule To create a report schedule, click on the “Create New Report Schedule” located at the bottom of the report schedule list. Rev 6.0.23.25: December 17, 2013 Page 46 of 103 1.4.5.5.1 General Information The general information section allows you enter the following information: Schedule Name Description Run Type Active Schedule Type Format (if Url List Email Report chosen) This is the name you would like to give this schedule. (required) This allows for a short description of this schedule. The options are Recurring Schedule or Single Run Schedule. This is the option to turn the schedule active or inactive. This indicates the type of report schedule you would like to create. Report schedule types are described above. Daily report schedules allow you to email the autogenerated reports to specified email addresses while custom report schedules allow for the generation of custom reports on a schedule. You may also choose Url List Email Report Schedule. This is the format in which the URL list will be emailed. Options are Html and Tab Separated Values TSV. Rev 6.0.23.25: December 17, 2013 Page 47 of 103 Rev 6.0.23.25: December 17, 2013 Page 48 of 103 Figure 38 - Create a Report Schedule 1.4.5.5.2 Daily Report Email Schedule Settings The options available for the daily report email schedule differ from the custom daily report. The daily report email schedule occurs once daily. You must specify email settings and the time you would like to have the daily report schedule processed. Daily report email schedules will contain information for the current day up to the time selected. 1.4.5.5.2.1 Report Schedule Email Settings This section allows you to enter the details of where you would like to have the email sent to when it is ready. You can include a custom message in the email message body to create specialized reports. 1.4.5.5.2.1.1 Email Message Information Enter the email information including the recipient, sender, cc, bcc, subject, and message body. This will send the email to another person which looks like it comes from you with a personalized message. 1.4.5.5.2.1.2 Report Contact Information This information shows up on the cover page of the Emailed PDF Report. Enter the Name, Company Name, Address, City, State, Zip, Email, Phone and Fax. 1.4.5.5.2.1.3 Report Custom Introduction and Conclusion This information shows up on the second page for the introduction and the last page which is the conclusion. Enter a custom introduction and a custom conclusion. 1.4.5.5.2.1.4 Additional Information This information shows who the report was prepared by, add a logo, and who it was prepared for. This allows you to customize the report to show that you were the one who prepared it and who it was prepared for. The Logo URL allows you to add a link to an image (.gif or .jpg) to the cover page of the iBoss Report. 1.4.5.5.2.1.5 Report Type This allows you to choose which type of report to send. There are four options to choose from: Executive, I.T., Full, and Custom. The Executive report has the least information in the report but is used for a quick overview. The I.T. Report show more information such as IP statistics, Port statistics, Application Statistics, and Bandwidth statistics. The Full Report shows all of the contained data. The Custom Report allows you to choose which you may choose which options to include in the report. Rev 6.0.23.25: December 17, 2013 Page 49 of 103 1.4.5.5.3 Custom Generated Report Schedule Settings The custom report schedule settings involve configuring extra parameters in addition to those for the daily report schedule settings. The custom report schedule will generate a new report on the schedule (unlike the daily report email schedule). 1.4.5.5.3.1 General Settings The general information section allows you enter the following information: Schedule Name This is the name you would like to give this schedule. This allows for a short description of this schedule. This indicates the type of report schedule you would like to create. Report schedule types are described above. Daily report schedules allow you to email the autogenerated reports to specified email addresses while custom report schedules allow for the generation of custom reports on a schedule. Description Schedule Type 1.4.5.5.3.2 Statistics This section allows you to configure which statistics you would like in the custom generated report. The following are statistic options: Web Stats Port Stats (More Logging) IP Stats (More Logging) Bandwidth Stats Application Stats (More Logging) Web stats include statistics relating to web browsing activity. This includes top visited domains, top blocked domains, websites visited, and website category statistics. Port Stats include statistics relating to TCP and UDP port usage on the network. This includes top used ports, top blocked ports, etc. IP Stats include statistics relating to IP traffic on the network. This includes top accessed IP Addresses, top blocked IP Addresses, etc. Bandwidth Stats include statistics relating to general bandwidth usage such as overall, downstream and upstream usage. Application Stats include statistics specific to applications used on the network. Note: Selecting More Performance or External Report Manager from within the iBoss Report Settings will only report Web and Bandwidth Statistics. 1.4.5.5.3.3 Email Settings Rev 6.0.23.25: December 17, 2013 Page 50 of 103 The email settings allow you to configure options relating to the emailing of the generated report. The following describes the settings in this section. This is the email address where you would like the report sent to. You can use a semicolon between email addresses to add multiple recipients. This allows for an email carbon copy to be sent to another recipient. This allows for an email blank carbon copy to be sent to another recipient. This allows you to customize the body of the email message. If this option is enabled, the generated report will automatically be deleted once the report is emailed. This can be used to save disk space and to reduce the number of used generated reports. Email Report To Email CC Email BCC Email Message Body Auto-delete after report is sent 1.4.5.5.3.4 Report Schedule Time This section allows you to configure what time you would like the report schedule to run and the email report sent. There are several options for this section. You can choose to have the report sent daily at a specified time, weekly at a specified time, or on a specific day of the month at a specified time. Select the appropriate option and configure the time you would like to have this report generated and emailed. 1.4.5.5.3.5 Users This section allows you to select which user groups will be included in the report. All users inside the selected groups will be included in the generated report. The *Other group contains miscellaneous traffic that might not have been identified on the network. 1.4.5.5.3.6 Create the Report Schedule When you are done configuring the options for the report, click on the “Create Schedule” button on the bottom of the page. This will return you to the report schedules overview page. This page will show the next processing time for the report schedule. Rev 6.0.23.25: December 17, 2013 Page 51 of 103 1.4.6 Automatic Desktop Monitor/Control/Record (DMCR) This is an add-on feature to the iBoss. This section contains the setup the DMCR feature on the iBoss with the computers on your network. The recording, viewing and controlling of desktops is done by integrating with VNC. VNC (Virtual Network Computing) is a desktop sharing application that allows remote access to another computer. There are many programs that are available that offer VNC and is compatible with Mac, Windows, and Linux. We recommend using UltraVNC (uvnc.com). 1.4.6.1 Installing VNC Once you have downloaded and installed the VNC program on the computer, you will need to configure it. If you already have it installed and setup, you will need to know the port number and password that are in the settings for the VNC program on the computer. If you are first setting it up, you may start the VNC server program and go to the Admin Properties. This will allow you to configure the port, password, and other settings of the VNC program. Please keep the settings you set for this program handy as you will need it to register the computer to the iBoss DMCR feature. Uncheck the options for removing the wallpaper. For Multi viewer connections, select Keep existing connections and check the Allow Loopback Connections. Here is an example of recommended settings: Figure 39 - UVNC Properties 1.4.6.2 Registering a Computer to DMCR To register a computer to the DMCR feature, you will need to identify the computer through the iBoss. Please refer to the Identifying Computers section for more information. There will be 3 additional settings that are present when identifying computers; Enable/Disable VNC Rev 6.0.23.25: December 17, 2013 Page 52 of 103 integration, VNC password, and VNC port. Enter these settings for the computer that you are identifying. Once you have identified this computer and enabled these settings, the computer will show up under the Video Desktop section of the reports. 1.4.6.3 Video Desktop Figure 40 - Video Desktop Monitoring This section will show you all the computers that are identified with the DMCR feature enabled. You will be able to manually Record, Control and View the desktops straight from this screen. 1.4.6.3.1 Live Desktop MultiView Rev 6.0.23.25: December 17, 2013 Page 53 of 103 Figure 41 - Live Desktop MultiView This option allows you to select multiple computers and view up to 10 different screens simultaneously. Select the computers you want to view and click the “Live Desktop MultiView”. When viewing the desktops, you may click the Fullscreen button under any of the windows to just view one desktop. 1.4.6.4 Video Desktop Recordings This section will store all of the desktop recordings. All of the recordings are saved as .swf (Adobe Flash) files. In this section, you may delete, download, or play the recording. Since they are .swf files, you may view them in any standard web browser (with the flash plugin). 1.4.6.5 Recording Thresholds Recording thresholds can be set to start recording a user’s desktop automatically once a certain violation threshold is reached. For example, if a user goes to an Adult site 5 times within a minute, it will start recording their desktop for 1 minute. These settings can be configured within the iBoss interface, under the Report Settings in Preferences. Please refer to the Video Desktop Recording Settings section for more information. Rev 6.0.23.25: December 17, 2013 Page 54 of 103 1.4.7 Settings This section holds several sub-sections for settings. 1.4.7.1 General This section contains settings used globally for the report manager which include email server settings and other configurable options. Before any email report can be sent via email, the email server settings must be configured. Rev 6.0.23.25: December 17, 2013 Page 55 of 103 Rev 6.0.23.25: December 17, 2013 Page 56 of 103 Rev 6.0.23.25: December 17, 2013 Page 57 of 103 Figure 42 - Report Manager Settings 1.4.7.1.1 Email Server Settings This section allows you to configure the SMTP server you would like the iBoss to use in order to send email reports. SMTP Server Address SMTP Server Port Requires Login Username Password Test Email Address This is the domain or IP Address of the SMTP mail server you would like to use. This is the port used to send outgoing mail from your SMTP server. If your server requires a username and password, set this option to Yes. This is the username for servers that require login. If the “Requires Login” option is set to false, you can leave this option blank. This is the password of the user for servers that require login. This allows you to test the email settings. Enter a valid email address and click test. Rev 6.0.23.25: December 17, 2013 Page 58 of 103 This will send a test email to the address provided. 1.4.7.1.2 System Domain Name This area allows you to set the domain name of the reporter. 1.4.7.1.3 External Display Real-Time Network Health Integration These settings allow you to configure the Real-Time Network health Display. This display shows the locations and bandwidth for a filter without having to log in to the reporter. Enabled Security Key Enables the feature This is the security key that is shared with the filter. Controls how often the display scrolls These IP addresses are the only ones allowed to use this service. This drop down displays all of the filters attached to the reporter. Only one can be selected at a time. Scroll Interval Allowed IP Addresses Integrate With 1.4.7.1.4 IBoss MobileEther MDM Integration This section controls the link between the reporter and the MobileEther MDM system. This section controls, not only data reporting for the MDM system, but also integration with directory services and synchronization of filter settings. Please refer to the iBoss MobilEther MDM guide for more details. Integration Enabled Security Key Encryption Key MDM MobileEther Public IP(s) iBoss SWG Settings Sync IP Addresses iBoss SWG Settings Sync Port Cloud Reporting Port Cloud Reporting Key Enables the feature. This security key is shared with the MDM unit. This key is also shared with the MDM unit. 64 Hex characters IP addresses of the MDM systems integrated with this reporter. Filters that are associated with this reporter and MDM for filter settings sync. Port used for sync. 8080 by default. Port used to integrate with MDM. 8095 by default. Key associated with MDM. 1.4.7.1.5 IBoss Cloud Virus/Malware Integration Rev 6.0.23.25: December 17, 2013 Page 59 of 103 This section details the settings for integration with Cloud Antivirus/malware protection. Please refer to the iBoss Cloud Antivirus/Malware manual for more information. Enabled Cloud Host Enables the feature IP address of the Cloud hosting the antivirus service. Key to link to the local program. Key Linking the reporter and cloud. API Key Security Key 1.4.7.1.6 Report Manager Database Settings Figure 43 - Report Manager Database Settings This section allows you to configure the Enterprise Reporter Database Settings for the iBoss to report to. Report Database Password - The default Password is ibossdb. This can be left by default as the Enterprise Reporter will only allow connections from registered iBoss units however, it is recommended to change this password. Keep this password handy as you will need it to register iBoss units to it. Pudsus Url – This is the URL where the iBoss Enterprise Reporter gets its updates from. Do not change this URL unless told to do so by a Phantom Technologies Technician. This may cause the Enterprise Reporter to function improperly if changed. Browse Time Sensitivity – This option is for the time usage statistics of how long a URL is counted as being viewed after first accessed. This is only if there is no more traffic after hitting a website as it limits to this amount in seconds. Remote Diagnostics – This option allows you to enable Remote Diagnostics for a Phantom Technologies technician to assist you remotely. 1.4.7.1.7 SNMP Settings This area configures the SNMP settings. Enabling, the Community and the Allowed Query Subnet are included. 1.4.7.1.8 Report Maintenance Settings These settings allow you to configure the maintenance options for the report manager. Maintenance occurs once per day. Rev 6.0.23.25: December 17, 2013 Page 60 of 103 Perform Maintenance At Maximum time to perform maintenance Hold Logs Before Deleting Max URL Log Partition Size Max Total URL Log Size Max Bandwidth Partition Size Max Total Bandwidth Log Size Shrink Database By % when full Automated Log Rolling Schedule This is the time you would like maintenance to occur. Configure this option for a time when the network has the lightest load. This option allows you to limit the maximum maintenance time. Although maintenance may not take too long to complete, if the report manager is shrinking the database or performing other intensive routines, maintenance may take a long time to complete. It is important that the iBoss is given enough time to complete all of its tasks. The Unlimited option is recommended. When it becomes time to delete data, the reporter can hold-off from deleting the URL logs for the specified number of days. The logs will be marked for deletion. 0 deletes the table immediately as needed. This option is the maximum size of the URL Log size before rolling into another table. Smaller values will increase performance and will generate more tables. This option is the maximum size of all URL logs combined can occupy in the database. Smaller values will increase the amount of time the daily reports will be stored in the database, as more space will be available for reports vs. URL logs. This option is the maximum size of the Bandwidth Log the bandwidth partition tables before rolling into a new table. This option is the maximum size of all bandwidth logs combined can occupy in the database. Smaller values will increase the amount of time the daily reports will be stored in the database, as more space will be available for reports vs. URL logs. The percentage of the database size that will decrease when full. This option allows you to set a schedule for the Logs to be rolled into a different log. This will make archives in different sections to be able to backup later. You can set it to disabled, daily, weekly or monthly. 1.4.7.1.9 Backup To Network Share These settings allow you to configure the maintenance options for the report manager. Maintenance occurs once per day. Backup Logs To Share When Deleted This option allows you to enable the URL log archives to be backed up to a shared folder before it is deleted. Rev 6.0.23.25: December 17, 2013 Page 61 of 103 SMB Folder Name SMB User Name SMB Password SMB User Domain Reports Backup Alerts Emails This option allows you to the full path of the backup share folder. You may need to include the IP address in the address. This option is for the username used for the backup share folder to be able to connect to it. This option is for the password for the username used for the backup shared folder. By default may be blank but you may set this to your servers NetBIOS name. This option allows you to send email alerts when backups are made. 1.4.7.1.10 LDAP Settings This section enables integration with directory services for the purposes of both user login and integration with MDM. LDAP Enabled Host/IP Port Admin Username Admin Password Search Base Common Name Key Match Type Group Key Group Match Sub Key Email Key Enables the service This is the domain or IP address of the LDAP server. Example: iphantom.com or 10.0.0.1 This allows you to change the port number that is used to communicate to your LDAP server. Port 389 is most common and is recommended. This is the Username of an administrative or root user which has administrative rights to your LDAP server. The user must be able to perform searches on your LDAP server. This user is used to look up user logins. Example: [email protected]. This is the password to your LDAP administrator user above. Some special characters are not accepted. This is the base by which searches for users will be made. If you have a large directory you may choose a base other than the top as long as all users that need to be authenticated are under this base. It is recommended that you set this to the top of your LDAP directory. Example: If your LDAP domain is iphantom.com, you would use the following settings: dc=iphantom,dc=com ‘cn’ by default. LDAP can match by group name or OU or both. Within LDAP, this string is used for group matching. In AD it is ‘memberOf’. In AD this is ‘CN’. Key for using an e-mail address with LDAP. Rev 6.0.23.25: December 17, 2013 Page 62 of 103 In AD this is ‘userPrincipalName’. If ‘User DN’ is included within the ‘Match Group Source’ option then this key is used to parse the User DN. Active Directory Example: OU This is the filter that is used to search for a username in the LDAP server. This filter must result in a single user record. The filter must also contain %s which will be replaced by the username. There must not be any other percent signs in the search filter. Active Directory Example: (sAMAccountName=%s) DN Match Sub Key User Search Filter Once you have finished entering information, click the Test button. This saves the information as well as tests the information against the LDAP server. 1.4.7.1.11 Additional Settings This setting allows you to configure the email address used for sending Email Alerts to. Default Delegated Reporting Group Contains Overall Report iBoss SWG Intrusion/Malware Present iBoss SWG Cache Antivirus Present Admin Interface Session Timeout Browse Time Timeout Process Trending Stats Current Activity URL Refresh Remote Data API Port Remote Data Connect Timeout Remote Data Read Timeout Current Activity Bandwidth Users Refresh This is the option which allows you to include all reporting groups for statistics on the current activity page. Activates Sync with iBoss IPS Activates Sync with Cache Antivirus Determines how long the Reporter interface remains logged in with no activity. Turns on and off the process that displays Trending statistics Determines how often the URL Activity on the Real Time Dashboard updates. Port for the Remote Data Service Connect Timeout setting for the Remote Data Service Read Timeout setting for the Remote Data Service How often the badwidth users refresh on the Real Time Dashboard 1.4.7.1.12 Real-Time Bandwidth Settings This area allows you to exclude IPs from the Real Time Bandwidth display, by single IP or range. 1.4.7.1.13 Real Time Map Settings Map Center Public Network IP Map Center Latitude Map Center Longitude External IP of the Reporter Latitude of the server location Longitude of the server location Rev 6.0.23.25: December 17, 2013 Page 63 of 103 1.4.7.2 Users Figure 44 - Report Users This section allows you to add/edit users that can log into the Enterprise Reporter. The default user is “admin” which has no password by default. It is recommended to click “Edit” and set a password for the Administrator. To add a user, click Add Report User Rev 6.0.23.25: December 17, 2013 Page 64 of 103 1.4.7.2.1 Add Report User Figure 45 - Add Report Manager User To add a user, enter the Username, First Name, Last Name, and Password. Then select which sections of the report the user can access. The options to choose from are Can Generate Reports, Can Delete Reports, Can Access Report Settings, Can Access Report System Info, Can Access Report Current Activity, Can Access Report Schedules, and Can Access Live Desktop. After you are done settings all of the settings, click Save. To add an LDAP Group, first configure the LDAP settings on the General page, then select LDAP Group in the dropdown. Rev 6.0.23.25: December 17, 2013 Page 65 of 103 Figure 46 – LDAP User config All other options remain the same except for the name of the group or OU you want to give report access to. 1.4.7.3 Report Groups Figure 47 - Report Groups Rev 6.0.23.25: December 17, 2013 Page 66 of 103 This section allows you to add/edit Reporting Groups that can log users into separate groups. The Report Users can then be assigned to see just these reporting groups. These delegated admins of the reports will only see the reporting groups assigned to them. The default group is “Default Group” and is group # 0. When making a user part of a different reporting group, the user would then be taken out of Default Group # 0 and put into the new reporting group. To add a reporting group, click Add Reporting Group 1.4.7.3.1 Add Reporting Group Figure 48 - Add Reporting Group To add a reporting group, put the group number and group name. If it is a cloud filter, include the Group Cloud Reporting Key. After you are done settings all of the settings, click Save. 1.4.7.4 Log Archives This section holds the logs for URLs, Bandwidth and IPS. Rev 6.0.23.25: December 17, 2013 Page 67 of 103 1.4.7.4.1 URL Log Archives Figure 49 - Manage URL Log Archives This section allows you manage the URL logs. You may Roll URL logs into archives. This allows you to bunch URLs and then back them up or delete them. You may also setup a Backup Share under the General Settings to have the URL Log archives backed up to. With Backup Share folder setup on the General Settings, the list of backed up URL Log archives will be displayed. If the Backup Share has not yet connected, it may take a couple minutes for this page to load as it is establishing a connection to the backup share. Rev 6.0.23.25: December 17, 2013 Page 68 of 103 1.4.7.4.2 Bandwidth Log Archives Figure 50 - Manage Bandwidth Log Archives This section allows you manage the Bandwidth logs. You may Roll Bandwidth logs into archives. This allows you to bunch bandwidth statistics and then back them up or delete them. You may also setup a Backup Share under the General Settings to have the Log archives backed up to. With Backup Share folder setup on the General Settings, the list of backed up Bandwidth Log archives will be displayed. If the Backup Share has not yet connected, it may take a couple minutes for this page to load as it is establishing a connection to the backup share. 1.4.7.4.3 IPS Logs Figure 51 – IPS Logs This section allows you manage the IPS logs. You may Roll IPS logs into archives. This allows you to bunch bandwidth statistics and then back them up or delete them. Rev 6.0.23.25: December 17, 2013 Page 69 of 103 You may also setup a Backup Share under the General Settings to have the Log archives backed up to. With Backup Share folder setup on the General Settings, the list of backed up Bandwidth Log archives will be displayed. If the Backup Share has not yet connected, it may take a couple minutes for this page to load as it is establishing a connection to the backup share. 1.4.7.5 Register Gateways Figure 52 - Register iBoss Devices This section allows you to add/edit/remove iBoss Devices to log to the external Report Manager. You will need to register any iBoss devices that you wish to have reporting to the external report manager. To add an iBoss Device, click Add Device. 1.4.7.5.1 Register Gateway Rev 6.0.23.25: December 17, 2013 Page 70 of 103 Figure 53 - Register Gateway To add an iBoss Device, enter the iBoss Device Name, Device IP Address, Description, and Security key. You may change the security key to a 32 hex digit key. Please keep this key handy as you will need it when registering the iBoss settings to point to the external report manager. Please refer to the Report Settings of the iBoss Interface for instructions on how to configure the External Report Manager Settings. Rev 6.0.23.25: December 17, 2013 Page 71 of 103 1.4.7.6 Time Figure 54 - Configure Time This section allows you to set the time zone and time for the external report manager. After changing the correct time zone, click Save. The iBoss Enterprise Reporter will need to reboot after saving. In addition, if you have a local NTP server, you can use that instead of the national time server. 1.4.7.7 Network Settings Figure 55 - Configure IP Address Settings This section allows you to set the network settings for the external report manager. You may set the IP address, Subnet Mask, Gateway, DNS 1, and DNS 2. After entering the settings, click Save. The iBoss Enterprise Reporter will need to reboot after saving. Rev 6.0.23.25: December 17, 2013 Page 72 of 103 Default iBoss Enterprise Reporter IP Address Settings IP Address Subnet Mask Gateway DNS 1 DNS 2 192.168.1.20 255.255.255.0 192.168.1.1 192.168.1.1 0.0.0.0 You may set these settings through the serial console. Please refer to the serial console settings in the iBoss serial console section. 1.4.7.8 SSL This area allows you to upload certificates for the reporter. 1.4.7.9 Subscription Figure 56 - Subscription This section allows you to enter the subscription key. You may click Edit to enter the key. Once you enter the key click Edit to save the key and then Confirm. The report manager will need to be connected to the Internet to be able to confirm this key. Please make sure it is plugged into the network to be able to verify the subscription key. Note: The report manager will not process log data and will not fully function if your subscription is not active. Rev 6.0.23.25: December 17, 2013 Page 73 of 103 1.4.8 Report Manager System Information This section contains system information pertaining to the iBoss. This includes the system log, the system uptime, and the database size. From this page, you can view and clear the system event log. In addition, you can view how much disk space the report manager is consuming and how much disk space is available. When the maximum is reached, the database will automatically shrink on the maintenance interval. Figure 57 – System Info 1.5 Viewing Reports You may view reports by clicking on the report you wish to view from the “View Reports” section of the report manager. When you click on the report, you will be taken to the web statistics section of the report. Most of the items within the report manager are “clickable”. The report manager allows deep drilldown functionality to provide very detailed information very easily. Rev 6.0.23.25: December 17, 2013 Page 74 of 103 1.5.1 Report Information Section When viewing any of the report pages, the report information section will be visible at the top of the page. This section gives you information regarding the current report and allows you to switch between reports easily. Figure 58 - Report Information Section The report information bar contains the name of the report, as well as the date range that this report covers. 1.5.1.1 Showing Report Information for Particular Users Under the option “User”, you have the capability of entering in which users to show the report for. If nothing is typed into the text box, the information in the report pages you are viewing will contain information regarding all users in the report. If you would like to view information for a particular user in the report, type the username in or click the “Find” button. You can then enter part of the user’s name and click find, this will populate the list of usernames. You can then click select next to the username and then “Done” button once you’re finished. Next, click the “Apply” button to show. Once a user is selected, all statistics on the page pertain to the particular user. Rev 6.0.23.25: December 17, 2013 Page 75 of 103 Figure 59 – Find User Regardless of whether you have all users selected or a particular user, the information presented will look the same and is consistent. The only thing that changes is the information on the page, not the structure. 1.5.1.2 Quickly switching between reports The top right section of the report information bar has a drop down list which allows you to quickly switch between reports. Simply select a report from the drop down list and the current report page will be updated with the information from the newly selected report. This is useful for comparing information between two or more reports. 1.5.2 Web Usage Statistics This section contains information related to web browsing. This includes websites visited, top visited domains, top blocked domains, web category usage as well as other statistics. As stated above, most of the items are clickable and can be drilled down for more detail. Figure 60 - Web Usage Statistics Rev 6.0.23.25: December 17, 2013 Page 76 of 103 1.5.2.1 Web Hit Trends This section shows web hit trends for the current report over time. It displays both Hit Count and Block Count. You can click and drag to zoom into a more specific time. Figure 61 – Web Hit Trends 1.5.2.2 Web Hits By Category This section shows overall web category usage by hits. It displays both total accesses and blocked accesses relative to each other. You can double-click on any of these bars to drilldown and get more detail about the particular category usage. Rev 6.0.23.25: December 17, 2013 Page 77 of 103 Figure 62 – Web Hits by Category 1.5.2.2.1 Web Category Detail If you click on the bar for a particular web category, you are taken to a detail page showing information pertaining to that particular category. Rev 6.0.23.25: December 17, 2013 Page 78 of 103 Figure 63 - Web Category Detail Rev 6.0.23.25: December 17, 2013 Page 79 of 103 1.5.2.2.1.1 Hit and Block Category Detail Graph The Hit and Block Activity graph show the activity for the currently selected category. This will give you an indication of use throughout the report period for the category selected. Remember, the information reflected on this page and the graph, pertain to either the currently selected user or all users if that option is selected in the report information section at the top. 1.5.2.2.1.2 Top Users for Web Category This section lists the top users for the selected category. Users are ordered by highest hit count first. Click on the “More” button to get a full list of users for this category. The full list can be sorted by a variety of parameters. 1.5.2.2.1.3 Last Visited Sites This section lists the sites in recent order of this web category. 1.5.2.3 Time Use By Category This section shows you the top categories based on time usage. This will also show you in Hours, Minutes, and seconds of the amount of time spent on each category. You may press the expand button to see the Top 5 Users for a specific category. Rev 6.0.23.25: December 17, 2013 Page 80 of 103 Figure 64 - Time Use By Category Rev 6.0.23.25: December 17, 2013 Page 81 of 103 1.5.2.4 Top Visited Domains This section lists the top visited domains as well as the top blocked domains. You get a full list of domains with the ability to sort by a variety of parameters by clicking on the “More” button. Figure 65 – Top Visited Domains 1.5.2.5 Top Blocked Domain This section lists the top visited domains as well as the top blocked domains. You get a full list of domains with the ability to sort by a variety of parameters by clicking on the “More” button. Rev 6.0.23.25: December 17, 2013 Page 82 of 103 Figure 66 – Top Blocked Domains 1.5.2.6 Top Users By Category Time Use This section lists categories and allows you to expand to show the top five users for each category by time use. You may click the More button to show all users for a specific web category. Note: If a User is selected, this field will not show. Rev 6.0.23.25: December 17, 2013 Page 83 of 103 Rev 6.0.23.25: December 17, 2013 Page 84 of 103 Figure 67 – Top Users by Category Time Use 1.5.2.7 Top Users By Category Web Hits This section lists categories and allows you to expand to show the top five users for each category by web hits. You may click the More button to show all users for a specific web category. Note: If a User is selected, this field will not show. Rev 6.0.23.25: December 17, 2013 Page 85 of 103 Figure 68 – Top Users by Category Web Hits Rev 6.0.23.25: December 17, 2013 Page 86 of 103 1.5.2.8 Top Users By Overall Web Hits This section lists the top five users by overall web hits. You may click the More button to show all users listed by web hits. Figure 69 - Top Users By Overall Web Hits Rev 6.0.23.25: December 17, 2013 Page 87 of 103 1.5.2.9 Top Users By Overall Time Use This section lists the top five users by overall time use. You may click the More button to show all users listed by over time use. Figure 70 - Top Users by Overall Time Use Rev 6.0.23.25: December 17, 2013 Page 88 of 103 1.5.2.10 Top Blocked Users This section lists the top five blocked users. You may click the More button to show all users listed by block count. Figure 71 – Top Blocked Users Rev 6.0.23.25: December 17, 2013 Page 89 of 103 1.5.2.11 Trending Now This section details the top searches on your network. The “More” button brings up a full list of search terms. Figure 72 – Trending Now Rev 6.0.23.25: December 17, 2013 Page 90 of 103 1.5.2.12 Suspicious This section lists searches that match words on the Suspicious word list. The “Edit Words” button opens the list for editing. Figure 73 – Suspicious Rev 6.0.23.25: December 17, 2013 Page 91 of 103 1.5.2.13 Liability This section lists searches that match words on the Liability word list. The “Edit Words” button opens the list for editing. Figure 74 – Liability Rev 6.0.23.25: December 17, 2013 Page 92 of 103 1.5.2.14 Filter Avoidance This section lists searches that match words on the Filter Avoidance word list. The “Edit Words” button opens the list for editing. Figure 75 – Filter Avoidance Rev 6.0.23.25: December 17, 2013 Page 93 of 103 1.5.3 Bandwidth Statistics The Bandwidth statistic section provides information regarding general bandwidth usages from your network. General bandwidth includes overall, downstream and upstream usage. 1.5.3.1 Graph This graph shows the total bandwidth activity throughout the report period. Figure 76- Graph Rev 6.0.23.25: December 17, 2013 Page 94 of 103 1.5.3.2 Top Overall Users This graph shows the top 5 bandwidth users. Clicking the MORE button gives a complete list. Figure 77 – Top Bandwidth Users Rev 6.0.23.25: December 17, 2013 Page 95 of 103 1.5.3.3 Top Downstream Users This graph shows the top 5 downstream bandwidth users. Clicking the MORE button gives a complete list. Figure 78 – Top Downstream Users Rev 6.0.23.25: December 17, 2013 Page 96 of 103 1.5.3.4 Top Upstream Users This graph shows the top 5 upstream bandwidth users. Clicking the MORE button gives a complete list. Figure 79 – Top Upstream Users Rev 6.0.23.25: December 17, 2013 Page 97 of 103 1.5.3.5 Domains This section contains the top five domains by bandwidth usage. You may click the More button for a full list. Figure 80 – Domains Rev 6.0.23.25: December 17, 2013 Page 98 of 103 1.5.4 Threats & Malware The Threats & Malware section provides information from IPS units that are attached to the Reporter. Please refer to the IPS Guide for more information. 1.5.4.1 Top Overall Threats This section contains the top overall threats as determined by the IPS. You may click the More button for a full list. Figure 81 – Top Overall Threats Rev 6.0.23.25: December 17, 2013 Page 99 of 103 1.5.4.2 Top Outbound Threats This section contains the top outbound threats as determined by the IPS. You may click the More button for a full list. Figure 82 – Top Outbound Threats Rev 6.0.23.25: December 17, 2013 Page 100 of 103 1.5.4.3 Top Inbound Threats This section contains the top inbound threats as determined by the IPS. You may click the More button for a full list. Figure 83 – Top Inbound Threats Rev 6.0.23.25: December 17, 2013 Page 101 of 103 1.5.4.4 Top User by Threats This section contains the top users by threats as determined by the IPS. You may click the More button for a full list. Figure 84 – Top Users by Threats Rev 6.0.23.25: December 17, 2013 Page 102 of 103 2 REGULATORY STATEMENT FCC This equipment has been tested and found to comply with the limits for a Class B digital device, pursuant to Part 15 of FCC rules. CE This equipment has been tested and found to comply with the limits of the European Council Directive on the approximation of the law of the member states relating to electromagnetic compatibility (89/336/EEC) according to EN 55022 Class B. FCC and CE Compliance Statement This device complies with Part 15 of the FCC Rules. Operation is subject to the following two conditions: (1) this device may not cause harmful interference, and (2) this device must accept any interference received, including interference that may cause undesired operation. Any changes or modifications not expressly approved by the party responsible for compliance could void the authority to operate equipment. Safety This equipment is designed with the utmost care for the safety of those who install and use it. However, special attention must be paid to the dangers of electric shock and static electricity when working with electrical equipment. Rev 6.0.23.25: December 17, 2013 Page 103 of 103