1
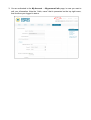
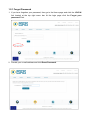
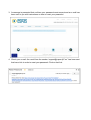
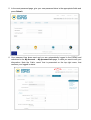
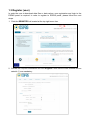
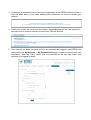
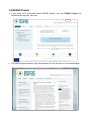
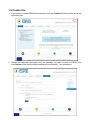
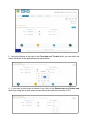
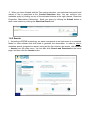
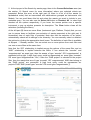
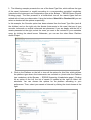
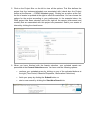
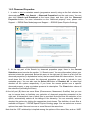
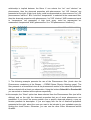
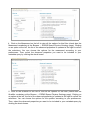
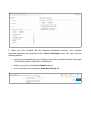
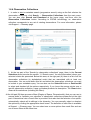
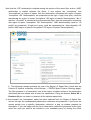
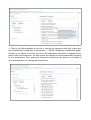
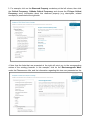
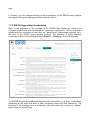
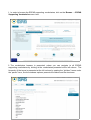
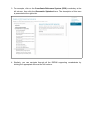
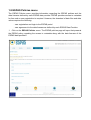
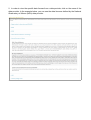
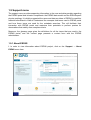
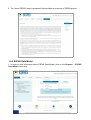
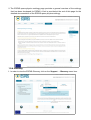
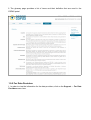
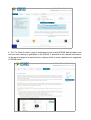
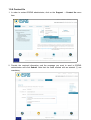
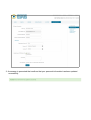
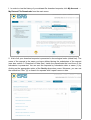
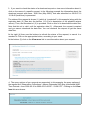
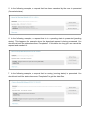
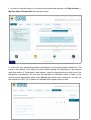
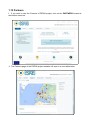
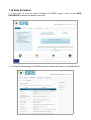
ESPAS User's Manual July 2015 Contents Table of Contents Contents...............................................................................................................................................2 1. ESPAS Portal....................................................................................................................................3 1.1 Home page...........................................................................................................................4 1.2 Log in...................................................................................................................................5 1.2.1 Forgot Password......................................................................................................7 1.3 Register (user)....................................................................................................................10 1.4 ESPAS Project....................................................................................................................12 1.5 Contact Us..........................................................................................................................13 1.6 Search menu.......................................................................................................................15 1.6.1 Time Period............................................................................................................17 1.6.2 Assets.....................................................................................................................19 1.6.3 Observed Properties...............................................................................................23 1.6.4 Observation Collections.........................................................................................27 1.6.5 Time/Location........................................................................................................32 1.7 Browse menu......................................................................................................................33 1.7.1 ESPAS Metadata....................................................................................................33 1.7.2 ESPAS Space Physics Ontology............................................................................37 1.7.3 ESPAS Supporting Vocabularies...........................................................................40 1.8 ESPAS Policies menu.........................................................................................................43 1.9 Support menu.....................................................................................................................45 1.9.1 About ESPAS.........................................................................................................45 1.9.2 ESPAS Data Model................................................................................................46 1.9.3 ESPAS Space Physics Ontology............................................................................47 1.9.4 Glossary.................................................................................................................48 1.9.5 For Data Providers.................................................................................................49 1.9.6 Contact Us.............................................................................................................51 1.10 My Account menu............................................................................................................53 1.10.1 My Personal Information.....................................................................................53 1.10.2 My Dataset File Downloads................................................................................55 1.10.3 My Data Values Downloads................................................................................59 1.11 News.................................................................................................................................65 1.12 Events...............................................................................................................................66 1.13 Partners.............................................................................................................................67 1.14 Data Providers..................................................................................................................68 2. Metadata Search............................................................................................................................69 2.1 Progressive Search.............................................................................................................69 2.3 Time/Location Search........................................................................................................69 3. Download of Data Files.................................................................................................................69 4. Download of Data Values..............................................................................................................69 1. ESPAS Portal The ESPAS Portal has been developed in the framework of the ESPAS project (http://www.espas-fp7.eu/) and is available at the following url address: https://www.espas-fp7.eu/portal/index.html ESPAS is a data e-infrastructure facilitating access to observations and model predictions of the near-Earth space environment, a region extending from the Earth's atmosphere up to the outer radiation belts. Through the ESPAS portal the user can have access to a large number of repositories with heterogeneous data from ground and space, in situ and remote sensors. The user can perform searches for observations using specific criteria (e.g. time, instrument) and then (s)he can download data files or data values. More precisely, the ESPAS portal provides the following services to the user: 1. Metadata search for observations that satisfy the following specific criteria: ◦ Time period: the time period when the observations were acquired ◦ Assets: the Instruments and Models that were used for the generation of the observations ◦ Observed properties: the observed properties that were measured in the observations ◦ Observation collections: the collections that the observations belong to ◦ Location: the location of the platforms (ground-based observatories or satellites) on which the instruments are mounted and used for the generation of the observations The metadata search is open to all users with no registration required. 2. Download of data files: The result of a metadata search is a list of the observation collections (that contain the observations) that satisfy the query criteria. Then, the user can proceed to download data files originating to the ESPAS data providers. The data files Note that user registration and login to ESPAS portal is required for this service. 3. Download of data values: The result of a metadata search is a list of the observation collections (that contain the observations) that satisfy the query criteria. Then, the user can request to download data values from specific observed properties, as extracted from the data files. A subset of the observed properties is available for download as extracted data values. After a data value download request, the user gets as a result a text file (in txt or XML format) that contains the values of the selected observed properties. Note that user registration and login to ESPAS portal is required for this service. ◦ Plot of the data values: After a data value download request, the user can view or download a plot that presents the values of the selected observed properties. All the data in ESPAS portal are provided by the ESPAS Data Providers. The ESPAS Data Providers are special users of the ESPAS portal that have some added functionalities comparing to a user of ESPAS (e.g. register metadata). This manual presents a description of the ESPAS portal and its functionalities with examples and screen shots for the user. 1.1 Home page The home page of the ESPAS Portal is presented below and consists of the following areas: 1. Top right menu: provides the links for the Login, Registration, the ESPAS project and Contact page. 2. Main menu: provides the links for the Search, Browse, ESPAS Policies, Support and My account pages 3. An overview of the ESPAS services 4. A link to the main Search and Download page 5. Data Providers: a link to the Manage Data Source page, Users: a link to the Support → For Data Providers 6. News and announcements area 7. A brief description of ESPAS portal 8. Bottom menu: provides links for the News, Events, Partners and Data Providers pages of ESPAS project website 1.2 Log in In order the user to download data files or data values, user login to the ESPAS portal is required. 1. Click the LOG IN link located at the top right menu bar. 2. Provide your credentials: email address and password, and click Login. 3. You are redirected to the My Account → My personal info page, in case you want to edit your information. Note the “Hello, name” that is presented on the top right menu, that confirms your logged in status. 1.2.1 Forgot Password 1. If you have forgotten your password, then go to the Home page and click the LOG IN link located at the top right menu bar. At the login page click the Forgot your password? link. 2. Provide your e-mail address and click Reset Password. 3. A message is presented that confirms your password reset request and an e-mail has been sent to you with instructions on how to reset your password. 4. Check your e-mail. An e-mail from the sender “[email protected]” has been sent that has a link in order to reset your password. Click on that link. 5. In the reset password page, give your new password twice in the appropriate fields and press Submit. 6. Your password has been reset and you are automatically logged in the ESPAS and redirected to the My Account → My personal info page, in case you want to edit your information. Note the “Hello, name” that is presented on the top right menu, that confirms your logged in status. 1.3 Register (user) In order the user to download data files or data values, user registration and login to the ESPAS portal is required. In order to register to ESPAS portal, please follow the next steps: 1. Click the REGISTER link located at the top right menu bar. 2. Provide the required information and click Register. Note that the fields marked with an asterisk (*) are mandatory. 3. A message is presented that confirms your registration to the ESPAS system and an email has been sent to your email address with instructions on how to activate your account. 4. Check your e-mail. An e-mail from the sender “[email protected]” has been sent that has a link in order to activate your account. Click on that link. 5. Your account has been activated and you are automatically logged in the ESPAS and redirected to the My Account → My Personal Info page, in case you want to edit your information. Note the “Hello, name” that is presented on the top right menu, that confirms your logged in status. 1.4 ESPAS Project 1. If you want more information about ESPAS Project, click the ESPAS Project link located at the top right menu bar. 2. The ESPAS project website (http://www.espas-fp7.eu/) will open in a new tab/window. 1.5 Contact Us 1. If you want to contact ESPAS administrator, click the Contact Us link located at the top right menu bar. 2. Provide the required information and the message you want to send to ESPAS and click Submit. Note that the fields marked with an asterisk (*) are mandatory. 3. A message is presented that confirms that your email was successfully sent to the ESPAS administrator. 1.6 Search menu ESPAS portals provides metadata searches for observations based on the following search criteria: Time period: the time period when the observations were acquired Assets: the instruments and models that were used for the generation of the observations Observed properties: the observed properties that were measured in the observations Observation collections: the collections that the observations belong to Location: the location of the platforms (ground-based observatories or satellites) on which the instruments are mounted and used for the generation of the observations The metadata search is open to all users with no registration required. In order to perform a query for observations, ESPAS portal supports the progressive search that helps you to construct a metadata search using criteria from: Time Period, Assets (instruments and/or models), Observed Properties and Observation Collections (please visit Support → ESPAS Data Model and ESPAS Space Physics Ontology for more explanation). You can start your query with any of these criteria by clicking one of the options of the search menu and then continue with any other to filter further your results. This means that at each step the available options that are presented are filtered by the previous selections. For example, if the Athens Digisonde has been selected in the Assets page, and then you click on the Observed Properties page, only the observed properties that are related with the Athens Digisonde instrument will be available for selection. You can submit your query at any stage of the progressive search. Moreover, the Assets, Observed Properties and Observation Collections search pages are enriched with some extra filters presented at the left that can be used to narrow down or facilitate your selection of the entities presented at the right. The definition of each filter is available at Support → Glossary section. You can select one or more options from each filter and use one or more filters at the same time. Note that the “OR” relationship is implied among the options of the same filter, and an “AND” relationship is implied between the filters. For example, in the Assets search page there are the filters: assets type, platform type and project. If one selects the sounder and magnetometer as asset type, then the assets of type sounder OR magnetometer are presented at the right. A high level query could be represented as: asset type=sounder OR asset type=magnetometer. But, if also the DIAS project is selected at the project filter, then the assets that are of type sounder OR magnetometer AND also belong to the DIAS project are presented. A high level query could be represented as: project=DIAS AND (asset type=sounder OR asset type=magnetometer)). At the top part of each of the Search pages there is the Current Selections area where the current selected criteria by the user are presented. For example, the time period from 2013-01-01 00:00 to 2013-31-01 23:59 UTC and the Athens Digisonde has been selected so far in the picture below. At the right there are the buttons (B) that link to the remaining search criteria in order to continue building your query. The buttons for the criteria that have already been selected are deactivated. Below these buttons, there is the Back button (C) that returns you in the previous selected criteria to refine your selection. But, note that in that case your selections for the current criterion will be lost. You can submit your query anytime by clicking the Submit button (D). If you want to start a new search, click the Start New Search link (E) below the Submit button. You can start a metadata query by selecting any of the criteria (time period, assets, observed properties, observation collections and time/location) using the Search menu (main menu) or by clicking the Seach and Download button at the home page. 1.6.1 Time Period 1. In order to start a metadata search (progressive search) using as the first criterion the time period, click Search → Time Period from the main menu. You can also click Search and Download at the home page, and then click the Time Period button. 2. At the top part of the Search by time period page, there is the Current Selections area (see the section 1.6 Search menu for more information) where your selected criteria are presented. Below this area, there are the From date, To date fields (A) to define your time period of interest in UTC timezone. Moreover, you can specify the subset of day in UTC (B) (this will apply for all days in the selected time period) by using the fields Subset start and Subset end. So, you can specify a time period of 1 st to 10th January 2014, but also a subset of day 10:00 to 12:00 (UTC). This selection will return the observations that were acquired between the times 10:00 and 12:00 in UTC for the days from 1 st to 10th January 2014. If you don't want to define any subset of day, leave the default values (00:00 to 23:59) for these fields. 3. Using the buttons at the right of the From date and To date fields, you can select the dates and times at the appropriate pop up windows. 4. If you want to define also a subset of day, click on the Subset start and Subset end fields and using the up and down arrows specify the start and end time (UTC). 5. When you have finished with the Time period selection, your selected time period and subset of day is presented at the Current Selections area. You can continue your metadata query by clicking on any of the activated buttons at the right (Assets, Observed Properties, Observation Collections), finish your query by clicking the Submit button or start a new search by clicking the Start New Search link. 1.6.2 Assets 1. According to ESPAS terminology, an asset corresponds to an Instrument or a numerical Model or other software that was used to generate the observation. In order to start a metadata search (progressive search) using as the first criterion the assets, click Search → Assets from the main menu. You can also click Search and Download at the home page, and then click the Assets button. 2. At the top part of the Search by assets page, there is the Current Selections area (see the section 1.6 Search menu for more information) where your selected criteria are presented. Below this area, at the right part (A) there is a list of all the assets (in alphabetical order) that are associated with observations grouped as Instruments and Models. You can scroll down this list and select the assets you want to include in your metadata query. You can also use the Select All button or Deselect All to select and deselect all the options respectively. If you hover the mouse pointer over a specific instrument, a pop up window presents its description. The Clear button clears all the selections (including the filters). At the left part (B) there are some filters (Instrument type, Platform, Project) that you can use to narrow down or facilitate your selection of assets presented at the right part. A hierarchical view of each filter is provided. Note also that the selection of an option, automatically selects all its siblings in the hierarchy. You can manually select or deselect the options by clicking the appropriate check boxes. The definition of each filter is available at Support → Glossary section. You can select one or more options from each filter and use one or more filters at the same time. Note that the “OR” relationship is implied among the options of the same filter, and an “AND” relationship is implied between the filters. If one selects the “sounder” and “magnetometer” as asset type, then the assets of type “sounder” OR “magnetometer” is presented at the right. A high level query could be represented as: asset type=”sounder” OR asset type=”magnetometer”. But, if also the “DIAS project” is selected at the project filter, then the assets that are of type “sounder” OR “magnetometer” AND also belong to the “DIAS project” are presented. A high level query could be represented as: project=”DIAS” AND (asset type=”sounder” OR asset type=”magnetometer”)). 3. The following example presents the use of the Asset Type filter, which defines the type of the asset (instrument or model) according to a corresponding controlled vocabulary (check also the Instrument and Computation type at the Browse → ESPAS Space Physics Ontology page). The filter presents in a hierarchical view all the assets types that are related with at least one observation. Using the buttons Select All or Deselect All you can select or deselect all the options respectively. In this example, the Sounder option has been selected from the Asset Type filter (and all the children) and on the right only the Assets (instruments in this case) that are of type sounder, ionosonde or vertical ionosonde are presented. If you are happy with the list of assets presented at the right, select the ones you want to be included in your metadata query by clicking the check boxes. Otherwise, you can use the other filters: Platform and/or Project. 4. Click on the Platform on the left to view all the options for this filter, which defines the platform type where the instruments are mounted on (check also the Platform type vocabulary at the Browse → ESPAS Supporting Vocabularies page). Clicking on an option at the left, the list of assets is updated at the right to reflect the selections. You can choose the options for the platform according to your preferences. Then, select your assets of interest by clicking the check boxes at the right. 5. Click on the Project filter on the left to view all the options. This filter defines the project that the instruments/models are associated with (check also the Project entries at the Browse → ESPAS Metadata page). Clicking on an option at the left, the list of assets is updated at the right to reflect the selections. You can choose the options for the project according to your preferences. In the example below, the DIAS project has been selected and at the right all the assets (instruments and models) that are associated with this project are presented. Select your assets of interest by clicking the check boxes. 6. When you have finished with the Assets selection, your selected assets are presented at the Current Selections area. You have now the following options: continue your metadata query by clicking on any of the activated buttons at the right (Time Period, Observed Properties, Observation Collections) finish your query by clicking the Submit button or start a new search by clicking the Start New Search link. 1.6.3 Observed Properties 1. In order to start a metadata search (progressive search) using as the first criterion the observed properties, click Search → Observed Properties from the main menu. You can also click Search and Download at the home page, and then click the Observed Properties button. For more information on the “observed property” term, please visit Support → ESPAS Data Model page and Support → ESPAS Space Physics Ontology. 2. At the top part of the Search by observed properties page, there is the Current Selections area (see also the section “1.6 Search menu” for more information) where your selected criteria are presented. Below this area, at the right part (A) there is a list of all the observed properties (in alphabetical order) that are associated with observations. You can scroll down this list and select the observed properties you want to include in your metadata query. You can also use the Select All button or Deselect All to select and deselect all the options respectively. If you hover the mouse pointer over a specific observed property, a pop up window presents its description. The Clear button clears all the selections (including the filters). At the left part (B) there are some filters (Phenomenon, Measurand, Qualifier) that you can use to narrow down or facilitate your selection of observed properties presented at the right part. A hierarchical view of each filter is provided. Note also that the selection of an option, automatically selects all its siblings in the hierarchy. You can manually select or deselect the options by clicking the appropriate check boxes. The definition of each filter is available at Support → ESPAS Space Physics Ontology page. You can select one or more options from each filter and use one or more filters at the same time. Note that the “OR” relationship is implied among the options of the same filter, and an “AND” relationship is implied between the filters. If one selects the “ion” and “electron” as phenomenon, then the observed properties with phenomenon “ion” OR “electron” are presented at the right. A high level query could be represented as: phenomenon=”ion” OR phenomenon=”electron”. But, if also the “temperature” is selected at the measurand filter, then the observed properties with phenomenon “ion” OR “electron” AND measurand equal to “temperature” are presented. A high level query could be represented as: measurand=“temperature” AND (phenomenon=”ion” OR phenomenon=”electron”)). 3. The following example presents the use of the Phenomenon filter (check also the Phenomenon vocabulary at the Browse → ESPAS Space Physics Ontology page). The filter presents in a hierarchical view all the phenomenon entries of the observed properties that are related with at least one observation. Using the buttons Select All or Deselect All you can select or deselect all the options respectively. In this example, the “Wave” option has been selected from the Phenomenon filter (and all its siblings) and on the right the observed properties that are of wave phenomenon are presented. If you hover the mouse pointer over a specific observed property, a pop up window presents its description. If you are happy with the list of observed properties presented at the right, select the ones you want to be included in your metadata query by clicking the check boxes. Otherwise, you can use the other filters: Measurand and/or Qualifier. 4. Click on the Measurand on the left to view all the options for this filter (check also the Measurand vocabulary at the Browse → ESPAS Space Physics Ontology page). Clicking on an option at the left, the list of the observed properties is updated at the right to reflect the selections. You can choose the options for the measurand according to your preferences. Then, select the observed properties you want to be included in your metadata query by clicking the check boxes. 5. Click on the Qualifier on the left to view all the options for this filter (check also the Qualifier vocabulary at the Browse → ESPAS Space Physics Ontology page). Clicking on an option at the left, the list of the observed properties is updated at the right to reflect the selections. You can choose the options for the qualifier according to your preferences. Then, select the observed properties you want to be included in your metadata query by clicking the check boxes. 6. When you have finished with the Observed Properties selection, your selected observed properties are presented at the Current Selections area. You have now the following options: continue your metadata query by clicking on any of the activated buttons at the right (Time Period, Assets, Observation Collections) finish your query by clicking the Submit button or start a new search by clicking the Start New Search link. 1.6.4 Observation Collections 1. In order to start a metadata search (progressive search) using as the first criterion the observation collections, click Search → Observation Collections from the main menu. You can also click Search and Download at the home page, and then click the Observation Collections button. According to ESPAS terminology, an observation collection corresponds to any set of existing observations. For more information, please visit Support → Glossary page. 2. At the top part of the “Search by observation collections” page, there is the Current Selections area (see also the section “1.6 Search menu” for more information) where your selected criteria are presented. Below this area, at the right part (A) there is a list of all the observation collections (in alphabetical order) that are associated with at least one observation. You can scroll down this list and select the observation collections you want to include in your metadata query. You can also use the Select All button or Deselect All to select and deselect all the options respectively. If you hover the mouse pointer over a specific observation collection, a pop up window presents its description. The Clear button clears all the selections (including the filters). At the left part (B) there are some filters (Region of Space, Dimensionality) that you can use to narrow down or facilitate your selection of observation collections presented at the right part. A hierarchical view of each filter is provided. Note also that the selection of an option, automatically selects all its siblings in the hierarchy. You can manually select or deselect the options by clicking the appropriate check boxes. The definition of each filter is available at Support → Glossary page. You can select one or more options from each filter and use one or more filters at the same time. Note that the “OR” relationship is implied among the options of the same filter, and an “AND” relationship is implied between the filters. If one selects the “ionosphere” and “thermosphere” as region of space, then the observation collections with region of space “ionosphere” OR “thermosphere” are presented at the right. A high level query could be represented as: region of space=”ionosphere” OR region of space=”thermosphere”. But, if also the “1D profile” is selected at the dimensionality filter, then the observation collections with region of space “ionosphere” OR “thermosphere” AND dimensionality equal to “1D profile” are presented. A high level query could be represented as: dimensionality=“1D profile” AND (region of space=”ionosphere” OR region of space=”thermosphere”)). 3. The following example presents the use of the Region of Space filter (check also the Feature Of Interest vocabulary at the Browse → ESPAS Space Physics Ontology page). The filter presents in a hierarchical view all the region of space entries of the observation collections that are related with at least one observation. Using the buttons Select All or Deselect All you can select or deselect all the options respectively. In this example, the “Ionosphere” option has been selected from the Region of Space filter and on the right the corresponding observation collections are presented. If you hover the mouse pointer over a specific observation collection, a pop up window presents its description. If you are happy with the list of observation collections presented at the right, select the ones you want to be included in your metadata query by clicking the check boxes. Otherwise, you can use the other filter: Dimensionality. 4. Click on the Dimensionality on the left to view all the options for this filter (check also the Dimensionality vocabulary at the Browse → ESPAS Supporting Vocabularies page). Clicking on an option at the left, the list of the observation collections is updated at the right to reflect the selections. You can choose the options for the dimensionality according to your preferences. Then, select the observation collections you want to be included in your metadata query by clicking the check boxes. 5. When you have finished with the selection of the observation collections, your selections are presented at the Current Selections area. You have now the following options: continue your metadata query by clicking on any of the activated buttons at the right (Time Period, Assets, Observed Properties) finish your query by clicking the Submit button or start a new search by clicking the Start New Search link. 1.6.5 Time/Location 1. In order to perform a metadata search using as criteria the time and location, click Search → Time/Location from the main menu. You can also click Search and Download at the home page, and then click the Location button under the Spatial/temporal search header. 1.7 Browse menu The Browse menu provides information regarding the ESPAS metadata, the ESPAS Space Physics Ontology and the ESPAS Supporting Vocabularies. 1.7.1 ESPAS Metadata ESPAS provides access to observations (data) of the Near-Earth Space using relevant information (metadata), such as the assets (instruments and models) that generated the observation, the observed properties that were measured during the observation, etc. All this information that characterizes an observation (e.g. when the observation took place, what it was measured, by which instrument, etc.) is called metadata and is organised according to the ESPAS data model. For more information on the ESPAS data model, please visit the Support → ESPAS Data Model page. The ESPAS metadata browser provides information for all the metadata that is registered in the ESPAS system grouped by the main concepts of the ESPAS Data Model. Note that the metadata browser presents entities even if there are no observations related to them, while in the search pages only the entities with related observations are presented. For example, suppose that an ESPAS data provider has registered the Instrument A in the ESPAS system, but there are no observations related with this specific instrument in the system. In this case, the Instrument A will be visible in the metadata browser, under the Instruments category, but this instrument won't be presented at the Search → Assets page. 1. In order to browse the ESPAS metadata, click on the Browse → ESPAS Metadata menu item. 2. The metada browser is presented, where you can navigate to all ESPAS metadata by clicking at the main categories (ESPAS data model concepts) that are presented on the left column. Clicking at a specific instance on the left, detailed information for this entity are presented on the right side. 3. For example, if you click on the Instruments (on the left column), a list of all the instruments registered in ESPAS is presented at the right side. Note that the name that appears inside the parenthesis in all instances at the left column represents their “localId” (a unique identifier for the ESPAS system) and is mainly useful for the ESPAS data providers. 4. Click on a specific instance either on the left column or the right side and detailed information is presented for this instance. For this example, click on the Athens Digisonde and detailed information (such as description, instrument type, etc.) is presented at the right side. Note that the links that are presented at the right will point you to the corresponding entries. 5. As another example, click on Observation Collections at the left column. A list of all the observation collections registered in ESPAS are presented at the right side. 6. Click on the Athens Digisonde SAO files (autoscaled) collection and detailed information is presented at the right side. 7.Similarly, you can browse all the ESPAS metadata by navigating through the entries at the left column. 1.7.2 ESPAS Space Physics Ontology The ESPAS data portal manages a set of vocabularies of Space Physics keywords that can be used to narrow down data searches to observations of specific physical content. These vocabularies constitute the ESPAS space physics ontology that is the cornerstone of the data search functions specific to the ESPAS domain. In order to simplify navigation through the wealth of ESPAS Space Physics vocabulary terms, the ontology is organized in several hierarchies of terms connected to each other via a “parent-child” relationship. Understanding the ontology hierarchies is critical for efficient data search and discovery in ESPAS. For more information on the ESPAS space physics ontology, please visit the Support → ESPAS Space Physics Ontology page. The ESPAS space physics ontology browser provides information for all the vocabularies that constitute the ontology presenting all the terms that exist in each vocabulary along with their description. The hierarchy of the ontology terms is presented at the left column by nesting the “children” terms under the “parent” term. 1. In order to browse the ESPAS space physics ontology, click on the Browse → ESPAS Space Physics Ontology menu item. 2. The ontology browser is presented, where you can navigate to all ESPAS space physics vocabularies by clicking at the vocabularies presented at the left column. The hierarchy of the ontology terms is presented at the left column by nesting the “children” terms under the “parent” term, like the windows explorer presents the folders and file structures. 3. For example, click on the Observed Property vocabulary at the left column, then click the Critical Frequency, O-Mode Critical Frequency and choose the F2-layer Critical Frequency entry. Information about this observed property (e.g. description, related concepts) is presented at the right side. 4. Note that the links that are presented at the right will point you to the corresponding entries of the ontology browser. In this example, click on the Electromagnetic Wave under the Phenomenon title, and the information regarding this term are presented on the right. 5. Similarly, you can navigate through all the vocabularies of the ESPAS space physics ontology by clicking the appropriate terms at the left column. 1.7.3 ESPAS Supporting Vocabularies Many of the properties of the concepts of the ESPAS Data Model use values from controlled vocabularies and are referred as “supporting” vocabularies. The terms in these vocabularies are connected to each other via “parent-child” relationships (optional), as in the case of the ESPAS space physics ontology. The definition of each controlled vocabulary is given in the Glossary section (Browse → Glossary) of the ESPAS portal. The ESPAS supporting vocabularies page provides information for all these vocabularies presenting all the terms that exist in each vocabulary along with their description. The hierarchy of the ontology terms is presented at the left column by nesting the “children” terms under the “parent” term. 1. In order to browse the ESPAS supporting vocabularies, click on the Browse → ESPAS Supporting Vocabularies menu item. 2. The vocabularies browser is presented, where you can navigate to all ESPAS supporting vocabularies by clicking at the vocabularies presented at the left column. The hierarchy of the terms is presented at the left column by nesting the “children” terms under the “parent” term, like the windows explorer presents the folders and file structures. 3. For example, click on the Coordinate Reference System (CRS) vocabulary at the left column, then click the Geocentric Spherical term. The description of this term is presented at the right side. 4. Similarly, you can navigate through all the ESPAS supporting vocabularies by clicking the appropriate terms at the left column. 1.8 ESPAS Policies menu The ESPAS Policies menu provides information regarding the ESPAS policies and the data licenses defined by each ESPAS data provider. ESPAS provides access to metadata for free and no user registration is required. However, the download of data files and data values requires the following: - user registration and login to the ESPAS portal - user agreement to the data licenses as defined by each ESPAS Data Provider 1. Click on the ESPAS Policies menu. The ESPAS policies page will open that presents the ESPAS policy regarding the access to metadata along with the data licenses of the ESPAS data providers. 2. In order to view the specific data license from a data provider, click on the name of the data provider. In the example below, you can see the data licences defined by the National Observatory of Athens (NOA) data provider. 1.9 Support menu The support menu provides supporting information to the user and data provider regarding the ESPAS portal and its basic components: the ESPAS data model and the ESPAS space physics ontology. It is highly suggested the users and data providers of ESPAS to read this material beforehand in order to understand the concepts and terms used in ESPAS portal and how these terms are used for the metadata searches. This will facilitate their interaction with ESPAS portal and maximize their potentials to perform queries for observations that satisfy more complex criteria. Moreover, the glossary page gives the definitions for all the terms that are used in the ESPAS portal, and the contact page presents a contact form with the ESPAS administrator. 1.9.1 About ESPAS 1. In order to view information about ESPAS project, click on the Support → About ESPAS menu item. 2. The “about ESPAS” page is presented that provides an overview of ESPAS project. 1.9.2 ESPAS Data Model 1. In order to view information about ESPAS Data Model, click on the Support → ESPAS Data Model menu item. 2. The ESPAS data model page provides a general overview of the ESPAS data model with a figure that presents the relationships among the major data model concepts. A link is provided at the end of this page for the detailed documentation of the ESPAS data model for an in-depth description. 1.9.3 ESPAS Space Physics Ontology 1. In order to view information about ESPAS Data Model, click on the Support → ESPAS Space Physics Ontology menu item. 2. The ESPAS space physics ontology page provides a general overview of the ontology that has been developed for ESPAS. A link is provided at the end of this page for the detailed documentation of the ESPAS space physics ontology. 1.9.4 Glossary 1. In order to view the ESPAS Glossary, click on the Support → Glossary menu item. 2. The glossary page provides a list of terms and their definition that are used in the ESPAS portal. 1.9.5 For Data Providers 1. In order to view the information for the data providers, click on the Support → For Data Providers menu item. 2. The “For Data Providers” page is addressed to the existing ESPAS data providers and the new ones wishing to participate in the ESPAS. It presents all the relevant information of the required steps to be performed by a data provider in order a dataset to be registered in ESPAS portal. 1.9.6 Contact Us 1. In order to contact ESPAS administrator, click on the Support → Contact Us menu item. 2. Provide the required information and the message you want to send to ESPAS administrator and click Submit. Note that the fields marked with an asterisk (*) are mandatory. 3. A message is presented that confirms that your email was successfully sent to the ESPAS administrator. 1.10 My Account menu The My Account menu provides information regarding the user's personal information, the dataset files download requests and the data values download requests. Moreover, for the users that are registered as data providers in the ESPAS portal, there are two extra options in this menu: the register data provider and manage data source (see Support → For Data Providers for more information). The My Account menu is displayed only after you have logged in the ESPAS Portal. 1.10.1 My Personal Information 1. If you want to edit your personal information (e.g. password, name), click My Account → My Personal Info from the main menu. 2. Update your personal information (name, password, organisation name, domain, country, the intended use of ESPAS data, comments) and click Submit. Note that the fields marked with an asterisk (*) are mandatory. If you want to become an ESPAS data provider and you have already contacted ESPAS administrator via the Contact Us page, check the box “Check if you are a data provider administrator”. The ESPAS administrator will review your request and upgrade your user status to become a data provider. As a data provider you can register metadata in the ESPAS portal. 3. A message is presented that confirms that your personal information has been updated successfully. 1.10.2 My Dataset File Downloads The “My Dataset File Downloads” page presents the history and detailed information of your download requests (for dataset files). Note that for each completed download request you will provided with a url to download the data files. This url is valid for a specific period of time, as defined by each ESPAS data provider. Afterwards, the request is expired and you cannot download the data files. For each download request you can: view its status: A request is characterized by its status, which can have one of the following values: ◦ Submitting: the request is being submitted to the ESPAS system. You should wait until the status becomes “Completed” to get the data files. ◦ Running: the request is running. You should wait until the status becomes “Completed” to get the data files. ◦ Completed: the request has completed successfully. You are provided with a url to download the data files. This url is valid for a specific period of time, as defined by each ESPAS data provider. Afterwards, the request is expired and you cannot download the data files. ◦ Pending: the request is in a pending state and an appropriate message is displayed. You should wait until the status becomes “Completed”. If this takes too long you can cancel the request and resubmit it. ◦ Expired: the request has expired. The url to download the data files is not available any more. You can resubmit the request to get the files again. ◦ Canceled: the request has been canceled by the user. You can resubmit the request. ◦ Failed: the request has failed and the reason of failure is presented. You can resubmit the request. ◦ Undefined: The request is in undefined status. You should contact the ESPAS administrator (Home Page → Contact Us). refresh the status: You can refresh the status of a request that is in a submitting, pending or running status. cancel the request: You can cancel a request that is in a submitting, pending or running status (for example when the request takes too long to get completed or you realized that you made a mistake in the query parameters). resubmit the request: You can resubmit a request that is in a expired, failed or canceled status. 1. In order to view the history of your dataset file download requests, click My Account → My Dataset File Downloads from the main menu. 2. A list of all your download requests is presented in chronological order (oldest first). The name of the request is the name you have defined during the submission of the request (see also section 3: Download of data files). Inside the parenthesis the local time of the submission is presented. You can sort the requests by submission date or name (1) by clicking on the appropriate option of the Sort by drop down menu. Moreover, you can use the search box “filter” (2) to search for requests with a specif name or date. 3. If you want to check the status of a download request or view more information about it, click on the name of a specific request. In the following example the information about the download request with name: “SAO files (May 2006)” that was submitted on 2015-07-16 12:18:40 (local time) is presented. The status of the request is shown (1) (which is “completed” in this example) along with the expiration date (2) (See also the section 1.10.2 for a description of the possible sstatus values). Then, the download url (3) is provided. Click on this url to download the data files. Note that this url is valid until the expiration date (2). Afterwards, the request is expired and you cannot download the data files. You can resubmit the request to get the same data files. At the right (4) there are the buttons to refresh the status of the request, to cancel it or resubmit it. Click on the appropriate button, according to your need. At the bottom (5) click on the View more link to see information about your request. 4. The query options of your request are presented. In this example, the query options of the request are “Observation Collections = Athens Digisonde SAO files (autoscaled) AND Time Periods = from 2006-05-10 to 2006-05-10 00:00 – 23:59 UTC”. Clicking on the View less this area closes. 5. In the following example, a request that has been canceled by the user is presented (Canceled status). 6. In the following example, a request that is in a pending state is presented (pending status). This happens for example when the download request is being processed. You should wait until the status becomes “Completed”. If this takes too long you can cancel the request and resubmit it. 7. In the following example, a request that is running (running status) is presented. You should wait until the status becomes “Completed” to get the data files. 1.10.3 My Data Values Downloads The “My Data Values Downloads” page presents the history and detailed information of your download requests (for data values). Note that for each completed download request you will provided with the option to view/download the data values (in ASCII or XML format) or to plot them. These functionalities are valid for a specific period of time, as defined by each ESPAS data provider. Afterwards, the request is expired and you cannot view/download/plot the data values. Usually, the data values download requests are processed in a very short time period of time, since a maximum of 30 days can be selected as time period. For each download request you can: view its status: A request is characterized by its status, which can have one of the following values: ◦ Submitting: the request is being submitted to the ESPAS system. You should wait until the status becomes “Completed” to get the data values. ◦ Running: the request is running. You should wait until the status becomes “Completed” to get the data values. ◦ Completed: the request has completed successfully. You are provided with the option to view/download the data values (in ASCII or XML format) or to plot them. These functionalities are valid for a specific period of time, as defined by each ESPAS data provider. Afterwards, the request is expired and you cannot view/download/plot the data values. ◦ Pending: the request is in a pending state and an appropriate message is displayed. You should wait until the status becomes “Completed”. If this takes too long you can cancel the request and resubmit it. ◦ Expired: the request has expired. The url to download the data files is not available any more. You can resubmit the request to get the files again. ◦ Failed: the request has failed and the reason of failure is presented. You can resubmit the request. ◦ Unknown: The request is in unknown status. You should contact the ESPAS administrator (Home Page → Contact Us). refresh the status: You can refresh the status of a request that is in a submitting, pending or running status. resubmit the request: You can resubmit a request that has expired or failed. 1. In order to view the history of your data values download requests, click My Account → My Data Values Downloads from the main menu. 2. A list of all your download requests is presented in chronological order (oldest first). The name of the request is the name you have defined during the submission of the request (see also section 4: Download of data values). Inside the parenthesis the local time of the submission is presented. You can sort the requests by submission date or name (1) by clicking on the appropriate option of the Sort by drop down menu. Moreover, you can use the search box “filter” (2) to search for requests with a specif name or date. 3. If you want to check the status of a download request or view more information about it, click on the name of a specific request. In the following example the information about the download request with name: “extracted from Athens SAO” that was submitted on 201507-24 13:54:36 (local time) is presented. The status of the request is shown (1) (which is “completed” in this example) along with the expiration date (2) (See also the section 1.10.3 for a description of the possible status values). Then, there is the Get Data as drop down menu (3) that provides access to the data values (ascii and xml format) and also the Get Plot Data as drop down menu (4) that provides a plot of the data values. Note that these menus are valid until the expiration date (2). Afterwards, the request is expired and you cannot view/download/plot the data values. You can resubmit the request to get the same data values. At the right (4) there are the buttons to refresh the status of the request or resubmit it. Click on the appropriate button, according to your need. At the bottom (5) click on the View more link to see information about your request. 4. The query options of your request are presented. In this example, the query options of the request are “Observation Collections = Athens Digisonde SAO files (autoscaled) AND Time Periods = from 2006-05-10 to 2006-05-12 00:00 – 23:59 UTC AND Selected Observed Properties ='E-layer Critical Frequency, F1-layer Critical Frequency, F2-layer Critical Frequency, Minimum frequency of Reflections from Plasma Layer, Minimum Virtual Height of F2 layer'. Clicking on the View less this area closes. 5. In order to view/download the data values in ascii format, click the Ascii option of the Get Data as drop down menu. 6. The data values (marked by a timestamp) are presented in a new tab/window of your browser in ascii format as comma separated values. The header line of the file is the description of the fields of the data values and the corresponding units. So, the first value corresponds to the time stamp (in UTC) of the measured observed property, while the second value is the name of the data provider. Afterwards, the extracted data values of measured observed properties are presented in the units defined in the header line and in the same order as described at the header line. The data values are grouped by data provider and extracted parameter. So, in this example, first the “foE” values of the “National Observatory of Athens” (data provider) are presented (lines 1 to 40), then the “foF1” values of the same data providers are presented (lines 41 to 80), etc. You can use the “Save Page as” of your browser to save this file locally on your computer. 7. In order to view/download the data values in an XML, click the XML option of the Get Data as drop down menu. 8. The data values are presented in a new tab/window of your browser (in XML format that corresponds to the SOS response). You can use the “Save Page as” of your browser to save this file locally on your computer. 9. In order to view a plot of the data values, click the Linear plot option of the Get Plot Data as drop down menu. 10. The plot of the downloaded data values open in a new pop up window. You can select any are to zoom. 11. You can save the plot locally on your computer by clicking the button at the top left corner (1) and then selecting the appropriate format. 1.11 News 1. If you want to view News regarding ESPAS project, click on the NEWS located at the bottom menu bar. 2. The News page of the ESPAS project website will open in a new tab/window. 1.12 Events 1. If you want to view News regarding ESPAS project, click on the EVENTS located at the bottom menu bar. 2. The Events page of the ESPAS project website will open in a new tab/window. 1.13 Partners 1. If you want to view the Partners of ESPAS project, click on the PARTNERS located at the bottom menu bar. 2. The Partners page of the ESPAS project website will open in a new tab/window. 1.14 Data Providers 1. If you want to view the Data Providers of ESPAS project, click on the DATA PROVIDERS located at the bottom menu bar. 2. The Data Providers page of the ESPAS project website will open in a new tab/window. 2. Metadata Search 2.1 Progressive Search 2.3 Time/Location Search 3. Download of Data Files 4. Download of Data Values