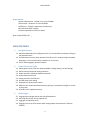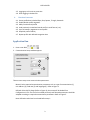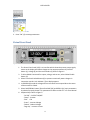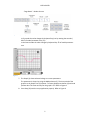
1
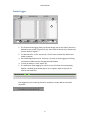
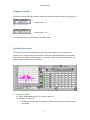
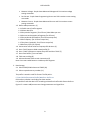
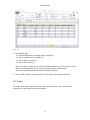
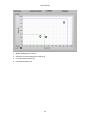
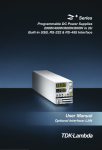
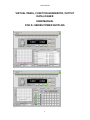
IA710-04-05B VIRTUAL PANEL, FUNCTION GENERATOR, OUTPUT DATA LOGGER USER MANUAL FOR Z+ SERIES POWER SUPPLIES Figure 1 Figure 2 1 IA710-04-05B Requirements Labview 2014 runtime - located on Z+ series CD-ROM VISA runtime – located on Z+ series CD-ROM NI7SEG Font – located in application root directory Microsoft Excel 2007 or higher Processor equivalent to Intel i3 or better Note: Install NI7SEG Font MAIN FEATURES 1. Common Features 1.1. Manual and defined (from configuration file .ini) communication parameter setting at the application start 1.2. Communication recovery after operation fault when unit is ready (example: AC power disappears or unit communication parameter is not correct). 1.3. SCPI or GEN Languages operation support 2. Virtual Front Panel (VFP) 2.1. Allows general control function (output ON/OFF, Voltage Setting, Current Setting) 2.2. Output status and encoder setting indication 2.3. Simple switch for individual & global commands 2.4. Virtual Panel controls lock 2.5. Setting save and recall function 2.6. Preview mode value setting 2.7. Keyboard Keys Virtual Panel control 2.8. Different color shows selected parameters (setting or measured) of voltage or current on the graph 2.9. Internal or wire impedance setting 3. Status Logger 3.1. Logging output voltage and current with defined period 3.2. Store Log date of each unit in separate file 3.3. Logging occurred faults (SCPI) 3.4. Logging Virtual Front Panel events which change output status when the function enabled 2 IA710-04-05B 3.5. Logging up to 31 units at same time 3.6. Clear Logging in the data file 4. Function Generator 4.1. Create profile data included Slope, Sine, Square, Triangle, Sawtooth 4.2. Enable/disable profile segments 4.3. Ability to edit stored profile 4.4. Load previously created and stored profile in excel format (.csv) 4.5. Up to 10 memory segments to store profile 4.6. Graphical profile visibility 4.7. Repeat profile with defined integration time Application Run 1. Press arrow RUN 2. Communication Setup window appears 1 2 3 4 5 Figure 3 Communication Setup There are two ways to set communication parameters: Manual: Select required communication parameters such as: type of communication (1), unit address (2), baud rate (3) and language (4). Refer to Figure 3 Defined: Select INI File Setup (Refer to Figure 4), then setup will be loaded from Configuration.ini file. The file can be edited previously and selected parameters should be adapted according to required communication parameters. Refer to Figure 5. Note: Defined method can be selected before step 1. 3 IA710-04-05B Figure 4 Figure 5 Cinfiguration.ini file 3. Press “OK” (5) to accept parameters Virtual Front Panel 10 13 2 11 7 5 12 6 8 1 3 9 Figure 6 Virtual Front Panel 1. The Virtual Front Panel (VFP) is an interface which shows the present power supply status on the display and allows changes to the output parameters by OUTPUT button (1), Voltage (2) and Current Encoders (3). Refer to Figure 6 2. To allow Global Commands for output, voltage, and current, select Global Enable button (5). 3. Select Front Panel Locked button (6) to prevent occasionally status change via interactive controls. Lock indicator (7) on display appears. 4. In PREVIEW (8) mode the voltage and current values are accepted when the center of the encoder is clicked. 5. Select SAVE/RECALL button (9) to allow SAVE (10) and RECALL (11) main parameters by selection properly button. For parameter list Refer to table 5-7 in Z+ User Manual 6. Keyboard Keys. Refer to Figure 7: “Ctrl+F8” – OUTPUT ON/OFF “Home” - Preview “End” - File “Insert” - Increase Voltage “Delete” - Reduce Voltage “Page Up” - Increase Current 4 IA710-04-05B “Page Down” - Reduce Current Figure 7 Keyboard key In Fine mode the value changes by keyboard key (not by rotating the encoder) 0.01% of model parameter rate. (12) In the Course mode the value changes by keyboard key 1% of model parameter rate. 1 4 3 2 Figure 8 7. The Graph (1) shows selected voltage or current parameters. The parameter is chosen by using the Mode selector (2). The time period of the graph is set by Graph Time (2) selector. To Freeze Graph press button (4) and read present data. The time accuracy for the graph is 2%. Refer to Figure 8 8. Press Stop (12) switch to stop application properly. Refer to Figure 6 5 IA710-04-05B Status Logger 2 3 1 4 5 6 7 8 9 Figure 9 Logger 1. This feature allows logging faults, measured voltage and current data (1) which are defined by time period (“Log Period”) (4). Select STATUS LOG tab (2) to activate the function. Refer to Figure 9 2. The data stored in .txt file. See path (3). The file name includes PSU address and model properties. 3. Set the Message button to the “All Events” (5) state, to allow logging of all setting commands in addition to the messages described above. 4. To clear file data use “Clear” button (6). 5. The application allows logging for more than one unit when the corresponding address is enabled (green button)(up to 31 Z+ supplies). Refer to Figure 8. For STATUS LOG mode only. Figure 10 Each logged unit has its own log file which named by a unique address and model properties. Figure 11 6 IA710-04-05B Impedance mode The function allows simulate internal and external impedance of power supply in range up to 1Ω Setting range “0-1” Figure 12 Wire Impedance Setting range “-1-0” Figure 13 Internal impedance Note: Negative sign is shows that internal mode selected. Function Generator The function enhances the ability of internal PSU advance waveform function and allows creation of sine, triangle and square waveforms. SCPI mode, Baud Rate 57600 recommended. Each profile may contain up to 99 segments. The profile may be iterated up to 9999 times. The function allows store/load up to 10 profiles. 1 4 9 10 1 8 7 6 2 5 3 3 Figure 14 1. To create any profile : 1.1. Select “WAVEFORM PROFILE” (1). Refer to Figure 14. 1.2. Select Graph mode: (2) Set Voltage - Graph shows Programming Voltage and PSU receives voltage setting commands 7 IA710-04-05B Measure Voltage - Graph shows Measured Voltage and PSU receives voltage setting commands Set Current - Graph shows Programming Current and PSU receives current setting commands Measure Current - Graph shows Measured Current and PSU receives current setting commands 1.3. Define table parameters (3) 1.3.1.Enable row of profile segment 1.3.2.Select data form 1.3.3.Set period of segment. (for all forms). Max 100ms per row 1.3.4.Set start and stop point of segment (for all forms). 1.3.5.Set amplitude of waveform (for all forms except line) 1.3.6.Set frequency. (for all forms except line) 1.3.7.Set phase. (optionally, for all forms except line) 1.3.8.Set Duty Cycle. (for square) 1.4. Set Iteration control value N to repeat profile N times. (4). 1.5. Press “RUN” button to RUN created profile (5) 1.6. Press “LOAD” (6) button to repeat the profile and then “RUN” (5) 1.7. Press Clear button (7) to reset table 1.8. Table row scrolling (8) 1.9. Indicator Remain shows remain interactions (9) Note: Press row enable button to include a profile segment. 2. Data Storage: 2.1. Select STORE/LOAD selector to STORE (10). 2.2. Select required memory number (11). The profile is stored in excel file format. The file path is: C:\Users\Public\Documents\Profile\Waveform Profile.csv Each memory number is according the sheet number. It is possible to edit the data in file according to Waveform Profile table format. Refer to Figure 15. It means add/remove rows change parameters and signal form. 8 IA710-04-05B Figure 15 3. Load and Run data 3.1. Select STORE/LOAD to LOAD (10). Refer to Figure 10. 3.2. Select required memory number (11). 3.3. Set integration number (4). 3.4. Press “RUN” button (3). Note: The memory number shown selected if loaded waveform or selector (9) didn’t switch. Note: In file stored profile only, so set iteration (4) value when profile loaded. Note: The profile table clears when other PSU address selected. 4. Press “LOAD” (6) button and then press the “RUN” button (5) to repeat the profile. V/I Graph The Graph shows power supply model and present operation areas. Also it possible view working point and calculate virtual load resistance. 9 IA710-04-05B 1 2 3 4 1. 2. 3. 4. Model rated operation area (1) Operation area according present setting (2) Currently operation point (3) Calculated resistance (4) 10