1
FACULTY OF AUTOMATION AND COMPUTER SCIENCE
MASTER IN COMPUTER SCIENCE AND INFORMATION TECHNOLOGY
DOMAIN OF COMPUTER NETWORKS AND DISTRIBUTED SYSTEMS
COMPUTER SCIENCE DEPARTMENT
A CLUSTER-READY VIEWER APPLICATION FOR
BUILDING SCALABLE HIGH-PERFORMANCE 3D VIRTUAL
GEOGRAPHICAL SPACE SCENARIOS USING GRAPHICS
CLUSTER ARCHITECTURES
MASTER THESIS
Author: Cristinel Mihai MOCAN
Project Supervisor: Prof. Eng. Dorian GORGAN, PhD
2010
FACULTY OF AUTOMATION AND COMPUTER SCIENCE
MASTER IN COMPUTER SCIENCE AND INFORMATION TECHNOLOGY
DOMAIN OF COMPUTER NETWORKS AND DISTRIBUTED SYSTEMS
COMPUTER SCIENCE DEPARTMENT
VISED,
DEAN,
HEAD OF DEPARTMENT,
Prof. Eng. Sergiu NEDEVSCHI, PhD
Prof. Eng. Rodica Potolea, PhD
Author: Cristinel Mihai MOCAN
A CLUSTER-READY VIEWER APPLICATION FOR BUILDING SCALABLE
HIGH-PERFORMANCE 3D VIRTUAL GEOGRAPHICAL SPACE SCENARIOS
USING GRAPHICS CLUSTER ARCHITECTURES
1. The Problem: The task of this thesis is to find a scalable solution in order to
demonstrate how can we integrate an object-oriented graphic rendering engine and a
parallel rendering framework optimally to exploit the power of multi-GPU systems
and visualization clusters when we build high-performance 3d Virtual Geographical
Space (VGS) scenarios.
2. Content: The Problem Description, Introduction, Related Works, Theoretical
Considerations, Technological Considerations, Implementation Considerations,
Experiments and Testing, User Manual, Conclusions, References, Annexes
3. Place of documentation: Technical University of Cluj-Napoca
4. Thesis emission date: November, 01, 2008
5. Thesis delivery date: June, 30, 2010
Author signature ________________________
Project’s supervisor signature _______________________
FACULTY OF AUTOMATION AND COMPUTER SCIENCE
MASTER IN COMPUTER SCIENCE AND INFORMATION TECHNOLOGY
DOMAIN OF COMPUTER NETWORKS AND DISTRIBUTED SYSTEMS
COMPUTER SCIENCE DEPARTMENT
Author declaration,
I, Cristinel Mihai MOCAN, master graduate of Faculty of Automatics and Computer
Science from Technical University of Cluj-Napoca, declare that the ideas, analysis, design,
development, results and conclusions within this Master Thesis represent my own effort
except for those elements which do not and will be highlighted accordingly in the document.
I also declare that from my knowledge this thesis is in an original form and was never
presented in other places or institutions but those explicitly indicated by me.
Date: June, 28, 2010
Author: Cristinel Mihai MOCAN
Matriculate number: 601 / III
Signature: ____________________
FACULTY OF AUTOMATION AND COMPUTER SCIENCE
MASTER IN COMPUTER SCIENCE AND INFORMATION TECHNOLOGY
DOMAIN OF COMPUTER NETWORKS AND DISTRIBUTED SYSTEMS
COMPUTER SCIENCE DEPARTMENT
SYNTHESIS
of the Master Thesis:
A CLUSTER-READY VIEWER APPLICATION FOR BUILDING SCALABLE HIGHPERFORMANCE 3D VIRTUAL GEOGRAPHICAL SPACE SCENARIOS USING
GRAPHICS CLUSTER ARCHITECTURES
Author: Cristinel Mihai MOCAN
Project Supervisor: Prof. eng. Dorian GORGAN, PhD
1. Problem definition:
Evaluate the compatibility between graphics rendering engines and parallel rendering
frameworks in order to build high-performance 3D complex scenarios on a distributed
architecture. The main purpose is to develop and implement a cluster-ready
application that allows the users to run different virtual geographical space scenarios
using the graphics cluster.
2. Proposed Solutions:
Graphics rendering engines : C++, an open
graphics toolkit called OpenSceneGraph,
the
rendering engine OGRE with CEGUI libraries
Graphics Cluster: C++ and Equalizer parallel
Video Encoding: MPEG-2 format
source high performance 3D
object -oriented graphics
and DotSceneLoader
rendering framework
3. Obtained Results:
A system that provides good performance for Graphical Modeling and Visualization
of Interactive Virtual Geographical Space using the graphics cluster architectures.
4. Tests and Verifications:
Experiments and testing ensure the correctness of the system implementation. They
are presented in Chapter 7.
5. Personal Contributions:
During the research activity presented in this Thesis, I have contributed to the
application development and its functionalities that has the main purpose to integrate a
graphic rendering engine with a parallel rendering framework optimally to exploit the
power of multi-GPU systems and visualization clusters when we build highperformance 3d Virtual Geographical Space (VGS) scenarios. I evaluated the
performance of load balancing for various cluster configurations by considering
different combinations of distributed rendering algorithms over the graphics cluster
and spatial data models. The research studies and experiments as well the flexibility
related with the mesh data formats accepted by the graphics renderer, user interaction
techniques with complex scenes in the context of graphics cluster rendering, and
solutions for data streaming and unit frame encoding. A few use cases of visualization
of the virtual geographical model exemplify the achievements.
6. Documentation Sources:
UTCN library, IEEE Organization Website, International Conferences proceedings,
different user manuals and other websites.
Date: June, 28, 2010
Author signature ______________
Project’s supervisor signature _______________
Master Thesis - 2010
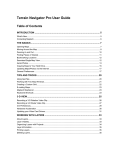
Table of Contents
1. THESIS DESCRIPTION……………………………………………………………………….......9
1.1. Task Statement .......................................................................................................................... 9
1.2. Functional Requirements........................................................................................................... 9
1.3. Technological Requirements ..................................................................................................... 9
2. INTRODUCTION………………………………………………………………………………...10
2.1. General Overview ................................................................................................................... 10
2.2. Objectives ................................................................................................................................ 10
3. RELATED WORKS………………………………………………………………………………12
4. THEORETICAL CONSIDERATIONS…………………………………………………………..14
4.1. Conceptual Architecture .......................................................................................................... 14
4.1.1.
Rendering Nodes and Server ........................................................................................... 14
4.1.2.
Node Manager and Broker component ............................................................................ 15
4.2. Virtual Geographical Space (VGS) ......................................................................................... 16
4.2.1.
Geographic Information System (GIS) ............................................................................ 16
4.2.2.
Virtual Reality (VR) ........................................................................................................ 18
4.2.3.
VGS Context and Definition ............................................................................................ 19
4.2.4.
Visualization Scenarios in VGS....................................................................................... 20
4.2.5.
Object-oriented graphics rendering engine integration.................................................... 23
4.2.6.
3D Objects Modeling ....................................................................................................... 23
4.2.7.
The Scene Graph .............................................................................................................. 24
4.3. Virtual Geographical Space Model ......................................................................................... 25
4.4. Use Case Scenarios for building 3D complex scenes ............................................................. 27
4.4.1.
Visualization Scenarios .................................................................................................... 27
5. TECHNOLOGICAL CONSIDERATIONS………………………………………………………29
5.1. Object-Oriented Graphics Rendering Engine ......................................................................... 29
5.1.1.
Introduction ...................................................................................................................... 29
5.1.2.
Features ............................................................................................................................ 31
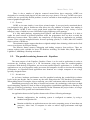
5.2. The parallel rendering framework – Equalizer ....................................................................... 31
5.2.1.
Introduction ...................................................................................................................... 31
5.2.2.
Use Case........................................................................................................................... 32
5.2.3.
Execution Model .............................................................................................................. 33
5.2.4.
Configuration ................................................................................................................... 34
5.3. Scalable Rendering .................................................................................................................. 35
5.3.1.
2D/Sort-First Rendering................................................................................................... 36
5.3.2.
Sort-Last Rendering ......................................................................................................... 36
5.3.3.
Pixel Compounds ............................................................................................................. 37
5.3.4.
Other Methods ................................................................................................................. 37
5.4. Load-Balancing – Rendering Strategies .................................................................................. 37
5.5. Video Compression ................................................................................................................. 38
5.5.1.
MPEG-2 ........................................................................................................................... 38
6. IMPLEMENTATION CONSIDERATIONS……………………………………………………..43
6.1. Graphics Cluster Description .................................................................................................. 43
6.2. The solution for integrating an object-oriented graphics rendering engine and a parallel
rendering framework .......................................................................................................................... 43
6.2.1.
Implemented application .................................................................................................. 43
6
Master Thesis - 2010
6.2.2.
Parallel Architecture ........................................................................................................ 44
6.2.3.
Data Distribution regarding Equalizer framework .......................................................... 45
6.2.4.
Scene Graph Updates ....................................................................................................... 45
6.2.5.
Event Distribution ............................................................................................................ 46
6.2.6.
Data Distribution regarding the graphics rendering engine ............................................. 46
6.3. Rendering Component............................................................................................................. 47
6.4. Collaboration Diagram for OGRE::DotSceneLoader ............................................................. 49
6.5. Data Model .............................................................................................................................. 50
7. EXPERIMENTS AND TESTING……………………………………………………………......52
7.1. Graphics Clusters Configurations ........................................................................................... 52
7.1.1.
Scene-Oriented integration into Graphics Cluster ........................................................... 52
7.1.2.
Component Testing – Building different complex scenarios in Ogre ............................. 54
7.2. Graphics Clusters visualization performance using Load-Balancing strategies ..................... 55
7.2.1.
Resources assignments for optimal performances ........................................................... 55
7.2.2.
A relevant advantage in using load-balancing ................................................................. 56
7.2.3.
Frame computation by the rendering algorithms ............................................................. 56
7.3. Functional Testing ................................................................................................................... 58
7.3.1.
Generating Scene files ..................................................................................................... 58
7.3.2.
MPEG-2 Compression ..................................................................................................... 58
7.3.3.
Adding a Node to the System .......................................................................................... 58
7.3.4.
Disabling a Node from the System .................................................................................. 58
7.3.5.
Communication between the Client Application, Broker Component and the Rendering
System …………………………………………………………………………………………..59
7.4. Performance Testing ............................................................................................................... 59
8. USER MANUAL…………………………………………………………………………………63
8.1. Installation Guide .................................................................................................................... 63
9. CONCLUSIONS………………………………………………………………………………….66
REFERENCES………………………………………………………………………………………..67
ANNEX……………………………………………………………………………………………….69
7
Master Thesis - 2010
Figure List
Fig. 4.1: System Conceptual Architecture ................................................................................14
Fig. 4.2: Vector data in a GIS system .......................................................................................17
Fig. 4.3: Raster data in a GIS system ........................................................................................18
Fig. 4.4: Visualization Scenario using Ogre .............................................................................21
Fig. 4.5: Graph-based structure of the VGS model ..................................................................26
Fig. 5.1: Screenshot from the official OGRE Demos pack. Rendering options: 1600*1200
pixel resolution, OpenGL renderer, 32-bit color depth.............................................................30
Fig. 5.2: Example of OGRE core objects UML diagram .........................................................30
Fig. 5.3: Display-wall for Equalizer .........................................................................................32
Fig. 5.4: Virtual Reality with Equalizer ....................................................................................33
Fig. 5.5: Multi-GPU rendering with Equalizer .........................................................................33
Fig. 5.6: Scalable rendering with Equalizer ..............................................................................33
Fig. 5.7: Simplified execution model for Equalizer ..................................................................34
Fig. 5.8: An example configuration ..........................................................................................35
Fig. 5.9: Sort-first decomposition and Re-composition ............................................................36
Fig. 5.10: Sort-Last Decomposition and Re-composition ........................................................37
Fig. 5.9: Example of Y’CbCr subsampling ..............................................................................39
Fig. 5.10: An example of frame types and references in MPEG-2 compression......................40
Fig. 5.12: An example of an encoded 8x8 FDCT block ...........................................................41
Fig. 5.13: An example of quantization matrix ..........................................................................41
Fig. 5.14: An example quantized DCT matrix ..........................................................................41
Fig. 6.1: Graphics Cluster Diagram - Rendering nodes and rendering subsystem’s server .....43
Fig. 6.2: Asynchronous rendering tasks when updating one view using four GPU’s ..............45
Fig. 6.3: Subclassing, proxies and multiple inheritance for OGRE data distribution ...............47
Fig. 6.4: Communication between nodes, sessions and objects in the Graphics Cluster .........48
Fig. 6.5: Collaboration diagram for OGRE::DotSceneLoader .................................................50
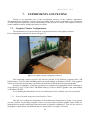
Fig. 7.1: Graphics cluster computing resources ........................................................................52
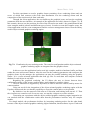
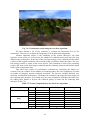
Fig. 7.2: Visualization by two rendering nodes. The sort-first configuration and the objectoriented graphics rendering engine are integrated into the graphics cluster. ............................53
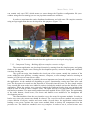
Fig. 7.3: Screenshots Results from the application we developed using Ogre ........................54
Fig. 7.4: Cross-segment load-balancing for two segments ......................................................55
Fig. 7.5: Four nodes graphics cluster running sort-first rendering strategy using loadbalancing. ..................................................................................................................................56
Fig. 7.2: Visualization result using the sort-first algorithm ......................................................60
8
Master Thesis - 2010
1.
1.1.
THESIS DESCRIPTION
Task Statement
The task of this thesis is to find a scalable solution in order to demonstrate how can we
integrate an object-oriented graphic rendering engine and a parallel rendering framework optimally to
exploit the power of multi-GPU systems and visualization clusters when we build high-performance
3d Virtual Geographical Space (VGS) scenarios.
1.2.
Functional Requirements
The task of integrating an object-oriented graphics rendering engine with a scalable parallel
rendering framework is even more difficult if it should be generic to support various types of data and
visualization applications and at the same time to work efficiently on a cluster with distributed
graphics cards.
The performance of load balancing is evaluated for various cluster configurations by
considering different combinations of distributed rendering algorithms over the graphics cluster and
spatial data models. The research studies and experiments as well the flexibility related with the mesh
data formats accepted by the graphics renderer, user interaction techniques with complex scenes in the
context of graphics cluster rendering, and solutions for data streaming and unit frame encoding. A few
use cases of visualization of the virtual geographical model exemplify the achievements.
From the interactivity point of view the solution is to allow the user to interact with the
complex scenes. Using the object-oriented graphics rendering engine the user can add a camera in the
application. In this situation the user is able to navigate throughout the scene interacting by the input
devices - by keyboard keys to move the camera and by mouse for camera rotation.
1.3.
Technological Requirements
The challenge is how to integrate a flexible object-oriented graphics rendering engine like
scene-oriented with a parallel rendering framework in order to develop scalable graphics applications
for a wide range of systems ranging from large distributed visualization clusters and multi-processor
multi-pipe graphics systems to single-processor single-pipe desktop machines.
Related to this challenge we focused on finding an object-oriented graphics rendering engine
that produces applications utilizing hardware-accelerated 3D graphics. Also we look for a toolkit
based on OpenGL which provides an application programming interface to develop scalable graphics
applications for our graphics cluster.
Increasing multi-core processor and cluster-based parallelism and the improvements
concerning the CPU and GPU performances demand for flexible and scalable parallel rendering
solutions that can exploit multi-pipe hardware accelerated graphics. In this situation, the scalable
rendering systems are essential to cope with the rapid growth of data sets in order to achieve
interactive visualization.
9
Master Thesis - 2010
2.
2.1.
INTRODUCTION
General Overview
Rendering and interacting with high-resolution geographical data sets and complex models of
virtual geographical space involves high power computation resources in networking environments.
The solution of integrating graphics rendering engine applications in cluster based architecture and
Grid infrastructure is the main concern of the research reported by this thesis.
In case of complex 3D models a single GPU cannot offer an adequate performance although
the rendering devices performance has been the subject of a surge related to this aspect.
By visualization scenarios in a Virtual Geographical Space (VGS) we understand specific
routines and algorithms created for the purpose to simplify and standardize the visualization
methodology and add more useful details to visualization complexity. With the use of graphics cluster
architectures, one can use these visualization scenarios on very complex VGS’s.
The Virtual Geographical Space represents a tool in defining, modeling and simulating real life
geographical environments. The virtual scene is composed of 3D object models (e.g.: polygonal
models, NURBS surfaces, equation-based models)
In order to obtain a working visualization of such a complex scene, our system based on a
distributed architecture provides the option to record what the user sees on the screen through the
perspective of an avatar. The result that is obtained can be a video, an image or a sequence of images.
The main motivation is that most personal computers do not hold high-power computation
hardware resources in order to be able to apply and use the visualization scenarios on locally stored
3D complex environments.
2.2.
Objectives
The objectives of this research are listed in the following:
Finding a solution for integrating graphics rendering engine applications in cluster
based architecture and Grid infrastructure is the main purpose in this thesis. The result
is an application that supports:
Rendering multiple views of the same scene graph, using software or hardware
swap synchronization.
Parallel, multithreaded rendering on multi-GPU workstations and distributed
rendering on multi-GPU visualization clusters.
Scalable rendering to aggregate the power of multiple GPUs for one or
multiple views (supported modes: 2D, DPlex, 2D load-balancing, crosssegment load-balancing)
Any combination of the above due to the flexible run-time configuration of
Equalizer, using a simple configuration file.
Performance evaluation concerning load-balancing for various cluster configurations
by considering different combinations of distributed rendering algorithms over the
graphics cluster and spatial data models.
10
Master Thesis - 2010
Developing and testing a number of formats (scene graphs), executable on the graphics
cluster, for the VGS description; Execute experiments as well in order to see the
flexibility related with the mesh data formats accepted by the graphics renderer, user
interaction techniques with complex scenes in the context of graphics cluster rendering.
Testing the system for execution and visualization of a 3D static or dynamic
environment that is existent on graphics clusters.
The next section highlights some related works concerning this subject.
11
Master Thesis - 2010
3.
RELATED WORKS
This section will present some of the existent software products which offer a similar
functionality to the one of the current developed system, presented during the course of this project.
A great part of work has addressed issues recently in accessing, representing, and manipulating
large data sets. The previous work can be summarizing as follows.
The paper [1] presents a few experiments on the solutions supported by the Chromium
graphics cluster to provide fast distributed processing and remote visualization. It evaluates the
performance for various cluster configurations and spatial data models. The research concerns as well
with accessing the cluster based processing by web applications through grid and web services.
A solution of combining graphics cluster based computation, Grid infrastructure and Web
applications appears in paper [2]. The paper explores and experiments the optimal architecture for
remote graphics visualization considering different combinations of the sort-first and sort-last
distributed rendering algorithms over the Equalizer graphics cluster.
Concerning the parallel rendering we found out that Equalizer [3] supports multi-view and
scalable rendering, resource management, and planning of the transparent rendering layer. It enables
application developers to configure their applications to take full advantage of multi-GPU
workstations. In this case the applications provide better performance and allow visualizing complex
data sets.
Equalizer and Chromium [4] solve similar problems by enabling applications to use multiple
GPU's, but have disjunctive use cases and characteristics. In our experiments we have chosen to work
using the parallel rendering framework because scalability, flexibility and compatibility are mainly
required in our graphics cluster.
On the other hand, in order to build complex oriented-scenes applications we compared some
graphics engines like [5], [6], [7] and [8].
From this point of view the problem was to find out which would be a better choice for a 3D
engine. If we compare Ogre and OpenSceneGraph (OSG) we can conclude that Ogre has better
documentation than OSG, supports D3D while OSG only supports OpenGL (not really important, but
provide more options in the future). Ogre has more built in features, like skeletal animations (really
important for the arm) and seems a lot easier to use.
Another important aspect about Ogre relates to the optimization for utilizing all the fancy GL
features like hardware vertex buffers supported by mainly ATI, NV and mainstream cards while OSG
is optimized for compatibility with scientific platforms like SGI, which generally have all kinds of
peculiar bugs to work around.
The conclusion is that Ogre includes the features available in other graphics engines as addons. It offers more freedom to choose the components you want and has much better geometry and
material formats and handling. Also the design is better, faster, and is much more feature rich. Irrlicht
has mostly obsolete file formats that were never designed for real-time graphics and are extremely
limited, often forcing you to use several separate formats to get the specific material and features you
need.
Finally, I consider using object-oriented graphics rendering engine because it uses a flexible
class hierarchy that allows us to design plug-ins to specialize the scene organization approach taken to
allow us to make any kind of scene. Therefore, the object-oriented graphics rendering applications can
be integrated with our parallel rendering framework.
Concerning the remote and collaborative visualization, the openVISSAR toolkit [9] sends the
real-time generated visualizations.
12
Master Thesis - 2010
Paper Error! Reference source not found. presents a method of remote cluster based
visualization for 3D large medical objects obtained through direct modeling or 3D scanning in the
context of eLearning applications. The teaching materials include 3D models, which is not actually a
trivial action, since it requires skills for modeling, specific user interaction techniques and specialized
hardware for implementation. The current project stands out by including a specifically implemented
language for scenario manipulation in order to visualize a complex scene of objects (the VGS),
whereas the application in the paper deals only with one object at a time. This being the case, some
simple interaction functionalities are still included.
A similar work is done in paper Error! Reference source not found.. It details and presents
the performance boosting of rendering applications by accessing remotely a graphical rendering
system.
A solution that combines graphics cluster based computation, Grid infrastructure and Web
applications is presented in paper Error! Reference source not found.. Its main focus is to explore
and experiment different optimal architectures for remote graphics visualization while using
combinations of the sort-first and sort-last distributed rendering algorithms over the Equalizer
graphics cluster. It also deals with scalability issues: single and multiuser interaction against single
and multi virtual geographical models.
The current application heavily relies on Error! Reference source not found.. The server part
of the system is similarly implemented. The main ideas for analysis and implementation are used.
A different approach to distributed processing remote visualization is discussed in paper
Error! Reference source not found.. It issues the problem of using the Chromium graphics cluster,
which has a similar functionality with Equalizer. Various cluster configurations and spatial data
models are being evaluated for performance.
Paper Error! Reference source not found. represents a similar implementation of the
currently developed application, with the exception of the visualization scenarios. A major difference
in the system is the use of the Chromium graphics cluster, whereas this project uses Equalizer.
13
Master Thesis - 2010
4.
4.1.
THEORETICAL CONSIDERATIONS
Conceptual Architecture
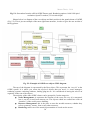
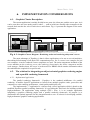
Largely speaking, the proposed architecture for the cluster based visualization system uses the
client-server model for the rendering part.
The main architecture components are the following: the visualization servers, the rendering
clients and the resource manager component. The communication and the user interaction use a
resource manager and a notification model.
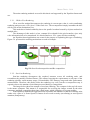
The main conceptual architecture is described below (Fig. 4.1):
User
Application
Graphics Cluster - Resource Manager
Node Manager
Broker
Visualization Servers
Composer
Video Streamer
Rendering Server
Rendering
Clients
Rendering
Clients
Rendering
Clients
Fig. 4.1: System Conceptual Architecture
4.1.1. Rendering Nodes and Server
At the server and the rendering client level we used the modified parallel rendering framework
based on Equalizer.
14
Master Thesis - 2010
For our experiments we used multiple computers that were linked together in order to share
computational workload. The requests initiated from the user are managed by and distributed among
all the standalone computers to form a graphics cluster. In designing the graphics clusters we used
different computing resources depending on the conducted experiment.
Each of the rendering client has a module which is responsible to execute the rendering tasks
sent by the server. In conclusion, a rendering node application runs on each rendering client. After
each rendering cycle, the result is sent to the composer node.
In order to achieve a good performance, the result data has to be compressed. For this purpose
we use a compression plugin system supported by Equalizer. Currently the data is compressed using
the RLE (Run Length Encoding) method. This is not the best option, a Huffman coding could achieve
a better compression ratio. Another criteria for selecting other algorithm is execution time. From this
point of view, the RLE execution time is linear with the raw data size.
The Rendering Server and the Composer application are running on the rendering subsystem’s
server. The server is responsible for managing the rendering nodes, transmitting messages to nodes
and object distribution. The configuration of the rendering system is described in a configuration file
[10].
The Composer module objective concerns on composing the final frame, compressing it, and
streaming a continuous video stream to the client. For video compression we used the free library,
which is a part of the FFmpeg project [11].
The communication between the streamer process and the rendering system uses pipe files.
The composer node creates a child process, using the streamer binary and redirects its standard input
to a pipe file. The streamer will permanently read the standard input and stream the data to the
destination. The video streaming is made on a constant frame-rate, so the streamer process has to be
feeded continuously, even if the rendering system’s performance is lower as the desired frame-rate or
it is not constant. This problem was fixed by a simple algorithm, which skips some of the frames, if
the rendering FPS (Frames per Second) is greater than the streaming FPS or duplicates frames in the
other case.
The networking layer provides a peer-to-peer communication infrastructure. It is used in order
to communicate between the application node, the server and the render clients. This layer can also be
used by applications to implement distributed processing independently or complementary to the core
Equalizer functionality. It provides layered functionality, which means higher level functionality for
the programmer. In our graphics cluster network layer the communication between nodes is
accomplished using packets. There is a base class that allows the registration of a packets with a
dispatch queue and an invocation method. Each packet has a command identifier, which is used to
identify the registered queue and method. We can say that the node is the abstraction of a process in
our graphics cluster. Using connections the nodes communicate with each other.
Based on the Universally Unique Identifier [12] standard each node has a unique identifier.
For instance, in order to query connection information to connect to the node we use the identifier to
address nodes.
4.1.2. Node Manager and Broker component
In order to achieve the desired experiments from this research we developed a node manager
application. Using it we could enable or disable certain nodes in our graphics clusters depending on
how many we need in each experiment.
15
Master Thesis - 2010
We use this component for the cluster administration. By this tool the administrator may
register new nodes that can be disabled or removed later from the system. It is important to notify that
the nodes can be Server or Client nodes. This is a desktop application that connects to the database
installed on the server and reads/modifies the database table which stores the information about the
registered nodes.
The Node-Manager offers application file deployment. That means the application files are
copied using Secure Copy Protocol before a new node is added in the system. In order to make it
work, the host on which the Node-Manager is installed needs to have a password less SSH connection
configured to the new node.
The administrator interest is to have access to a friendly user interface through which a new
rendering node can be added to the rendering system. It is important to have access to the database
and as an alternative scenario we assume the node could not be added successfully because of
different reasons, like connection less or password less SSH connection errors.
On the other hand, the broker component receives requests from users and, depending on the
rendering strategies and parameters it fetches the visualization to a rendering server. The rendering
clients are receiving the rendering parameters from the rendering server together with the graphical
scene.
Based on visualization requirements, the broker transparently selects the most suitable cluster
for rendering. The cluster level resource manager is the local dispatcher that selects the visualization
server in the cluster, and fetches the input data. This system level manages the existing clusters at a
higher level.
Depending on the rendering attributes selected by the user, the visualizing service selects the
appropriate read back component. The visualizing system provides three features: creation of video
streaming visible in the user interface; image, when the cluster renders only one image frame; and
video sequence, which is actually a movie as a set of image frames.
The client application is using the UI (User Interface) which allows the user to create a
complex scene using the object-oriented graphics rendering engine library which uses a flexible class
hierarchy. The UI allows the user to make any kind of complex scene we like with some limitations
regarding the data formats accepted for the loaded objects. Using the camera feature from the UI, the
user controls and manipulates the visualization scene. It supports the user interaction with the virtual
scene, manly concerning with camera manipulation and interaction techniques to individual scene
objects. The UI component receives commands from the user and forwards them to the rendering
nodes using a communication channel.
4.2.
Virtual Geographical Space (VGS)
4.2.1. Geographic Information System (GIS)
GIS is mainly used to operate on spatially distributed data through a computerized process.
The available operations that can be used to manipulate the spatial data are create, store, analyze and
data processing. GIS technology is used in a wide variety of scientific domains, among which some
important ones that are worth mentioning are resource management, cartography, and route
establishment.
GIS is well known for its specific methodology used to organize its managed information.
There are two types of information: graphical information, which describes the spatial placement of
studied elements, and database-based information that is used to store the associated attributes of the
elements (e.g.: a 3D model can have vertex number, edge number, polygon count, texture etc.).
16
Master Thesis - 2010
We do not work on information stored in a database for the current project, so we will focus
more on the first category of information, which is the graphical one. Graphical data can be
represented in two modes: raster or vector. The vector graphical representation (Fig. 4.2) is quite
different than the other one, since it represents images by the use of geographic primitives (dots,
segments, polygons) which are mainly characterized by mathematical equations. The raster graphical
representation of data (Fig. 4.3) is a method of describing images in software applications as matrices
that contain pixel values as elements. Without depending on the graphical representation, GIS systems
associate a geographical coordinate system to the pixel matrix in case of raster images and one to the
vectors in case of vector images. Thus, an object that is represented by an image or a vector will
always be associated to a unique position in the geographical information system that corresponds to a
geographical position in the real world.
Fig. 4.2: Vector data in a GIS system
GIS takes advantage of all interrogation opportunities that today’s modern database systems
have to offer, and can easily offer analysis possibilities based on specific geographical regions. The
impact of GIS to the population is mainly known to be positive, thus GIS software evolved rapidly
and at a high rate. There already exists a large number of products coming both from dedicated
developers such as Autodesk, ESRI, Intergraph and from open source developers (Quantum GIS,
GVSIG, OpenJump etc.).
17
Master Thesis - 2010
Fig. 4.3: Raster data in a GIS system
4.2.2. Virtual Reality (VR)
Virtual Reality represents a computer generated simulation of a 3D environment in which the
user is able to visualize and manipulate its entire content.
The word “virtual” is frequently used in research studies/experiments/software products in
computer science and the IT&C domain. It generally represents an entity/a medium that
simulates/models an entity/a medium from our reality. By “reality” we understand the natural
environment that is perceived by the human being through senses. With the use of this fact, it is
possible to simulate/model the given environment through generating or providing data perceived by
one or more of those senses. For this reasons, Virtual Reality (VR) refers to an entire system of
concepts, methods, and techniques that are used for elaborating and building software products,
having the purpose of using them through modern computing systems (computers and special
equipment). They offer a different approach through which computers and special equipments modify
the way the human being perceives the reality from a natural environment, this being by simulating or
modeling of another reality. It is known that this system/medium, this computer simulated reality
bears the name of Virtual Reality. During the last years, the grand development of multiprocessor
technology produced, in terms of computer-market, more and more powerful machines. These
machines come equipped with better graphics processing units than the previous releases at a lower
price. Thus, it can be possible that even a non-frequent user uses the software products of Computer
Graphics. The magic of a new reality usually begins with computer games and can expand ad
infinitum. It allows us to view the world around us through another dimension. The advantage of this
is that it lets us experiment different things that would be otherwise inaccessible or even non-existent
in real life. Furthermore, the world of 3D graphics has got neither frontiers nor constraints and can be
created and manipulated by any user in any way they wish. The wise move to be made is to stop and
reflect for a few moments on the fact that this world is gifted with a fourth dimension, that being our
imagination. This being known, regardless of the reached evolution stage, this will never be enough
for its users. They will always feel the need for more. They wish to step into this world and interact
with it, instead of just watching an image on the monitor. This technology becomes more and more
popular and modern and is known as Virtual Reality.
18
Master Thesis - 2010
The newly designed VR equipment tries to virtually recreate the normal functional behavior of
the human being in such a reality. This equipment is represented by the following:
3D glasses, VR headsets (HMD – Head Mounted Display), 3D monitors;
VR gloves, steering wheels, gamepads (with “force feedback”, which means that they
are able to communicate in both directions with the virtual environment);
Trackers (which follow the movement of the human body).
The main applications that are considered to be the most important ones for virtual reality are
the following:
Modeling, simulating and visualizing in the scientific domain: among the obtained
results are the image and study of different models or of phenomena that would be
otherwise inaccessible to direct observation (information fluxes, atomic structures,
meteorological systems, cosmic systems etc.); the results are mainly used in
educational software;
Experiments and simulations in the medicine domain: learning different procedures
without the risk of losing the life of a patient (e.g. surgery);
Simulation systems (simulators in general): used for training pilots, astronauts, drivers
etc.; this way, difficult maneuvers can be done, without endangering the user’s life or
the security of the vehicle cabin (plane, helicopter, car, train, water ships, space ships
etc.);
Computer aided design (CAD): in different domains, such as construction, architecture
etc.; the man in charge is able to see the results of the project in the form of an image
representation in real time, to see the details, to check whether the criteria are met, to
take decisions for modifications of parameters before the prototype is built;
Create and design computer games and animation movies.
4.2.3. VGS Context and Definition
VGS was proposed in 1999. A big difference from GIS is that VGS is a human centric
environment. From the Geography point of view, VGS is an environment that settles the relationship
between human and 3D virtual worlds. From the information systems point of view, it is an advanced
system that is able to combine GIS with VR technology.
The geographical space represents all that surrounds us, the world we actually live in. We can
try to experiment many different things from our environment directly, but its huge size will not allow
us to see an entire zone. It is pretty tough to do such experiments in such conditions. The experiments
can be easily done if we could view the entire scene. Cartographic maps have been used throughout
time for communicating the necessary spatial data, thus offering a visual representation of a world that
is too big to be directly viewed. The problem with these maps is the fact that they are not able to
contain enough information to represent an environment in its full 3D aspect. For this reason, certain
visual elements which should have a greater importance are usually omitted.
A VGS is defined as a virtual representation of a real world that allows a person to explore and
interact with a vast quantity of cultural and natural data. Compared to the 2D maps and the GIS
system, VGS is a human-centric world. The geo-spatial information is different than other type of
information because of its unique abilities to describe spatial/terrain modifications. Thus, dynamic and
multidimensional analysis methods are very important in order to explore spatial problems.
VGS is a multidimensional describing space that includes almost any type of information: text,
2D maps, 3D GIS, 4D animations. It is proven to be the most efficient interface between human and
computer for geographical data communication. The technologies of human-computer interface
include visual/audio/tactile interfaces, user input, thus VGS can simulate the interactions from the real
world. This leads to discovering new methods for understanding the real world and GIS. VGS
19
Master Thesis - 2010
supplies multidimensional and multisensory user-interfaces through which the intended purpose is to
ease multidimensional datasets browsing and visual context exploration.
In order to create a 3D virtual environment, one can use VRML (Virtual Reality Modeling
Language). The initial purpose of the language was the transition from a Web text-type interface to
one with three dimensions, being in permanent interaction with the user.
Nowadays, VRML is rewritten in XML (Extensible Markup Language) terms, the new version
having the name X3D. Instead of browsing pages with static images and following hyperlinks, the
users are able, for example, to browse hallways and manipulate objects, using a special visualization
helmet (Head-Mounted Display) and a VR glove for “communication” with the environment.
Recently, the Virtual Retinal Display (VRD) made its way to the top of the 3D equipment tools in
order to be used for a better exploration of the 3D virtual space.
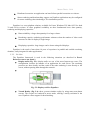
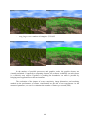
4.2.4. Visualization Scenarios in VGS
Any real geographical space can be transposed to the virtual world in one way or another. But
after the virtual world is created, it is important to be able to visualize it in the easiest way possible.
In order to experiment our integrated system, first of all we developed an object-oriented
application used for building different VGS scenarios with different complexity. For this objective we
used the object-oriented graphics rendering engine Ogre.
The most intuitive way is to allow the user to press some keys that resemble the arrows and
move in the corresponding direction. This solves the movement part. But the application should also
allow the user to view the scene from a single spot by rotating to the left or to the right or even up and
down. This is done by implementing a mouse functionality that will allow these specific rotations to
take place. The whole scene can be viewed from two perspectives: a 3rd or a 1st person perspective.
First person perspective refers to the perspective rendered from the point of view of the user.
Applications with a first person perspective are usually avatar-based: the screen displays what the user
would see with their own eyes if they were actually placed in the 3D environment. Thus, users do not
see the avatar’s body, although they may see some parts of it, like hands, feet, maybe a weapon if the
application provides one. This viewpoint is generally used to display the perspective of a driver inside
a vehicle. Considering this perspective type, the application does neither require sophisticated
animations, nor complex model with lots of details for the avatar. This is a good way to make room
for improving the details of the surrounding world. A first person perspective allows for easier aiming,
since there is no representation of your avatar in the way. The disadvantage of the lack of a fully
visible avatar is that it makes difficult to master the actual positioning in the virtual world. Some
people also experience motion sickness from this perspective.
Third person perspective refers to the perspective rendered from a fixed distance behind and
slightly above the avatar character. This viewpoint allows users/players to see a more strongly
characterized avatar, and is most common in action or action adventure games. There are three types
of third person camera systems:
Fixed – the camera positions are set during project development
Tracking – the camera follows the avatar character, usually staying behind it
Interactive – the camera is under the user’s control
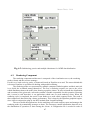
The avatar control is done by using the mouse and the keyboard. The keyboard is used in
order to move the avatar left, right, up, down, front and back and the mouse is used to control the
camera so the user is able to visualize every part of the surrounding environment. The keys for
controlling the avatar are the standard ones which are used in almost every computer game these days,
i.e. W (front), A (back), S (left), D (right), Q (down) and E (up). Thus, every user will easily adapt to
the avatar control of the project since it is a well known standard (Fig. 4.4). The camera is also the
20
Master Thesis - 2010
same as in most general computer games and similar applications: when moving the mouse left, right,
up or down, the camera turns to face the corresponding direction.
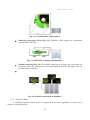
The avatar model is represented by a 3D object (character), in this case, a robot. The robot
has a few animations that represent the state it is currently in: idle, when the robot stays still and no
scenario was selected, and walking, when the robot is executing a scenario and has to walk on the
specified trajectory. The robot model is used only when a scenario is specified, so it will start walking
once such a scenario was given. During the initial phase, when the user specifies a scenario or wants
to simply walk around the virtual 3D environment with the directional keys and mouse movement, the
avatar character does not follow; it will just stay still, as opposed to the camera which will execute the
requested movement.
The camera control is generally set on free movement that is it can be moved freely around
the environment without a specific relation to the previously mentioned robot. When the “Start
scenario” button is pressed, the camera positions itself at the same point as the robot (avatar). The
avatar starts walking following the scenario rules and the camera does the same. The camera is
implemented as to be in a first person view at the start of the program – the user looks through the
avatar’s eyes – and if the user wants, they have a free hand into modifying it to a third person
perspective. Thus, the keys and mouse control remain active during the scenario execution. If the user
modifies the camera position, there is the possibility that they want to revert it back to a first person
perspective, from the avatar’s perspective. As a failsafe mechanism, the camera is programmed to go
back to its original position (i.e. the position of the avatar) each time it meets a new point in the 3D
environment where it must change direction.
Fig. 4.4: Visualization Scenario using Ogre
Scene selection can be done at any time during the application is running, with the exception
of a scenario executing process. The GUI provides a list of existent scenes which can be loaded and
the user will have to choose one scene file from that list. In order to get a friendly user interface, the
21
Master Thesis - 2010
CEGUI library is used. Crazy Eddie’s GUI, also known as CEGUI, is a graphical user interface C++
library. It was designed especially for video games, but since it has a large variation in terms of
functionality, it can be used for other similar applications. The flexibility in look-and-feel makes it
easy to integrate and adapt to the application purposes. The strong point of CEGUI’s design is the
configurability. It interfaces with windows, display text and similar components through user-defined
code, though there is a number of modules included for using certain components and libraries.
CEGUI can be used in almost any kind of resource management system or operating environment.
The input is gathered by the user code and then it is sent to the CEGUI for processing. The rendering
part is done by a back-end module. It is important to mention that the CEGUI source code comes with
modules for Direct3D, OpenGL, OGRE 3D engine and Irrlicht engine, but if the user wants, they can
write their own custom module for other engines.
When the user sets the parameters in the client application, one of the parameters implies the
selection from three different visualizing methods: a video streaming visible in the interface, an
image when the cluster renders only one image frame and a video represented by a sequence of
images. When the visualization method is chosen, it can also be customized. For example, the user
will be able to specify the resolution at which the output file is rendered, or if the result is a video,
they can also specify the number of FPS (frames per second).
The data model of the application consists of the VGS scene files that are mainly stored on the
server. The client application has to be aware of those scene files in order to know what the
environment looks like, so it requests them in some form. Because of the low hardware resources, the
previously mentioned request returns an XML file.
In order to be able to parse such a file, the program includes a special class, i.e. the
DotSceneLoader class. The name comes from the extension of the input files (*.scene). Here is a
sample part from an input file that represents the way an XML file should look in order to be
compatible with the project:
<node name="Ninja1" id="1">
<position x="-800.0" y="0" z="0" />
<rotation qx="0" qy="-1" qz="0" qw="1" />
<scale x="1" y="1" z="1" />
<entity name="Ninja1" meshFile="ninja.mesh" static="false" />
</node>
Every object that is included in the scene is represented by an entity. Each entity is attached to
a node in the scene graph. As the code implies, each entity has a name which has to be unique from all
other entities existent in the entire project. If an entity name appears more than once, the application
prints an error message and crashes. Besides the name, the entity will be told what object to load. In
this case, it will be an object with the “mesh” extension.
Besides the entity, which is the most important part of the node since it describes the actual
object that is displayed on the screen, the XML file requires that each node has the name, id, position
and rotation specified. The entity name restrictions are also applied to the node. This means that nodes
must have a unique name, different from the rest of the nodes. This way, a node can be easily
manipulated (translated, rotated, deleted etc.) if it is selected by its name. The nodes can also be
manipulated by their id.
The position of each node is set by giving values to the corresponding x, y and z coordinates.
The object will be placed at the specified position in the 3D environment. The rotation parameters are
similar to the position ones. They represent the rotation on all axes. The rotation parameters allow the
objects to face a specific direction in the VGS. The scale is always present in the node description of
22
Master Thesis - 2010
an object. This attribute specifies the actual size of the 3D model. The values can vary from 0, which
represents the smallest size possible, up to 1, which represents the largest size possible. Real values
should be set for each of the three axes.
Not only 3D objects can be attached to nodes, but also lights, spotlights, cameras, almost
anything that has a position and can be rotated in the VGS. When attaching a light source to a node,
the code is slightly different: it will not contain an entity and its attributes, but instead specific code is
used. An example follows:
<light name="Omni01" type="point" intensity="0.01" contrast="0">
<colourDiffuse r="0.9" g="0.0" b="0.0" />
<colourSpecular r="0.9" g="0.0" b="0.0" />
</light>
Each light that is placed in the scene, must be given an intensity and contrast value. Another
important setting is the specification of the diffuse and specular color. These set the RGB values for
each of them independently.
The above sample code was only for demonstration purposes, thus it does not represent the
entire complexity that can be done for the input scene files. An important and useful aspect is that
each node can have children nodes. This means that when setting the position of the children nodes,
they will be placed relative to the parent’s position. The same goes for the rotation of the children
nodes. When such a node is rotated, its rotation will be relative to its parent.
All these operations, tools and techniques represent an interactive language through which a
movement scenario can be created.
4.2.5. Object-oriented graphics rendering engine integration
In order to render and interact with high-resolution geographical data sets and complex models
of virtual geographical space, in the beginning the challenge was to find an object-oriented graphics
rendering engine to make it easier and more intuitive for us to produce applications utilizing hardware
– accelerated 3D graphics. The class library we found in object-oriented graphics rendering engine
abstracts all the details of using the underlying system libraries like Direct3D and OpenGL and
provides an interface based on world objects and other intuitive classes. It is very important to remark
that this library uses a flexible class hierarchy allowing us to design plug-ins to specialize the scene
organization approach taken to allow us to make any kind of complex scene we like.
On the other hand, from the point of view of the graphical cluster we modified the Equalizer
framework which is an open source parallel rendering framework in order to solve the integration with
the graphics rendering engine. The applications based on the framework we obtained after the
modifications provide better performance and allow visualizing complex data sets.
The solution of integrating graphics rendering engine applications in cluster based architecture
using the parallel rendering framework is the main concern of the research reported by this thesis.
4.2.6. 3D Objects Modeling
3D modeling is a process through which a mathematical or a wireframe representation is
created for a 3D object with the help of a specialized software tool. The resulted product is known as
the 3D model of the object. The 3D model can be viewed as a 2D image, by applying the process
called 3D rendering.
23
Master Thesis - 2010
The 3D models can be created manually or automatically. By manual model creation we
understand a basic process that implies manual placement of vertices, surfaces, and edges in order to
create the desired model. It is similar with sculpting. The automatic way for building models implies
the use of algorithms. This method is easier to use because when you apply such an algorithm, the
model that will result will be identical every time. The only problem is to find or to implement one.
From the point of view of the representation, 3D models are divided in two categories. Solid
models are the most realistic approach, but also the most difficult one to obtain. They represent an
object with its entire volume, meaning that even the inside composition is built. The second category
is shell/boundary. The main difference between this and the previous representation is that shell
models are, as the name says, empty on the inside. Only the outer layer is designed. Most 3D
animations and games use this representation, since it is less resource consuming and the viewer is not
interested in seeing the interior part of the models.
There are five popular ways to represent a model:
Polygonal modeling – the vertices are connected to each other through segments, thus
forming a polygonal mesh. Many 3D graphics software programs use this technique
(3D Studio Max, Blender). The advantage of this representation is that the resulted
models are very flexible and are easily rendered by computers. The disadvantage is that
the curved surfaces of real objects are only approximated by polygons (planar
surfaces).
NURBS modeling – NURBS surfaces are created by using spline curves. These curves
have weighted control points that are used in order to pull such a curve closer to a
desired point. Unlike the polygonal model representation, NURBS modeling offers
really smooth surfaces of every detail of the model. No approximations are done. This
technique is mainly used for organic modeling. From among the software programs
that use NURBS, the most well-known are Maya, Rhino 3D and solidThinking.
Splines & Patches modeling – they are similar to NURBS; they also use curved lines,
but when talking about flexibility, patches are placed between NURBS and polygonal
modeling.
Primitives modeling – this way of modeling uses geometric primitives in order to build
more complex models. Such primitives include spheres, cylinders, cones, and cubes.
The main advantage for this procedure is that all the main primitives are well defined
and can be mathematically represented, thus obtaining an exact replica of objects from
the real world. It is mainly used for technical applications, where models have specific
and well designed forms. There are software programs, like POV-Ray, that use this
type of modeling representation.
Sculpt modeling – it is the newest representation methodology from all of those
mentioned in this section. Despite this fact, it is quite popular among the graphics
designers. Currently, the sculpt-modeling technique exists in two types: displacement
and volumetric. Sculpting is done in software programs like ZBrush. The result is a
model with a very detailed design and having high resolution information.
4.2.7. The Scene Graph
A scene graph is a general data structure that is frequently used for vector applications,
designed for graphical editing, and modern video games. Some examples of such programs that use
this data representation model are the well known AutoCAD, Adobe Illustrator, Acrobat 3D, and
CorelDRAW.
A scene graph is a hierarchical structure that manages the logic and spatial representation of a
graphical environment in a collection of nodes. The nodes can be represented by graphics objects,
24
Master Thesis - 2010
lights, text, sounds, or even transformation operations such as rotation, and translation. Each node can
have a number of children, and in most cases only one parent. A parent node can represent a
transformation operation; in this case, its effect will be felt by all of its children.
For the implementation step, a transformation matrix is used. At each level in the graph, there
exists such a matrix. In order to naturally and efficiently process such operations, one will have to
multiply the required transformation matrices. The scene graph is a way to represent complex graphics
environments by the use of elementary objects.
In order to implement a scene graph for a given 3D application, the easiest way is to design a
list-type structure. Then, in order to show the graphics objects or to execute operations, the given
structure is linearly iterated (one by one). As it can be deduced, when dealing with more complex
environments, this methodology can become quite slow. Thus, another structure type is used, the treetype structure, and the composite design pattern in order to maintain a hierarchical relation among the
group/leaf nodes. Group nodes can have any number of children and represent transformation
operations, while leaf nodes are the ones that actually get rendered and represent the results of the
operations.
The graph traversal represents the strongest point and the reason for using such a scene graph.
Each traversal operation begins from a start node (root node), the operation contained within is
executed (usually, the update and render operations for an object are consecutive) and then all the
children-nodes are recursively visited until a leaf node is reached. Currently, most scene graphs are
traversed in a bottom-up fashion. For example, in the case of rendering, a Pre-Render operation is
done while recursively reaching all the nodes and a Post-Render operation is executed when a leaf
node was reached and the bottom-up traversal is started.
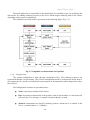
4.3.
Virtual Geographical Space Model
A virtual geographical scene recreates a real environment by a subset of graphical models that
simulates the physical objects. In the following paragraphs, we will define a conceptual model and an
XML based representation.
The components that define a geographical space are the graphical models that represent
objects from the real world and the dependencies between these objects. For example, we can define a
virtual geographical space as a terrain that has some parameters such as geographical area coordinates
(that implies some restrictions), and different objects such as trees, water areas, houses etc. All of
these objects may have specific attributes and parameters.
25
Master Thesis - 2010
Root
Transformations
Transformations
Object
Group
Object
Object
Fig. 4.5: Graph-based structure of the VGS model
The specification of a virtual environment must integrate the concepts of virtual objects, object
space transformations, constraints and dependencies between virtual objects. The virtual object
depicts a representation of real objects, which have attached different attributes. The object instance in
the virtual space is the result of transformations, translation, rotation and scaling on the basic object
definition. The system creates automatically the virtual model as a collection of object instances. In
order to recreate a correct representation of the real world, we can use constraints. For example, a
specific type of vegetation may appear only in conjunction with a specific geographical area.
A graph-based model (Fig. 4.5) describes the conceptual model. The graph nodes represent the
objects and the arcs represent the dependencies between nodes. For example, the root node may
represent the virtual space ground, or terrain, which is populated by different objects. The next level
may represent a group of objects, for example a forest that is composed also by a set of different
objects, like trees, flowers etc. The attributes that must be specified for every node are the name of the
node, some textual description, an area in which are created the objects (that represent the space
occupied by the objects, for example we can define an area in which are randomly generated trees)
and also restrictions (for example in which limits we can generate the objects).
For storing this description, we use a XML based format that allows the description of nodes
and arcs. As stated previously the nodes contain information about objects and the arcs describe the
dependencies between objects. We have adopted the 3D graphical model representation to define the
virtual objects. The polygonal representation of the objects, together with the associated textures,
offers a quite good and economical solution for the representation of the real world environment. The
major drawback of this solution is related with the high resolution. The model is very complex in
terms of vertices and polygons and on a single machine the visualization can be problematic. On the
other hand, in a cluster based visualization system it offers a very good performance related with the
visual accuracy.
An important feature is that the scene graph must be able to integrate also dynamicity. By this
way, that is the subject of future research, we could describe animation and simulation parameters.
The physics processors support the simulation of real natural phenomena (e.g. wind, cloud movement,
water flow etc). In order to include animation the scene graph must also include flow control
structures.
26
Master Thesis - 2010
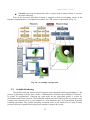
4.4.
Use Case Scenarios for building 3D complex scenes
The Ogre application we developed for building different 3d scenes with different complexity
has an important purpose for testing the system architecture. This section provides information on
how the current application is used by the user. Some use case scenarios will be described shortly,
while others (more complex ones) will be presented with more details by presenting both the basic and
alternative flows.
4.4.1. Visualization Scenarios
Use Case 1: Select Scene
This use case scenario represents the situation in which the user must select a scene for the
application. A list is provided by the system’s CEGUI which contains all the available 3D scenes
which can be chosen. After the user clicks on one scene name, it will be instantly loaded on the
screen. The previous existent scene will be unloaded. Since the client machine may not have the
necessary resources in order to render the entire scene, only the bounding boxes of all the objects will
be loaded.
Use Case 2: Select Resolution
When choosing the output result, the user has the possibility to select the resolution of the
rendering material. There are three types of resolutions: small (320*240), medium (640*480) and
large (1024*768).
Use Case 3: Start Visualization Scenario
Primary Actor: Equalizer cluster
Secondary Actors: Broker component, Rendering server
Basic Flow:
1. The client application sends a start message with the name of the scene file to be
visualized and the resolution at which the rendering must be done.
2. The broker component copies the file with the designated graphics environment on all
the nodes where the partial rendering takes place.
3. The broker component starts the server node where the final rendering and composition
operations are done.
4. The server node sends a message to all the necessary rendering clients, so they can start
the parallel rendering application.
27
Master Thesis - 2010
5. The graphics cluster executes in parallel the rendering operation of the scene and gets
the final rendering result on the server node.
6. After obtaining the video result, the rendering server encodes it in MPEG-2 video
format.
7. The rendering server sends the encoded video file to the client machine, where a video
player will permit its visualization.
Alternative Flow:
1. One of the processes necessary to start the graphics cluster fails.
2. The file containing the scene graph is not represented in a valid format and it cannot be
loaded in the application.
28
Master Thesis - 2010
5.
5.1.
TECHNOLOGICAL CONSIDERATIONS
Object-Oriented Graphics Rendering Engine
Object-Oriented Graphics Rendering Engine, also known as OGRE, is a scene-oriented,
flexible 3D rendering engine written in C++. It is designed as being easy to use and learn by even the
beginner programmers who want to create applications that use hardware-accelerated 3D graphics.
The class library abstracts the details of using the underlying system libraries like Direct3D and
OpenGL and provides an interface based on world objects and other high level classes.
OGRE has a very active community. It was Sourceforge.net’s project of the month in March
2005. It has been used in several computer games, such as Ankh and Torchlight. The first version of
Ogre (1.0.0 named “Azathoth”) was released in February 2005. The current release is 1.7.1, named
“Cthugha”, was released on the 25th of April 2010.
5.1.1. Introduction
OGRE is an open source rendering engine. Its main purpose is to provide a suitable option
when dealing with graphics rendering. It includes several facilities, such as vector and matrix classes,
or memory handling, but they are not the main part of it. Considering this fact, it does not have audio
or physics support. Programmers which use this engine for creating their own games should also
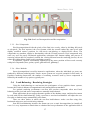
include frameworks for this kind of support.
Despite being excellent at what it does and providing a large number of features (Fig. 5.1), this
is one of the main drawbacks of OGRE. Some people actually consider it as an advantage since they
are free to choose the desired libraries for physics, audio or others. Even more, it allows the
development team to focus on the graphics part of the project rather than distributing their efforts
among several systems. It is widely known that OGRE supports the OIS, SDL and CEGUI libraries.
They are used for key input events or user interfaces.
29
Master Thesis - 2010
Fig. 5.1: Screenshot from the official OGRE Demos pack. Rendering options: 1600*1200 pixel
resolution, OpenGL renderer, 32-bit color depth
Shown below is a diagram of the core objects and their position in the grand scheme of OGRE
(Fig. 5.2). This is just an example of the most significant structure, in order to give the user an idea of
the big picture.
Fig. 5.2: Example of OGRE core objects UML diagram
The top of the diagram is represented by the Root object. This represents the “way in” to the
OGRE system. It is where you create the top-level objects that you need, i.e. scene managers,
rendering systems, rendering windows, loading plug-ins etc. It is considered as having the role of an
organizer of the rest of the objects.
The majority of the other OGRE classes can be grouped in 3 main categories:
Scene Management: it represents the contents of the scene, the way it is structured,
how it can be viewed from cameras etc. The objects which are created here offer an
“interface” of the world you are building.
Resource Management: this is the place to store the needed resources, whether they
refer to geometry, texture, fonts or any other resources.
Rendering: takes care of the actual representation of visuals on the screen.
30
Master Thesis - 2010
There is also a number of plug-ins scattered around these three categories. OGRE was
designed to be extended, and plug-ins are the usual way to go about it. This way, OGRE is not just a
solution for one specifically defined problem; it can be extended to about anything you need to do in
terms of graphical applications.
5.1.2. Features
OGRE, as its name implies, is an object oriented engine. It was previously mentioned that it
was designed with a plug-in architecture that allows the easy addition of features, thus making it
highly modular. OGRE is also a scene graph based engine that supports a large variety of scene
managers, some of which are octree, BSP and a Paging Landscape scene manager.
It is fully multi-platform, supporting both OpenGL and Direct3D applications. It is able to
render the same content on different platforms while the programmer does not have to mind the
differences between them. This reduces the complexity of deploying an application on multiple
systems. There exist pre-compiled binaries for most operating systems, i.e. Linux, Mac OS X and all
major versions of Windows.
The animation engine supports hardware weighted multiple bone skinning, which can be fixed
across several poses for full pose mixing.
The libraries feature memory debugging and loading resources from archives. There are
content explorer tools available for most 3D modelers including 3D Studio Max, Maya, Blender,
LightWave, MilkShape, Sketchup and others.
5.2.
The parallel rendering framework – Equalizer
The main purpose of the Equalizer Graphics Cluster is to be used in applications in order to
accelerate the rendering process of a 3D environment, using more than one machine/graphics
accelerator. With the help of Equalizer, one can create parallel OpenGL applications, i.e. it allows the
applications to use several graphics cards, processors and computers in order to increase the rendering
performance. An Equalizer-based application runs identical on a simple computer or on a large
specially designed cluster.
5.2.1. Introduction
As we know, hardware performance used for graphical rendering has reached high evolution
levels in the past decade. But we cannot say the same thing about the CPU hardware performance.
When talking about 3D complex objects rendering, one video card cannot achieve the desired result.
Distributed processing by the help of clusters has become a key technology with respect to high
speed computing. Equalizer is used in order to help graphics visualization applications so that they can
make use of this key technology. It was described by Stefan Eilemann, the project leader, as being a
“GLUT” for multi-GPU systems and visualization clusters.
An application that uses the Equalizer framework will have following advantages:
Runtime configuration: the rendering system is configured at runtime, by using a
standard configuration file.
Runtime scalability: an application can use the entire computing power of more than one
processor, video card, or computer in order to achieve high performance and high
quality.
31
Master Thesis - 2010
Distributed execution: an application can benefit from parallel execution on a cluster.
Stereo-rendering and head-tracking support: an Equalizer application may be configured
for stereo rendering, thus simulating a 3D visualization process.
Equalizer is a cross-platform solution, available for Linux, Windows XP, Mac OS X for both
32 and 64 bit versions. It offers graphical scalability on three fundamental axes: data quantity,
rendering and displaying capacities.
Data scalability: a larger data quantity for a larger cluster.
Rendering capacity: rendering performance enhances when the number of video cards
increases in order to display a single image.
Displaying capacities: large images can be shown using tiled displays.
Equalizer is the result of more than 10 years of experience in parallel and scalable rendering
domains, easily integrated in other applications.
5.2.2. Use Case
The Equalizer framework is used in the following situations (as described in Error!
Reference source not found.):
Display-walls (Fig. 5.3): display-walls are one of the most frequent use cases. The
configuration executes an instance of an application for each screen. The rendering
processes are done locally and the result of the node rendering is sent directly to the
screen, without passing them through the network.
Fig. 5.3: Display-wall for Equalizer
Virtual Reality (Fig. 5.4): these systems simulate reality by using many non-planar
screens. The screens are rendered in stereo mode, offering a reality sensation to the
user. Equalizer offers support for head-tracking.
32
Master Thesis - 2010
Fig. 5.4: Virtual Reality with Equalizer
Rendering using more GPUs (Fig. 5.5): Equalizer offers support for workstations
with more than one GPU.
Fig. 5.5: Multi-GPU rendering with Equalizer
Scalable rendering (Fig. 5.6): for scalable rendering for a single view, more than one
processor, video card, workstation is used. Algorithms such as 2D, DB, Dplex, Eye can
be used in these situations.
Fig. 5.6: Scalable rendering with Equalizer
5.2.3. Execution Model
A rendering Equalizer-based system is composed of the main application, a server and a
number of rendering nodes.
33
Master Thesis - 2010
The main application is responsible for the global logic, for handling events, for modifying the
data model, for sending rendering requests to the server which assigns rendering tasks to the clients,
depending on the system configuration.
The simplified execution model is presented in the following figure (Fig. 5.7):
Fig. 5.7: Simplified execution model for Equalizer
5.2.4. Configuration
The system configuration is done through configuration files. The rendering resources are
represented through a tree hierarchy. The resource management model is configured with the help of
the component tree, which is a hierarchical representation of decomposition and recomposition across
the resources.
The configuration elements are presented below:
Node: represents a machine in the cluster.
Pipe: represents an abstraction of the graphics card in each machine, so each node will
have one pipe. For each pipe, a separate execution thread is created.
Window: encapsulates an OpenGL rendering context, which can be a window in the
OS, or a virtual window, i.e. a PBuffer.
34
Master Thesis - 2010
Channel: represents an abstraction of the viewport in the existing window. It executes
the actual rendering.
Each of the previously described elements is mapped to their corresponding classes in the
Equalizer implementation. A configuration example for a VR system is represented in Fig. 5.8.
Fig. 5.8: An example configuration
5.3.
Scalable Rendering
The parallel rendering framework used supports many important rendering algorithms (i.e. the
process of generating an image from a model – mathematical wireframe representation of 3D objects by means of computations). Choosing the right mode for the application profile is critical for
performance and actual execution. The traditional methods used for rendering, like ray-tracing or raycasting work extremely slow on one computer so, using Equalizer they are reconstructed in parallel
rendering algorithms. The parallel rendering exectution relies on the subdivision of work in many
processes that run in parallel and using cluster machines compose the results.
35
Master Thesis - 2010
The main rendering methods we used in this thesis and supported by the Equalizer framework
are:
5.3.1. 2D/Sort-First Rendering
2D or sort-first method decomposes the rendering in screen-space, that is, each contributing
rendering unit processes a 2D “piece” of the final view. The recomposition simply assembles the tiles
side-by-side on the destination view.
This mode has a limited scalability due to the parallel overhead caused by objects rendered on
multiple tiles.
The advantage of this mode is a low, constant IO overhead for the pixel transfers, since only
color information has to be transmitted. It is also defined as a “2D – space division rendering”.
An Equalizer-based application was create for the purpose of explaining this type of rendering.
Figure 5.9. presents this rendering mechanism on such an example.
Fig. 5.9: Sort-first decomposition and Re-composition
5.3.2. Sort-Last Rendering
Sort-last rendering decomposes the rendered structure across all rendering units, and
recombines the partially rendered frames. This allows lowering the requirements on all parts of the
rendering pipeline: main memory usage, IO bandwidth, GPU memory usage and other performance
measurements. Therefore, this mode scales the rendering very well, but the re-composition step is
expensive due to the amount of pixel data processed during re-composition.
The image below shows an example of sort-last rendering. The computer in the top left corner
is the master computer. This means it is responsible for receiving the images created by the other
computers, and then compositing them into a final image, which it displays on its own monitor.
With Equalizer methods, the application has to portions the database so that the rendering units
render only a part of it. Some OpenGL features do not work correctly (ant aliasing) or need special
attention (transparency).
36
Master Thesis - 2010
Fig. 5.10: Sort-Last Decomposition and Re-composition
5.3.3. Pixel Compounds
Pixel decompositions divide the pixels of the final view evenly, either by dividing full pixels
or sub-pixels. The first 'squeezes' the view frustum, while the second renders the same scene with
slightly modified camera positions for full-screen anti-aliasing or depth-of-field effects. The
compounds are somehow similar in functionality with the 2D unit processes. Pixel compounds only
work very well for purely fill-limited applications; techniques like frustum culling (the process of
removing objects that lie completely outside the viewing frustum from the rendering process) do not
reduce the rendered data for the source rendering resources.
In Equalizer, OpenGL functionality influenced by the raster position will not work correctly
with pixel compounds (lines, points, sprites, glDrawPixels, glBitmap).
5.3.4. Other Methods
Stereo decomposition is used for immersive applications, where the individual eye passes are
rendered by different rendering units. Passive stereo systems are a typical example for this mode. In
Equalizer rendering framework, the number of rendering resources used by stereo compounds is
limited by the number of eye passes, typically two.
5.4.
Load-Balancing – Rendering Strategies
Using the load-balancing we can increase the performance of our graphics cluster systems,
because this results in balanced computational work among different machines.
For optimal rendering performance sort-first and sort-last compounds often need loadbalancing while pixel and stereo compounds are naturally load-balanced.
Some applications do not support dynamic updates of the database range, and therefore cannot
be used with sort-last load-balancing. Using a sort-first or sort-last load-balancer will adjust the sortfirst split or database range automatically each frame.
There are three modes in which the sort-first load-balancer works: sort-first using tiles,
horizontal using rows and vertical using columns.
Sort-first load-balancing increases the frame-rate over a static decomposition in virtually all
cases. It is very important to remark that we obtained the best performance if the application data is
37
Master Thesis - 2010
relatively uniformly distributed in screen-space. In order to fine-tune the algorithm we can use a
damping parameter.
From the point of view of the sort-last load-balancing it is known that this rendering strategy is
beneficial for applications which cannot precisely predict the load for their scene data. For example
when the data is non-uniform.
On the other hand a static sort-last decomposition typically results in a better performance if
we have a volume rendering example with uniform data. Considering that a segment represents a
single display (a projector or monitor) and that it references a channel (has a name, viewport and
frustum) is important that each segment of a multi-display system has a different rendering load and it
depends on the data structure and model position. The channel referenced by the segment defines the
output channel. In the case we use a static assignment of resources to segments the overall
performance is determined by the segment with the biggest load. The solution is presented in our
experiments related to load-balancing performances.
Regarding the wrong balancing, some configurations require a smoothing of the frame-rate at
the destination channel, otherwise the frame-rate will become periodically faster and slower. Using a
frame-rate we will smooth the swap buffer rate on the destination window for optimal user experience.
On the other hand the dynamic frame resolution trades rendering performance for visual
quality. In order to keep the frame-rate constant the rendering for a channel is done at a different
resolution than the native channel resolution. The solution is that dynamic frame resolution adjusts the
zoom of a channel, based on the target and current frame-rate. For instance, volume rendering and
ray-tracing which are fill-rate bound applications are usually using dynamic frame resolution. For
example, the key for obtaining ten frames per second instead of five is that the model is rendered at a
lower resolution and upscaled to the native resolution for display.
Concerning the rendering quality we have to note that it is slightly degraded, while the
rendering performance remains interactive. It renders a full-resolution view when the application is
idle. The dynamic frame resolution will also upscale the resolution if the parameters allow for it. In
conclusion, it does not have a limitation in order to downscaling the rendering resolution. Beside this
upscaled rendering which will down-sample the result for display, provides dynamic anti-aliasing at a
constant frame-rate.
5.5.
Video Compression
Video coding necessity in the case of remote viewing is obvious. Without video coding, it
would be necessary to use a very large bandwidth. We also need a method that helps us transmit in
real-time. MPEG-2 was chosen, because it is a widely used standard, even in TV industry.
5.5.1. MPEG-2
MPEG-2 is both a video and audio compression standard developed by Moving Picture
Experts Group (MPEG). It resembles a combination of compressions with audio and video loss that
allow video storage on reduced space media.
The MPEG-2 format is used in digital TV transmissions and for video compression on DVD.
MPEG-2 actually represents an addition to the MPEG-1 standard, supporting variable bit-rate and
interlaced module.
Elementary Streams (ES) are audio or MPEG video bit streams. An ES can have just one
type of information: video or audio. These files can be distributed in this manner, just like in the case
of MP3 files. Moreover, the elementary streams can be made more robust by packing, independent
piece division, and by adding a cyclic redundancy check (CRC) to each segment for error detection.
This structure is called Packetized Elementary Streams (PES).
38
Master Thesis - 2010
Program Streams (PS) combines more Packetized Elementary Streams into a single stream,
thus assuring their simultaneous and synchronized delivery. In order to generate Program Streams, a
multiplexer interpolates two or more PESs. Thus, the packages of simultaneous streams can be
transferred through the same channel and will reach the decoder at the exact same time.
A complicated and an important task is to determine the data quantity of each stream that must
exist in each interpolation segment (interpolation size). The improper interpolation can lead to the
overloading of the buffer; in this situation the decoder will receive more than it can store (e.g. audio)
before receiving enough data in order to decode the other simultaneous streams (e.g. video).
Before encoding a video to the MPEG-2 format, the color space must be transformed to
Y’CbCr (Y’ = Luma, Cb = Chroma Blue, Cr = Chroma Red). This color space is used to separate out
a luma signal (Y’) that can be stored with high resolution or transmitted at high bandwidth, and two
chroma components (Cb and Cr) that can be bandwidth-reduced, subsampled, compressed, or treated
separately by improved system efficiency.
The human eye is less sensible to color than it is to luminance. Thus, the chroma components
can be partially eliminated. This procedure is called chroma subsampling. There are many schemes
for the subsampling procedure, such as 4:4:4, 4:2:2, 4:1:1, 4:2:1, and 4:2:0, the last one being used for
MPEG-2 encoding. For 4:2:0 subsampling, the Cb and Cr component resolution is cut in half both
horizontally and vertically, thus having for each 4 value grup of Luma, only one value of Cr and Cb
(Fig. 5.11).
Fig. 5.11: Example of Y’CbCr subsampling
MPEG-2 contains many types of frames, each serving its own purpose. The most important of
them are the I-frames (intra-frames). Their name comes from the way they can be decoded, i.e.
independently. I-frames can be considered identical with JPEG images.
High speed navigation in a MPEG-2 video is possible only to the closest I-frame. Videos
containing only I-frames are used in editor type applications. Their compression is done very quickly,
but the result is a very large file – it can reach up to 3 times the size of a normal MPEG-2 file. The
distance between two I-frames is called Group of Pictures. Usually MPEG-2 uses a GOP size of 1518, which means that there are 14-17 frames which are not if type I-frame, but a combination of Pframes and B-frames, which will be discussed in the following.
P-frames (predicted-frames) are used in order to improve compression, and are based on the
fact that not all pixels are changing from one frame to another. P-frames store only the differences
from the previous frame, which can be also a P-frame or an I-frame. If there is not a large difference
between frames, the most efficient solution is that the new frame should be an I-frame.
39
Master Thesis - 2010
The third type of frames is the B-frames (bidirectional-frames). They are similar with Pframes, but they can refer both previous and next frames, so, before displaying it, a player has to read
the next I or P frame after it has read a B-frame. This requires a more complex computational logic,
and larger size buffers, which slows down the process by increasing the time necessary to encode and
decode a video.
Fig. 5.12: An example of frame types and references in MPEG-2 compression
A macroblock represents a 16x16 pixel region from an image and it is the smallest
independent unit within a video. If the size of the video does cannot be divided to 16, there will be a
row of macroblocks which should be encoded, so the information contained in those regions is not
lost. This phenomenon should be avoided because it leads to a waste in the encoding.
In order to eliminate spatial redundancy in a video, only changing blocks are memorized. This
procedure is called conditional overwriting. The sudden movement of the camera, or of other objects,
would lead to a large number of blocks to be changed. This problem can be overcome by motion
estimation through vectors, resulting in the elimination of a large volume of redundant information.
Motion vectors operate at the macroblock level.
The encoder compares macroblocks from the previous frame with macroblocks from close Iframes or P-frames situated at a predefined distance. In case the macroblock is found in these frames,
only the motion vector is memorized, which is composed of direction and distance. The inverse
operation of this process is done in the decoding phase and is known as motion compensation.
Each 8x8 pixel sized block is encoded by applying the Discrete Cosine Transformation (DCT),
followed by a quantization method. Theoretically speaking, the DCT process is without losses and
reversible by applying the Inverse Discrete Cosine Transformation (IDCT). Practically speaking, in
the quantization phase during coding, a number of rounding errors can arise. The DCT process
transforms an uncompressed block of size 8x8 in another block of the same size with values of
frequency coefficients. DCT can be computed by the use of the following formula:
Formula 5.1: DCT computation
40
Master Thesis - 2010
When this method is applied, an algorithm with O(n2) complexity is resulted. There is a more
efficient method, called Fast Cosine Transform (FCT), using Fast Fourier Transform (FFT). The
quantization process consists of reducing the accuracy of the signal by dividing the values with a
number. The quantization matrix contains these values, expressing the importance level of an image
frequency component. The result after this method is applied is that many values of 0 will make an
appearance. The following figures represent the DCT and quantization operations and also the final
result (Fig. 5.13, Fig. 5.14).
Fig. 5.13: An example of an encoded 8x8 FDCT block
Fig. 5.14: An example of quantization matrix
Fig. 5.15: An example quantized DCT matrix
41
Master Thesis - 2010
The DCT block contains the most important frequencies in the top left corner (Fig. 5.15). The
coefficients closer to the bottom right corner tend to 0. As it can be seen, the quantization actually
eliminates a large amount of data.
42
Master Thesis - 2010
6.
6.1.
IMPLEMENTATION CONSIDERATIONS
Graphics Cluster Description
The current application is mainly divided in two parts: the client part, and the server part. As it
can be seen, there are some nodes (node1, node2, … node n) which are actually other computers in the
network that can take the role of both servers and clients. Fig. 6.1 presents the diagram of the entire
application:
Server
LAN
:Composer
LAN
LAN
:Video
Streamer
:Rendering
server
Rendering node 1
Rendering node 2
:Rendering
node App
:Rendering
node App
...
Rendering node n
:Rendering
node App
Fig. 6.1: Graphics Cluster Diagram - Rendering nodes and rendering subsystem’s server
The main advantage of Equalizer is that it allows applications to be run on several machines,
thus taking full advantage of all their GPU computation power. So, if a scene is too complex for just
one computer, it can be rendered if more computers are used. The main components included on the
server machine are the rendering server, the rendering clients/nodes, the broker component and the
node manager. Besides them, the server is in the need of a DBMS which contains information about
the enabled nodes required for a specific task.
6.2.
The solution for integrating an object-oriented graphics rendering engine
and a parallel rendering framework
6.2.1. Implemented application
The parallel rendering framework - Equalizer is the standard middleware for parallel
rendering. It enables OpenGL applications to benefit from multiple graphics cards, processors and
computers to scale rendering performance, visual quality and display size.
The implemented C++ application is a cluster-ready viewer application which is based on the
modified Equalizer parallel rendering framework. It is providing the ideal basis for building scalable
high-performance 3D applications using multiple GPU’s. Also, it is an example application
integrating a graphics rendering engine and a parallel rendering framework. Its purpose is to
demonstrate the optimal approach for this integration and to serve as a basis for developing scalable,
high-performance graphics rendering applications.
43
Master Thesis - 2010
6.2.2. Parallel Architecture
The architecture of the implemented application is designed for optimal performance and
parallelization, while providing a straightforward programming model.
Each process in the cluster is represented by an eq::Node. The node instantiates one copy of
the scene graph in Node::configInit.
Animation updates and other scene graph modifications are applied at the beginning of
each frame in Node::frameStart.
Each GPU on a node is represented by an eq::Pipe. Each GPU runs its own rendering
thread in parallel to the other pipes and the node main thread.
Each on-screen and off-screen OpenGL drawable and context is abstracted by an
eq::Window. To render the scene graph, a customized SceneView is used. The SceneView is
initialized in eq::Window::config-InitGL(). Only the first window of a GPU, the shared context
window, performs this initialization, while other windows reuse the scene view of their shared
window.
All rendering operations happen in an eq::Channel, which represents a 2D viewport
in an eq::Window. Channel::frameDraw, which performs the actual rendering, sets up the SceneView
with the rendering parameters provided by Equalizer and triggers a cull and draw traversal to render a
new frame.
The rendering operations of all pipe threads on a single node are frame-synchronized, that is,
they are synchronized with each other and the node’s main thread.
Node processes and compositing operations for scalable rendering run asynchronous to this
synchronization for optimal performance. Figure 6.2 depicts alpossible synchronization when using
scalable rendering to render one view using four GPU’s.
The client component was built by integrating and customizing a large number of concepts
which were presented in a previous section of the document from the theoretical point of view. The
way they are actually implemented is presented in the current section.
44
Master Thesis - 2010
Fig. 6.2: Asynchronous rendering tasks when updating one view using four GPU’s
6.2.3. Data Distribution regarding Equalizer framework
Equalizer provides simple, yet powerful data distribution based on the serialization of C++
objects. The objects are versioned, allowing efficient updates based on delta serialization. Object
versions can easily be tied to rendering frames, keeping the database consistent across all rendering
processes in a cluster.
For large clusters Equalizer provides optionally a reliable multicast implementation which
efficiently distributes data to many cluster nodes.
The application we developed uses distributed objects to initialize the model filename on all
processes and to synchronize the camera data. It does not need to implement a mechanism to
distribute changes on the scene graph itself. The following sections outline different approaches which
can be taken to implement distributed updates in the graphics rendering engine.
6.2.4. Scene Graph Updates
The Scen Graph viewer is a multithreaded rendering application, which applies all scene
graph modifications in the main thread, between rendering frames. This is the preferred design pattern
for optimal performance and memory usage. The default thread synchronization of Equalizer
simplifies this implementation. All scene graph changes are done in the node process at the beginning
of a frame, before the pipe rendering threads are unlocked, as shown in Figure 6.2.
45
Master Thesis - 2010
Some applications tightly integrate data updates with the rendering traversal. In this case, a
multiprocess approach may be used. For each GPU, a separate rendering process using an Equalizer
node, is instantiated. This provides protection against conflicting data updates, but increases memory
requirements.
The multithreaded approach of our implemented application fully exploits multi-GPU systems
for multi-view and scalable rendering. All data modifications are done in a thread-safe manner and are
directly available to the rendering threads through shared memory.
For graphics clusters applications need to implement a mechanism to update the different
scene graph instances on all cluster nodes. In the following sections, two different paradigms to
synchronize the databases are outlined.
6.2.5. Event Distribution
The least invasive, but code intensive and more fragile approach, is to apply the same
operations to each scene graph instance. The initial scene graph is available to all processes, e.g.,
through a shared file system.
The relevant commands to modify the scene graph are distributed to all processes in the
cluster. The FrameData object of from our application is the ideal place for this, since it provides
frame-specific data correctly to all nodes. Each node reads and applies the commands in Node::frameStart to keep the data consistent.
6.2.6. Data Distribution regarding the graphics rendering engine
Data distribution for the graphics engine nodes is the most versatile and robust approach. The
application process holds the master instance of the scene graph. Any changes
on the scene graph are tracked internally.
At the beginning of each frame, the application commits all pending changes. The render
clients receive a change list and update the data in Node::frameStart.
Several design patterns can be employed to implement data distribution. Subclassing, proxies
or multiple inheritance are the most common (Figure 6.3 ) .
46
Master Thesis - 2010
Fig. 6.3: Subclassing, proxies and multiple inheritance for OGRE data distribution
6.3.
Rendering Component
The rendering component architecture is composed of the visualization server, the rendering
nodes (clients) and the resource manager.
For the server and rendering nodes, a framework based on Equalizer was used. The reason behind this
is because Equalizer is specialized in dealing with parallel rendering.
The rendering nodes are represented by multiple computers linked together and their main job
is to divide the workload among themselves. The user’s rendering requests are sent to the server
which distributes them to the nodes, thus forming a graphics cluster. In order to handle the distribution
and execution of the given task, each node contains a module responsible for this operation. Knowing
this, it must be said that there is an application which runs on each rendering client. When the
rendering cycle is completed, the result is sent further to a node called composer node. The result is
then compressed, thus achieving a better performance. This is done by the Equalizer graphical engine,
since it has a compression plug-in: the RLE method (Run Length Encoding).
The server holds the applications for the rendering server and composer parts and manages the
rendering nodes by transmitting messages to them. The messages contain information about the way
the distribution of operations is done among the clients. A configuration file is needed in order to
47
Master Thesis - 2010
configure the presented system. The purpose of the composer application is to combine the parts
received from the clients in order to obtain the final result. It also compresses the result and sends a
continuous video stream to the client application which is handled by the user. The video compression
is done by the use of a free library which is part of the FFmpeg project [16] .
In order to establish a way to communicate between the streamer process and the rendering
system, pipe files are used. The way this communication works is explained in the following. The
composer node creates a child process, using the streamer binary. The input of the child process is
redirected to a pipe file, while the streamer will continuously read the standard input and stream the
data to the destination. The streamer process must be given input values continuously because of the
constant frame-rate. The same applies, even if the rendering system’s performance is lower or if the
frame-rate is not constant. An algorithm comes to fix this problem: if the rendering FPS is greater than
the streaming FPS, it skips some of the frames; if the rendering FPS is lower than the streaming FPS,
it duplicates some of the frames.
The whole rendering component uses a networking layer (Fig. 6.4) that provides a peer-to-peer
communication infrastructure. This solution was integrated so the client application, server and
rendering clients are able to communicate easily between one another. It provides a layered
functionality, thus the programmer can benefit of higher functionality level. In the current application,
the nodes communicate using packets. The packets are managed by a base class.
Each node must have a unique identifier. For example, if you want to connect to a node, you
must specify the identifier to find it. If there is more than one node with the same identifier, the
application will not know which of the nodes is desired by the user.
Fig. 6.4: Communication between nodes, sessions and objects in the Graphics Cluster
48
Master Thesis - 2010
Besides the described parts of the rendering component, there are still the node manager
application and the broker component.
By the help of the node manager, the administrator is able to enable or disable specific nodes
in the cluster graphics architecture. The number of enabled nodes depends on the type and complexity
of the application and the needed resources. The nodes in the cluster can be considered either as server
or client nodes. The current project contains a database which is placed on the server. The database
holds enough information about the registered nodes. The node manager application provides file
deployment: before adding a node to the system, the files are copied using Secure Copy Protocol. The
host that houses the node manager is required to have a password less SSH connection configured to
the new node (view ANNEX).
The administrator is interested in having an application that can be easily used in order to do
such operations, as previously discussed. Thus, the interface must be user-friendly and should provide
instant access to the database. The alternative solution to be considered is to directly manipulate the
tables from the database if some error occurs during the addition/deletion of a new node.
The purpose of the broker component is to handle the requests received from users. Its
functionalities are: receiving requests and fetching the visualization to a specific rendering server.
After the fetching operation is completed, the rendering nodes receive the rendered graphical scene
together with its necessary parameters. The work of the broker component must be transparent to the
user, so it must know at each step which is the most suitable cluster to be enabled for a given job.
For the implementation of the whole project, a system composed of 12 computers was built: 10
rendering nodes and 2 servers. The remote rendering system can be used at the same time by more
clients. The computers that were used in the graphics cluster have the following configuration:
- Processor: Intel® Core™ 2 Duo E7300 @ 2666GHz
- RAM memory: 2GB
- Graphics card: GeForce 9600GT
o Version driver: 178.13
o Stream processors: 64
o Core clock: 450 MHz
o Memory clock: 756 MHz
o Memory interface: 256 bit
o Memory: 512MB
- OS: Windows XP SP2
6.4.
Collaboration Diagram for OGRE::DotSceneLoader
The DotSceneLoader class collaboration diagram is presented in Fig. 6.5. The full
functionality and implementation method is presented in the “Data Model” subchapter.
49
Master Thesis - 2010
Fig. 6.5: Collaboration diagram for OGRE::DotSceneLoader
Here are some of the main functions and attributes that were needed for the implementation of
the application for building object-oriented complex scenarios. The function names are pretty self
explanatory, so no complex explanations are given.
o Public member functions:
DotSceneLoader()
virtual ~DotSceneLoader()
void parseDotScene(const String &SceneName, const String
&groupName,
SceneManager
*yourSceneMgr,
SceneNode
*pAttachNode=NULL, const String &sPrependNode=“”)
SceneManager* getSceneManager()
o Protected member functions:
void processScene(TiXmlElement *XMLRoot)
void
processLight(TiXmlElement
*XMLRoot,
SceneNode*
pParent=0)
void processCamera(TiXmlElement *XMLRoot, SceneNode*
pParent=0)
void
processNode(TiXmlElement
*XMLRoot,
SceneNode*
pParent=0)
o Protected Attributes:
SceneManager* mSceneMgr
SceneNode* mAttachNode
6.5.
Data Model
In order to parse the implemented scene file format, to be able to manipulate the nodes and to
load the entire scene, the DotSceneLoader class provides suitable methods. Some of the most
important ones are:
50
Master Thesis - 2010
processEntity(xmlNode, parent): takes care of the entity being loaded. It has
information about its corresponding node and parent. It sets the attributes (name, id,
mesh file etc.) and then builds the entity.
processNode(xmlNode, parent): processes each node from the scene file.
processLight(xmlNode, parent): handles a light node and its parameters.
processCamera(xmlNode, parent): handles a camera node and its parameters.
processSkyBox(xmlNode)
processSkyDome(xmlNode)
processSkyPlane(xmlNode)
o the last three methods are available if one wants to add a sky object. The sky
object can be of three types: box, dome and plane. Each one has its own
functionalities and advantages/disadvantages.
parseDotScene(sceneName, groupName, sceneManager): this is the most important
method of the class. It is called from the client program in order to load and display the
entire scene. The rest of the methods are practically invisible to the user, because they
are applied from the inside of this method and are not needed to be applied separately.
The sceneName parameter gets the actual *.scene file to be loaded, the groupName
specifies the group which will represent the loaded models and the sceneManager is the
one used by the client application which holds and manages the entire information
about the scene.
51
Master Thesis - 2010
7.
EXPERIMENTS AND TESTING
Testing is an important part of the development process of any software application.
Throughout the development, a series of tests were being made in order to check the correct execution
of each component separately, and the functionality of the system as a whole. This chapter will focus
on the methods in which testing operations were done.
7.1.
Graphics Clusters Configurations
The architecture we proposed has been experimented on two local graphics clusters.
First configuration resources are shown in Figure 7.1
Fig. 7.1: Graphics cluster computing resources
The computing resources used for the first one consists of six Pentium 4 systems with 1 GB
RAM memory, GeForce 8800 640MB graphic card, and running on Windows XP SP3. This graphics
cluster was used for the first three experiments described in detail in the following paragraphs.
In terms of scalability, in the last experiment we used the second graphics cluster consisting of
eleven Intel® Core™ 2 Duo with 2 GB RAM memory, GeForce 9600GT graphic card, and running
on Windows XP SP2.
For evaluating the functional level of our architecture we have defined a set of test scenarios.
7.1.1. Scene-Oriented integration into Graphics Cluster
The aim is to evaluate the integration of all architectural components by using a very general
use case scenario. For building complex scenes, we used an object-oriented graphic engine which we
integrated in the parallel rendering framework based on Equalizer middleware. This use case refers to
the graphics cluster based visualization and user interaction in a complex 3D scene.
52
Master Thesis - 2010
For this experiment we used a graphics cluster consisting of two rendering clients and one
server of which task concerns with scene data distribution over the rendering clients and the
composition of the result received from each node.
Through the client application, the user builds up the graphical scene and sets the rendering
parameters from the user interface. An example of the application we built is shown in (Figure 7.2). In
this scenario, the user sets the positions for each of the selected scene model - the ground material and
some complex models (a house and different types of trees). In order to create this complex scene, the
client application used the scene management and the resource management classes from the library
used in object-oriented graphics rendering engine.
Node A
Node B
Result
Fig. 7.2: Visualization by two rendering nodes. The sort-first configuration and the object-oriented
graphics rendering engine are integrated into the graphics cluster.
In this use case the application load several ply complex models to hardware buffer and then
render the scene with texture shadow. After the user sets the rendering parameters and configures the
graphics cluster by the manager, the application can start the parallel rendering using the graphics
cluster. It is a scene-oriented application that load ply files as mesh data and computes textured
shadow for each object in real-time.
Regarding the graphical rendering, the UI allows the user to choose between these
configuration modes of the system: multi-window, multi-channel or graphics cluster.
The user interaction is supported by keyboard, in order to move the camera, and by mouse for
camera rotation.
Using our work for the integration of the object-oriented graphics rendering engine with the
Equalizer framework, the user has the possibility to create the camera and to set its position.
By default we set the camera at 500 units on Z direction, and looking back toward –Z. Then
the viewports are created as well. In our use case, we map the viewport over entire window.
Concerning our experiment with the object-oriented graphics rendering engine integration we
can conclude that the visualization results show that the performance increases only for complex
models.
For simple models, the performance declines by increasing rendering nodes. On the other hand,
because of the object-oriented graphics rendering engine limitation, thread safeness is poor. Each node
53
Master Thesis - 2010
can contain only one GPU, which means we must change the Equalizer configuration file (twowindow using sort-first strategy) to use one pipe that contains two windows.
In order to experiment the entire distributed architecture we built some 3D complex scenarios
using an Ogre application that we developed for this purpose. (Figure 7.3)
Fig. 7.3: Screenshots Results from the application we developed using Ogre
7.1.2. Component Testing – Building different complex scenarios in Ogre
The current application was developed iteratively, starting from the simplest parts, and going
further to the more complex ones. During the development process, extensive testing and evaluation
was done for this part.
The vgsScenarioApp class handles the visual part of the system, mainly the creation of the
scene, adding the user interface, creating cameras, viewports, a scene manager and also creating an
instance of vgsScenarioFrameListener class.
The createScene method is probably the most important one from the visual point of view of
the application. As the method was beginning to receive functionality, testing was done after each
part. The first part to be tested was the insertion of 3D models into the scene. At first, simple entities
were created and scene nodes were added in order to include the models and test the behavior of the
application. When the entities were correctly loaded, the DotSceneLoader class was included and
tested in order to load an entire complex scene. The lights and sky were then added and tested in a
trial and error manner. The same testing method was then applied for the CEGUI part. The positioning
of the radio buttons, check boxes, text boxes and buttons were modified a lot throughout the
development process.
The functionalities from the user interface were also tested in separate methods. In order to
load a new scene, the current one should be cleared. The eraseCurrentScene method was tested for
correct deletion of objects, entities and scene nodes. Several times, the application crashed when
loading a new scene, because the erase scene method failed to destroy all components from the
previous one. The loadScene method is not very complex. In order to test it, several scenes were
54
Master Thesis - 2010
created. Initially, some common scene nodes were overlapping between scenes and were not
displayed correctly.
The scenario visualization process was intensively tested since it represents the main purpose
of the project. In the method frameStarted, a large part was tested for the movement of the avatar. The
rotation of the camera in real time was given specific attention since, the camera initially rotated to
various directions, but the correct ones. Also, in order to get the correct vertex location, a new method
was used (nextLocation). This was tested by adding points to the designed list and verifying if the
avatar moved according to them. It was tiresome to use the application each time this part was tested,
so dummy points were hardcoded inside the code. At the end of the development, these were
eventually deleted, since they did not have any other specific use.
7.2.
Graphics Clusters visualization performance using Load-Balancing
strategies
The aim of our next experiments reported in this research concerns on evaluating the impact of
scene complexity, image dimension, and rendering method using different load-balancing strategies
on the visualization performance.
7.2.1. Resources assignments for optimal performances
In the next experiment we used our first graphics cluster configuration having all the
computing resources available. Concerning the segment definition from chapter V, it is important that
each segment of a multi-display system has a different rendering load and it depends on the data
structure and model position. When using a static assignment of resources to segments, the overall
performance is determined by the segment with the biggest load.
The solution is to analyze the load of all segments and adjusts the resource usage each frame.
It equalizes the load on all segments of a view. This process is illustrated in (Fig. 3).
In this experiment we used a static assignment of resources to display segments on the left side. The
right-hand segment has a higher load than the left-hand segment, causing sub-optimal performance.
On the left side the configuration is using a view which assigns two GPU’s to the left segment and
four GPU’s to the right segment, which leads to optimal performance for this model and camera
position.
Fig. 7.4: Cross-segment load-balancing for two segments
using six GPU’s
55
Master Thesis - 2010
7.2.2. A relevant advantage in using load-balancing
The third experiment use the computing resources from our first local graphics cluster
described in the beginning of this chapter and have four active rendering clients. The number of
frames per second (fps) was used as the measured parameter in order to evaluate the performances.
First of all we compare and evaluate the visualization performances between sort-first rendering
strategy and load-balanced sort-first rendering using objects centered in the middle of the screen. The
differences between these modes are quite insignificant. For instance, if we upload a complex model
without load-balancing we obtain 13 FPS. On the other hand, using the load-balancing, we obtain 17
FPS. In (Fig. 4) we show a demonstration regarding these results. For these measurements we load a
complex model that has 10.000.000 faces and a total size of 183 MB.
From the measurements point of view, we have to conclude that the advantages in using loadbalancing are relevant in the case the loaded model is covering a small part of the screen-space. In this
case we obtained 17 FPS without using load-balancing and 25 FPS using it.
a)
b)
Fig. 7.5: Four nodes graphics cluster running sort-first rendering strategy using load-balancing.
a) Full object visibility b) Partial object visibility
7.2.3. Frame computation by the rendering algorithms
For the last experiment we have used our second graphics cluster (one visualization server and
ten rendering clients) in order to find out how much we can increase the number of rendering nodes
and how this may influence the performances using the rendering algorithms with load-balancing on
different resolutions. The test variables are the number of rendering nodes, the scene complexity (in
term of number of triangles) and the rendering resolution.
Our measurements results presented in (Table 7.1) were obtained by running the graphics
cluster for each loaded model on different resolutions. For these measurements we used 3 models with
different complexity level. In terms of rendering algorithms we used the sort-first, sort-last and DPlex
decomposition strategies to compare the performances related to load-balancing improvements.
DPlex decomposition requires multiple frames to be rendered concurrently. DPlex mode
assigns full frame rendering for each rendering client. This mode is known as the alternate frame
56
Master Thesis - 2010
rendering. It provides a very good scalability, but the disadvantage concerns the rendering system
delay. In our experiment the DPlex is configured using a period and phase for each rendering node.
The network traffic and the rendering nodes load are variables that required our attention. The
server node synchronizes the rendered frames at the composition stage. In this context the frame rate
is influenced by the load of the rendering client nodes.
The results show that the performance increases only for complex models. For simple models,
the performance declines with increasing rendering nodes. We can conclude that in the case of the
sort-first strategy, the scalability may be applied, but in the case of sort-last, the network traffic cost is
increasing with the number of rendering nodes. Concerning our measurements the advantages in using
the load-balancing are relevant in the case the loaded scenes are complex and the rendering algorithm
is sort-first.
TABLE 7.1
FRAME COMPUTATION BY THE RENDERING ALGORITHMS
Resolution
Model complexity level
Small
Medium
320 x 240
640 x 480
Legend:
57
Large
7.3.
Functional Testing
7.3.1. Generating Scene files
For testing VGS application, some complex virtual geographical scenes are required.
In order to create such scenes, two programs were used. Ogitor is a plug-in based WYSIWYG
editor environment for the object-oriented graphic rendering engine. It allows easy creation of
scenes which can be loaded in an OGRE application for both rapid prototyping purposes and
as final application content. This program mainly supplied the object models, their
positioning, rotation and scale in the 3D environment. A group of objects were placed in a
small scene which was later exported to a “.scene” file. In order to create several types of
scenes (simple, of medium complexity and complex), a Java program was designed. Its
purpose was to place the previously discussed objects on the scene in a specified number of
times.
In order to test if the integration between the parallel rendering framework and the
graphic engine works, we generated three files with having different complexity:
-
map_small.scene: number of triangles: 189,192
map_medium.scene: number of triangles: 1,158,801
map_large.scene: number of triangles: 5,321,025
7.3.2. MPEG-2 Compression
The MPEG-2 compression is used and implemented from Error! Reference source
not found.. After the inclusion of this part in the project, testing was still necessary in order to
verify the correct usage. Similar tests as in the paper were executed. Testing the MPEG2encoder module was done through saving the result of the rendering in a local file. In case
the component operates as the specifications require, any player may read and display the
content of the saved file.
The testing was executed with the use of VLC Player and Windows Media Player.
Both applications rendered the content of the file with no errors.
7.3.3. Adding a Node to the System
In order to add a node to the system, the implementation from Error! Reference
source not found. was used. The testing was still necessary in order to verify that the correct
behavior is obtained.
The process of adding a node to the system can be done with the help of the
NodeManager component. Before adding a node, a SSH password less connection between
the server and the new node must be configured (view ANNEX).
After the configuration data is introduced, the user has to press the “Add” button.
When this happens, the configuration of the new node is being done. In case the node is a
server, the folder ServerFiles will be created on partition C: of the new node, otherwise, if the
node is a client, the folder will have the name ClientFiles. These folders are used to store and
copy the necessary files in order to fulfill the role of a client or server.
After the addition process is done, the files on the new node are verified of existence.
For the file validation process, a complete test for rendering using the new node was also run.
7.3.4. Disabling a Node from the System
Since the addition of a node was done using the technology in Error! Reference
source not found., the same goes for the inverse operation, i.e. the removal of a node. The
nodes registered in the rendering system may be disabled. The reason behind their disabling
58
may be the detection of some error on that node, or any other factor that may result in an
abnormal functionality.
The node is thus disabled. The test is represented by the initiation of a new
visualization session. It can be observed that the removed node will not take part in the
rendering operation.
7.3.5. Communication between the Client Application, Broker Component and the
Rendering System
In paper Error! Reference source not found., this part was implemented and tested.
The current application that integrates Ogre and Equalizer also needs to integrate this
functionality. In order to start/stop or send an interaction command to the graphics cluster, the
user operates on the Client Application. The requested commands are sent to the Broker
Component.
Scene interaction commands which are sent to the Broker Component are then sent to
the session associated server. The testing consists of starting a new session, i.e. starting the
client application, and executing commands by the use of the graphical user interface.
It can be seen that the functionality of these components is the expected one.
7.4.
Performance Testing
In order to complete the experimental testing in this section, I have used the VGS that
were generated as mentioned in subchapter 7.3.1., i.e.:
-
map_small.scene: number of triangles: 189,192
-
map_medium.scene: number of triangles: 1,158,801
59
-
map_large.scene: number of triangles: 5,321,025
In the number of possible processors and graphics cards, the graphic clusters are
virtually unlimited. Compared to computing clusters, the software scalability on such cluster
is a relatively new subject. Equalizer is pushing the boundaries on what is possible by
bringing more applications to this environment.
The evaluation of the impact of scene complexity, image dimension, and rendering
method on the performance of remote visualization are the aim of our experiments. As the
measured parameter, we use for evaluation the number of frames per second (FPS).
60
Fig. 7.6: Visualization result using the sort-first algorithm
We have defined a set of test scenarios to evaluate the functional level of our
architecture. The aim is to evaluate the integration of all architectural components.
Another important subject is the scalability of the system. Moreover, the main
question is how much we can increase the number of rendering nodes and how this may
influence the performance. In the case of the sort-first strategy, every rendering client renders
a subset of the original resolution. The network traffic cost will be mainly the same. The sortlast strategy renders a subset of the scene objects. The resolution on each of the rendering
nodes is the same as the final image resolution and the rendering clients fetch back the depth
buffer to the composition node.
The other tests consist on performance evaluation by measuring the frames per
seconds. The test variables are the number of rendering nodes, the scene complexity (in terms
of number of triangles) and the rendering resolution. The last two variables decrease very
much the visualization performance. The higher the resolution, the better the final image, but
the rendering time increases. In a similar way, the scene complexity influences the frame rate.
By adding more details to objects, the rendered quality is better but the rendering time
increases (Table 7.2).
Table 7.2: Frame Computation by the Sort-First Algorithm
Scene complelxity
Nodes
256 x 256 pixels
512 x 512 pixels
1024 x 1024 pixels
Low – small map
2
3
4
2
3
4
2
3
4
47
40
39
28
20
23
14
8
11
30
28
15
18
14
11
10
7
6
14
10
8
8
5
4
5
3
1
Medium – medium
map
High – large map
61
Another measurement variable can be the network traffic and the rendering nodes
load. The server node synchronizes the rendered frames at the composition stage. Therefore,
the load of the rendering client nodes influences the frame rate.
The architecture we proposed has been experimented on a local graphics cluster. The
computing resources consists of four Pentium 4 systems with 1 GB RAM memory, GeForce
8800 640MB graphic card, and running Equalizer middleware on Windows XP SP2.
Table 7.2 presents the frame computation rate on the Equalizer cluster by the sort-first
algorithm for low, medium and high scene complexity, three node configurations, and three
image resolutions. We use three different graphical scenes: one with low complexity, one with
medium complexity and another one with more details (see Table 7.3). At middle image
resolution (512 x 512 pixels, Fig. 7.63), we managed to obtain good frame rates without
optimizations (fast network, frame encoding etc.). With higher number of rendering clients,
the composition time tends to increase and this affect the obtained frame rate. The best
performance related with image resolution and scene complexity is obtained by using two or
three rendering clients and a middle image resolution both in the case of low, medium and
high scene complexity.
Table 7.3: Number of Faces for the Small, Medium and Large Maps
Complexity
Faces
Low
Medium
High
189,192
1,158,801
5,321,025
Nevertheless, the performance already achieved is quite far of the required ones. The
future research will mainly concern with performance enhancement by graphics cluster
configuration, connectivity and communication among cluster nodes, rendering algorithm
optimization, streaming, user interaction, virtual space modeling and distributed processing,
and the modeling and simulation of the natural phenomena.
Ogre3D and Equalizer are the ideal combination for high-performance 3D
visualization. While object-oriented rendering graphics engine focuses on rendering
efficiently, the parallel framework provides scalability on multi-GPU systems and large-scale
clusters. The application we developed is a template for applications combining the two open
source solutions in an efficient way.
62
8.
8.1.
USER MANUAL
Installation Guide
A. OGRE
- Download OGRE SDK 1.7.0
- Unpack to a suitable location
- Build the project to get the necessary .lib and .dll files
- Go to the directory of the newly installed sdk and copy the full path
- Set the environment variable OGRE_HOME to point to that path.
o One way to do this is to open a command window and set the variable
using the following command:
setx OGRE_HOME D:\OgreSDK\OgreSDK_vc9_v1-7-0
B. CEGUI
- Download CEGUI 0.7.1 and also the “Dependencies” files; copy the
“Dependencies” folder into the root of CEGUI.
Remark: Since the Ogre 1.7 version, CEGUI is not an Ogre dependency anymore
using its own basic interface for its samples now, instead of CEGUI. This means
that from now on, you have to build CEGUI for your Ogre project yourself, in case
you want to use the latest Ogre or CEGUI versions. Otherwise, you can grab the
latest precompiled dependencies from the Ogre download section Webpage and
the CEGUI download section Webpage.
- In your CEGUI folder there should be a folder called "projects" with a
subfolder called "premake". Get a version of premake and extract the
premake.exe file into this folder.
- Open config.lua in the premake folder and edit the Ogre and OIS paths
accordingly, so they will point to your SDK files. In my case for example the 2
lines look like this:
OGRE_PATHS = { ".../Visual Studio 2008/Projects/Ogre 1.7/Ogre/VCBuild/sdk",
"include/OGRE", "lib" }
OIS_PATHS = { ".../Visual Studio 2008/Projects/Ogre 1.7/Ogre/VCBuild/sdk",
"include/OIS", "lib" }
Remark: Remember to use forward slashes here! Just copying the paths from the
Windows explorer will give you backward slashes. Replace them!
Next, set all Renderers you do not need to "false", in this case we will only
need OGRE_RENDERER. You can also set all samples to false, except maybe
SAMPLES_OGRE if you want them.
- Next, we create our Visual Studio Projects - Execute build_vs2008.bat to
create a Visual Studio 2008 project or execute any other .bat file for your
respective Visual Studio version.
- This should create CEGUI.sln in the premake folder. Open it.
- If you have the Ogre lib files seperated into a Debug and Release folder, you
will have to change the path in the Linker settings of the project so they will point
to the lib/Debug or lib/Release folder for each configuration respectively.
63
- Build the CEGUIOgreRenderer in Debug and Release mode, copy the
CEGUIBase and CEGUIOgreRenderer .dll and .lib files as well as the CEGUI
include folder.
Remark: Add all dll files from CEGUI into the bin working folder of OGRE!
Also, add all lib files from CEGUI into the lib folder of OGRE!
- Locate the file “resources.cfg” in OgreSDK, open it with a suitable editor and
add the following lines at the end in order to set the CEGUI resources:
# CEGUI resources
[Imagesets]
FileSystem=[path]/datafiles/imagesets
[Fonts]
FileSystem=[path]/datafiles/fonts
[Schemes]
FileSystem=[path]/datafiles/schemes
[LookNFeel]
FileSystem=[path]/datafiles/looknfeel
[Layouts]
FileSystem=[path]/datafiles/layouts
Where [path] points to the installation folder of CEGUI, for example
E:/Work/Facultate/Licenta/CEGUI-0.7.1
C. Equalizer framework
Before I can describe how to run the software, you must understand how to use
the configuration files of Equalizer. Depending how many nodes you’re running
in your cluster all of this must be described in that file including the connection
information.
Also, you must map one node to one GPU on the machine. You can’t run
multiple nodes on the same machine if you don’t have enough GPUs.
First and foremost, you must specify all library paths to point to both Equalizer
library binaries and Ogre library binaries. You need to start up all your render
nodes first:
Command window:
>myapplication
--model=<model
filename>
--eq-client
–eq-listen
<ipaddress>:<port>
Example: >myapplication --model=first_scenario.scene –eq-client –eq-listen
10.128.1.234:4243
<model filename> Name of the model to load
<ipaddress> Render node’s address
<port> Listening port
After starting up all the render nodes, you start the actual server. The server will
automatically connect to all the render nodes as specified in the configuration file.
>eqServer <config-file>
64
Example: >eqServer config/2-node.2D.eqc
<config-file> Configuration file (.eqc)
Lastly, start the application and connect to the server.
>myapplication --model=<model filename>
Example: >eqOgre --model=first_scenario.scene
<model filename> Name of the model to load
For more details, see ANNEX.
65
9.
CONCLUSIONS
The set of components and interactive software tools available to the user permit the
visualizing and editing of complex scenarios in a VGS taking advantage of the Equalizer
graphics cluster.
The system fulfills all the requested specifications, both the functional ones and nonfunctional ones. After testing and experimenting with this research, it was proven that all the
use case scenarios were correctly executed and follow the necessary specifications.
One of the main objectives of the current project was to be able to interact with a 3D
complex scene using a high-performance distributed architecture. Thus, an application was
successfully developed for this purpose. Through it, the user is able to run on the graphics
cluster any scenario built using object oriented graphics rendering engine.
The client application for building Ogre scenarios is mainly about the scenario
creation and manipulation for walking inside a 3D geographical space. In order to have fully
working scenarios, a standalone language was built. The application provides interactive
techniques, and includes an easy to learn interface. Through it, the user has the ability to
choose some operations and use the entire system functionality for the description of
visualization processes.
When talking about the format of the scene graphs available for this application, the
“.scene” format was developed and tested. It is an XML based format through which the 3D
objects are placed in the virtual world. The “.scene” format is humanly readable and
understandable.
In this application, a scalable system is developed, such that one can easily add new
client nodes for the rendering part inside the graphics cluster, with the purpose of achieving
better performance.
For future improvements, the application is wide open to new ideas for add-ons. One
of the major improvements that can be brought is to include a curve-shaped trajectory for the
visualization scenarios.
A new and improved scene file format can be documented and integrated in the
project. There are lots of scene formats that can be used. The more formats, the better because
this will mean a larger usability.
Since the Ogre implemented application includes several predefined scenarios, it may
also have an option to create one from scratch and save it later.
Another possible major improvement is related to the frame compression when the
client nodes send information to the rendering server where the final composition of the
image is done. A better compression of the frames leads to a reduced traffic within the
network and implicitly a visible increasing in performance of the entire system.
The MPEG-2 encoding is the one used for the project. In the future, one can probably
implement a MPEG-4 encoding type which brings a better data compression, thus the
necessities of the internet connection bandwidth for the user would get considerably low. The
MPEG compression algorithms are parallelizable and thus a GPU implementation would
result in the increase of performance.
The future research will mainly concern with performance enhancement by graphics
cluster configuration, streaming process improvements, communication and connectivity
between graphics cluster nodes, rendering algorithm optimization and more data formats
accepted by user interface.
66
REFERENCES
[1]
Bâcu V., Mureşan L., Gorgan D., „Cluster Based Modeling and Visualization of
Virtual Geographical Space”. Workshop on Grid Computing Applications
Development (GridCAD). Proceedings of the SYNASC 2008, September 2008,
Timisoara, IEEE Computer Press, ISBN 978-0-7695-3523-4, 2008, pp. 416-421.
[2]
Gorgan D., Mocan C.M., Bâcu V., „Remote Graphical Visualization of Interactive
Virtual Geographical Space”. IEEE MIPRO 2009, GVS – Grid and Visualization
Systems Conference, May 25-26 2009, Opatija, Croatia. Proceedings Vol.I.,
MEET&GVS, ISBN 978-953-233-044-1, pp. 329-334, (2009)
[3]
***, Equalizer graphics cluster, http://www.equalizergraphics.com
[4]
***, Chromium graphics cluster, http://chromium.sourceforge.net
[5]
***, Ogre Graphics Engine, http://www.ogre3d.org
[6]
***, Irrlicht Engine, http://en.wikipedia.org/wiki/Irrlicht_Engine
[7]
***, OpenSceneGraph - 3D Graphics Toolkit, http://www.openscenegraph.org
[8]
***, Visualization Library for 2D/3D graphics applications,
http://www.visualizationlibrary.com
[9]
Goetz F. and Domik G., “Remote and Collaborative Visualization with
openVISSAR”, Proc. of the Third IASTED International Conference on Visualization,
Imaging, and Image Processing, Benalmádena, Spain, September 2003.
[10]
Gorgan D., Bartha A., Truţă A., Ştefănuţ T., „Graphics Cluster Based
Visualization of 3D Medical Objects in Lesson Context”. In Proceedings of the 9th
International Conference on Information Technology and Applications in
Biomedicine, Nov. 5-7, 2009, Larnaca, Cyprus (Accepted for publication by IEEE
Press), (2009)
[11]
Bartha A., Bâcu V., Gorgan D., „Remote visualization of graphical objects”.
Student Scientific Communication Session, Cluj-Napoca, May, (2009)
[12]
Gorgan D., Mocan C.M., Bâcu V., „Remote Graphical Visualization of Interactive
Virtual Geographical Space”. IEEE MIPRO 2009, GVS – Grid and Visualization
Systems Conference, May 25-26 2009, Opatija, Croatia. Proceedings Vol.I.,
MEET&GVS, ISBN 978-953-233-044-1, pp. 329-334, (2009)
[13]
Bartha A., Gorgan D., „Configurarea şi controlul arhitecturii cluster grafic pentru
vizualizare la distanţă”, Diploma thesis, (2009)
[14]
Mureşan L., Gorgan D., „Modelarea şi vizualizarea spaţiului virtual geografic
folosind clusterul grafic Chromium”. Diploma thesis, (2008)
67
[15]
Gorgan D., Barbantan R., „Remote Visualization Techniques for Distributed 3D
Scenes”. Scientific and educational GRID applications, Teodorescu H.N. and Craus
M. (Eds). Ed. Politehnium, ISBN 978-973-621-236-9, pp.111-120 (2008)
[16]
***, FFMpeg homepage: http://ffmpeg.org/
[17]
***, GIS documentation,http://en.wikipedia.org/wiki/Geographic_informa ion_system
68
ANNEX
Equalizer configuration files
A configuration for two rendering nodes, at resolution 640*480 pixels, using 2D mode
with load balancing may be generated using the following command:
configtool –c 3 –n nodes –x 640 –z 480 -m 2D –a –l –o config.eq
The execution result, i.e. the config.eq file contains:
global
{
EQ_WINDOW_IATTR_HINT_FULLSCREEN OFF
}
server
{
config
{
appNode
{
pipe
{
window
{
viewport [ 10 10 640 480 ]
attributes{ hint_fullscreen OFF }
channel { name "channel0"}
}
}
}
node
{
connection
{
hostname "hostname1"
TCPIP_port 4243
}
pipe
{
window
{
attributes
{
hint_drawable pbuffer
}
channel
{
name "channel1"
69
}
}
}
}
node
{
connection
{
hostname "hostname2"
TCPIP_port 4243
}
pipe
{
window
{
attributes
{
hint_drawable pbuffer
}
channel
{
name "channel2"
}
}
}
}
compound
{
channel "channel0"
wall
{
bottom_left [ -.32 -.20 -.75 ]
bottom_right [ .32 -.20 -.75 ]
top_left [ -.32 .20 -.75 ]
}
load_equalizer { mode 2D }
task
[ CLEAR ASSEMBLE ]
compound
{
channel "channel1"
outputframe{ }
}
inputframe{ name "frame.channel1" }
compound
{
channel "channel2"
outputframe{ }
}
70
inputframe{ name "frame.channel2" }
}
}
}
A configuration for two rendering nodes, at resolution 640*480 pixels, using DB
mode without load balancing may be generated using the following command:
configtool –c 2 –n nodes –x 640 –z 480 -m DB –a –o config.eq
The execution result, i.e. the config.eq contains:
global
{
EQ_WINDOW_IATTR_HINT_FULLSCREEN OFF
EQ_WINDOW_IATTR_PLANES_STENCIL ON
}
server
{
config
{
appNode
{
pipe
{
window
{
viewport [ 10 10 640 480 ]
attributes{ hint_fullscreen OFF }
attributes { planes_stencil ON }
channel { name "channel0"}
}
}
}
node
{
connection
{
hostname "hostname1"
TCPIP_port 4243
}
pipe
{
window
{
attributes
{
hint_drawable pbuffer
}
71
attributes
{
planes_stencil ON
}
channel
{
name "channel1"
}
}
}
}
node
{
connection
{
hostname "hostname2"
TCPIP_port 4243
}
pipe
{
window
{
attributes
{
hint_drawable pbuffer
}
attributes
{
planes_stencil ON
}
channel
{
name
}
"channel2"
}
}
}
compound
{
channel "channel0"
buffer [ COLOR DEPTH ]
wall
{
bottom_left [ -.32 -.20 -.75 ]
bottom_right [ .32 -.20 -.75 ]
top_left [ -.32 .20 -.75 ]
}
task
[ CLEAR ASSEMBLE ]
compound
72
{
channel "channel1"
range [ 0.00000 0.50000 ]
outputframe{ name "frame.channel1"}
}
inputframe{ name "frame.channel1" }
compound
{
channel "channel2"
range [ 0.50000 1 ]
outputframe{ name "frame.channel2"}
}
inputframe{ name "frame.channel2" }
}
}
}
The nodes file contains the name or the Ips of the rendering nodes:
hostname1
hostname2
SSH Configuration
Before adding a new node in the system, a passwordless SSH connection must be
configured from the rendering server system to the new node. In this project, the OpenSSH
implementation for Windows was used.
Steps:
o Download OpenSSH for Windows (www.openssh.com)
o The OpenSSH client and server is installed
o The following commands are executed in the folder <OpenSSH Dir>\bin:
o mkgroup -l >> ..\etc\group
o mkpasswd -l [-u <username>] >> ..\etc\passwd
o net start opensshd
o The file <OpenSSH Dir>\etc\sshd_config is modified as follows:
o Strictmode no
o PasswordAuthentication yes
o RSAAuthentication yes
o AuthorizedKeysFile ~/.ssh/authorized_keys
o The public key of the server is added in the file: ~\.ssh\ authorized_keys
FileZilla Configuration
Steps:
o Download FileZilla from server: http://filezilla-project.org/
o Install FileZilla server
o Create directory: C:/SavedSessions
o Configure user Anonymous:
o FileZilla->Edit->Users->Add
o Shared Folders: select previously created folder
o The correct functioning is tested by accessing: ftp://<hostname>/
73