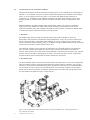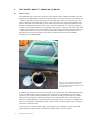
1
PROJECT PLAN FOR THE BIOLOGICAL EFFICACY TESTING OF THE CATHELCO BALLAST WATER TREATMENT SYSTEM FROM CATHELCO GmbH AS PART OF THE TYPE APPROVAL PROCESS UNDER RESOLUTION MEPC.174(58) CONFIDENTIAL Until further notice Submitted to the BSH September 2012 (version 2) Signed on Texel, The Netherlands on: 10 September 2012 L. Peperzak Ph.D. NIOZ Royal Netherlands Institute for Sea Research P.O. Box 59 NL-1790 AB Den Burg, The Netherlands Abstract This project plan for the testing of the Cathelco Ballast Water Treatment System consists of the following sections: 1. Quality Management Plan (QMP) 2. Quality Assurance Project Plan (QAPP) 3. Standard Operating Procedures (SOPs) The Quality Management Program (QMP) addresses the quality control management structure and policies of the test facility. The Quality Assurance Project Plan (QAPP) in section 2 is the project-specific technical document reflecting the specifics of the test facility, the BWTS tested, and other conditions affecting the actual design and implementation of the required experiments. The QAPP consists of general information, information on the NIOZ test facility and the Cathelco BWTS, test water quality, sampling and sample storing, the measurement of variables and QA/QC. Detailed Standard Operating Procedures (SOPs) for each of the analyses are provided in section 3. This is the second version of the project plan. The first version contained information for intermediate and high salinity range testing only. This new version includes information on freshwater testing scheduled for autumn 2012 and is split in the three sections outlined above. 2 NIOZ Land-based Project Plan Section 1: Quality Management Plan (QMP) 1. Introduction 7 2. Quality system management and organisation 7 3. Quality system components 8 4. Personnel qualifications and training 9 5. Procurement of items and activities 10 6. Documents and records 10 7. Computer hardware and software 10 8. Planning 10 9. Implementation of work processes 11 10. Assessment and response 11 11. Quality improvement 11 3 NIOZ Land-based Project Plan Section 2: Quality Assurance Project Plan (QAPP) 1 INTRODUCTION 2 GENERAL DESCRIPTIONS 2.1 2.2 2.3 3 NIOZ profile Profile of the CATHELCO group Technical overview of CATHELCO’s BWTS 14 15 16 16 TEST FACILITY 3.1 3.2 3.3 3.4 3.5 3.6 4 NIOZ test facility Freshwater intake at Den Helder and transport to NIOZ BWTS test set-up: treatment and control tanks Toolbox meetings Ballast water book Test season: time planning 20 21 24 24 25 25 TEST WATER: QUALITY, SAMPLING, STORING 4.1 4.2 4.3 4.4 4.5 4.5.1 4.5.2 4.5.3 4.5.4 4.5.5 5 Abiotic quality Biological quality General sampling strategy Abiotic variables: sampling and storing Biological variables: sampling and storing Sampling organisms ≥50 µm Sampling and storage of 10≤µm<50 organisms Sampling and storage of total and viable heterotrophic bacteria Sampling of human pathogens Sampling for additional incubation (viability) experiments 26 27 28 29 31 31 32 32 32 33 MEASUREMENT OF VARIABLES 5.1 5.1.1 5.1.2 5.1.3 5.1.4 5.2 5.2.1 5.2.2 5.2.2.1 5.2.2.2 5.2.3 5.2.4 5.2.5.2 5.2.5.3 6 Abiotic variables Salinity, Temperature and pH TSS/POC (Total Suspended Solids/Particulate Organic Carbon) Dissolved Oxygen (DO) Dissolved Organic Carbon (DOC) Biological variables Counting of organisms ≥ 50 µm Counting of organisms 10≤µm<50 Counting viable microzooplankton Counting viable phytoplankton Counting total heterotrophic bacteria Human pathogens PAM measurement for total phytoplankton viability Counting phytoplankton <10 µm 34 34 34 34 34 36 36 37 37 37 38 39 40 41 Quality assurance / Quality control (QA/QC) 6.1 6.2 6.3 7 Ballast water tests Laboratory analyses Data analysis REFERENCES 4 NIOZ Land-based Project Plan 42 42 42 44 Section 3: Standard Operating Procedures (SOPs) Variable Reference (SOP) Page Salinity and Temperature Salinity and Temperature 2012.2 46 pH pH 2012.1 47 TSS and Particulate Organic Carbon TSS-POC 2012.2 48 Dissolved Oxygen Dissolved Oxygen 2012.1 50 Dissolved Organic Carbon DOC 2012.1 53 Viable organisms ≥50 µm, including diversity Mesozooplankton 2012.1 57 Phytoplankton (organisms 10-50 µm) Phytoplankton Canto FCM 2012.1 59, 61, 64 FCM Canto operation 2012.1 FCM Canto data processing 2012.3 Phytoplankton diversity Koeman & Bijkerk b.v.; quality assessments in www.planktonforum.eu/ Koeman & Bijkerk, outsourced Phytoplankton vitality (PAM fluorimetry) Phytoplankton vitality PAM 2012.1 66 Phytoplankton vitality (SYTOX Green) Phytoplankton vitality SYTOX FCM 2012.1 68 Phytoplankton viability Plankton viability T5-incubation 71 Microzooplankton (organisms 10-50 µm) including diversity Microzooplankton 2012.2 69 Microzooplankton viability Plankton viability T5-incubation 71 Phytoplankton (organisms <10 µm) Phytoplankton Canto FCM 2012.1 59, 61, 64 FCM Canto operation 2012.1 FCM Canto data processing 2012.3 Heterotrophic bacteria Bacteria count PicoGreen 2012.1 73 E. coli NEN-EN-ISO 9308-1 Eurofins Cmark, outsourced Enterococci NEN-EN-ISO 7899-2 Eurofins Cmark, outsourced 5 NIOZ Land-based Project Plan Section 1: Quality Management Plan (QMP) 1. Introduction 7 2. Quality system management and organisation 7 3. Quality system components 8 4. Personnel qualifications and training 9 5. Procurement of items and activities 10 6. Documents and records 10 7. Computer hardware and software 10 8. Planning 10 9. Implementation of work processes 11 10. Assessment and response 11 11. Quality improvement 11 6 NIOZ Land-based Project Plan 1. Introduction The NIOZ Ballast Water Treatment System (BWTS) test facility is part of the Department of Biological Oceanography of the Royal Netherlands Institute for Sea Research (NIOZ). NIOZ is an institute liaised to the Netherlands Organization for Scientific Research (NWO). The mission of NIOZ is to gain and communicate scientific knowledge on coastal seas and oceans for a better understanding and sustainable use of our planet, to manage the national facilities for sea research and to support research and education in the Netherlands and in Europe. NIOZ is an independent academic research institute participating in numerous international research projects in coastal seas and the oceans. In addition, time series of physical, chemical and biological data from the Wadden Sea area are maintained in order to study long-term changes in the ecology of this UNESCO World heritage site. In this context the research on the efficacy of Ballast Water Treatment Systems (BWTSs) and related environmental questions fits within the NIOZ work field. NIOZ continues to build on its many years of experience: since 2007 NIOZ has tested nine BWTSs (Table 1). Table 1. Ballast Water Treatment Systems tested at NIOZ. year Company System 2007 Hamann SEDNA 2008 EcoChlor EcoChlor 2008 Hyde Marine Hyde Guardian 2009 Mahle Ocean Protection System 2009 Severn Trent De Nora BallPure STDN 2010 Aquaworx AquaTricomb 2010 Erma-First ESK SA ErmaFirst 2011 Hamworthy/Wärtsilä Aquarius-EC 2012 Hamworthy/Wärtsilä Aquarius-UV NIOZ works constantly on improving its methods and technologies for the accurate and precise enumeration of aquatic organisms and the measurement of their vitality and viability. These methods are compared with other organisations and test facilities in workshops and within the global network of BWTS test sites, GloBal TestNet, of which NIOZ is a member. On a European level NIOZ is the lead beneficiary of the North Sea Ballast Water Opportunity project. It is policy of the institute to communicate scientific results as much as possible through international peer reviewed publications. The NIOZ BWTS test facility not only performs land-based G8 or G9 tests. It is also equipped for laboratory tests to investigate the principles and efficiency of new technologies as well as for bench-scale tests to examine prototypes and components of BWTSs. In addition, the test facility is able to analyse and evaluate samples from other test facilities, from ship-board tests and other ballast water related activities. This evaluation may range from compliance checking to IMO standards till advanced statistical analyses. In co-operation with IMARES (Den Helder, The Netherlands) and Go-Consult NIOZ also offers a one-stop shop for complete G8 or G9 type approval, including toxicity testing, ship-board tests and dossier formation. In all activities the NIOZ test facility strives to achieve highly accurate and precise results. This Quality Management Plan (QMP) describes the organisation of the NIOZ quality system. This consists of the quality system management and organisation, the quality system components, personnel qualifications and training, procurement of items and activities, documents and records, computer hardware and software, planning, implementation of work processes, assessment and response and, finally, quality improvement. 2. Quality system management and organisation The quality system of the NIOZ is devoted to the reliable testing of BWT systems. This means that accurate and precise measurements of the test ballast water and the treated water, including the experimental control water, need to be assured. Accessibility of 7 NIOZ Land-based Project Plan experimental and measurement protocols, quality control, data and data analysis should lead to a high fidelity in the conclusions reached during G8/9 tests of BWTS performance and other relevant research activities. NIOZ is an IMO recognised test institute and is certified by Lloyd’s Register. The project leader of ballast water research is Dr. Louis Peperzak. He is responsible for the proper functioning of the test facility and for carrying out BWTS tests, laboratory analyses, production of Standard Operating Procedures (SOPs), new methods in ballast water research (treatment, enumeration, vitality/viability measurements, compliance monitoring) and the support of all staff and students that are involved in this research. In cooperation with members of the ballast water team he analyses the BWTSs test results and writes the G8/G9 reports as first author. Co-project leader is Dr. Jan Boon. He manages the overall Ballast Water Project at NIOZ, especially in relation to the North Sea Ballast Water Opportunity (NSBWO) project of the European Union of which the NIOZ is the lead beneficiary. He is also responsible for the external relations of the Ballast Water Project. Because of his experience in chemical quality assurance programs, Dr. Boon also acts as the quality manager. He is responsible for the QMP and will evaluate all QA/QC activities of BWTS tests. He is co-author of the G8/G9 reports. Both project leaders are assisted by Mrs. Dörte Poszig M.Sc. M.A. (general management), Mr. Marcel van der Linden (financial management) and Mrs. Marieke Holthuijsen-Vloemans (external communication). Sampling, sample analyses and first data analyses are carried out by Mrs. Josje Snoek, Mrs. Eveline Garritsen, Mrs. Eva Immler, Mr. Dennis Mosk and Mr. Alex Blin. Mrs. Eva Immler is responsible for the correct operation of the first NIOZ test installation on the Pelagia quay and for correct sampling, sample handling and storage there. Mr. Dennis Mosk is responsible for the correct operation of the NIOZ test installation on the Navicula quay and for correct sampling, sample handling and storage there. The operation and maintenance of both NIOZ test installations is contracted to Mr. A. Smit of Smittech (Den Hoorn, The Netherlands) and Mr. J. Witte (Witte Klusbedrijf, Den Burg, The Netherlands) The NIOZ ballast water team advisory committee consists of Prof. Dr. Hein de Baar (chemistry), Dr. J. van Bleijswijk (molecular biology), Dr. Corina Brussaard (microbial ecology) and Dr. Klaas Timmermans (head of the Department of Biological Oceanography at NIOZ). The Quality Management Plan (QMP) and Quality Assurance Project Plan (QAPP) are reviewed annually by an external independent consultant. In 2012 this was performed by Dr. S. Kools of Grontmij (The Netherlands). In addition, at the request of the BSH a review on QA/QC aspects was performed by Dr. A. Cangelosi of GSI (USA). Comments of both parties have been used in the present project plan that includes both QMP and QAPP. 3. Quality system components The quality system of the NIOZ BWTS test facility contains several components of which this QMP is the main document. The QMP is the joint responsibility of both project leaders of the NIOZ Ballast Water Project. The QMP forms the basis of the project’s quality assurance and quality control (QA/QC). The Quality Assurance Project Plan (QAPP) is the project-specific technical document reflecting the specifics of the NIOZ test facility, the BWTS tested, and other conditions affecting the actual design and implementation of the required experiments, such as test water quality, sampling and sample storing, the measurement of IMO-required variables and a general outline of the QA/QC. Variable-specific QA/QC measures are contained in each individual SOP, that together form section three of the QAPP. Notebooks are used to record data, observations and deviations from SOPs, that are made during BWTS tests as well as during laboratory analyses. All notebooks are stored in the NIOZ Ballast Water archive. In a number of cases, such as in monitoring NIOZ harbour test water temperature and salinity, and in the in-line measurement of turbidity and salinity of test water at intake, data loggers are used to store information electronically. All digital 8 NIOZ Land-based Project Plan information is stored on a dedicated server that is accessible to Ballast Water Project personnel only. Specific forms are used to record data during specific routine monitoring activities. These activities include monitoring of meteorological and environmental data and equipment functioning during BWTS tests, as well as the identification and enumeration of >50 µm organisms. All forms are stored on paper in the NIOZ Ballast Water archive or in electronic format on the Ballast Water Project server. Specific forms for sample custody are also used in case of the analyses of pathogenic bacteria or specific chemical (toxicological) analyses, which are carried out in commercial laboratories of third parties. Standard Operating Procedures or SOPs are available for each IMO variable that the test facility is obliged to measure. For abiotic variables the analysis methods stem from decades of NIOZ experience as an oceanographic institute. New methods, in particular those for biological variables, are or will be published in international peer-reviewed scientific journals, i.e. subjected to anonymous scientific quality control. In addition, SOPs are present for specific actions during the BWTS testing such as for adjusting the salinity of the test water, flow cytometer data analysis or the cleaning of ballast water tanks. SOPs are numbered by year and version. Paper copies are kept in the NIOZ test facility archive. Electronic copies are stored on a dedicated server that is accessible to Ballast Water Project personnel only. SOPs are critically reviewed during the operation of the test facility as well as during annual reviews by the quality manager. SOPs relevant to the QAPP can be found in section 3 of this project plan. The test protocol (QAPP, QMP and SOPs) are submitted before the start of the BWTS tests to the class societies that were designated by the national authorities. These are the BSH (Bundesamt für Seeschifffahrt und Hydrographie or Federal Maritime and Hydrographical Agency, Hamburg) for Germany and Lloyds Register (London, Rotterdam) for The Netherlands (Inspectie Leefomgeving en Transport, ILT), United Kingdom (Maritime and Coastguard Agency, MCA) and Greece. The BSH and Lloyd’s Register are notified in advance of the BWTS test dates including the days of intake and discharge, and are invited to witness all test related activities at the NIOZ test facility. In 2012 additional oral presentations on BWTS testing at NIOZ were given to the Dutch IMO representative and ILT, the BSH and to Lloyd’s Register. 4. Personnel qualifications and training All research personnel of the NIOZ test facility are actively involved in the development of SOPs and the QA/QC measures as part of these SOPs. The quality manager is responsible for the QA/QC in each SOP and he checks the proper execution of QA/QC during BWTS testing and the analysis of samples and data. The quality manager will report the acquired QA/QC information to the project leader of ballast water research who will, if necessary, instruct the personnel to adjust QA/QC measures. The quality manager will also use this information in his evaluation of the BWTS test results. All research personnel of the NIOZ test facility is trained in such a way that at least two staff members are able to perform a specific sampling or analysis. This should prevent personal bias in sample and data analysis. In addition, this procedure ensures that in case of unexpected staff absence, sampling or sample analysis can still be carried out by trained personnel. In case of non-automated sample analysis, the microscopic identification and enumeration of planktonic organisms the research personnel is trained in groups of three. At the beginning of each year NIOZ test water is analysed by all three staff until the difference in individual plankton concentrations is <10%. Furthermore, in the case of >50 µm organisms, the correct execution of sample and analysis procedures and identification and enumeration of the organisms is audited annually by an external independent consultant. In 2012 this was performed by Mr. F. Fuhr of KiTe Aquatic Resources Consulting (The Netherlands). Additional training of staff members takes place on-the-job during inter-comparison workshops of the ballast water test team in cooperation with the planktonlab of the Department of Biological Oceanography of NIOZ. One such workshop was the comparison 9 NIOZ Land-based Project Plan of flow cytometers held in January 2012. Furthermore, a statistics course is planned for autumn-winter 2012. A QA/QC course is planned for the winter of 2012-2013. 5. Procurement of items and activities The BWTS test facility is part of the NIOZ research institute and is required to use the NIOZ facilities for procuring items and services that include all sampling and laboratory equipment and chemicals. The financial management assistant to the test facility ensures that all procedures are as required by internal NIOZ rules and by Dutch law. Material and equipment for the test installations is procured by Mr. A. Smit of Smittech (Den Hoorn, The Netherlands). In all cases of procurement the quality, costs and supplier reputation are evaluated by research staff or Mr. A. Smit in collaboration with the project leader of Ballast Water Research or, in his absence, the quality manager. Outsourced sample analyses are performed by commercial parties that have an established quality management program. 6. Documents and records Documents related to the NIOZ test facility and BWTS testing include: legal and financial contracts, BWTS-specific project plans (including QAPP, QMP, SOPs), North Sea Ballast Water Opportunity (NSBWO) documents, notebooks, data and custody forms, student reports, internal reports on, for instance, inter-comparison workshops and scientific publications. Legal and financial contracts are archived as required by NIOZ under the responsibility of the financial management assistant and the overall project manager. North Sea Ballast Water Opportunity (NSBWO) documents are maintained by the general and financial management assistants or by the project leaders. Notebooks, data and custody forms are archived for at least five years by the project leader of ballast water research. BWTSspecific project plans (including QAPP, QMP, SOPs), student reports, internal reports and scientific publications are also archived by the project leader of ballast water research. Reports on new technologies as well as for bench-scale tests to examine prototypes and components of BWTSs and other documents pertaining to the test facility are numbered sequentially as “NIOZ Ballast Water Report yyyy-1,2,..”. The generic BWTS-specific project plan (including QAPP, QMP, SOPs) as well as the G8 and G9 reports will also be numbered sequentially as NIOZ Ballast Water Reports. These documents will be made publically available on the NIOZ web site. 7. Computer hardware and software The computer hardware that is used in the NIOZ test facility consists of lap tops and personal computers that use Windows™ based software. Both hard- and software are maintained by the NIOZ “Information and Presentation Centre” (IPC). IPC is also responsible for the security of data and other information, for instance by using up-to-date virus protection and making daily back-ups. The NIOZ network can only be accessed by authorised personnel and students. In addition, all BWTS test data are stored on a dedicated network-share that is accessible only to authorised ballast water team members. This authorisation needs to be granted by both IPC and one of the project leaders of the ballast water project. All software used by the NIOZ test facility, including Microsoft Office and dedicated software for data analysis, is legally obtained. 8. Planning Manufacturers of BWTSs that approach the NIOZ facility for testing of their equipment should be aware of several planning criteria. 10 NIOZ Land-based Project Plan First of all, because NIOZ uses natural test water, spring and summer are the only periods of the year in which proper testing according to IMO regulations and NIOZ quality objectives can be performed. Second, as part of a research institute it may be of interest to the facility that the BWTS to be tested is of a different design as previously tested BWTSs. The two project leaders of the test facility jointly decide on the admission of a BWTS for land-based testing. In case of requests for combined land-based and ship-board tests the admission will be discussed with the NIOZ partners IMARES and GoConsult. Contracts on behalf of the NIOZ will be signed by one of the NIOZ directors. The provisional project plan and planning for testing the BWTS is made by the project leader of ballast water research. Next, the provisional project plan and planning is discussed in the ballast water team where all practical issues including those related to quality management are addressed. 9. Implementation of work processes Quality management objectives as specified in this QMP and in the QAPP and SOPs are implemented in the work process. At the lowest level, individual members of the facility’s test team are responsible for carrying out quality checks as detailed in SOPs on a daily basis. The quality manager is responsible for supervising QA/QC activities during all test and laboratory activities. The quality manager will give his feedback during each team meeting, that is scheduled at least bi-weekly during BWTS tests. On advice of the quality manager, the project leader of ballast water research gives permission to revise quality documents or to produce new documents. 10. Assessment and response During BWTS tests inspections may be made by inspectors of Lloyd’s Register or the BSH depending on the national authority that will apply for type approval at IMO. All ballast water team members are obliged to report deviations from quality standards or procedures to the quality manager. At the end of each BWTS test the quality manager will report on all deviations from the QAPP or from QA/QC measures in SOPs. The quality manager also checks the BWTS test data that are compiled by the project leader of ballast water research. The project leader of ballast water research will report any deviations in harbour test water monitoring data and intake test water data from the QAPP to the quality manager. 11. Quality improvement All team members are motivated to enhance specific QA/QC measures and methods. Regular feedback between team members and the quality manager will enhance selfimprovement. In addition, the NIOZ quality objectives are submitted to independent external reviewers. NIOZ test facility methods are compared and discussed in NSBWO workshops with other test facilities and experts in the field of ballast water research. Proficiency tests for the enumeration of aquatic organisms will improve the quality of analyses and will enhance the comparison of results between test facilities. The NIOZ test facility invites comments to improve the quality of its tests and its test data, for instance from class societies and through its membership in the Global Testnet. 11 NIOZ Land-based Project Plan 12 NIOZ Land-based Project Plan Section 2: Quality Assurance Project Plan (QAPP) 1 INTRODUCTION 2 GENERAL DESCRIPTIONS 2.1 2.2 2.3 3 NIOZ profile Profile of the CATHELCO group Technical overview of CATHELCO’s BWTS 14 15 16 16 TEST FACILITY 3.1 3.2 3.3 3.4 3.5 3.6 4 NIOZ test facility Freshwater intake at Den Helder and transport to NIOZ BWTS test set-up: treatment and control tanks Toolbox meetings Ballast water book Test season: time planning 20 21 24 24 25 25 TEST WATER: QUALITY, SAMPLING, STORING 4.1 4.2 4.3 4.4 4.5 4.5.1 4.5.2 4.5.3 4.5.4 4.5.5 5 Abiotic quality Biological quality General sampling strategy Abiotic variables: sampling and storing Biological variables: sampling and storing Sampling organisms ≥50 µm Sampling and storage of 10≤µm<50 organisms Sampling and storage of total and viable heterotrophic bacteria Sampling of human pathogens Sampling for additional incubation (viability) experiments 33 26 27 28 29 31 31 32 32 32 MEASUREMENT OF VARIABLES 5.1 5.1.1 5.1.2 5.1.3 5.1.4 5.2 5.2.1 5.2.2 5.2.2.1 5.2.2.2 5.2.3 5.2.4 5.2.5.2 5.2.5.3 6 Abiotic variables Salinity, Temperature and pH TSS/POC (Total Suspended Solids/Particulate Organic Carbon) Dissolved Oxygen (DO) Dissolved Organic Carbon (DOC) Biological variables Counting of organisms ≥ 50 µm Counting of organisms 10≤µm<50 Counting viable microzooplankton Counting viable phytoplankton Counting total heterotrophic bacteria Human pathogens PAM measurement for total phytoplankton viability Counting phytoplankton <10 µm 34 34 34 34 34 36 36 37 37 37 38 39 40 41 Quality assurance / Quality control (QA/QC) 6.1 6.2 6.3 7 Ballast water tests Laboratory analyses Data analysis REFERENCES 13 NIOZ Land-based Project Plan 42 42 42 44 1 INTRODUCTION The QAPP detailed in this document forms the basis for the biological efficacy testing of the CATHELCO Ballast Water Treatment System (BWTS) manufactured by Cathelco GmbH (Kiel, Germany) in 2012 at the ballast water treatment facility of the Royal Netherlands Institute for Sea Research in The Netherlands. The first version of this protocol was submitted to the BSH (Bundesamt fuer Seeschifffahrt und Hydrographie or Federal Maritime and Hydrographical Agency, Hamburg, Germany) in March 2012 in advance of the land-based tests that started on April 12 of that year. This Cathelco test protocol is a combination of a Quality Assurance Project Plan (QAPP) and a Quality Management Plan (QMP). In previous versions of this protocol these two were merged. The QAPP is a project specific technical document reflecting the specifics of the BWTS tested, the test facility, and other conditions affecting the actual design and implementation of the required experiments. The QMP should address the quality control management structure and policies of the test facility. In 2012 the combined QAPP and the QMP, collectively known as the quality control/quality assurance (QA/QC) program, was extensively extended when compared to previous years. Nevertheless, the BSH invited dr. A. Cangelosi (Northeast-Midwest Institute, USA) to review the QA/QC section of the protocol. In addition, NIOZ commissioned a review of the entire protocol to dr. S. Kools (Grontmij, The Netherlands). The present version of the protocol is revised in reaction to these two reviews. In the summer of 2012 the BSH decided that a sufficient number of marine (saline) tests had been performed earlier that year and that five successful freshwater tests were needed for type approval. This meant that additional information had to be added on freshwater sampling and testing in the relevant chapters of this protocol. The tests outlined in this protocol will evaluate the biological efficacy as outlined in the Guidelines for Approval of Ballast Water Management Systems, G8, adopted on 22 July 2005 as Resolution MEPC.125(53) (IMO, 2005) and as adopted in revised form on 10 October 2008 as Resolution MEPC.174(58/23, Annex 4) of the Ballast Water Convention of the IMO (IMO 2008). The test protocol will be submitted for Type Approval by the applicant (Cathelco GmbH) to the German National Administration (BSH). The Cathelco BWTS is composed of two main modules to disinfect ballast water of ships. One module is a filtration system, the second a UV-reactor. Both are operated during ballast water intake. During de-ballast operations the ballast water from the tanks passes again through the UV-reactor before discharge. The applicant gives a brief description of the main components of the BWT system in chapter 2. A detailed description of the test facility and the design of the test, sampling, sample storage and descriptions of the measurements of abiotic as well as biological variables are given in ensuing chapters. Because NIOZ is an academic research institute additional methods to count organisms and to establish their viability are continuously being developed. These methods may be applicable to efficacy testing according to the present as to potentially future D-2 Ballast Water Performance Standards and G8-guidelines. 14 NIOZ Land-based Project Plan 2 GENERAL DESCRIPTIONS Figure 1. Aerial view of the NIOZ harbour (lower right), NIOZ and the TESO ferry connecting the island of Texel with the main land (top). The Mokbaai is the source for additional suspended solids. ©Photo: Simon Smit Photography, Den Burg, Texel. 2.1 NIOZ profile All tests of the Cathelco BWTS will be carried out under supervision of the Royal Netherlands Institute for Sea Research, Landsdiep 4, 1797 SZ 't Horntje, Texel, The Netherlands (from here on NIOZ, for details see: www.nioz.nl) NIOZ Royal Netherlands Institute for Sea Research is the National Oceanographic Institute of the Netherlands. NIOZ is an institute of the Netherlands Organization for Scientific Research (NWO). The institute employs about 340 people at locations on the island of Texel on the border of the North Sea and the Wadden Sea (main location) and in Yerseke in the southwest of the country. The annual budget is approximately €30 million. The mission of NIOZ is to gain and communicate scientific knowledge on coastal seas and oceans for a better understanding of the system and sustainability of our planet, to manage the national facilities for sea research and to support research and education in the Netherlands and in Europe. In order to fulfil its mission, the institute performs tasks in four specific fields. Research: The emphasis is on innovative and independent fundamental research in continental seas and open oceans. Increasingly, the institute also carries out research based on societal issues. The senior scientists at NIOZ all participate in international research projects. Several of them also hold a professorship at Dutch or foreign Universities. Education: The institute educates PhD students and master students of universities and schools for professional education. Together with several universities, NIOZ also organises courses for PhD students and master students in the marine sciences. A number of our senior scientists is also appointed as professor at Dutch and foreign universities. 15 NIOZ Land-based Project Plan Marine Technology: NIOZ has its own workshops for mechanical, instrumental en electronical engineering. Here, marine research equipment is being designed and built according to the wishes of our individual scientists. Facilities: NIOZ invites marine scientists from Dutch and foreign institutes and universities to write scientific proposals involving the institute’s research vessels, laboratories and large research equipment. Our ocean-going research vessel 'Pelagia' is shared on a European level in the 'Ocean Facilities Exchange Group' (www.ofeg.org) The basic scientific disciplines at NIOZ are physics, chemistry, biology and geology. Multidisciplinary sea research is regarded as one of the main strengths of the institute. Therefore, the research is organised in 5 multi-disciplinary themes: 'Open ocean processes, Sea floor dynamics, Wadden and shelf sea systems, Climate variability and the sea and Biodiversity and ecosystem functioning'. Together with a number of oceanographic partners, NIOZ also maintains the popular marine website www.seaonscreen.org. For more information, please contact our Communication & PR department at [email protected], or visit our website at www.nioz.nl NIOZ has extensive experiences in the field of ballast water and ballast water treatment technologies at its harbour on the island of Texel. During the past seven years several pilot test for ballast water treatment were conducted in the NIOZ harbour and so far, between 2007 and 2010 seven full scale land-based tests were carried out for Final and Type Approval. 2.2 Profile of the Cathelco Group Cathelco Ltd was formed in 1956 and has become a world leading supplier of cathodic protection equipment to the shipping and offshore marine markets. The parent company based in Chesterfield, United Kingdom manufactures marine pipe work anti-fouling (AF) and impressed current cathodic protection (ICCP) systems. The Cathelco Group has grown through a series of acquisitions beginning with Corrintec Ltd in 1995. Today, Corrintec Marine continues to operate as a wholly owned subsidiary serving the military sector worldwide. In 2005, the company established Cathelco Korea, a subsidiary engaged in manufacturing and distribution serving the Korean shipbuilding market. More recently, in 2010, Seafresh Desalinators Ltd was acquired which specialises in reverse osmosis water makers from a manufacturing facility in Bournemouth, United Kingdom. To serve the shipbuilding and repair industry in South East Asia, Cathelco S.E.A. based in Singapore, became a subsidiary in 2011. In addition to its marine engineering activities, the Cathelco Group encompasses Casting Repairs Ltd, specialising in the repair of architectural cast ironwork. It also has an active property division, focusing on property development and rental via the Broomco Ltd subsidiary. Cathelco GmbH was established in 2010 in Kiel, Germany, to research and develop ballast water treatment equipment for the worldwide market. The aim is to develop a chemical free, two step- ballast water treatment system. This system should be easy to retrofit for existing vessels and innovative for new builds. Beside the ballast water issue, the Cathelco R&D Centre provides also services to the Cathelco Group in respect of testing and improving of existing products. This includes but is not limited to antifouling systems for vessels and other marine structures. 2.3 Technical Overview of Cathelco’s BWTS Cathelco has developed a 100% chemical free BWTS (Figure 2). It is based on the combination of filtration + UV treatment. There are no active substances needed for the treatment of the ballast water, or for the cleaning of the UV system. The system was designed with emphasis on retrofitting (e.g. installation of the different components as required by different engine room designs). However, skid-mounted systems will also be available, which are optimized for foot-print. 16 NIOZ Land-based Project Plan Cathelco's BWTS is a modular ballast water management system. The system is installed in bypass to the main ballast line and provides a safe, flexible and economical process for the treatment of ballast water and eradication of aquatic invasive species. Treatment of ballast water is achieved through a simple and efficient two-step process. 1. Filtration The ballast water passes through an automatic back flushing filter capable of removing particulates, and organisms (zooplankton and phytoplankton) using a 40 µm super mesh screen. The screen is arranged in cone shaped filter candles, where the number of filter candles varies with the treatment related capacity (TRC) of the BWTS. During the NIOZ G8-tests to be performed at 200 m3/h the number of filter candles will be nine. The automatic cleaning cycle of the filter is activated by an increased pressure drop across the filter. The filter candles are cleaned one after the other without interruption of the filtration process. The frequency of the filter back flushes depends on the quality of the water (e.g. the TSS content). The concentrate is discharged over board. This ensures that the screen is kept clean and the filtration process maintained at maximum efficiency at all times. 2. UV disinfection The filtered ballast water is directed into the disinfection chamber where a cross flow arrangement with two medium pressure ultraviolet lamps delivers the high intensity irradiation. The UV light intensity is continuously monitored during system operation so that intensity is maintained above pre-set values to ensure delivery of the required dose. The ultraviolet lamps are housed within quartz sleeves and an automatic mechanical cleaning system minimizes bio-fouling and controls the accumulation of deposits on the UV lamp sleeves. Figure 2. The Cathelco ballast water treatment system to be tested at NIOZ in 2012. This design allows for an easy exchange of the filters. At discharge, the automatic backwash filter is by-passed and the ballast water is pumped from the tanks through the UV disinfection chamber only. Thus the ballast water is subjected to UV disinfection treatment prior to discharge overboard. 17 NIOZ Land-based Project Plan Specific features/advantages of Cathelco’s BWTS The filtration step Cathelco's BWTS can be operated with two different types of filters, giving it the maximum possible flexibility in addressing different installation requirements. The UV-lamp system Cathelco's BWTS uses special medium pressure UV lamps with a reduced Mercury content. These lamps are mounted to a solid flange and they are surrounded / protected by a sealed robust quartz sleeve. This complete UV-lamp system, containing two lamps, is fitted to the UV reactor by a few screws. Access to the UV reactor for maintenance is from a single side only. The lamp recycling scheme On an annual basis, the UV-lamp system should be send off to Cathelco for refurbishment. The renovated lamp system will be returned to the ship with a new 1 year operating guaranty, if the lamp system has not been installed for a total time of more than 2 years. The automated cleaning system of the UV This is the first NON-chemical in place cleaning system for UV-reactors (CIP-system). It uses rubber cleaning elements that are supplied on demand to the UV reactor after the BW operation is finished. The cleaning process is triggered by the intensity measurement of the individual UV lamps. Start, stop and duration of the cleaning process are controlled by Cathelco's BW system. No manual interference is needed. Figure 3. Process plan of Cathelco’s BWTS. Water flows: black lines: at intake; yellow lines at discharge and red lines during cleaning of the UV unit. Calculation of the UV dose The UV dose is calculated directly from the water quality (UV transmittance of the water) and from the flow rate. The use of single electronic ballast units for each individual UV lamp allows for a maximum of flexibility in the power consumption. The UV lamps are operated at the most suitable dose rate at any time, allowing for significant savings in overall power consumption of the system. The UV dose at T10=70% will be about 135 J/m² at 200m³/h flow rate. This dose is above the requirements for a 4 log reduction of many microorganisms, if no photo repair mechanism occurs. As there is no light inside the ballast water tanks, our system accepts this dose during ballasting only. If the UV-T decreases further, the flow will be reduced 18 NIOZ Land-based Project Plan automatically to ensure that the minimum dose (133 J/m²) is maintained. During de-ballasting, the water is much clearer, i.e. UV-T is higher, and the Cathelco system will dose between 400 J/m² and 700 J/m², which is well above the dose requirements (for a 4 log reduction) for the majority of organisms, even in the presence of photo repair mechanisms. Cathelco’s BWTS will be tested at a treatment related capacity (TRC) of 200 m³/h during the land based Type Approval Tests at the NIOZ test facility. There will be two UV-reactors and two different filters involved during the tests. The general layout of the test system should be according to the P&ID in Figure 4. Figure 4. Piping and Instrumentation diagram of Cathelco’s BWTS for a TRC (treatment related capacity) of 200 m3/h. 19 NIOZ Land-based Project Plan 3 TEST FACILITY 3.1 NIOZ test facility The land-based tests will be carried out on the island of Texel (NIOZ harbour, NL) from March to July (spring and early summer season). The NIOZ test-site is equipped with two times (Navicula and Pelagia quay) three silos or underground storage tanks of 300 m³ each to simulate ship’s ballast water tanks (Figure 5). The NIOZ harbour is located at the Marsdiep tidal inlet between the North Sea and the Wadden Sea. By sampling in different phases of the tidal cycle, waters from different seas with different abiotic and biological characteristics can be used in G8-tests. The area as a whole is characterized by a rich and varying biodiversity and high number of various planktonic organisms, especially in the spring and early summer period. During the test cycles the numbers of organisms present in the water will continuously be monitored to assure that the validity of the test cycles is in accordance with § 2.3.20 of the G8guidelines. Figure 5. Schematic of the NIOZ harbour test facilities, including the two quays (Navicula and Pelagia) that are used in G8-tests. 20 NIOZ Land-based Project Plan Figure 6. Piping and Instrumentation diagram of the Pelagia quay test site at the NIOZ harbour. The installation to be tested is a UV-treatment system. The installation consists of three ballast water tanks, one for control (untreated) water and two for treated water. Brine or freshwater can be added to adjust the salinity of the test water. Mud can be added to increase the concentration of Total Suspended Solids (TSS). Flow rates, system pressures, salinity and turbidity are monitored during intake and discharge. P&I diagrams are available for both Navicula and Pelagia quays and for different intake and discharge scenarios. 3.2 Freshwater intake in Den Helder and transport to NIOZ Freshwater in Den Helder will be taken in at location B (Figure 7) by a ship that normally transports gravel and sand with a capacity of 650 m3. The ship will be cleaned of any remaining sand before taking in water. The intake water will be pumped in the hold with tubes that are suspended at a height of maximally 1 meter below the water surface. Intake will take place on the afternoon prior to the tests. The Den Helder harbour is monitored by NIOZ partner IMARES. According to IMARES Den Helder harbour is eutrophic and very productive. In May-July 2012 the concentration of >50 µm organisms was between 68,000 and 22,100,000 m-3. For the 10-50 µm organisms this was 397 to 8,040 per mL. IMARES‘ experience at another location in The Netherlands learned that organism concentrations can remain high up till winter. Only when water temperature drops below ca. 7°C the zooplankton production will stop. Such low temperatures can be expected in November-December, but not during the planned G8tests in September-October 21 NIOZ Land-based Project Plan Figure 7. Freshwater intake at B („Spoorhaven“), the IMARES monitoring site in Den Helder harbour. The red horizontal bar is 0.5 km. Site A was the regular monitoring site; site B is the new IMARES monitoring site where freshwater for BWTS testing at NIOZ will be collected. The freshwater test water is transported over a relatively short distance across the Marsdiep tidal inlet of the Wadden Sea within 12 hours by ship to the NIOZ harbour (Figure 8). The day following intake at Den Helder, i.e. within 24 hours, the test water is available in the NIOZ harbour and ready to be pumped into the NIOZ harbour installation. 22 NIOZ Land-based Project Plan Figure 8. The test water will be transported to the NIOZ harbour over a distance of 6.5 km in less than 12 hours. The pump to be used is an Amarex KRTK 100-401/354WG-S that will be suspended by a crane from the NIOZ Pelagia quay (Figure 9). The crane will be able to steadily position the pump because the freshwater surface level will change according to deballasting and tide. This pump will be connected to the NIOZ installation (Figure 6) by a flexible hose. 23 NIOZ Land-based Project Plan Figure 9. The Amarex pump to be used in pumping freshwater from a boat into the NIOZ installation. 3.3 BWTS test set-up: treatment and control tanks A typical test of a treatment system is performed with two treatment tanks and one control tank that are filled in rapid succession, i.e. on the same day at approximately the same time in the tidal cycle (Figure 6). The control tank with untreated water serves as reference to examine the effect of the treatment, including holding for at least 5 days (§2.3.35 G8guidelines). The control tank can also indicate an unexpected source of mortality due to the testing arrangement (§2.3.37 G8-guidelines). Therefore, the average discharge results in the control water should not be less than or equal to 10 times the values in regulation D-2.1 (§2.3.36 G8-guidelines). 3.4 Toolbox meetings The general test set-up is described in Figure 6 and in §3.2. Directly prior to each test a tool box meeting is held on the quay site with all team members. During this meeting all actions, such as order of tanks to be filled and flow rates, are briefly discussed. 24 NIOZ Land-based Project Plan 3.5 Ballast water book All manufacturers should log their activities in a ballast water book issued by the NIOZ. Several books may be issued during the entire test period. These books remain at NIOZ in the appropriate dossier. 3.6 Test season: time planning The intermediate and high salinity range test season at the NIOZ harbour is restricted to spring and summer. In this period of the year sufficiently high numbers of organisms are naturally present in the North and Wadden Sea. At NIOZ the test water is not enriched with organisms, neither artificially cultured nor collected at sea. In general, early spring sea water has a lower salinity then in summer due a decrease in river discharge. A decrease in wind speed during spring will lead to diminishing concentrations of total suspended solids (TSS) and, therefore, sediment from the nearby Mokbaai (Figure 1) is added to increase TSS to the required value of 50 mg/l for brackish water. The freshwater test season, according to IMARES data, begins in March and probably ends in November-December. In February sampling and measurements in the harbour start in order to monitor the start of the spring plankton bloom. In March the first G8-tests may be performed, depending on natural circumstances such as water temperature and underwater light climate that affect the plankton development. The first set of tests is carried out at the intermediate salinity range of G8 (§2.3.17) because in early spring the freshwater content of the Wadden Sea is relatively high. Test water is pumped from the harbour at low tide when low salinity Wadden Sea water flows towards the North Sea. The second set of high salinity tests is performed in late spring or early summer. Test water is pumped from the harbour at high tide when relatively saline North Sea water flows towards the Wadden Sea. After consultation with the BSH, the Cathelco BWTS tests carried out in spring and early summer of 2012 were combined to one salinity (saline) range. This meant that an additional series of freshwater tests had to be performed. The first appropriate months for these freshwater tests were September and October. 25 NIOZ Land-based Project Plan 4 TEST WATER: QUALITY, SAMPLING, STORING 4.1 Abiotic quality The land-based test cycles have to be carried out at specific water qualities as defined in the G8-guidelines. The NIOZ-harbour represents a brackish water environment with a varying salinity (20 – 35 PSU). High salinity water originating from the North Sea is taken in around high tide. Low salinity water from the Wadden Sea is taken in around low tide. The salinity of the Wadden Sea water is dependent on the discharge of freshwater from Lake IJssel, which itself depends on the amount of rainfall and on the flow rates in the rivers Rhine and IJssel. In an effort to maintain a minimum 10 PSU salinity difference as requested under § 2.3.17 of G8, per tank 15 m3 freshwater is added in the pipelines to the natural water prior to the pump to reduce the ambient salinity (ca. -2 PSU) and 8 m3 brine (100 kg m-3 industrial quality salt) is added to increase salinity (ca. + 2 PSU) at the second set of test series. At present only brackish and high salinity seawater conditions can be tested at NIOZ. Figure 10. Extra natural sediment from the “Mokbaai” will be added when required to meet the minimum TSS concentration for the given salinity test cycle. In addition, per ballast tank 20 litre of mud (15.6 kg dry weight) from the nearby Mokbaai (Figure 1) will be added to the low salinity tests in order to reach the required TSS value of >50 mg/L (Figure 10). The organic carbon concentration is important in testing systems that use oxidizing agents as active substances. DOC concentrations are usually below 5 mg/L in low salinity test water but no DOC additions are made because the high POC values (>10 mg/L) in the NIOZ test water are considered to compensate for that. In other words, the total organic load in low salinity test water is sufficiently high. An overview of the required water quality, with respect to the composition of total suspended solids, particulate organic carbon and dissolved organic carbon is given in Table 1. 26 NIOZ Land-based Project Plan Table 1. Requirements of salinity, TSS, POC and DOC in the test water for the high salinity and intermediate salinity and freshwater test regimes according to the G8guidelines. High salinity Intermediate salinity Freshwater units <3 Salinity > 32* 3 – 32* PSU Total Suspended Solids (TSS) >1 > 50** > 50** mg/L Particulate Organic Carbon (POC) >1 > 5** > 5** mg/L Dissolved Organic Carbon (DOC) >1 >5 >5 *to obtain a 10 unit salinity difference either brine or fresh water may be added **natural mud is added to increase TSS as needed, this also increases POC 4.2 mg/L Biological quality In order to establish the biological efficacy of the BWTS it should be tested with water containing a high concentration of organisms as well as a sufficient biodiversity (§ 2.3.20 of G8). This is required by G8 to guarantee the effectiveness of the BWTS in different ecosystems across the globe. The variety of organisms in the influent test water should be documented according to the size classes mentioned in Table 2. Natural water, originating from the coastal zone of the North Sea (high tide) and the inner Western Wadden Sea (low tide) will be used. The test period will cover the whole spring and early summer of the plankton growth season and therefore includes the natural occurring biodiversity and species succession. The ambient plankton content in terms of species diversity in the relevant size classes is very high. For instance in 2011 16 phyla and more than 70 species were detected during the test season (Table 3). Only 5 species and 3 phyla are required (§ 2.3.20 of G8). Table 2. Minimal numbers and species diversity required at intake for different size classes and groups of organisms. 1 µm = 1 micron = 0.001 mm. Intake test water Organism unit Variety ≥50 µm > 105/ m3 at least 5 species from at least 3 different phyla/divisions ≥10 and <50 µm > 103/ mL at least 5 species from at least 3 different phyla/divisions heterotrophic bacteria > 104/ mL not further defined The natural waters of the test area include a large range of organisms varying in sensitivity to mechanical stress, UV radiation or various active substances. Besides fragile organisms also plankton that is highly adapted to harsh environmental conditions, mostly hard shell organisms, are present in the test water. For completeness, the plankton fraction <10 µm is also included in the NIOZ analyses although this is not required by the G8-guideline. 27 NIOZ Land-based Project Plan Table 3. Biodiversity as number of species in NIOZ test water according to phylum and to size class based on data from the 2011 spring and early summer test season. The test water contains at least 18 phyla with a total of 16 phyla in the 10-50 and >50 µm size classes. The total number of species in each G8-size class is 42 (8 phyla) for the 10≤µm<50, and 31 (10 phyla) for the ≥50µm size classes. Organisms <10µm that are not bacteria are not part of the D-2 regulation. The high test water biodiversity largely exceeds the G8-guideline (§2.3.20). Phyluma Number <10 µm Amoebozoa Number 10-50 µm Number >50 µm 1 Annelida 5 Arthropoda 13 Cercozoa 1 b Chlorophyta 1 Choanozoa 1 Ciliophora 1 3 Cnidaria 2 Cryptophyta 1 Ctenophora 1 Echinodermata 1 Euglenozoa 1 Haptophyta 3 Mollusca 4 Myzozoa 2 6 Nematoda 1 1 Ochrophyta 12 28 Rotifera 2 1 Unknownc Total 4 1 24 42 31 a The taxonomic system is as follows: Kingdom (Archea, Bacteria, Animalia, Chromista (“Algae”), Plantae) – Subkingdom – Infrakingdom – Phylum – Subphylum Division – Class – Subclass –Superorder – Order – Family – Genus – Species b Division (no phylum for this group) c The phylum ‘unknown’ contains several species of unidentified phytoplankton flagellates 4.3 General sampling strategy Samples are generally taken: 1) In the harbour to assess test water quality before the pump. Harbour water samples are analysed regularly from February onwards in order to monitor the spring plankton bloom. 2) Immediately before the treatment equipment from the main pipeline but after the ballast pump that is used to pump up the test water from the harbour (control, T0), 3) Immediately after treatment from the main pipeline (treated, T0) and 4) During discharge from the main pipeline, after the pump, after 5 days (control and treated, T5) holding time (§ 2.3.2 and 2.3.26 G8-guidelines) and after completing a second passage through the BWTS when this step forms part of the treatment prescribed by the vendor of the BWTS, i.e. in the case of the Cathelco BWTS (treated only). During ballast water tests samples will be taken sequentially, covering the entire intake or discharge periods. 28 NIOZ Land-based Project Plan During the tests the following sample sizes will be used: 1) Untreated water (control, T0 and T5): Sampling is conducted in-line, three times, with sample volumes of 20 L (>50 µm), 10 L and 2x 1 L. The 10 L samples are used to subsample for abiotic variables. The 1 L samples are used (1) to subsample for phytoplankton, bacteria, as well as for phytoplankton <10 µm and (2) microzooplankton (10≤µm<50). An additional 10 L sample is taken for an incubation experiment (T0 only). 2) Treated water (intake, T0): Sampling is conducted in-line, three times, with sample volumes of 1 m3 (>50 µm) using 3 IBCs of 1000 L each. Furthermore, in-line sampling is conducted three times with a sample volume of 10 L and 2x 1 L. The 10 L samples are used to subsample for abiotic variables. The 1 L samples are used (1) to subsample for phytoplankton, bacteria, as well as for phytoplankton <10 µm and (2) microzooplankton (10≤µm<50). Additional samples of 10 L are taken for incubation experiments. 3) Treated (discharge, ≥T5): Sampling is conducted in-line, three times, with sample volumes of 1 m3 (>50 µm) using 3 IBCs of 1000 L each. Furthermore, in-line sampling is conducted three times with a sample volume of 10 L and 2x 1 L. The 10 L samples are used to subsample for abiotic variables. The 1 L samples are used (1) to subsample for phytoplankton, bacteria, as well as for phytoplankton <10 µm and (2) microzooplankton (10≤µm<50). Additional samples of 10 L each are taken for incubation experiments. The (sub)-sample volumes taken from the in-line samples deviate from §2.3.32-33 (G8guideline): 10≤µm<50: 1 L for untreated water and 10 L for treated water; bacteria: 0.5 L. Note that G8 only specifies sample sizes, but not which volume of these samples should actually be analysed. The reason for this deviation is that sample volumes of 10 L for organisms 10≤µm<50 and 0.5 L for heterotrophic bacteria are impractical: much smaller volumes will eventually be analysed without compromising the analytical accuracy. The sample volumes for pathogenic bacteria are 300 and 600 mL. 4.4 Abiotic variables: sampling and storing Figure 11. Navicula quay laboratory for first line handling of samples. The measurement of the following abiotic (environmental) variables is required during sampling (G8 § 2.3.25): 1) salinity, 2) temperature, 3) Particulate Organic Carbon (POC), 4) Total Suspended Solids (TSS), 29 NIOZ Land-based Project Plan 5) pH, 6) Dissolved Oxygen (DO) and 7) Dissolved Organic Carbon (DOC). Turbidity is also mentioned in § 2.3.25 (G8) but experience has learned that it is difficult to reliably measure this variable in water samples of limited volume taken during intake or discharge. Furthermore, turbidity is a function of TSS, a variable that is measured accurately and with far better precision. In addition, NIOZ research has shown that at low TSS values a standard turbidity instrument underestimates the actual solid content of the water. Rapid measurement and processing of samples for the basic variables is ensured by the NIOZ harbour laboratory on the Navicula and Pelagia quays of the test facility (Figure 11). A number of measurements is performed after sampling (e.g. temperature, salinity and pH), while the other samples (DOC, POC, TSS, DO) is processed for later analysis. DOC samples are filtered through GF/C filters and sealed in pre-combusted glass ampoules or special screw cap bottles after adding hydrochloric acid (HCl). Sealed ampoules or bottles are stored at 4°C until analysis. For TSS/POC measurements pre-weighed glass-fibre filters (GF/C) are used. Each filter is coded and stored individually in a Petri dish. The filtered water volume is not constant but depends on the particle concentration of the test water. The higher the particle concentration in the sample, the smaller the volume that can be filtered before clogging. Practical volumes are 100-1000 mL per sample. After filtration the filter is rinsed with demineralised water to remove sea salts. The filter is then put back in its original Petri dish and stored temporarily in a freezer at –20°C or long-term at -80°C until further analysis. Glass Winkler bottles for oxygen (DO) are flushed at least three times their volume (ca. 120 mL) with test or control water. Great care is taken to avoid gas bubbles on the wall of the bottle or excessive mixing of air and water. Next, MnCl2 and NaOH solutions are added to the bottle just below the surface by using dispenser units to fix the oxygen concentration. A stopper secured with a rubber band is put on the bottle and the bottle is gently mixed. Bottles are stored in a dark container filled with water of the same temperature as the samples until further analysis in the laboratory (Figure 12). Figure 12. Glass bottles for Dissolved Oxygen (DO) measurements are stored submerged prior to analysis. 30 NIOZ Land-based Project Plan Figure 13. Sampling point on a tank at the Navicula quay for sampling dissolved gasses such as dissolved oxygen. In special cases gastight tubing which is fitted to the sampling tubing is used to avoid exchange of gasses, such as CO2 or oxygen, between water and surrounding atmosphere (Figure 13). All environmental variables are measured in triplicate samples (§ 2.3.29 G8-guidelines). From 2012 onwards, additional continuous measurements of temperature, salinity, flow rate, system pressure and turbidity will be made at intake and discharge by sampling via a specific sample port equipped with the appropriate monitoring instrumentation (e.g. S and T in Figure 3). The data will be logged electronically and will be used to monitor basic system variables during intake and discharge of the BWTS tests. 4.5 Biological variables: sampling and storing Biological variables that need to be considered (Regulation D-2 and § 2.3.20-21 G8guidelines) are: (1) Concentration and diversity of organisms ≥50 µm, (2) Concentration and diversity of organisms 10≤µm<50, (3) Concentration of heterotrophic bacteria, (4) Concentration of coliform bacteria, (5) Concentration of Ent erococcus bacteria, and (6) Concentration of Vibrio cholera. The groups of organisms ≥50 µm and 10≤µm<50 consist of both algae (phytoplankton, mainly < 50 µm) and animals (zooplankton, mainly >50 µm). According to the Ballast Water Performance Standard (Regulation D-2 and § 4.7 G8-guidelines) only viable organisms must be counted at the end of the test in both the treatment and the control tanks. For both of the IMO relevant size classes (organisms ≥50 µm and 10≤µm<50), multiple methods of enumeration and of assessing the viability are applied at NIOZ to verify the results at a high level of confidence. In principle all methods should give a conclusive answer with respect to numbers and/or viability of the (remaining) organisms. At NIOZ the viability of all organisms is not only measured at discharge but during intake as well. Furthermore, the concentration of phytoplankton <10 µm is measured. All biological variables are measured in triplicate samples (§ 2.3.29 G8-guidelines). 4.5.1 Sampling organisms ≥50 µm The samples of the untreated water (20 L) are taken in triplicate, collected in clean buckets that are filled directly for volumetric measurements, and poured through a 50 m sieve made from the same gauze as the sampling nets used for the 1 m3 IBC samples. Discharge water samples are collected using Hydrobios™ 50 m diagonal mesh size nets, as recommended in MEPC 54/Inf.3, that are fitted into 1m3 IBC’s (Figure 14). Sampling is 31 NIOZ Land-based Project Plan conducted via flexible hoses which are connected to the sampling points. To sample treated water the hose is put into the Hydrobios™ net. The whole sampling procedure will be timed in a way to cover the whole period of filling the ballast water tank with ca. 250 m3 water. For practical reasons all organisms quantitatively retained on the 50 m net are considered as larger than 50 m in minimum dimension. The organisms retained in the cod-end of the Hydrobios™ net are flushed into a beaker using a squeeze bottle containing filtered seawater. Organisms are kept in approximately 100 to 200 mL of filtered (≤0.2 µm filter) sterile water of the relevant salinity. Samples are transferred to the lab directly after sampling, treated for 2 hours with the viability stain ‘Neutral Red’, and counted. These samples are not stored. Figure 14. Intermediate Bulk Containers (IBCs) of 1 m3 each. A 50 µm Hydrobios™ plankton net is fitted in the containers through the lid for easy sampling. 4.5.2 Sampling and storage of 10≤µm<50 organisms Samples for the 10≤µm<50 fraction are taken as undisturbed (unfiltered) one litre samples. This size-fraction is not separated from the organisms <10 µm or >50 µm at sampling or during sample processing but during data analysis. This approach reduces damage to more delicate organisms as ciliates and non-armoured flagellates. Whole, intact samples of 1 L are stored in the dark prior to analysis in the laboratory. The total concentration of 10≤µm<50 phytoplankton cells is measured in non-fixed samples. The concentration of dead phytoplankton cells is measured using SYTOX-Green, also in non-fixed samples. The difference between the concentrations of total and dead organisms is the concentration of viable organisms. As a reserve a 5 mL sample is fixed with formaldehyde and stored at -80°C for up to one year. This fixed sample can no longer be used to determine the viability of the organisms. The samples for 10≤µm<50 microzooplankton are fixed with Lugol’s solution; they can be stored in a refrigerator for up to one year before counting takes place. The viability of the organisms is assessed from their intact morphology. 4.5.3 Sampling and storage of total and viable heterotrophic bacteria To determine the total concentration of bacteria samples fixed with formaldehyde are frozen and stored at -80 °C until counts are made after staining with PicoGreen. Dead bacteria in non-fixed samples are measured in fresh test water using SYTOX-Green; these samples cannot be stored. The difference between the concentrations of total and dead bacteria is the concentration of viable bacteria. 4.5.4 Sampling of human pathogens Live samples for microbiological analysis are taken in sterile bottles of 300 or 600 mL and sent to a special laboratory (Eurofins/ C.mark) for further analysis. The samples are transported immediately after sampling using a cooled transport container (4 °C). 32 NIOZ Land-based Project Plan 4.5.5 Sampling for additional incubation (viability) experiments Additional incubation experiments, which are not required by G8, serve to better assess the effect of the different ballast water treatment systems and the five day tank storage on cell viability and concentration. In case the treatment is insufficient and residual viable organisms remain present or resting stages or cysts germinate, growth of the plankton will be stimulated under favourable conditions. This incubation method also allows studies on the effect of the treatment over a period longer than 5 days (up to 20 days). The experiments usually involve control and treated water that were sampled at T5, the day of discharge. They are performed in 10 L flasks in a climate room under optimal growth conditions for the plankton community, including irradiance, temperature and turbulence. A sufficiently high level of nutrients is ensured through the addition of nitrate, phosphate and silicate, favouring phytoplankton growth and stimulating cyst germination throughout these experiments. The standard variables measured include phytoplankton and microzooplankton abundance (<10µm and 10≤µm<50), the viability of phytoplankton (PAM fluorimetry) and the abundance of bacteria. Usually the incubation time is seven days. In more elaborate experiments samples are taken daily and may include multiple analyses of phytoplankton and heterotrophic bacteria. 33 NIOZ Land-based Project Plan MEASUREMENT OF VARIABLES 5 A list of all abiotic and biotic variables that are required by G8 is provided in Table 5.1. All variables are measured in samples of test water, taken during intake and discharge as required. Turbidity is a function of TSS, and because turbidity is difficult to measure reliably at relatively low TSS concentrations, this variable is only measured in-line and not in separate samples. Vibrio cholerae is not present in NIOZ test water, cannot be added, and hence is not sampled for. An additional measurement is that of phytoplankton <10 µm, which is not an IMO requirement (Table 5.1). All measurements are described in the Standard Operating Procedures (SOPs) that are listed in section 3 of this project plan. Samples for E. coli and enterococci are outsourced and analysed according to NEN-ISO standards (Table 5.1). A brief description of all relevant methods is given in the following paragraphs. 5.1 Abiotic variables 5.1.1 Salinity, Temperature and pH Water samples for salinity, temperature and pH are collected in 10 L buckets. Measurements are either done immediately or after storage (maximum 6 hours) in the dark and at ambient temperature. Salinity is measured with a digital conductivity meter. Temperature is measured with a calibrated digital thermometer. pH is measured with a calibrated digital pH meter. 5.1.2 TSS/POC (Total Suspended Solids/Particulate Organic Carbon) For TSS analysis filters are dried at 60°C for at least 8 hours and weighed again. The concentration of TSS per litre can be calculated from the sample volume and the weight difference of the filter before and after sampling. TSS is expressed as mg/L. Next, to determine the POC concentration the same filter is combusted overnight at 500°C and allowed to cool in a dessicator and weighed again. The POC is calculated from the weight difference between this measurement and the dry TSS weight. POC is expressed as mg C/L. 5.1.3 Dissolved Oxygen (DO) Fixed samples in Winkler bottles are acidified with H2SO4 prior to measuring the optical density (OD) at 456 nm with a spectrophotometer. The oxygen concentration is calculated using standards and expressed as M O2/L (or mg O2/L = M O2 * 0.032). Since both salinity and temperature change over the season the oxygen concentrations is expressed as percentage relative to the natural saturation value for the given temperature and salinity. 5.1.4 Dissolved Organic Carbon (DOC) The DOC concentration is determined in the laboratory by a high temperature combustion method using a Shimadzu TOC-Vcpn analyser according to Reinthaler & Herndl (2005). Standards are prepared with potassium hydrogen phthalate (Nacalao Tesque, Inc, Kioto, Japan). The mean concentration of triplicate injections of each sample (three in total) is calculated. The average analytical precision of the instrument is <3 %. 34 NIOZ Land-based Project Plan Table 4. List of variables measured in land-based tests at NIOZ Variable unit IMO required Reference Salinity PSU Y SOP Temperature °C Y SOP pH - Y SOP TSS mg/L Y SOP Particulate Organic Carbon mg/L Y SOP Dissolved Oxygen % saturation Y SOP Dissolved Organic Carbon mg/L Y SOP Viable organisms ≥50 µm, including diversity 3 number per m , number of phyla and species Y SOP Organisms 10-50 µm number per mL Y SOP Phytoplankton diversity number of phyla and species Y SOP Phytoplankton viability (PAM fluorimetry) Fv/Fm Y SOP Phytoplankton viability (SYTOX Green) number per mL Y SOP Organisms 10-50 µm number per mL Y SOP Microzooplankton diversity number of phyla and species Y SOP Microzooplankton viability + or - Y SOP Organisms <10 µm number per mL N SOP Heterotrophic bacteria number per mL Y SOP E. coli cfu per 100 mL Y NEN-EN-ISO 9308-1 Enterococci cfu per 100 mL Y NEN-EN-ISO 7899-2 (phytoplankton) (microzooplankton) (phytoplankton) 35 NIOZ Land-based Project Plan 5.2 Biological variables 5.2.1 Counting of organisms ≥50 µm For minimum dimension measurements the "body" of the organism should be measured, i.e. not antennae, tails etc. Examples are presented in Figure 15. C A D B E F G Figure 15. Minimum dimension measurements (red line) in selected organism types: A = bivalve larvae, B = gastropod larvae, C = worm, D = echinodermata larvae, E and F = crustacean larvae and G = copepod. The viability of the organisms is assessed with Neutral Red, which stains living organisms only and does not affect their survival rate. This viability assessment remains unaffected by the possible death of organisms during staining or during sample analysis due to, for instance, warming of the sample. This is because organisms that die after addition of the Neutral Red will still be clearly stained, while those already dead prior to the addition will not be stained. Neutral Red is pipetted in a ratio that yields an end concentration of approx. 1:50.000. The Neutral Red stock solution is 1:2.000, i.e. approximately 4 mL of stock solution is needed to stain a sample of 100 mL. The staining time is ≥ 2 hours. Stained samples are filtered over a 30 µm sieve and flushed into a Bogorov-dish with filtered seawater. Samples are analysed using a binocular with a 20x magnification for counting and up to 80x for species identification and measurements when necessary. Neutral Red stains all major plankton groups, including phytoplankton, but it seems to have some limitations for bivalve larvae. For the latter movement, including that of hart and gill is used to verify viability. This is dependent on the expertise of the person analysing the samples. Therefore, only persons with a dedicated training period will analyse samples. Organisms that are able to swim are also considered alive. In doubt, the organism can be poked with a dissection needle. The procedure is outlined in Figure 16. 36 NIOZ Land-based Project Plan Organisms larger 50µm – landbased tests Viability testing Filling/emptying of test tanks Structural integrity undisturbed Structural integrity disturbed Sampling with 50µm-net * Stained Transfer of organisms into filtered water & transport to lab and/ or Adjustment of volume to 100 – 200 ml and addition of stain in a 1:50.000 ratio; Staining time 1+ hrs. Count at 20x magnification Unstained or light colour and/or no movement Physical manipulation with dissection needle or observation at higher magnificaton Filter stained sample over 30 µm sieve Transfer of organisms into Bogorov-dish with filtered, unstained water Movement No movement Alive / Viable Dead * Retain filtered water for further analysis of organisms < 50µm Figure 16. Sampling and viability assessment for organisms larger than 50 µm during landbased tests. 5.2.2 Counting organisms 10≤µm<50 5.2.2.1 Counting viable microzooplankton The sample bottles are transferred to the laboratory and left undisturbed in the dark for all organisms and material to settle. After at least 24 hours the full bottle weight is measured. Using a water-jet pump and specialized tubing, the supernatant is aspirated. The bottle is weighed once more. The concentrate is transferred to small storage bottles that can be stored refrigerated for one year. The bottle is weighed once more to determine the sample and concentrate volumes. The samples are analyzed with an inverted microscope at 200x magnification (method by Utermöhl). The fixed samples (or sub-samples thereof) are transferred into settling chambers and neutralized using sodium thiosulfate. After this, the sample is stained using Bengal rose stain. This stain specifically stains organic material and helps to identify organisms between sediment particles. After staining the samples are left undisturbed in the dark to settle. The time of settling depends on the settling chamber used, but should be at least 1 hour per cm height of the settling chamber. The iodide component of the Lugol’s solution increases the weight of particles. Therefore they settle on the bottom-glass and can be counted. Live-dead-separation in these samples is mainly based on the structural integrity of organisms. This method can be applied for both zoo- and phytoplankton. Nevertheless certain groups are known to be affected by this standard method of fixation and therefore they will be systematically underestimated, if present. 5.2.2.2. Counting viable phytoplankton Organisms in the 10≤µm<50 size class will be analyzed via flow cytometry (Figure 17), a semi-automated method used in the NIOZ for the counting of phytoplankton, bacteria and viruses. In principle, flow cytometry allows to assess a complete view of the effectiveness of the applied treatment technique for all organisms, irrespective of their size (Veldhuis & Kraay, 2000). By applying special staining techniques the numerical abundance of heterotrophic as well as autotrophic bacteria can also be estimated. The vitality of the 37 NIOZ Land-based Project Plan different organisms present will be addressed by using a specific fluorescent dye method (Veldhuis et al. 2001, Cassoti et al. 2005, Veldhuis et al. 2006, Peperzak & Brussaard 2011). In addition, the viability will be assessed by incubating discharge water (see § 4.5.5). The diversity of the phytoplankton is measured by microscopy of Lugol-fixed samples of the NIOZ test water by Koeman & Bijkerk (The Netherlands). This company is actively involved in international quality assessments (http://www.planktonforum.eu/) Three replicate samples from both control and treated water are placed in the carousel of a bench top flow cytometer (Beckman Coulter XL-MCL or Becton Dickson Canto II), of which the Canto flow cytometer has an elaborate quality control system. All procedures and handling are conducted according to standard procedures (e.g. Shapiro 2003). Samples will be counted using standard protocols covering the particles in the size range of ca. 2 to 50 µm. Total analysis time will be equal to an exact sampling volume of 1 mL or otherwise when relevant. Of all particles present in the volume counted, the cell size and the presence or absence of chlorophyll-a fluorescence will be measured. Only phytoplankton has chlorophyll-a fluorescence (Figure 18a,b). Absolute numbers, cell sizes and chlorophyll-a content of the particles will be analyzed using the software package FCS Express V3 or V4 (DeNovo, US). Cell sizes will be estimated relative to 10 µm standard fluorescent beads (Flow-Check Fluorospheres, Beckman Coulter #660539) or relative to 10 and 50 µm beads on the Canto II. For measuring viable phytoplankton, three subsamples will be stained with SYTOX Green (Veldhuis et al, 2001). This nucleic acid specific dye only stains DNA of cells with a compromised cell membrane. Of each phytoplankton cell present the green SYTOX fluorescence (Figure 15b) will be determined and compared with the green autofluorescent signal (Veldhuis et al, 2001, Cassoti et al, 2005, Peperzak & Brussaard 2011). Figure 17. Bench top flow cytometer (Becton Dickinson Canto II), an instrument to enumerate live and dead organisms <50 µm. 38 NIOZ Land-based Project Plan Figure 18. (a) Epifluorescence microscopic picture of a live phytoplankton cell. The red signal is due to the presence of chlorophyll-a, and (b) a dead phytoplankton cell with a yellow-green fluorescence of the nucleus after staining with SYTOX Green. 5.2.3 Counting total heterotrophic bacteria The classical method for counting bacteria in many applications is based on plating on selective media. Unfortunately, for studies in the aquatic environment this approach is by far insufficient for various reasons (Gasol & Del Giorgio 2000). Therefore, the total bacteria concentration in fixed samples is accurately determined by flow cytometry using the DNAspecific stain PicoGreen (cf. Gasol & Del Giorgio 2000, Veldhuis et al. 1997). Figure 19. Epifluorescence microscopic picture showing bacteria and viruses in a natural water sample. The yellow-green fluorescence signal is DNA stained with a nucleic acid dye. The dye PicoGreen is a green nucleic acid specific dye that only stains dsDNA, with little or no cross-over for ssDNA and RNA (Veldhuis et al, 1997). This makes the staining method ideal to for staining of DNA and therefore to determine bacterial abundance. Flow cytometric analysis shows a clear signal with an excellent signal to noise ratio and bacteria are made visible easily and distinguishable from viruses and larger organisms. This approach has extensively been compared with bacteria staining and counting using an epifluorescent microscope (Figure 19), resulting in nearly identical results. However, because the flow cytometer method is much faster (results are obtained within 100 seconds and over 100 samples can be analyzed per day), and highly reproducible this counting method is to be preferred above the far more time consuming and labour intensive microscopic observations. 39 NIOZ Land-based Project Plan 5.2.4 Human pathogens The samples for microbiological analysis are taken in special bottles of 300 or 600 mL and send to a special laboratory (Eurofins/ C-mark, Quality system: Testing RVA L154) for further analysis. All analyses are carried out according to NEN-ISO standards. Escherichia coli Analysis for Escherichia coli is carried out according to NEN-EN-ISO 9308-1 for the analysis of surface waters. For this the samples are filtered through membrane filters (pore size 0.45 µm) and these filters are incubated on a selective agar plate. Incubation is 4.5 ± 0.5 hours at 37 ± 1°C and then another 19.5 ± 0.5 hours at 44 ± 0.5 °C. After that the incubated filters are transferred on sterile filters soaked with Indol reagent. For colonies of E. coli this yields a red colour. These red colonies are counted and set into relation to the sample volume. Results are confirmed via a positive and a negative control. For the latter sterilized water is incubated like a regular sample and to confirm the results it may only yield less than 1 colony forming unit (cfu) per mL. The positive control uses a special strain of E. coli also incubated like a normal sample to confirm that this species can grow and form colonies on the used media. Ent erococci group Analysis for this group is carried out according NEN-EN-ISO 7899-2. For this the samples are filtered through membrane filters (pore size 0.45 µm) and these filters are incubated on a selective agar plate. Incubation is 44 ± 4 hours at 36 ± 2°C on Slanetz & Bartley medium. After that red and pink colonies are counted. If the presence of enterococcus bacteria can be suspected after the colour of the colonies the filter is transferred to a preheated, selective agar plate and incubated for another 2 hours at 44 ± 0,5 °C. After that the medium is examined whether or not a brown to black colour can be found in it. Results are confirmed via a positive and a negative control. For the latter sterilized water is incubated like a regular sample and to confirm the results it may only yield less than 1 colony forming unit (cfu) per 100 mL. The positive control uses a strain of Ent erococcus faecium . 5.2.5.2 PAM measurement for total phytoplankton viability The photochemical efficiency of photosystem II is an indicator of the physiological ‘health’ condition of phytoplankton cells. It is a bulk variable that is measured using a Pulse Amplitude Modulated (PAM) fluorimeter (Schreiber et al 1993, Figure 20). The simple fluorescence ratio Fv/Fm gives a qualitative indication of the photosynthetic efficiency of the phytoplankton community. In addition, the maximum fluorescence value Fm is an indication of phytoplankton biomass. Prior to the measurement the sample is kept in the dark for at least 30 minutes. 3 mL of unfiltered sample water (control and treated, each in triplicate) are filled into a glass cuvette and analysed within 2 minutes. In the case of a high photosynthetic efficiency of the bulk phytoplankton community, samples can be filtered using 50 and 10 m Hydrobios™ gauze to determine the exact size class of the viable phytoplankton fraction. 40 NIOZ Land-based Project Plan Figure 20. PAM fluorimetry, a fast method to determine (bulk) phytoplankton biomass and the physiological condition of the photosynthetic apparatus of the cells. 5.2.5.3 Counting phytoplankton <10 µm Organisms in this size class will be analyzed via flow cytometry, as explained for the 10≤µm<50 phytoplankton size class. 41 NIOZ Land-based Project Plan 6 Quality Assurance/ Quality Control (QA/QC) The Quality Management Program (QMP) in section 1 of this project plan addresses the quality control management structure and policies of the test facility. Sampling and analysis standard operating protocols (SOPs) contain QA/QC measures where applicable. The SOPs are listed in section 3 of this project plan. 6.1 Ballast water tests For all ballast water test scenarios piping and instrumentation diagrams are available. Prior to each test a tool box meeting is held to ensure that the proper procedures are followed during intake and discharge. During the ballast water project all samples are taken, stored and analysed according to the dedicated SOPs. Prior to all tests sample codes are assigned following the rules explained in Table 4. Because the test site is within very short distance of the main NIOZ building all samples containing fresh and live material are immediately transported to the laboratory for direct analysis. The sample storage flasks as well as cryovial boxes are labelled with the same coloured labels and codes. Samples that are fixed for long-term storage are stored in specifically designated refrigerators (4°C) and freezers (-20°C, -80°C). The samples for microbiological analysis of the presence and number of human pathogens will be taken in special bottles of 300 and 600 mL and sent to “Eurofins/C.mark” in Heerenveen (accreditation certificate: RvA lab. no. L043). The samples will be transported immediately after sampling using a cooled transport container (4 °C). 6.2 Laboratory analyses The analyses of abiotic and biological variables are described in general in other parts of this project plan. Detailed descriptions of each analysis are available. These Standard Operating Procedures (SOPs) of sampling, sample storage, sample analyses, data analyses and data management are part of the NIOZ Ballast Water QMP. Specific quality assurance and quality control measures are contained in each SOP. 6.3 Data analysis The sample codes assigned a priori to the harbour tests (Table 4) are also used in data handling, i.e. the transfer of data from laboratory instruments to Excel™ files, dedicated to specific analyses. All data files are collected on a NIOZ network disk that is backed-up at least once a day. The separate data files are combined in one Excel™ file in which all appropriate calculations for D-2 and G8 will be conducted. The data on the NIOZ network disk are accessible to authorised NIOZ test facility personnel only. Statistical analyses will be performed in Excel™ version 14. Additional analyses will be performed in either SYSTAT version 13 or Primer version 6. SYSTAT and Primer allow for more sophisticated statistical analyses of the BWTS’ performance than the t-tests that are recommended in §2.3.37 of the G8-guidelines. The scientific hypothesis that will be tested, the so-called null-hypothesis, is that there are no differences between treated and control water samples. Quality data are compiled in tables, and when possible visualised in diagrams such as, for instance, Shewhart control charts. NIOZ will report the total number of tests that were needed to meet the D2-standard five times for each salinity range. 42 NIOZ Land-based Project Plan Table 5. Example of the assignment of coloured codes prior to tests. Sample flasks contain the appropriate code on a coloured label to prevent misidentification. T0 is the day of treatment and Tx is the xth day of sampling. Usually x = 5 at discharge. Test numbers are Roman numerals (I, II, III, etc.) using a new number for every test (e.g. I to X). Replicates are denoted with normal numbers (1, 2, 3, etc.). The example codes I-T5-M(1-4)-1 is, for each manufacturer, the first replicate sample of Test I on day 5 (T5). Sample Wadden Sea (harbour inlet) Wadden Sea (harbour inlet) Quay Navicula Pelagia Code WSn WSp Label colour Red Red+Orange Control tank (T0) Control tank (T0) Navicula Pelagia Cn Cp Green Green+Red Treatment tanks for T0 to Tx: e.g.: Manufacturer 1 Manufacturer 2 Navicula Navicula I-T5-M1-1 I-T5-M2-1 Orange Yellow Manufacturer 3 Manufacturer 4 Pelagia Pelagia I-T5-M3-1 I-T5-M4-1 Purple Blue 43 NIOZ Land-based Project Plan 7 References Cassoti, R., S. Mazza, C. Brunet, V. Vantrepotte, A. Ianora & A. Miralto (2005) Growth inhibition and toxicity of the diatom aldehyde 2-trans, 4-trans-decadiental on Thalassirosira weissflogii (baciillariophycea). J. Phycol. 41: 7 - 20. Falcioni, T., S. Papa, and J. A. Gasol. 2008. Evaluating the flow-cytometric nucleic acid double-staining protocol in realistic situations of planktonic bacterial death. Applied and Environmental Microbiology 74: 1767-1779. Gasol JM, del Giorgio PAD (2000) Using flow cytometry for counting natural planktonic bacteria and understanding the structure of planktonic bacterial communities. Sci. Mar. 64:197 - 224 Gregori, G. and others 2001. Resolution of Viable and Membrane-Compromised Bacteria in Freshwater and Marine Waters Based on Analytical Flow Cytometry and Nucleic Acid Double Staining. Appl. Environ. Microbiol. 67: 4662-4670. Jeffrey SW, Mantoura RFC, Wright SW (1997) Phytoplankton pigments in oceanography. In: S.W. Jeffrey, R.F.C. Mantroura and S.W. Wright (eds) Phytoplankton pigments in oceanography: guidelines to modern methods SCOR-UNESCO, Paris pp. 661. IMO (2005) Guidelines for approval of ballast water management systems (G8). Annex3 Resolution MEPC.125(53) Annex: Parts 1,2,3 and 4. IMO (2008) Guidelines for approval of ballast water management systems (G8). Annex 4 Resolution MEPC.174.58. Kraay G, Zapata M, Veldhuis MJW (1992) Separation of chlorophylls c1, c2 and c3 of marine phytoplankton by reversed-phase-C18-high-perfomance liquid chromatography. J. Phycol. 28:708 - 712 Mackey MD, Mackey DJ, Higgins HW, Wright SW (1996) CHEMTAX- a program for estimating class abundances form chemical markers: application to HPLC measurements of phytoplankton. Mar. Ecol. Progr. Ser. 144:265 – 283. Peperzak, L, & CPD Brussaard. 2011. Flow cytometric applicability of fluorescent vitality probes on phytoplankton. J. Phycol. 47: 692-702. Reinthaler T, Herndl GJ (2005) Seasonal dynamics of bacterial growth efficiencies in relation to phytoplankton in the southern North Sea. Aquat . Microb. Ecol. 39:7 - 16 Schreiber U, Neubauer C, Schliwa U (1993) PAM fluorimeter based on medium-frequency pulsed Xe-flash measuring light: A highly sensitive new tool in basic and applied photosynthesis. Phot osynt h. Res. 36:65 - 72 Shapiro HM (2003) Practical flow cytometry. John Wiley & Sons, Inc. New Jersey. Veldhuis MJW, Cucci TL, Sieracki ME (1997) Cellular DNA content of marine phytoplankton using two new fluorochromes: taxonomic and ecological implications. J. Phycol. 33:527 541 Veldhuis MJW, Kraay GW (2000) Application of flow cytometry in marine phytoplankton research: current applications and future perspectives. Sci. Mar. 64:121 – 134. Veldhuis MJW, Kraay GW, Timmermans KR (2001) Cell death in phytoplankton: correlation between changes in membrane permeability, photosynthetic activity, pigmentation and growth. Eur. J. Phycol. 36:167 – 177. Veldhuis MJW, Fuhr F, Boon JP, Hallers-Tjabbes C.C. (2006) Treatment of ballast water; how to test a system with a modular concept? Environ. Technol. 27:909 – 921. 44 NIOZ Land-based Project Plan Section 3: Standard Operating Procedures (SOPs) List of variables and related SOPs. Supporting SOPs that are referred to in the listed SOPs are available on request. Variable unit Reference (SOP) Page Salinity and Temperature PSU (g/kg), °C Salinity and Temperature 2012.2 46 pH - pH 2012.1 47 TSS and Particulate Organic Carbon mg/L, mg/L TSS-POC 2012.2 48 Dissolved Oxygen % saturation Dissolved Oxygen 2012.1 50 Dissolved Organic Carbon mg/L DOC 2012.1 53 Viable organisms ≥50 µm, including diversity number per m3, number of phyla and species Mesozooplankton 2012.1 57 Phytoplankton (organisms 10-50 µm) number per mL Phytoplankton Canto FCM 2012.1 59, 61, 64 FCM Canto operation 2012.1 FCM Canto data processing 2012.3 Phytoplankton diversity number of phyla and species Koeman & Bijkerk b.v.; quality assessments in www.planktonforum.eu/ Koeman & Bijkerk, outsourced Phytoplankton vitality (PAM fluorimetry) Fv/Fm Phytoplankton vitality PAM 2012.1 66 Phytoplankton vitality (SYTOX Green) number per mL Phytoplankton vitality SYTOX FCM 2012.1 68 Phytoplankton viability + or - Plankton viability T5incubation 71 Microzooplankton (organisms 10-50 µm) including diversity number per mL and number of phyla and species Microzooplankton 2012.2 69 Microzooplankton viability + or - Plankton viability T5incubation 71 Phytoplankton (organisms <10 µm) number per mL Phytoplankton Canto FCM 2012.1 59, 61, 64 FCM Canto operation 2012.1 FCM Canto data processing 2012.3 Heterotrophic bacteria number per mL Bacteria count PicoGreen 2012.1 73 E. coli cfu per 100 mL NEN-EN-ISO 9308-1 Eurofins C-mark, cfu per 100 mL NEN-EN-ISO 7899-2 Enterococci 45 NIOZ Land-based Project Plan outsourced Eurofins C-mark, outsourced STANDARD OPERATING PROCEDURE DATE: 2012-09-05 AUTHOR: Josje Snoek Salinity and temperature 2012.2 Goal: Determination of salinity and temperature MATERIAL & EQUIPMENT: Greisinger Digital Conductivity Meter GMH 3430 with Pt sensor Laboratory Salinity References: 3, 22, and 32 g KCl or NaCl/kg KCl or NaCl Dry oven, BINDER:ED 115 Bucket, 12 litre with Ballast Water test water Calibration: At intake and at discharge the GMH-3430 is calibrated for salinity against a labreference with the approximate ambient salinity value. For freshwater 3 g KCl (or NaCl) is dissolved in 997 g mQ For freshwater 22 g KCl (or NaCl) is dissolved in 978 g mQ For freshwater 32 g KCl (or NaCl) is dissolved in 968 g mQ KCl or NaCl is dried for overnight at 60 oC and cooled down in an exsiccator before weighing. Reference samples are made in a large volume and distributed over small ~ 60 ml plastic bottles. Each bottle is used once. Reading is correct if the difference with the reference solution is between +/- 5 % Correct the GMH-3430 reading by changing the Cell Correction factor. Press the Set/menu key for 2 sec and shortly press the same key a few times until Cell and a number between 0.40 and 1.00 appears on screen. Increase or decrease the correction factor value by pressing max (arrow upwards) - or min (arrow downwards)-key, set the value by pressing the Store/quit key. Check if the reading is correct, if not repeat the sequence. Record the measured values reference value before and after the correction in the harbour journal. Temperature is calibrated with a mercury precision thermometer, before and after each test cycle. Record the measured values mercury and sensor values in the harbour journal. Measurement: Turn on the GMH-3430 by pressing the on/off key. Press Set/Menu key shortly until arrow in top of screen is at SAL. Salinity and temperature are measured directly in each sample bucket (3 per test) of BW-test water, together with pH measurement. Stir the salinity/temperature probe slowly through the sample record when the reading is stable. Record the values in the harbour journal. LITERATURE: Operational Manual Conductivity Measuring Instrument version 2.0, Greisinger V.O.F. In 2004 at the time of the Ballast Water Management Convention salinity had no unit. Therefore, PSU as used in G8 is not a scientifically acceptable unit (http://www.oceanographers.net/forums/showthread.php?902-Salinity-Does-NotHave-Physical-Units). Since 2010 salinity is in SI units: g/kg (http://www.teos10.org/). 46 NIOZ Land-based Project Plan STANDARD OPERATING PROCEDURE AUTHOR: Josje Snoek pH 2012.1 DATE: 2012-09-04 Goal: Determination of pH during harbour testing of ballast water treatment systems in fresh-, brackish- and seawater MATERIAL & EQUIPMENT: Metrohm 826 pH mobile and Metrohm combined pH glass electrode: Unitrode 6.0258.010 with Pt1000 (for temperature). Metrohm buffer solutions pH 7 and 9, 30 x 30 ml Bucket (12 litre) with Ballast Water test samples Calibration: The glass electrode is calibrated at intake and discharge with 2 Metrohm buffer solutions. Turn on the pH meter by pressing the red button. Press OK to enter <param>, go with cursor to cal.settings/no off buffer, press 2 for a 2-point calibration. Leave <param> by pressing quit button Press the Call button. Open a new bag with buffer solution for each calibration. Start with pH 7 and stir slowly until instrument decides the reading is stable and asks for the next buffer. Repeat with pH 9. Information will be shown if the calibration in succeeded, if not repeat the whole process. Record the Calibration data in the harbour journal: press OK when <param> is shown at the bottom of the screen (or use arrow left or right until <param> is shown) , go with arrow-down to cal.data, Measurement: pH is measured in each bucket (3 per test) with Ballast Water test water. Move the glass pH-electrode slowly through the water until the reading is stable. Be careful not to break the glass electrode. Record the value in the harbour journal LITERATURE: See Applikon-Metrohm for specifications and instructions (http://www.metrohm.nl/PDFdownloads/MetrohmInfo/M-Info_1_05_E.pdf). 47 NIOZ Land-based Project Plan STANDARD OPERATING PROCEDURE AUTHOR: Eveline Garritsen, Josje Snoek TSS-POC 2012.2 DATE: 2012-09-06 Goal: Determination of Total Suspended Solids and Particulate Organic Carbon . MATERIAL & EQUIPMENT: Balance Dried and pre-weighed GFC filters (Whatman, Glass microfiber filters, 47 mm, cat. no. 1822-047), in numbered 5 cm plastic petri dishes Dry oven 60°C , BINDER ED 115 Exsicattor 1 litre graduated cylinder Filtration unit: Filtration frame with vacuum pump and four vacuum bottles with a filter holder Filter Forceps SS, Millipore Freshwater (MilliQ or mQ) Beaker Reference dried (60°C) mud as used in BWTS testing, stored in an exsicattor SAMPLING: During sampling in the harbour samples are taken in 1 litre square bottles, in triplicate for each test. Insert a pre-weighed filter into the Filter unit and write down the number of the filter in the harbour-journal and add the code of the test onto the petri dish. To avoid precipitation of TSS, mix gently but thorough and pore about 1 litre in one go into a 1 litre graduated cylinder. Read the volume and write it down in the harbour-journal, estimate the last ml. Filter the whole volume and rinse out the graduated cylinder with mQ, (also rinsing salt from the filter). When filtering is finished, turn off the vacuum pump and release the vacuum before you take the filter from the holder by using a pair of tweezers and put it back in the numbered petri disk. Store temporary in the fridge in the harbour, at the end of the day take all filters into the lab and store in a freezer (-80°C; -20°C is allowed for a short period) or directly put them in the Dry oven at 60°C to dry overnight. ANALYSIS: For TSS analysis GF/C filters are dried at 60°C for at least 8 hours and weighed again. The concentration of TSS per litre can be calculated from the sample volume and the weight difference of the filter before and after sampling. TSS is expressed in mg/l. Open the petri dish and put the cover under the bottom of the dish with the filter, and place them in the Dry oven at 60°C to dry overnight (min 6 hrs and max. 12 hrs.) After 6-12 hrs remove the petri dishes from the oven and store in a desiccator to cool-down under vacuum as long as needed. Weigh the GFC filters, note the filter number, weight and sample info in the labjournal. Calculate the difference from the weighing before and after (in mg/l). To determine the POC concentration the same filter is combusted overnight at 500°C and allowed to cool in a dessicator and weighed again. 48 NIOZ Land-based Project Plan Fold the filters twice and place each filter in a numbered porcelain combustion dish. Keep a record of the filter number, sample info and combustion dish number. Combust overnight at 500°C and cool down in a desiccator. Weigh the filters and add the values to the record. CALCULATIONS: Calculate TSS: weight after drying at 60°C – weight pre-dried empty filter at 60°C/sample volume TSS is expressed in mg/l. Calculate POC: weight after drying at 60°C – weight after combustion at 500°C/sample volume POC is expressed as mg C/l. CALIBRATION: Accurately weigh approximately 50 mg reference dried mud Suspended in 1 L (graduated cylinder) 0.2 µm filtered seawater Treat this laboratory standard as a sample Repeat Calculate as a sample, and record the data with those of the test samples 49 NIOZ Land-based Project Plan STANDARD OPERATING PROCEDURE AUTHOR: Josje Snoek Dissolved Oxygen 2012.1 DATE: 2012-03-21 Goal: Determination of Total Dissolved Oxygen in seawater MATERIAL & EQUIPMENT: Volume calibrated bottles (~120 ml) Dispenser bottles (3) (500 ml or 1 liter). Dispensers (3) max 2 or 5 ml per dose. Chemicals: MnCl2, NaOH, KI, H2SO4, KIO3. Magnetic stirring bars (many small, some large) Magnetic stirrer. Balance (g, mg) Hitachi U-1100 Spectrophotometer. Introduction: The chemical determination of oxygen concentrations in seawater is based on the method first proposed by Winkler (1888). In the Winkler method Oxygen is fixated by adding manganese chloride and alkaline iodide causing Oxygen to precipitate. This precipitate is subsequently dissolved by adding acid, causing a yellow coloured Iodine solution. The yellow colour can be determined directly with a Spectrophotometer. Preparation of the Chemicals: Reagent A (2 liter): MnCl2.4H2O 600 g/l. Weight 2 x 600 g MnCl2 in a 500 ml plastic measure cup Dissolve bit by bit, while mixing constantly with a spoon, in 1000 ml MQ in a 2 liter plastic beaker. When dissolved fill-up to 2 liter with MQ. Filter the solution through a coarse filter paper. Fill a dispenser bottle with reagent A , set the volume at 1 ml. Store the left over at room temperature in a plastic container. Reagent B (2 liter): NaOH 250 g/l + KI 350 g/l. Weight 500 g NaOH in a 500 ml plastic measure cup. Dissolve bit by bit, while mixing constantly with a spoon, in 1000 ml MQ in a 2 liter plastic beaker. Add 2 x 350 g KI bit by bit while mixing until dissolved. Fill-up to 2 liter with MQ. Fill a dispenser bottle with reagent B , set the volume at 2 ml. Store the left over at room temperature in a plastic container. Reagent C (1.8 liter): H2SO4 20 N (= 10M). Fill a 2 liter Erlenmeyer with 800 ml MQ. Place it in a bucket with ice-water. Slowly add 1000 ml H2SO4 96 % (end-volume 1800 ml). Mix after each addition. Fill a dispenser bottle with reagent C, set the volume at 1 ml. Store the left over at room temperature in a 2.5 liter brown glass flask. Sampling: Remove all air bubbles from the tubing of the dispensers. Each BW-tank has a sampling point for small volumes. Rinse the tubing of the sample point by opening the valve for some time. Sample in triplicate in 120 ml volume calibrated bottles. Place the sampling tube at the bottom of a 120 ml volume calibrated bottle. Fill the bottle smoothly without air bubbles and overflow for 2-3 volumes. 50 NIOZ Land-based Project Plan While the water is running, remove air bubbles by tapping the side of the bottle with the back of the glass stopper. Remove the tube from the bottle while the water is still running. Add 1 ml reagent A to the sample bottle with a dispenser (place the dispenser tube in the sample). Add 2 ml reagent B to the sample bottle with a dispenser (place the dispenser tube in the sample). Close the bottle with its own stopper (same number). Shake the bottle vigorously to ensure adequate reaction contact for the formation of the precipitate. Store the closed bottle under water in a (transport)container filled with cold tap water. Spectrophotometrical determination: Preparation. Turn on the Hitachi U-1100 Spectrophotometer 30 min before measurement. Place the left side of the tubing attached to the flow through cuvette of the spectrophotometer in a beaker with MQ. Attach a syringe to the other end of the tubing and suck the MQ through until it fills the syringe. Place the tubing with syringe in a bucket on the floor and remove the syringe. Fluid will keep running through the cuvette into the bucket. Check regularly if it is still running. Reset the blank value of the transmission at 456 nm when the reading is stable. Take the bottles you want to measure out of the storage container, without stirring the precipitate. Dry the bottles on the outside and under the rim of the stopper with a paper towel. Measurement. Open the bottle by turning the stopper until it moves and slowly lift it from the bottle. If the bottle will not open use an attachment which fits the hexagonal top of the stopper to increase your grip. When open add 1 ml reagent C with a dispenser (do not place the dispenser tube in the sample). Watch out for spilling reagent C, it is a strong acid. Drop a stirring bar in the bottle and mix using a magnetic stirrer until precipitate is fully dissolved. The color of the sample should be brownish orange in different intensities depending on the amount of oxygen trapped. Take the left side of the tubing attached to the flow through cuvette of the spectrophotometer quickly out of the MQ, dry the tubing on the outside and place it in the sample. Let it run through the cuvette until the transmission reading is stable. Calculation. To be able calculate the Oxygen concentration you need the slope and the intercept of a calibration curve with a Potassium Iodate Standard solution. For standard use: slope=0,0021 , intercept=0,0312 or determine them from your own calibration curve. Use the following equation for calculation of the Oxygen concentration of your sample. O2 umol/l = ((E456 sample-intercept)/slope)*( bottle volume ml +1)/(bottle volume ml-3)-1,05 O2 mg/l = O2 umol/l * 32/1000 For making a calibration curve prepare a Potassium Iodate Standard solution . Dry KIO3 for 6 hours at 180 oC, cool down in an excicator. Weigh ~2.5 KIO3g and dissolve in 250 ml MQ. Calculate the oxygen equivalent of the KIO3 solution: O2 umol/ul = 1.5* (ug KIO3*1000*1.00016)/(ml MQ*214) ~2.5 g KIO3/250 ml =~ 0.07 umol O2/ul. Prepare a blank sample by filling a volume calibrated bottle with sea water. Close the bottle and mix. Open the bottle and add the reagents in reversed order (C,B,A), one by 51 NIOZ Land-based Project Plan one, close the bottle and mix vigorously after each addition (be careful not to spill it on your clothes because of the strong acid). Open the bottle and add 100 – 700 ul Potassium Iodate Standard Stock solution to the blank sample and determine the Extinction at 456 nm and also measure a blank without addition of KIO3. Calculate the equivalent O2 concentration per volume KIO3stock added: O2 umol/l = 1000* ul stock added *O2 umol/ul [stock]/(bottlevolume + ul stock added) Make a calibration curve (E456 vs O2 umol/l) and calculate the slope and the intercept. Report the calibration data with those of the test samples 52 NIOZ Land-based Project Plan STANDARD OPERATING PROCEDURE AUTHOR: Eveline Garritsen DOC 2012.1 DATE: 2012-09-06 Goal: This procedure describes how to analyse Dissolved Organic Carbon samples. MATERIAL & EQUIPMENT: TOC-V, Total Organic Carbon Analyzer - Shimadzu ASI-V autosampler - Shimadzu 25 ml glass vials with screwcap (without septum) Pipets 5000/1000/200 µl tips for pipets 5000/1000/200 µl Platinised Alumina 1%, Pt Granular 0,85 to 1,2 mm, Elemental Microanalysis, 50 gm, BN 177644 Silica (Quarz) Chips Granulaar 0,85 to 1,7 mm, Elemental Microanalysis, 50 gm, BN 176263 Silica (Quarz) wool fine, Elemental Microanalysis, 50 gm, 502-177, B1102 Deep Seawater Reference (CRM, 44-46 µM C, amp. 30 ml, Hansell Laboratory, University of Miami, Batch 11, lot#12-11 Stock solution: 1000 ppm C(2.125 g of reagent grade potassium hydrogen phthalate that was previously dried at 105-120°C for about 1 hour and cooled in a desiccators before transferred in a 1 L volumetric flask and dissolved in milliQ water; 1000 ppm C=100 mg C/L). This stock solution is necessary for making reference concentrations of 0, 25, 50, 100 and 200 µM C. Hydrochloric Acid, 37-38% 2,5 l (max. 5 ppb Hg), ‘Baker Analyzed’, J.T.Baker, UN1789 O,1 M HCl solution Anhydrone® ,Magnesium perchlorate, desiccant For Drying, ‘Baker Analyzed’, L.T.Baker, Cas No. 10034-81-8, Lot B27416 MilliQ water Procedure DOC: The TOC-V instrument measures the amount of total carbon (TC), total inorganic carbon (IC) and total organic carbon (TOC) in water. ‘Oxidative combustion-infrared analyses’ is a widely-used TOC measurement method. The procedures related to TOC-Control V software system. ANALYSIS: (Dutch) Ongeveer wekelijks (na 120 ml aan injecties; 100 µl per injectie, ca. 5 tot 7 inj. per monster) moet de glazen kolom met katalysator vervangen worden: - onder aan de kolom het T-stuk losdraaien (a) - bovenaan de twee metalen schroeven links van inj.poort losdraaien (b) - rechts van inj.poort de schroefverbinding met slang (TC, dragergas, O ) (c) - glazen kolom met injectiepoort van bovenaf uit het apparaat halen en daarna de glazen buis ook van onderaf uit injectieblok trekken (Pas op: Indien apparaat aan staat is de kolom zo’n 680 ºC!) - deze buis apart neerleggen voor recycling - op een schone en lege glasbuis twee streepjes zetten met zwarte viltstift voor markering van hoeveelheden (a.h.v. maatstreepjes op een kast) - tot aan eerste streepje vullen met Silica quartz chips - daarna vullen tot volgend streepje met Platinised Alumina - vervolgens injectiepoort schoonspoelen, boven wasbak, met milliQ (denk erom dat de Oringetjes er niet uitvallen, steek een pincet in de ringetjes en de opening, om ze op z’n plaats te houden) - daarna injectiepoort droog blazen met perslucht - schuif glasbuis van onderaf weer in injectieblok (tot hij stevig vast zit) - doe de glasbuis met inj.blok terug op z’n plaats in het apparaat en zorg dat het slangetje(d) in het andere slangetje past; schroef (a) weer vast en zorg dat de dop de glasbuis ondersteund (de glasbuis komt onder druk te staan) 53 NIOZ Land-based Project Plan - daarna het perspex-plaatje van de inj. poort schoonspuiten met milliQ (op apparaat en leg er een tissue onder) en vervolgens onder de wieltjes op het inj.blok (e) schuiven; daarna schroeven (b) vastdraaien; let erop dat de bovenkant van het plaatje ‘in lijn’ staat met het achterste plaatje. Als de kolom nog niet vervangen hoeft te worden, moet wel dagelijks het geklonterde Platinised Alumina uit de glasbuis worden gehaald (na afkoelen) m.b.v. een ijzerenstaaf en vervolgens moet er een beetje Platinised Alumina aan worden toegevoegd; dan ook het inj.blok schoonspoelen en droogblazen; tevens bovenplaatje van inj.blok schoon spuiten met milliQ. dagelijks moet wel de “brug”(f) met Anhydrone® worden ververst: trek de koppelingen (g) los van de brug en trek vervolgens de dop er af (aan Anhydrone kant); schud leeg, haal de pluk glaswol eruit en laat de Tin korrels zitten; vervolgens weer een nieuwe pluk Silica Wool (goed aandrukken, Anhydrone erop ‘gieten’, schudden en de dop er weer op doen en de brug weer terugplaatsen Buis (h) bijvullen met milliQ indien niveau te laag is (zie min-max markering) controleer meterstanden van carriërgassnelheid (i), moet 110-130 zijn, manometers in apparaat en bij de zuurstofcylinder (j: ± 200 kPa) Indien het glazen buisje (l), voor opvang van condenswater vol zit, dan twee van de drie koppelingen losmaken, het water in een bekerglas gieten en vervolgens de slangen weer aankoppelen Als de buis (m) met ‘halogen scrubber’ (soort koperwol) donker van kleur is geworden, dan deze vervangen (niet te snel, hij is vrij prijzig). Zet de TOC-V aan (knop voorop deur rechtsonder) Kolom wordt 680 ºC; Detector zo’n 0,6ºC. Acclimatisation Voor je kunt beginnen met de analyse van de monsters moet het apparaat eerst geacclimatiseerd worden: gedurende ca. twee uur injecties met milliQ. Zorg altijd voor vers milliQ (slangetje van de ASI-V door dop van milliQ-vaatje). Gebruik file: aclimatization.t32. - Programma TOC-Control opstarten - Sample Table Editor aanklikken - File aclimatization selecteren - Edit, Delete, All (data) (connect), - use settings … Background Monitor: Temp.: Fumace: 562 ºC Dehumidifier: 0,6 ºC (start), keep running, standby - vial: 0 (= uit Erlenmeyer). Bij alle regels steeds vial 0 invullen (+ 21 regels) - OK, (External Accid Addion -> niet) - Start (100 µl per injectie) - View, Sample Window, (rechtermuisclick) Limits, min. + max. aan Y-as aanpassen, b.v. -1 min en 5 max bij milliQ - View, Methods, Instellingen Methode bekijken: NPOC (Non Percal ….) No. of inj. (is aantal injecties per vial) = 5/6 No. of wash = 3 SDMax = 0,1000 Max. integration = 02000 Sparge Time = tijd van vooraf doorborrelen (zuur toegevoegd, anorg. C gaat eruit) Datum is naam van bestand Save as: file name: 6 oktober 08 ballastwater.t32 - Edit, Delete data, All Bij invullen scheme - Insert, Auto Generate …, methode “sample.met” No. of samples: (nog) 26 (40 totaal) - OK - Standby 54 NIOZ Land-based Project Plan - nr. van vial invullen (schema: Sparging/Acid Addition) (Let op: geen Edit Acid Addition!) - OK Na + ¾ uur wassen met milliQ kun je de monsters draaien. Sample Analysis: Vul een formulier in voor het monsterschema. Hierop ook vermelden: Filename, datum, projectnummer, naam gebruiker, informatie over kolom (nieuw of niet) soort monsters, gebruik van ijklijn, type aparaat, gebruik van standaard en eventuele bijzonderheden. Monsters kunnen overnacht worden geanalyseerd met de autosampler. - In carousel niet meer dan 50 tot 60 vials zetten. - Altijd beginnen met milliQ (sampler heeft dubbele naald: eerste flesje wordt doorborreld, terwijl het tweede wordt geanalyseerd) - In verband met het behoorlijke ‘verloop’ van de metingen (relatief gezien: op dit lage detectieniveau) is het aan te bevelen om wel drie ijklijnen te meten per serie, aan het begin, halverwege en aan het eind. Aan de hand van meetresultaten kan dan achteraf worden gecorrigeerd. - - Na b.v. iedere zeven vials een ‘schoonmaakvial’ met 0,1 m HCL zetten. - Het monsterschema, voor 18 monsters, ziet er dan b.v. als volgt uit: 1. milliQ 21. 12e 2. 0 22. HCl 3. 25 23. 0 4. 50 24. 25 5. 100 25. 50 6. 200 26. 100 7. HCl 27. 200 8. 1e 28. HCl 9. 2e 29. 13e e 10. 3 30. 14e e 11. 4 31. 15e e 12. 5 32. 16e 13. 6e 33. 17e 14. HCl 34. 18e 15. CRM 35. CRM 16. 7e 36. 0 17. 8e 37. 25 18. 9e 38. 50 19. 10e 39. 100 20. 11e 40. 200 - Ampullen met monsters openbreken (gebruik een opgevouwen tissue ter voorkoming van snijwondjes) door de top er met je duim af te breken, zet je duim op de witte stip. - De inhoud van de ampul moet worden overgedaan in een 25 ml vial (5x gespoeld met milliQ) vanwege de te nauwe opening van de ampul en de afwijking in centrering van de naalden van de autosampler. - Gebruik b.v.een 5 ml pipet en gebruik ong. 1 ml monster om de vial mee te spoelen. Er moet nl. ongeveer 18 ml in de vial zitten. Spoel de buitenkant van de pipetpunt goed af met milliQ en spoel nog 2x in Erlenmeyer met milliQ, alvorens het volgende monster wordt overgedaan. - Om twee CRM vials te vullen, gebruik je 2 ampullen van 30 ml en spoel beide vials 3x met ca. 0,5 ml CRM-vloeistof - Carrousel pas vullen met de vials indien deze allemaal gevuld zijn en er spoedig met het meten van de monsters kan worden begonnen (er moet niet veel tijd zitten tussen het acclimatiseren en de eigenlijke metingen, dus niet het apparaat lang stil laten staan. Bereiding ijklijn uit stockoplossing Stock: 1000 ppm C in koelkast. 500 ml maatkolven goed gespoeld met milliQ 0 µM C 0 µl stock 25 - 150 50 - 300 100 - 600 200 - 1200 55 NIOZ Land-based Project Plan Bij gebruik van electronische pipet, de pipetpunt schuin tegen de wand van de erlenmeyer houden (bij het ‘uitspuiten’) totdat de het 2e piepje en de trilling voorbij zijn! Maatkolven met milliQ aanvullen tot 500 ml (onderkant meniscus raakt de lijn) En daarna 2 ml HCl toevoegen. Het volume wordt dus 502 ml. Het volume van je monster is ook 20 ml + 4 druppels HCl. Let op: dit phosphorzuur is erg stroperig en moeilijk te pipetteren. Sample analyses : abort, are you sure … ? -> OK, - Haal de cap van de carrousel, pak de carrousel eraf en zet de vials er goed in(= in de uitsparingen) en in juiste volgorde - File, haal ‘oude’ file op, b.v. 8 oktober 08 ballastwater.t32 - Edit, Delete, All (alle meetresultaten worden weggegooid) : connect, even wachten (carousel gaat draaien en plunjer gaat op en neer) : ‘stoplicht’ (=start) In scherm de vial nummers invullen (b.v. 1 t/m 40, bij iedere regel) - OK, start. Calibration Per serie twee of drie keer een CRM-standaard meten (= Certificate Reference Material) b.v. Deep Seawater Reference. REMARKS: See also TOC-V user’s manual and for data processing TOC-V Administrator’s manual. 56 NIOZ Land-based Project Plan STANDARD OPERATING PROCEDURE Author: Frank Fuhr, Dennis Mosk, Eva Immler 2012-02-27 SOP Mesozooplankton 2012.1 Goal: This protocol describes sampling and analyzing of mesozooplankton in a ballast water context for land based testing. It refers to mesozooplankton as defined by the IMO D2Standards as a size class > 50 µm. After treatment the allowed number of organisms in this size class at discharge is <10 viable org/m³. MATERIAL & EQUIPMENT: Harbour: 2 buckets 10 liter Bottle 2 liter Sieve 50µm (diagonal mesh size) Squeeze bottle 0.2 µm filtered seawater Plankton-net 50µm (diagonal mesh size) + net-beker (Hydrobios) 1000 liter tank (IBC) Laboratory: Pipet 1-5ml Pipet tip Beaker-glass 300ml Sieve 30µm (diagonal mesh size) Squeeze bottle (0.2 µm filtered seawater) Bogorov or Borgorov-Gollasch dish Microscope 20x magnification, for determination 30- 60x (ZEISS V8 and V12) CHEMICALS: Neutral Red; preparation of the solution:125mg standard Neutral Red stock in 250 ml demi water, (Neutral Red is added to the sample in a ratio to yield an endconcentration of 1:50.000). SAMPLING: Sampling of mesozooplankton for land-based certification tests of a ballast water treatment system is done in triplicates: Day 0: 3x 1m3 after treatment 3x 20 liters control after the pump Day 5: 3x 1m3 after treatment 3x 20 liters control after the pump Harbour (control): Buckets are flushed 3 times with sample water Fill both buckets with 10 liters sample water 20 Liters are carefully filtered over a 50µm sieve. Organisms are carefully flushed from the sieve with 0.2 µm filtered seawater into a 2 Liter bottle. (mesozooplankton is sensitive to damage by nets and sieves) Harbour (treated samples): Plankton-nets are flushed with fresh water The plankton-net is placed in an empty 1000 liter IBC with a closed net-beaker Fill the IBC with 1000 liters of sample water When during sampling the net is clogging,….. When the IBC is full, take the net slowly out of the IBC Organisms are flushed from the net into the net-beaker by using a squeeze bottle filled with filtered seawater (0.2 µm), and are carefully flushed from the net-beaker 57 NIOZ Land-based Project Plan into a 2 Liter bottle. Until further transport, store the bottles away from direct sunlight at a temperature comparable to the sample water. Laboratory: The bottles are transferred back to the lab as soon as practical Samples are flushed into beaker-glasses and the volume is adjusted to any convenient manifold of 50ml and at least 150 ml to assure that the sample is not too concentrated for the organisms 2ml Neutral Red is added per 50 ml sample Stain for a minimum of 2 hours without direct sunlight and at a comparable temperature as the sample temperature After staining the sample is filtered over a 30 µm mesh net and carefully flushed with 0,2µm filtered seawater into a Bogorov or Bogorov- Gollasch counting dish Analysis: Samples are counted complete (no subsampling) Subsamples are counted by at least two analysts and the individual counts are recorded Total amount of living organisms is counted and recorded on the plankton form Live dead determination is resulting from staining, structure and movement of the organism At minimum the phyla and abundance of the organisms present in the Bogorov counting dish is determined and recorded on the plankton form For more information see the “ NI OZ m esozooplankt on booklet ” in laboratory F0009 At the start of the BWTS test season subsamples of 3 or more (old) samples are counted by three analysts; the individual counts are recorded; the difference between analysts should become <10% REMARKS: From 2012 as well the Bogorov-Gollasch dish is used (chamber ends closed) LITERATURE: Otto Larink & Wilfried Westerheide; (2006) Cost al Plankt on- Phot o Guide for European Seas, , Muenchen Roger Harris; (2000) ‘I CES zooplankt on m et hodology m anual’;, San Diego Zetsche E-M, Meysman FJR (2012) Dead or alive? Viability assessment of microand mesoplankton. J Plankton Res 34:493-509. 58 NIOZ Land-based Project Plan STANDARD OPERATING PROCEDURE DATE: 2012-02-23 AUTHOR: Eveline Garritsen PHYTOPLANKTON Canto FCM 2012.1 Goal: Determine the abundance of phytoplankton cells in Ballast Water samples. MATERIAL & EQUIPMENT: Nalgene bottles, 1 litre Flowcytometer: BD Canto II FCM tubes SAMPLING: Three 1 litre bottles are filled during (de)ballasting (at the begin, middle and end of filling/deballasting the ballastwater tank). Store the bottles is the fridge till analyzing time. Take a representative sample of approximately 3 ml of every bottle in a FCM-tube. Put the tubes in the carousel (begin at position 1, and there should be no open places between tubes of different treatments). ANALYSIS: Start up protocol Canto: see protocol “SOP Canto”. User: Ballastwater -> password: ballast Open protocol: Phytoplankton (dub. click -> boekje open) Settings: Voltage Threshold FSC 25 SSC 198 FBG 534 FBO 394 FBR1 390 200 FBR2 547 FGO1 400 FGR2 453 FVB 341 FVG 482 59 Click on syringe (=new specimen) Rename (right click on specimen) Experiment – Experiment layout Tab Acquisition – Events to record: fill in 10,000,000 Stopping time: 300 Carousel – Carousel setup Fill in carousel number (1,2,3 or 4 under Carousel ID) Recording Delay time: 3 sec. Mix Settings: v start of carousel mix v interim mix after every 1 v tube mix duration 3 sec v Tube Pressurization Error Handling (Current Run) v Show error and wait OK Acquisition dashboard: Flow rate: medium Run Carousel Every time you have to measure the flowrate with trucount beads: Put 1 ml milliQ in a tube with n counts in it (see label on package) Use protocol ‘Trucountbeads” and measure at medium flowrate for 60 sec. (Fill in on the Excell file”FACS Canto TruCount log.xlsx”with values of flowrates) Measure flowrate NIOZ Land-based Project Plan Rinse the FCM according to the protocol “SOP FACSCanto” CALCULATIONS: Put data on your computer by using an USB stick. Data processing should be done with the program FCS express. Flowrate: Total count (measured)= count gate p1 + 2 x count gate p2 n = count per tube (see label on package) Flowrate (µl/min)= (Total count/n) x 1000 60 NIOZ Land-based Project Plan STANDARD OPERATING PROCEDURE DATE: 2012-02-24 AUTHOR: Anna Noordeloos FCM Canto operation 2012.1 Goal: To operate and calibrate the Canto flow cytometer MATERIAL & EQUIPMENT: BD Canto II Flowcytometer Starting up Switch the machine on with the green button on the left side of the flowcytometer. It takes the machine 5-7 minutes to warm up. Switch on the computer. The window ‘Log On t o Windows’ appears. Usernam e: Adm inist rat or. The password is BDIS OK Click twice on the icon BD FACSDiva Software. Wait until the text ‘The syst em is ready’ appears in the middle of the screen in the Cytometer window. Cytometer Fluidics Startup OK During Fluidics Startup you need to get the air out of all the fluidic filters on the wet car. You do this by turning the white knob on top of the filter anticlockwise while the liquid is flowing through. Keep the white knob open till liquid is coming out. Window ‘St art up St at us’ appears Fluidics St art up is com plet e. The syst em is ready’ OK Open the instrument and check the flowcel for air bubbles. In case of air bubbles Cytometer Cleaning Modes De-gas flow cell Window ‘De- gas Flow Cell is com plet e’ OK Cytometer Setup & Tracking beads (CST) Beads: BD Cytometer Setup & Tracking Beads Mixture of 2 and 3 µm beads with different intensities Type Lot ID Check met beads dagelijks uitvoeren duurt ca. 10 minutes Cytometer CST Page ‘Cyt om et er Set up and Tracking’ appears. Right top screen: Characterize: Check Performance Run OK Fill a flow cytometer tube with 0.35 ml mQ water Mix the bead vial by gentle vortexing Add one drop of BD Cytometer Setup & Tracking Beads Vortex the solution Store the solution in the dark and make this solution daily fresh Vink on Load Tube Manually, you find this directly under Run in Setup Control Window ‘Cytometer Setup and Tracking’ appears OK Unload the tube After the calibration the report appears ‘Cytometer Setup and Tracking’ View report Please watch the variance bright beads CV<6%, when not ok the values are in red File print After you’ve run the CST beads click on Performance Tracking. You’ll find an overview of the last CST beads files. Close window CST Check performance CST mismatch window appears Click on middle option ‘Use CST Set t ings’ 61 NIOZ Land-based Project Plan Trucount beads Get a tube of Trucount beads from the drawer left of the Canto flow cytometer Read the number of beads from the bag and write it on the tube Add 1 ml of filtered seawater to the tubes Click on the book Trucount beads Right mouse button Duplicate without data Rename the experiment with the correct date Open specimen Run first the tube with Trucount beads on Low flow speed for 180s Continue with med flow speed for 60s Finish with high flow for 60s Please, write the number of beads you’ve analyzed in the log book on the computer In Browser click on already made folder right mouse button Copy Go to Administrator right mouse button Paste Change in Inspector the name of the copied experiment Threshold FL-5 660/20 (rode laser) value: 1200 Change to FL-1 530/30 (blue laser) In left ‘kantlijn’ Browser you find arrows in front of each tube. If you want to remove a tube you need to click on the arrow left en delete. Carousel setup p.124 manual Carousel ID 1 If you change from global to normal worksheet you can combine several samples. Select in browser all samples. Draw a plot in normal worksheet. Experiment layout Acquisition Enter Events to Record click 60 s measurement recording delay time 3 sec ‘aanvinken’ start of carousel mix ‘aanvinken’ interim mix after every 1 tube, mix duration 3 sec Cytometer Degas flowcel and bubble filter (waar zit het bubble filter?) Replace sheath vessel: When sheet vessel is replaced: Cytometer Cleaning modes Prime after Tank refill (voor ontluchten) FACSFlow OK Cytometer Setup and Tracking Setup Control Research Use Only Define Baseline (wordt per machine 1x gedaan of na veranderen filter configuratie) Load tube Manually Flowrates LOW: 12, MED: 60, HIGH:120 ul/min (sample pressure:4.7) CST Mismatch Kies altijd Use CST Settings Deze melding krijg je alleen na een baseline calibratie. Experimenten aanmaken in Browser Inspector Folder Symbool boekje aanklikken Via Inspector naam geven, recht muisknop Name: Beads ‘aanvinken’ Use global cytometer setting Click in Browser ‘Cytometer settings’ Wich detectoren ga ik gebruiken 62 NIOZ Land-based Project Plan Inspector Global Sheet Name Number of Pages Hoe meten: ‘spuitje’ New specimen Via Inspector naam aanpassen Aquisition Dashboard gebruik je voor starten / stoppen metingen Acquire Data Sample beschrijving dmv Inspector Tube manually Acquisition Dashboard Right mouse button Show all Basic Control Manual Rinse needle Cytometer Cleaning modes SIT flush Statistics Statistiek Click on plot Right mouse button Create statistic view Batch analysis Click on booklet (Experiment) right mouse button batch analysis Manual dan kan je nog gates aanpassen Plotjes saven als pdf. Je kan ook plotjes slepen naar excel sheet. Shutdown procedure Fill four tubes with the following solutions: FACSClean, milliQ, FACSRinse, milliQ Cytometer Cleaning Modes place tube under needle Clean Flowcel Repeat this step for all the tubes. Cytometer Fluidics Shutdown File Quit Shutdown In general: BD Technische dienst 020 582 9424 Tube empty, air in system, no problem Optimale temperature for the flow cytometer 16C-31C Doesn’t function well <5C and >40C when exposed for longer times. Power laser: 20 mW Pressure in system: 4.5 psi in system Speed particles trough flowcell at 6 m/s Maximal flowspeed 10.000 events/sec, if higher than coincidence. “melding’ abort frequentie [email protected] CST beads, Ref. 641319: 119 euro per kit (21.03.11) Trucount tubes (50 tests), Ref. 340334: 157 euro (21.03.11) BD FACS Shutdown Solution, Ref. 334224 63 NIOZ Land-based Project Plan STANDARD OPERATING PROCEDURE DATE: 2012-09-06 AUTHOR: Josje Snoek, Louis Peperzak FCM Canto data processing 2012.3 Goal: Calculation cells/ml from CANTO-data (based on new FCS Express lay out). MATERIAL & EQUIPMENT: BD Canto II Flowcytometer FCS express 4 (FCM analyses program); the lay-out for this software has been adjusted after size and concentration measurements of beads and phytoplankton cultures. Exporting data from the CANTO Switch on the computer. The window ‘Log On t o Windows’ appears. Usernam e: Adm inist rat or. The password is BDIS OK Double click on the icon BD FACSDiva Software on the Desktop. Usernam e: Ballast wat er, password: ballastOK Open BW-2012-test-results and select Stephan Gollash folder. Go to File/Export/FCS files, a Export FCS Files- window will open, press OK. Put the BW-USB in the computer and browse to the USB stick, select a folder, press Choose Directory, make a file name and press Save. Exporting will start. When exporting is ready close the CANTO program, take out the USB and turn of the computer. Copy the files to Flowcyt/BW-2012/Gollash Go-consult/ FCM Files/ Facs Canto. Processing data with FCS-express If you don’t have FCS-express on your computer already, copy the FCS-express.exe shortcut from the bio(L:)/ FCS/ FCS Express.exe –Shortcut (version 4). Open FCS-express version 4 with the shortcut on your computer. A empty Layout will appear Left mouse click on the round symbol, with nr 4 in it, on the top left side of the FCS screen. Open Layout, browse to Flowcyt/BW-2012/Gollash Go-consult/ FCM Files/ Facs Canto/ select BW-2012-CANTO-Phyto-SG-Louis-16-8-2012.fey Import the data into the Layout: go to Batch/Data List Select all the files and press on the red cross to erase all data. Press on the green plus and browse to Flowcyt/BW-2012/Gollasch Go-consult/ FCM Files/ Facs Canto open the folder(s) with your data, and select the .fcs files, press open. Select the first file in the list, go to the header of the Data List window and press Change File and press Change Data On All Plots. Close the Data List window. Check if all data fits well into the gates, go to Data and Click on Next or previous to check all selected files. If all files are OK, go to Batch/Batch Actions, right-mouse-click Excel (Column Mode), go to Properties, go to Save to a new fi and change the name of the file or even change the directory by browsing with the yellow folder sigh right of the window with the file name. Press OK Do the same with Export To Powerpoint. Choose the same name as the Excel file, press OK. Go to Batch/Run and all data will be calculated and stored. Repeat the same with the files of the True Count Beads (TCB) to calculate the flow rate. 64 NIOZ Land-based Project Plan Use the FCS-Layout for TCB beads, go to Flowcyt/BW-2012/Gollasch Go-consult/ FCM Files/ Facs Canto select BW-2012-CANTO-TCB-GS.fey. Open the excel Phyto-output of FCS express and copy all data into a FCM-datacalculation-file. Open the excel TCB-output of FCS express and copy counts of single and double counts into a flow rate-calculation-file. Calculate flow rate and Phyto-counts/ml see below. Examples of data calculation files: FCS-OUTPUT-TCB-Layout singl Trucount- I-II-K-T5_High 1.fcs compensated e 1510 double 158 singl Trucount- I-II-K-T5_High 2.fcs compensated e 1482 double 162 singl Trucount- I-II-K-T5_Medium 1.fcs compensated e 792 double 84 singl Trucount- I-II-K-T5_Medium 2.fcs compensated e 814 double 81 EXCEL calculation sheath flowrate TCB TCB batch volume counting counts sw # beads (ml) time (s) single flowrate dubble total ml/min flow rate high 50602 3 60 1510 158 1826 0,108 50602 3 60 1482 162 1806 0,107 high 50602 3 60 792 84 960 0,057 med average sdtdev 0,108 0,001 0,057 0,001 50602 3 60 814 81 976 0,058 med Total = single+(2* double); Flowrate =(total*60/counting time)/(TCB batch # beads/volume sw) Cathelco-Phyto-Cp-T5 5 flowrate counted FCSOUTPUT FCSOUTPUT count/ml Large # Large sample date sample info flowrate ml/min ml 17-04-12 I-Cp-T5-1 high 0,108 0,54 I-Cp-T5-1 102 189 17-04-12 I-Cp-T5-2 high 0,108 0,54 I-Cp-T5-2 140 260 17-04-12 I-Cp-T5-3 high 0,108 0,54 I-Cp-T5-3 167 310 Counted ml = flowrate * min counted (Phyto=300sec=5 min); count/ml = FCS OUTPUT #/counted volume. 65 NIOZ Land-based Project Plan STANDARD OPERATING PROCEDURE DATE: 2012-04-11 AUTHOR: Eveline Garritsen, Josje Snoek Phytoplankton vitality PAM 2012.1 Goal: Measuring photosynthetic activity of phytoplankton MATERIAL & EQUIPMENT: PAM-Control, Walz WATER-ED Emitter-Detector-Unit, Walz Water-K, Quartz glass cuvette stopwatch CHEMICALS: 0.2 µm filtered seawater SAMPLING: Place the sample in the dark for at least half a hour ANALYSIS: Switch on the computer. Start WinControl (shortcut on the desktop in the centre). Select PAM settings: File/Load o Select folder - double click on C, double click on BW folder. o Select file - BW-2, press OK. The following PAM-settings will be loaded: Measuring Light Freq. 5 System Parameters F. Off 4 PM-Gain 10, 15,20 Out-Gain 2 ETR-F 0.84 Actinic light Int 6 Width 00:10 Clock Time Item1: Saturation Pulse Int 10 Width 0.8 Set Mark Beeper A LED Amplitudes Meas. 8 Actinic 12 Far Red Light FR-Int FR-Width 6 00:10 X 00:20 SAT-Pulse Status: X X Meas. Light Photo-Multipl. Blanc Fill the PAM cuvette with filtered seawater. Place the cover over the PAM cuvette Wait 1 min (for the Ft signal to become stable). Check whether the Ft signal is zero. If this is not the case press the button left from the Ft signal (top of the screen right). Write down the F.Off’s (values) for the three gains (10, 15 and 20). If you change the gain, you have to change the F.Off in the corresponding value. Sample Fill the cuvette with sample Wait 1 min. before measuring the Ft signal Note: The measurement is not reliable when the Ft value is below the 100 r.e. and above 1000 r.e. In this case you should increase respectively decrease the PM-Gain (versterkingsfactor photomultiplier). Write the PM-Gain down (10, 15 or 20). 66 NIOZ Land-based Project Plan Press the F0 button Check for a straight horizontal line on the small graph on the bottom of the screen right. If not fill the cuvette with fresh sample and start again. Press the Fm button as soon as you see the F0 value written on the computer screen. Check for a signal in the small graph on the bottom of the screen with a flat top. Write down p (peak), x (flat line),˜ (uncertainty) Write down the F0, Fm and Fv/Fm ratio Closing down the PAM: Rinse the PAM cuvette with milli Q water Close the window WinControl Report The following message appears: WinCont rol You will loose report , chart and kinet ics dat a by quit t ing WinCont rol unless t hey were saved in * .csv/ * .t xt , “ .pcf and * .pkf files Really leave Press OK Switch off the laptop Switch off the PAM Control REMARKS: The PHYTO-ED system is best suited for field and on-deck work. The system is particularly recommended for work with open ocean water at chlorophyll contents below 0.5 µg/l. (from: Brochure Walz, 04.2004) The Universal Control Unit of the PAM has serial number: UKEA0117. The Water-ED Emitter Detector Unit (Red version) has: EDEE0196. 67 NIOZ Land-based Project Plan STANDARD OPERATING PROCEDURE DATE: 2012-09-06 AUTHOR: Josje Snoek Phytoplankton vitality SYTOX FCM 2012.1 Goal: Determination of the vitality of phytoplankton in Ballast Water samples. MATERIAL & EQUIPMENT: Nalgene Square bottles with 1 liter BW-sample. Flowcytometer: BD Canto II FCM tubes for BD CANTO Sytox green SAMPLING: After Phytoplankton-FCM measurements samples are taken from the same bottles. Mix carefully and pipet 1 ml into a FCM tube, add 10μl Sytox green to the wall of the tube. When 6 tubes are filled tap with the bottom of the tube on the table to mix the SYTOX droplet with the sample. Start a timer for 10 min after mixing the first sample. Incubate for 10-15 min in the dark at room temperature. Put the tubes in the carousel of the FACS-CANTO and start the analysis. Start a new series of 6 samples when the first 3 samples have been measured and repeat this until all samples are done. Measurement: With SOPs: Phytoplankton Canto FCM and FCM CANTO operation Use Phyto-SYTOX protocol, measuring time is 200 sec. CALCULATIONS: See SOP FCM Canto data processing Use FCS Express Layout for Phyto SYTOX. LITERATURE: Peperzak L, Brussaard CPD (2011) Flow cytometric applicability of fluorescent vitality probes on phytoplankton. J Phycol 47:692-702 68 NIOZ Land-based Project Plan STANDARD OPERATING PROCEDURE 27-02-2012 Isabel van der Star, Eva Immler Microzooplankton 2012.2 Goal: Microzooplankton comprises by definition organisms in the size range of 20-200µm. This protocol refers to microzooplankton as defined by the IMO D2-Standards as a size class 10 ≤ µm < 50 µm. Maximum allowed numbers of organisms in this size class at discharge are 10 viable org/ml. This size class includes phytoplankton and zooplankton species. Phytoplankton is quantitatively analyzed by flow cytometry. Flagellates and dinoflagellates include autotrophic, heterotrophic and mixotrophic species, while ciliates are heterotrophic or mixotrophic. Heterotrophic species miss chlorophyll fluorescence and cannot be analysed by flow cytometry. MATERIAL & EQUIPMENT: Sampling: 1 L bottle 4ml Lugol/ L Laboratory 50ml bottles Low pressure vacuum pump (< 0.1 bar) Weighing scale Tube Pipettes (0.5- 5 ml; 100-1000µl) Pipette tips (0.5- 5 ml; 100-1000µl) Utermöhl cuvette of 5-6 ml (0,17mm bottom thickness) Inverted microscope CHEMICALS: Lugol (100 KI, 50g I₂, and 100ml HAc in 1 liter demi water), see SOP Lugol plankton fixative Sodium thiosulphate 1% dissolved in demiwater Bengal rose SAMPLING: Harbour 1L bottles with 4 ml lugol are prepared (keep in the dark prior to filling) Per sampling point 3 samples of 1 liter each are taken (3 controls after pump and 3 after treatment) Bottles are filled without filtering (ciliates are highly sensitive to damage by filters) Laboratory Samples need to settle down for at least 24 hours. They are placed in a dark solid closet to avoid light and vibrations After settling sample bottles are weighted without lid: o Full sample o Concentrated sample o Empty bottle Sample is concentrated by sucking the non-concentrated part of the sample by using a vacuum pump. A volume of max. 50 ml of the homogenized concentrated sample will be saved in a dark bottle. The concentrate is saved in a fridge for max. one year. At room temperature the sample can be stored for 6 months. 69 NIOZ Land-based Project Plan ANALYSIS: Samples need to be homogenized by mixing very carefully. Use a pipette with a big opening to assure that ciliates will not be damaged For the control sampling point T0: take 1ml out of all tree concentrated samples and mix carefully in a tube, take a subsample of 1ml and analyze in the Utermöhl cuvette. In general: analyze at least 1 ml per control sampling point and at least 3 ml per treated sampling point Place the volume in a tube and include one or more droplets of sodium thiosulphate to neutralize the Lugol. Then the sample is stained with a small droplet of Bengal Rose. This sample is placed in a Utermöhl cuvette. Fill this cuvette fully by filtrated (0.2 µm) and sterilized sea water. Analysis will be done after 2 hours of staining and settling down of the sampling Use a 0.17 mm cover glass over the cuvette to assure no movement in the cuvette itself Analysis of abundance and species determination to the lowest possible taxonomic unit is done by using an inverted microscope (200x objective, 400 and 600 for determination) For more detailed information see micro zooplankton booklet in the microscope room F00-05 At the start of the BWTS test season subsamples of 3 or more (old) samples are counted by three analysts; the individual counts are recorded; the difference between analysts should become <10% A number of samples will be compared with counts made in the same sample by Koeman & Bijkerk CALCULATIONS: Sample weight = full sample weight – empty bottle weight Concentrated sample weight= concentrated sample weight – empty bottle weight Ciliate count/ (sample weight/concentrated sample weight)* ml analyzed REMARKS: Prior to 2012 4 full series of the certification tests done for a company in one year were analyzed. From 2012 onwards for the intake samples a mixture subsample of triplicates at every sampling point are analyzed for all certification tests. Same applies for the control samples of the discharge day. Treated discharge samples are all analyzed. Before 2012 the micro zooplankton data was entered and processed in the counting program ‘Koeman en Bijkerk’ (ecologic research and advising). From 2012 onwards data will be processed in Excel See separate SOP Plankton viability T5-Incubation LITERATURE: Koeman, R.P.T., Esslink, K.Fockens, A.L. de Haan & G.L. Verweij. 2002. Biom onit oring van m icrozooplankt on in de Nederlandse zout e wat eren 2000. Rapport 2001-22. Bureau Koeman en Bijkerk, Haren Koeman en Bijkerk intern rapport genoteerde soortenlijst 2000-2010 70 NIOZ Land-based Project Plan STANDARD OPERATING PROCEDURE DATE: 2012-03-05 AUTHOR: Louis Peperzak Plankton viability T5-Incubation 2012.1 Goal: To measure the development of phyto- and microzooplankton in treated ballast water samples that were discharged after a five day holding period as a measure of viability. In UV-systems this means after a second UV-treatment on discharge. Samples for PAM and microzooplankton are taken on the first day of incubation and up to seven days, on working days only. On day 7 complete sampling is performed, including samples for phytoplankton, bacteria and microzooplankton. MATERIAL & EQUIPMENT: 10 L polycarbonate bottle (Nalgene) Magnetic stirrer and stir bar (rotation 130 rpm) Climate room at ambient temperature and irradiance at 100 µmol photons m-2 s-1; L:D = 18:6 (h:h) PAM fluorimeter Canto flow cytometer Inverted microscope 100 mL sample bottles Greiner tube 50 mL with black tape 2.5 mL cryovials Flow cytometer tubes 1 mL pipets CHEMICALS: Phytoplankton nutrient stocks: N, P, Si (Eveline); add one bottle of each nutrient to 10L sample Lugol’s iodine solution Formaldehyde-hexamine 18% (v/v) METHOD: Incubate 10 L sample on T5 (discharge day) in the climate room; add nutrients and stir Sample on each work day for 7 days (T12) SAMPLING: Pour 100 mL sample into a 100 mL sample bottle with 0.4 mL Lugol and store at 4°C in a refrigerator (microzooplankton) Pour 50 mL sample into a 50 mL Greiner tube Pipette 2x 1.5 mL( bacteria) en 3.5ml ( phytoplankton) sample from the Greiner tube in two cryovials with 18% formaldehyde (100 µl – phytoplankton en 150 µlbacteria), snap freeze store at -80°C (bacteria + phytoplankton) Store the Greiner tube 30 minutes at room temperature (PAM) ANALYSIS: Measure phytoplankton viability with the PAM (separate SOP) Measure bacteria and phytoplankton after thawing of samples with the flow cytometer (separate SOP) Measure the microzooplankton concentration with an inverted microscope (separate SOP) 71 NIOZ Land-based Project Plan REMARKS: see separate SOPs for PAM and the measurement of bacteria, phytoplankton and microzooplankton not all samples will be analysed; this will depend on the microzooplankton concentration on discharge 72 NIOZ Land-based Project Plan STANDARD OPERATING PROCEDURE DATE: 2012-09-06 AUTHOR: Josje Snoek Bacteria PicoGreen count FCM 2012.1 Goal: Determination the concentration of heterotrophic bacteria in ballast water samples. MATERIAL & EQUIPMENT: Nalgene Square bottles with 1 litre ballast water sample. Flowcytometer: BD Canto II FCM tubes for BD-CANTO PicoGreen, 100 µL commercial stock in 400 µL TE buffer SAMPLING: Samples are fixed with formaldehyde and stored at -80°C After thawing add 1 mL sample to 10 μl diluted PicoGreen Incubate for 10- 30 minutes in the dark at room temperature. Put the tubes in the carousel of the FACS-CANTO and start the analysis. Start a new series of 9 samples when the first 3 samples have been measured and repeat this until all samples have been analysed. Measurement: With FCM BD CANTO, see SOP FACS CANTO-Operation 2012.1 and FACS CANTO data processing 2012.3 Use the BD Canto “Bact-SYTOX” protocol, measuring time is 100 sec. CALCULATIONS: See SOP FCM-Data Processing with FCS Express 4.0 2012.1 Use FCS Express Layout for Phyto SYTOX. 73 NIOZ Land-based Project Plan QUALITY ASSURANCE PROJECT PLAN (QAPP) FOR. THE BIOLOOICAL EFFICACY TESflNO CI: THE: CATHELCC) BALLAST WATER TRE!ATNENT SYSTEM FROM C;ATHELCO OMBH AS PART OF THE TYPE APPROVAL. PROCESS UNDE R RESOLUTION MEPci74(SB) 000NI55flxIAL UNTIL FIJRTHER NOTICE Signed on Texel, The Netheriands 0fl: 10 September 2013 .1 / Peopi rek Ph.D, NIOZ Royal Netheriands institute for Sea Research PO. Box 59 ABSTRACT This Quality Assurance Project Plan (QAPP) is the project-specific technical document reflecting the specifics of the test facility, the BWTS tested, and other conditions affecting the actual design and implementation of the required experiments. The QAPP consists of general information, information on the NIOZ test facility and the Cathelco BWTS, test water quality, sampling and sample storing, the measurement of variables and QA/QC. In September 2012 this QAPP was sent to the BSH as section 2 of the “Project Plan (QAPP) for the Biological Efficacy Testing of the Cathelco Ballast Water Treatment System from Cathelco GmbH as part of the Type Approval Process under Resolution MEPC.174(58)” (version 2). In August 2013, on request by the BSH, the text was formatted as a stand-alone document. This stand-alone document includes the correct process diagram of the Cathelco BWTS. TABLE OF CON TEN TS 1 I N TROD UCTI ON 9 2 2.1 2.2 2.3 GEN ERAL D ESCRI PTI ON S 1 1 NIOZ profile 11 Profile of the CATHELCO group 12 Technical overview of CATHELCO’s BWTS 13 3 3.1 3.2 3.3 3.4 3.5 3.6 TEST FACI LI TY 1 7 NIOZ test facility 17 Freshwater intake at Den Helder and transport to NIOZ 18 BWTS test set-up: treatment and control tanks 20 Toolbox meetings 20 Ballast water book 21 Test season: time planning 21 4 4.1 4.2 4.3 4.4 4.5 4.5.1 4.5.2 4.5.3 4.5.4 4.5.5 TEST W ATER: QUALI TY, SAM PLI N G, STORI N G 2 3 Abiotic quality 23 Biological quality 24 General sampling strategy 25 Abiotic variables: sampling and storing 26 Biological variables: sampling and storing 28 Sampling organisms ≥50 µm 28 Sampling and storage of 10≤µm<50 organisms 29 Sampling and storage of total and viable heterotrophic bacteria 29 Sampling of human pathogens 29 Sampling for additional incubation (viability) experiments 30 5 5.1 5.1.1 5.1.2 5.1.3 5.1.4 5.2 5.2.1 5.2.2 5.2.2.1 5.2.2.2 5.2.3 5.2.4 5.2.5.2 5.2.5.3 M EASUREM EN T OF VARI ABLES 3 1 Abiotic variables 31 Salinity, Temperature and pH 31 TSS/POC (Total Suspended Solids/Particulate Organic Carbon) 31 Dissolved Oxygen (DO) 31 Dissolved Organic Carbon (DOC) 31 Biological variables 32 Counting of organisms ≥ 50 µm 32 Counting of organisms 10≤µm<50 33 Counting viable microzooplankton 33 Counting viable phytoplankton 34 Counting total heterotrophic bacteria 35 Human pathogens 36 PAM measurement for total phytoplankton viability 37 Counting phytoplankton <10 µm 37 6 6.1 6.2 6.3 QUALI TY ASSURAN CE / QUALI TY CON TROL ( QA/ QC) 3 9 Ballast water tests 39 Laboratory analyses 39 Data analysis 39 7 REFEREN CES 4 1 Aerial photo on cover by Pieter de Vries Photography. All other photos (except on page 11) by NIOZ. 1 I N TROD UCTI ON The QAPP detailed in this document forms the basis for the biological efficacy testing of the CATHELCO Ballast Water Treatment System (BWTS) manufactured by Cathelco GmbH (Kiel, Germany) in 2012 at the ballast water treatment facility of the Royal Netherlands Institute for Sea Research in The Netherlands. The first version of this protocol was submitted to the BSH (Bundesamt für Seeschifffahrt und Hydrographie or Federal Maritime and Hydrographical Agency, Hamburg, Germany) in March 2012 in advance of the land-based tests that started on April 12 of that year. The QAPP is a project specific technical document reflecting the specifics of the BWTS tested, the test facility, and other conditions affecting the actual design and implementation of the required experiments. On the other hand, the QMP should address the quality control management structure and policies of the test facility. In 2012 the combined QAPP and the QMP, collectively known as the quality control/quality assurance (QA/QC) program, was extensively extended when compared to previous years. Nevertheless, the BSH invited dr. A. Cangelosi (Northeast-Midwest Institute, USA) to review the QA/QC section of the protocol. In addition, NIOZ commissioned a review of the entire protocol to dr. S. Kools (Grontmij, The Netherlands). The present version of the protocol is revised in reaction to these two reviews. In the summer of 2012 the BSH decided that a sufficient number of marine (saline) tests had been performed earlier that year and that five successful freshwater tests were needed for type approval. This meant that additional information had to be added on freshwater sampling and testing in the relevant chapters of this protocol. The tests outlined in this protocol will evaluate the biological efficacy as outlined in the Guidelines for Approval of Ballast Water Management Systems, G8, adopted on 22 July 2005 as Resolution MEPC.125(53) (IMO, 2005) and as adopted in revised form on 10 October 2008 as Resolution MEPC.174(58/23, Annex 4) of the Ballast Water Convention of the IMO (IMO 2008). The test protocol will be submitted for Type Approval by the applicant (Cathelco GmbH) to the German National Administration (BSH). The Cathelco BWTS is composed of two main modules to disinfect ballast water of ships. One module is a filtration system, the second a UV-reactor. Both are operated during ballast water intake. During de-ballast operations the ballast water from the tanks passes again through the UVreactor before discharge. The applicant gives a brief description of the main components of the BWT system in chapter 2. A detailed description of the test facility and the design of the test, sampling, sample storage and descriptions of the measurements of abiotic as well as biological variables are given in ensuing chapters. Because NIOZ is an academic research institute additional methods to count organisms and to establish their viability are continuously being developed. These methods may be applicable to efficacy testing according to the present as to potentially future D-2 Ballast Water Performance Standards and G8-guidelines. 9 NIOZ Ballast Water Report 10 NIOZ Ballast Water Report 2 GEN ERAL D ESCRI PTI ON S Figure 1. Aerial view of the NIOZ harbour (lower right), NIOZ and the TESO ferry connecting the island of Texel with the main land (top). The Mokbaai is the source for additional suspended solids. ©Photo: Simon Smit Photography, Den Burg, Texel. 2 .1 N I OZ pr ofile All tests of the Cathelco BWTS will be carried out under supervision of the Royal Netherlands Institute for Sea Research, Landsdiep 4, 1797 SZ 't Horntje, Texel, The Netherlands (from here on NIOZ, for details see: www.nioz.nl). N I OZ Roya l N e t h e r la n ds I n st it ut e for Se a Re se a r ch is the National Oceanographic Institute of the Netherlands. NIOZ is an institute of the Netherlands Organization for Scientific Research (NWO). The institute employs about 340 people at locations on the island of Texel on the border of the North Sea and the Wadden Sea (main location) and in Yerseke in the southwest of the country. The annual budget is approximately €30 million. The mission of NIOZ is to gain and communicate scientific knowledge on coastal seas and oceans for a better understanding of the system and sustainability of our planet, to manage the national facilities for sea research and to support research and education in the Netherlands and in Europe. In order to fulfil its mission, the institute performs tasks in four specific fields. Re se a r ch : The emphasis is on innovative and independent fundamental research in continental seas and open oceans. Increasingly, the institute also carries out research based on societal issues. The senior scientists at NIOZ all participate in international research projects. Several of them also hold a professorship at Dutch or foreign Universities. Edu ca t ion : The institute educates PhD students and master students of universities and schools for professional education. Together with several universities, NIOZ also organises courses for PhD students and master students in the marine sciences. A number of our senior scientists is also appointed as professor at Dutch and foreign universities. 11 NIOZ Ballast Water Report M a r in e Techn ology: NIOZ has its own workshops for mechanical, instrumental en electronic engineering. Here, marine research equipment is being designed and built according to the wishes of our individual scientists. Fa cilit ie s: NIOZ invites marine scientists from Dutch and foreign institutes and universities to write scientific proposals involving the institute’s research vessels, laboratories and large research equipment. Our ocean-going research vessel 'Pelagia' is shared on a European level in the 'Ocean Facilities Exchange Group' (www.ofeg.org) The basic scientific disciplines at NIOZ are physics, chemistry, biology and geology. Multidisciplinary sea research is regarded as one of the main strengths of the institute. Therefore, the research is organised in 5 multi-disciplinary themes: 'Open ocean processes, Sea floor dynamics, Wadden and shelf sea systems, Climate variability and the sea and Biodiversity and ecosystem functioning'. Together with a number of oceanographic partners, NIOZ also maintains the popular marine website www.seaonscreen.org. For more information, please contact our Communication & PR department at [email protected], or visit our website at www.nioz.nl NIOZ has extensive experiences in the field of ballast water and ballast water treatment technologies at its harbour on the island of Texel. During the past seven years several pilot tests for ballast water treatment were conducted in the NIOZ harbour and so far, between 2007 and 2010 seven full scale land-based tests were carried out for Final and Type Approval. 2 .2 Pr ofile of t he Ca t he lco Gr oup Cathelco Ltd was formed in 1956 and has become a world leading supplier of cathodic protection equipment to the shipping and offshore marine markets. The parent company based in Chesterfield, United Kingdom manufactures marine pipe work antifouling (AF) and impressed current cathodic protection (ICCP) systems. The Cathelco Group has grown through a series of acquisitions beginning with Corrintec Ltd in 1995. Today, Corrintec Marine continues to operate as a wholly owned subsidiary serving the military sector worldwide. In 2005, the company established Cathelco Korea, a subsidiary engaged in manufacturing and distribution serving the Korean shipbuilding market. More recently, in 2010, Seafresh Desalinators Ltd was acquired which specialises in reverse osmosis water makers from a manufacturing facility in Bournemouth, United Kingdom. To serve the shipbuilding and repair industry in South East Asia, Cathelco S.E.A. based in Singapore, became a subsidiary in 2011. In addition to its marine engineering activities, the Cathelco Group encompasses Casting Repairs Ltd, specialising in the repair of architectural cast ironwork. It also has an active property division, focusing on property development and rental via the Broomco Ltd subsidiary. Cathelco GmbH was established in 2010 in Kiel, Germany, to research and develop ballast water treatment equipment for the worldwide market. The aim is to develop a chemical free, two stepballast water treatment system. This system should be easy to retrofit for existing vessels and innovative for new builds. Beside the ballast water issue, the Cathelco R&D Centre provides also services to the Cathelco Group in respect of testing and improving of existing products. This includes but is not limited to antifouling systems for vessels and other marine structures. 12 NIOZ Ballast Water Report 2 .3 Te chnica l Ove r vie w of Ca t he lco’s BW TS Cathelco has developed a 100% chemical free BWTS (Figure 2). It is based on the combination of filtration + UV treatment. There are no active substances needed for the treatment of the ballast water, or for the cleaning of the UV system. The system was designed with emphasis on retrofitting (e.g. installation of the different components as required by different engine room designs). However, skid-mounted systems will also be available, which are optimized for footprint. Cathelco's BWTS is a modular ballast water management system. The system is installed in bypass to the main ballast line and provides a safe, flexible and economical process for the treatment of ballast water and eradication of aquatic invasive species. Treatment of ballast water is achieved through a simple and efficient two-step process. 1 . Filt r a t ion The ballast water passes through an automatic back flushing filter capable of removing particulates, and organisms (zooplankton and phytoplankton) using a 40 µm super mesh screen. The screen is arranged in cone shaped filter candles, where the number of filter candles varies with the treatment related capacity (TRC) of the BWTS. During the NIOZ G8-tests to be performed at 200 m3/h the number of filter candles will be nine. The automatic cleaning cycle of the filter is activated by an increased pressure drop across the filter. The filter candles are cleaned one after the other without interruption of the filtration process. The frequency of the filter back flushes depends on the quality of the water (e.g. the TSS content). The concentrate is discharged over board. This ensures that the screen is kept clean and the filtration process maintained at maximum efficiency at all times. 2 . UV disin fe ct ion The filtered ballast water is directed into the disinfection chamber where a cross flow arrangement with two medium pressure ultraviolet lamps delivers the high intensity irradiation. The UV light intensity is continuously monitored during system operation so that intensity is maintained above pre-set values to ensure delivery of the required dose. The ultraviolet lamps are housed within quartz sleeves and an automatic mechanical cleaning system minimizes bio-fouling and controls the accumulation of deposits on the UV lamp sleeves. Figure 2. The Cathelco ballast water treatment system to be tested at NIOZ in 2012. This design allows for an easy exchange of the filters. 13 NIOZ Ballast Water Report At discharge, the automatic backwash filter is by-passed and the ballast water is pumped from the tanks through the UV disinfection chamber only. Thus the ballast water is subjected to UV disinfection treatment prior to discharge overboard. Spe cific fe a t ur e s/ a dva nt a ge s of Ca t he lco’s BW TS The filt r a t ion st e p Cathelco's BWTS can be operated with two different types of filters, giving it the maximum possible flexibility in addressing different installation requirements. The UV- la m p syst e m Cathelco's BWTS uses special medium pressure UV lamps with a reduced Mercury content. These lamps are mounted to a solid flange and they are surrounded / protected by a sealed robust quartz sleeve. This complete UV-lamp system, containing two lamps, is fitted to the UV reactor by a few screws. Access to the UV reactor for maintenance is from a single side only. Th e la m p r ecyclin g sch e m e On an annual basis, the UV-lamp system should be send off to Cathelco for refurbishment. The renovated lamp system will be returned to the ship with a new 1 year operating guarantee, if the lamp system has not been installed for a total time of more than 2 years. The a ut om a t e d cle a ning syst e m of t he UV This is the first NON-chemical in place cleaning system for UV-reactors (CIP-system). It uses rubber cleaning elements that are supplied on demand to the UV reactor after the BW operation is finished. The cleaning process is triggered by the intensity measurement of the individual UV lamps. Start, stop and duration of the cleaning process are controlled by Cathelco's BW system. No manual interference is needed. Figure 3. Process diagram of Cathelco’s BWTS. Ca lcula t ion of t he UV dose The UV dose is calculated directly from the water quality (UV transmittance of the water) and from the flow rate. The use of single electronic ballast units for each individual UV lamp allows for a maximum of flexibility in the power consumption. The UV lamps are operated at the most suitable dose rate at any time, allowing for significant savings in overall power consumption of the system. The UV dose at T10=70% will be about 135 J/m² at 200m³/h flow rate. This dose is above the requirements for a 4 log reduction of many microorganisms, if no photo repair mechanism occurs. 14 NIOZ Ballast Water Report As there is no light inside the ballast water tanks, our system accepts this dose during ballasting only. If the UV-T decreases further, the flow will be reduced automatically to ensure that the minimum dose (133 J/m²) is maintained. During de-ballasting, the water is much clearer, i.e. UV-T is higher, and the Cathelco system will dose between 400 J/m² and 700 J/m², which is well above the dose requirements (for a 4 log reduction) for the majority of organisms, even in the presence of photo repair mechanisms. Cathelco’s BWTS will be tested at a treatment related capacity (TRC) of 200 m³/h during the land based Type Approval Tests at the NIOZ test facility. There will be two UV-reactors and two different filters involved during the tests. The general layout of the test system should be according to the P&ID in Figure 4. Figure 4. Piping and Instrumentation diagram of Cathelco’s BWTS for a TRC (treatment related capacity) of 200 m3/h. 15 NIOZ Ballast Water Report 16 NIOZ Ballast Water Report 3 TEST FACI LI TY 3 .1 N I OZ t e st fa cilit y The land-based tests will be carried out on the island of Texel (NIOZ harbour, NL) from March to July (spring and early summer season). The NIOZ test-site is equipped with two times (Navicula and Pelagia quay) three silos or underground storage tanks of 300 m³ each to simulate ship’s ballast water tanks (Figure 5). The NIOZ harbour is located at the Marsdiep tidal inlet between the North Sea and the Wadden Sea. By sampling in different phases of the tidal cycle, waters from different seas with different abiotic and biological characteristics can be used in G8-tests. The area as a whole is characterized by a rich and varying biodiversity and high number of various planktonic organisms, especially in the spring and early summer period. During the test cycles the numbers of organisms present in the water will continuously be monitored to assure that the validity of the test cycles is in accordance with § 2.3.20 of the G8-guidelines. Figure 5. Schematic of the NIOZ harbour test facilities, including the two quays (Navicula and Pelagia) that are used in G8-tests. 17 NIOZ Ballast Water Report Figure 6. Piping and Instrumentation diagram of the Pelagia quay test site at the NIOZ harbour. The installation to be tested is a UV-treatment system. The installation consists of three ballast water tanks, one for control (untreated) water and two for treated water. Brine or fresh water can be added to adjust the salinity of the test water. Mud can be added to increase the concentration of Total Suspended Solids (TSS). Flow rates, system pressures, salinity and turbidity are monitored during intake and discharge. P&I diagrams are available for both Navicula and Pelagia quays and for different intake and discharge scenarios. 3 .2 Fr e sh w a t er in t a k e in D e n H e lder a n d t r a n spor t t o N I OZ Fresh water in Den Helder will be taken in at location B (Figure 7) by a ship that normally transports gravel and sand with a capacity of 650 m3. The ship will be cleaned of any remaining sand before taking in water. The intake water will be pumped in the hold with tubes that are suspended at a height of maximally 1 meter below the water surface. Intake will take place on the afternoon prior to the tests. The Den Helder harbour is monitored by NIOZ partner IMARES. According to IMARES Den Helder harbour is eutrophic and very productive. In May-July 2012 the concentration of >50 µm organisms was between 68,000 and 22,100,000 m-3. For the 10-50 µm organisms this was 397 to 8,040 per mL. IMARES‘ experience at another location in The Netherlands learned that organism concentrations can remain high up till winter. Only when water temperature drops below ca. 7°C the zooplankton production will stop. Such low temperatures can be expected in NovemberDecember, but not during the planned G8-tests in September-October. The freshwater test water is transported over a relatively short distance across the Marsdiep tidal inlet of the Wadden Sea within 12 hours by ship to the NIOZ harbour (Figure 8). The day following intake at Den Helder, i.e. within 24 hours, the test water is available in the NIOZ harbour and ready to be pumped into the NIOZ harbour installation. 18 NIOZ Ballast Water Report Figure 7. Freshwater intake at B („Spoorhaven“), the IMARES monitoring site in Den Helder harbour. The red horizontal bar is 0.5 km. Site A was the regular monitoring site; site B is the new IMARES monitoring site where fresh water for BWTS testing at NIOZ will be collected. Figure 8. The test water will be transported to the NIOZ harbour over a distance of 6.5 km in less than 12 hours. 19 NIOZ Ballast Water Report The pump to be used is an Amarex KRTK 100-401/354WG-S that will be suspended by a crane from the NIOZ Pelagia quay (Figure 9). The crane will be able to steadily position the pump because the freshwater surface level will change according to deballasting and tide. This pump will be connected to the NIOZ installation (Figure 6) by a flexible hose. Figure 9. The Amarex pump to be used in pumping fresh water from a boat into the NIOZ installation. 3 .3 BW TS t e st se t - u p: t r e a t m e n t a n d con t r ol t a n k s A typical test of a treatment system is performed with two treatment tanks and one control tank that are filled in rapid succession, i.e. on the same day at approximately the same time in the tidal cycle (Figure 6). The control tank with untreated water serves as reference to examine the effect of the treatment, including holding for at least 5 days (§2.3.35 G8-guidelines). The control tank can also indicate an unexpected source of mortality due to the testing arrangement (§2.3.37 G8guidelines). Therefore, the average discharge results in the control water should not be less than or equal to 10 times the values in regulation D-2.1 (§2.3.36 G8-guidelines). 3 .4 Toolbox m e et in gs The general test set-up is described in Figure 6 and in §3.2. Directly prior to each test a tool box meeting is held on the quay site with all team members. During this meeting all actions, such as order of tanks to be filled and flow rates, are briefly discussed. 20 NIOZ Ballast Water Report 3 .5 Ba lla st w a t er book All manufacturers should log their activities in a ballast water book issued by the NIOZ. Several books may be issued during the entire test period. These books remain at NIOZ in the appropriate dossier. 3 .6 Te st sea son : t im e pla n nin g The intermediate and high salinity range test season at the NIOZ harbour is restricted to spring and summer. In this period of the year sufficiently high numbers of organisms are naturally present in the North and Wadden Sea. At NIOZ the test water is not enriched with organisms, neither artificially cultured nor collected at sea. In general, early spring sea water has a lower salinity then in summer due a decrease in river discharge. A decrease in wind speed during spring will lead to diminishing concentrations of total suspended solids (TSS) and, therefore, sediment from the nearby Mokbaai (Figure 1) is added to increase TSS to the required value of 50 mg/l for brackish water. The freshwater test season, according to IMARES data, begins in March and probably ends in November-December. In February sampling and measurements in the harbour start in order to monitor the start of the spring plankton bloom. In March the first G8-tests may be performed, depending on natural circumstances such as water temperature and underwater light climate that affect the plankton development. The first set of tests is carried out at the intermediate salinity range of G8 (§2.3.17) because in early spring the freshwater content of the Wadden Sea is relatively high. Test water is pumped from the harbour at low tide when low salinity Wadden Sea water flows towards the North Sea. The second set of high salinity tests is performed in late spring or early summer. Test water is pumped from the harbour at high tide when relatively saline North Sea water flows towards the Wadden Sea. After consultation with the BSH, the Cathelco BWTS tests carried out in spring and early summer of 2012 were combined to one salinity (saline) range. This meant that an additional series of freshwater tests had to be performed. The first appropriate months for these freshwater tests were September and October. 21 NIOZ Ballast Water Report 22 NIOZ Ballast Water Report 4 TEST W ATER: QUALI TY, SAM PLI N G, STORI N G 4 .1 Abiot ic qua lit y The land-based test cycles have to be carried out at specific water qualities as defined in the G8guidelines. The NIOZ-harbour represents a brackish water environment with a varying salinity (20 – 35 PSU). High salinity water originating from the North Sea is taken in around high tide. Low salinity water from the Wadden Sea is taken in around low tide. The salinity of the Wadden Sea water is dependent on the discharge of fresh water from Lake IJssel, which itself depends on the amount of rainfall and on the flow rates in the rivers Rhine and IJssel. In an effort to maintain a minimum 10 PSU salinity difference as requested under § 2.3.17 of G8, per tank 15m3 fresh water is added in the pipelines to the natural water prior to the pump to reduce the ambient salinity (ca. -2 PSU) and 8 m3 brine (100 kg m-3 industrial quality salt) is added to increase salinity (ca. + 2 PSU) at the second set of test series. At present only brackish and high salinity seawater conditions can be tested at NIOZ. Figure 10. Extra natural sediment from the “Mokbaai” will be added when required to meet the minimum TSS concentration for the given salinity test cycle. In addition, per ballast tank 20 litre of mud (15.6 kg dry weight) from the nearby Mokbaai (Figure 1) will be added to the low salinity tests in order to reach the required TSS value of >50 mg/L (Figure 10). The organic carbon concentration is important in testing systems that use oxidizing agents as active substances. DOC concentrations are usually below 5 mg/L in low salinity test water but no DOC additions are made because the high POC values (>10 mg/L) in the NIOZ test water are considered to compensate for that. In other words, the total organic load in low salinity test water is sufficiently high. An overview of the required water quality, with respect to the composition of total suspended solids, particulate organic carbon and dissolved organic carbon is given in Table 1. 23 NIOZ Ballast Water Report Table 1. Requirements of salinity, TSS, POC and DOC in the test water for the high salinity and intermediate salinity and freshwater test regimes according to the G8-guidelines. High salinity Intermediate salinity Freshwater Salinity > 32* 3 – 32* <3 PSU Total Suspended Solids (TSS) >1 > 50** > 50** mg/L Particulate Organic Carbon (POC) >1 > 5** > 5** mg/L Dissolved Organic Carbon (DOC) >1 >5 >5 mg/L units *to obtain a 10 unit salinity difference either brine or fresh water may be added **natural mud is added to increase TSS as needed, this also increases POC 4 .2 Biologica l qua lit y In order to establish the biological efficacy of the BWTS it should be tested with water containing a high concentration of organisms as well as a sufficient biodiversity (§ 2.3.20 of G8). This is required by G8 to guarantee the effectiveness of the BWTS in different ecosystems across the globe. The variety of organisms in the influent test water should be documented according to the size classes mentioned in Table 2. Natural water, originating from the coastal zone of the North Sea (high tide) and the inner Western Wadden Sea (low tide) will be used. The test period will cover the whole spring and early summer of the plankton growth season and therefore includes the natural occurring biodiversity and species succession. The ambient plankton content in terms of species diversity in the relevant size classes is very high. For instance in 2011 16 phyla and more than 70 species were detected during the test season (Table 3). Only 5 species and 3 phyla are required (§ 2.3.20 of G8). Table 2. Minimal numbers and species diversity required at intake for different size classes and groups of organisms. 1 µm = 1 micron = 0.001 mm. Intake test water Organism unit Variety ≥50 µm > 105/ m3 at least 5 species from at least 3 different phyla/divisions ≥10 and <50 µm > 103/ mL at least 5 species from at least 3 different phyla/divisions heterotrophic bacteria > 104/ mL not further defined The natural waters of the test area include a large range of organisms varying in sensitivity to mechanical stress, UV radiation or various active substances. Besides fragile organisms also plankton that is highly adapted to harsh environmental conditions, mostly hard shell organisms, are present in the test water. For completeness, the plankton fraction <10 µm is also included in the NIOZ analyses although this is not required by the G8-guideline. 24 NIOZ Ballast Water Report Table 3. Biodiversity as number of species in NIOZ test water according to phylum and to size class based on data from the 2011 spring and early summer test season. The test water contains at least 18 phyla with a total of 16 phyla in the 10-50 and >50 µm size classes. The total number of species in each G8-size class is 42 (8 phyla) for the 10≤µm<50, and 31 (10 phyla) for the ≥50µm size classes. Organisms <10µm that are not bacteria are not part of the D-2 regulation. The high test water biodiversity largely exceeds the G8-guideline (§2.3.20). Phyluma Number <10 µm Amoebozoa Number 10-50 µm Number >50 µm 1 Annelida 5 Arthropoda 13 Cercozoa 1 b Chlorophyta 1 Choanozoa 1 Ciliophora 1 3 Cnidaria Cryptophyta 2 1 Ctenophora 1 Echinodermata 1 Euglenozoa Haptophyta 1 3 Mollusca Myzozoa 4 2 6 Nematoda Ochrophyta 1 1 12 28 Unknownc 4 1 Tot a l 24 42 Rotifera 2 1 31 a The taxonomic system is as follows: Kingdom (Archea, Bacteria, Animalia, Chromista (“Algae”), Plantae) – Subkingdom – Infrakingdom – Phylum – Subphylum - Division – Class – Subclass –Superorder – Order – Family – Genus – Species 4 .3 b Division (no phylum for this group) c The phylum ‘unknown’ contains several species of unidentified phytoplankton flagellates Ge n e r a l sa m plin g st r a t e gy Samples are generally taken: 1) 2) 3) 4) In the harbour to assess test water quality before the pump. Harbour water samples are analysed regularly from February onwards in order to monitor the spring plankton bloom. Immediately before the treatment equipment from the main pipeline but after the ballast pump that is used to pump up the test water from the harbour (control, T0), Immediately after treatment from the main pipeline (treated, T0) and During discharge from the main pipeline, after the pump, after 5 days (control and treated, T5) holding time (§ 2.3.2 and 2.3.26 G8-guidelines) and after completing a second passage through the BWTS when this step forms part of the treatment prescribed by the vendor of the BWTS, i.e. in the case of the Cathelco BWTS (treated only). During ballast water tests samples will be taken sequentially, covering the entire intake or discharge periods. During the tests the following sample sizes will be used: 25 NIOZ Ballast Water Report 1) 2) 3) Untreated water (control, T0 and T5): Sampling is conducted in-line, three times, with sample volumes of 20 L (>50 µm), 10 L and 2x 1 L. The 10 L samples are used to subsample for abiotic variables. The 1 L samples are used (1) to subsample for phytoplankton, bacteria, as well as for phytoplankton <10 µm and (2) microzooplankton (10≤µm<50). An additional 10 L sample is taken for an incubation experiment (T0 only). Treated water (intake, T0): Sampling is conducted in-line, three times, with sample volumes of 1 m3 (>50 µm) using 3 IBCs of 1000 L each. Furthermore, in-line sampling is conducted three times with a sample volume of 10 L and 2x 1 L. The 10 L samples are used to subsample for abiotic variables. The 1 L samples are used (1) to subsample for phytoplankton, bacteria, as well as for phytoplankton <10 µm and (2) microzooplankton (10≤µm<50). Additional samples of 10 L are taken for incubation experiments. Treated (discharge, ≥T5): Sampling is conducted in-line, three times, with sample volumes of 1 m3 (>50 µm) using 3 IBCs of 1000 L each. Furthermore, in-line sampling is conducted three times with a sample volume of 10 L and 2x 1 L. The 10 L samples are used to subsample for abiotic variables. The 1 L samples are used (1) to subsample for phytoplankton, bacteria, as well as for phytoplankton <10 µm and (2) microzooplankton (10≤µm<50). Additional samples of 10 L each are taken for incubation experiments. The (sub)-sample volumes taken from the in-line samples deviate from §2.3.32-33 (G8guideline): 10≤µm<50: 1 L for untreated water and 10 L for treated water; bacteria: 0.5 L. Note that G8 only specifies sample sizes, but not which volume of these samples should actually be analysed. The reason for this deviation is that sample volumes of 10 L for organisms 10≤µm<50 and 0.5 L for heterotrophic bacteria are impractical: much smaller volumes will eventually be analysed without compromising the analytical accuracy. The sample volumes for pathogenic bacteria are 300 and 600 mL. 4 .4 Abiot ic va r ia ble s: sa m pling a nd st or ing Figure 11. Navicula quay laboratory for first line handling of samples. The measurement of the following abiotic (environmental) variables is required during sampling (G8 § 2.3.25): 1) 2) 3) 4) 5) 6) 7) 26 salinity, temperature, Particulate Organic Carbon (POC), Total Suspended Solids (TSS), pH, Dissolved Oxygen (DO) and Dissolved Organic Carbon (DOC). NIOZ Ballast Water Report Turbidity is also mentioned in § 2.3.25 (G8) but experience has learned that it is difficult to reliably measure this variable in water samples of limited volume taken during intake or discharge. Furthermore, turbidity is a function of TSS, a variable that is measured accurately and with far better precision. In addition, NIOZ research has shown that at low TSS values a standard turbidity instrument underestimates the actual solid content of the water. Rapid measurement and processing of samples for the basic variables is ensured by the NIOZ harbour laboratory on the Navicula and Pelagia quays of the test facility (Figure 11). A number of measurements is performed after sampling (e.g. temperature, salinity and pH), while the other samples (DOC, POC, TSS, DO) is processed for later analysis. DOC samples are filtered through GF/C filters and sealed in pre-combusted glass ampoules or special screw cap bottles after adding hydrochloric acid (HCl). Sealed ampoules or bottles are stored at 4°C until analysis. For TSS/POC measurements pre-weighed glass-fibre filters (GF/C) are used. Each filter is coded and stored individually in a Petri dish. The filtered water volume is not constant but depends on the particle concentration of the test water. The higher the particle concentration in the sample, the smaller the volume that can be filtered before clogging. Practical volumes are 100-1000 mL per sample. After filtration the filter is rinsed with demineralised water to remove sea salts. The filter is then put back in its original Petri dish and stored temporarily in a freezer at –20°C or longterm at -80°C until further analysis. Glass Winkler bottles for oxygen (DO) are flushed at least three times their volume (ca. 120 mL) with test or control water. Great care is taken to avoid gas bubbles on the wall of the bottle or excessive mixing of air and water. Next, MnCl2 and NaOH solutions are added to the bottle just below the surface by using dispenser units to fix the oxygen concentration. A stopper secured with a rubber band is put on the bottle and the bottle is gently mixed. Bottles are stored in a dark container filled with water of the same temperature as the samples until further analysis in the laboratory (Figure 12). Figure 12. Glass bottles for Dissolved Oxygen (DO) measurements are stored submerged prior to analysis. In special cases gastight tubing which is fitted to the sampling tubing is used to avoid exchange of gasses, such as CO2 or oxygen, between water and surrounding atmosphere (Figure 13). All environmental variables are measured in triplicate samples (§ 2.3.29 G8-guidelines). From 2012 onwards, additional continuous measurements of temperature, salinity, flow rate, system pressure and turbidity will be made at intake and discharge by sampling via a specific sample port equipped with the appropriate monitoring instrumentation (e.g. S and T in Figure 3). 27 NIOZ Ballast Water Report The data will be logged electronically and will be used to monitor basic system variables during intake and discharge of the BWTS tests. Figure 13. Sampling point on a tank at the Navicula quay for sampling dissolved gasses such as dissolved oxygen. 4 .5 Biologica l va r ia ble s: sa m plin g a n d st or in g Biological variables that need to be considered (Regulation D-2 and § 2.3.20-21 G8-guidelines) are: (1) (2) (3) (4) (5) (6) Concentration Concentration Concentration Concentration Concentration Concentration and diversity of organisms ≥50 µm, and diversity of organisms 10≤µm<50, of heterotrophic bacteria, of coliform bacteria, of Ent erococcus bacteria, and of Vibrio cholera. The groups of organisms ≥50 µm and 10≤µm<50 consist of both algae (phytoplankton, mainly < 50 µm) and animals (zooplankton, mainly >50 µm). According to the Ballast Water Performance Standard (Regulation D-2 and § 4.7 G8-guidelines) only viable organisms must be counted at the end of the test in both the treatment and the control tanks. For both of the IMO relevant size classes (organisms ≥50 µm and 10≤µm<50), multiple methods of enumeration and of assessing the viability are applied at NIOZ to verify the results at a high level of confidence. In principle all methods should give a conclusive answer with respect to numbers and/or viability of the (remaining) organisms. At NIOZ the viability of all organisms is not only measured at discharge but during intake as well. Furthermore, the concentration of phytoplankton <10 µm is measured. All biological variables are measured in triplicate samples (§ 2.3.29 G8-guidelines). 4.5.1 Sampling organisms ≥50 µm The samples of the untreated water (20 L) are taken in triplicate, collected in clean buckets that are filled directly for volumetric measurements, and poured through a 50 m sieve made from the same gauze as the sampling nets used for the 1 m3 IBC samples. Discharge water samples are collected using Hydrobios™ 50 m diagonal mesh size nets, as recommended in MEPC 54/Inf.3, that are fitted into 1m3 IBC’s (Figure 14). Sampling is conducted via flexible hoses which are connected to the sampling points. To sample treated water the hose is put into the Hydrobios™ net. The whole sampling procedure will be timed in a way to cover the whole period of filling the ballast water tank with ca. 250 m3 water. For practical reasons all organisms quantitatively retained on the 50 m net are considered as larger than 50 m in minimum dimension. 28 NIOZ Ballast Water Report The organisms retained in the cod-end of the Hydrobios™ net are flushed into a beaker using a squeeze bottle containing filtered seawater. Organisms are kept in approximately 100 to 200 mL of filtered (≤0.2 µm filter) sterile water of the relevant salinity. Samples are transferred to the lab directly after sampling, treated for 2 hours with the viability stain ‘Neutral Red’, and counted. These samples are not stored. Figure 14. Intermediate Bulk Containers (IBCs) of 1 m3 each. A 50 µm Hydrobios™ plankton net is fitted in the containers through the lid for easy sampling. 4.5.2 Sampling and storage of 10≤µm<50 organisms Samples for the 10≤µm<50 fraction are taken as undisturbed (unfiltered) one litre samples. This size-fraction is not separated from the organisms <10 µm or >50 µm at sampling or during sample processing but during data analysis. This approach reduces damage to more delicate organisms as ciliates and non-armoured flagellates. Whole, intact samples of 1 L are stored in the dark prior to analysis in the laboratory. The total concentration of 10≤µm<50 phytoplankton cells is measured in non-fixed samples. The concentration of dead phytoplankton cells is measured using SYTOX-Green, also in non-fixed samples. The difference between the concentrations of total and dead organisms is the concentration of viable organisms. As a reserve a 5 mL sample is fixed with formaldehyde and stored at -80°C for up to one year. This fixed sample can no longer be used to determine the viability of the organisms. The samples for 10≤µm<50 microzooplankton are fixed with Lugol’s solution; they can be stored in a refrigerator for up to one year before counting takes place. The viability of the organisms is assessed from their intact morphology. 4.5.3 Sampling and storage of total and viable heterotrophic bacteria To determine the total concentration of bacteria samples fixed with formaldehyde are frozen and stored at -80 °C until counts are made after staining with PicoGreen. Dead bacteria in non-fixed samples are measured in fresh test water using SYTOX-Green; these samples cannot be stored. The difference between the concentrations of total and dead bacteria is the concentration of viable bacteria. 4.5.4 Sampling of human pathogens Live samples for microbiological analysis are taken in sterile bottles of 300 or 600 mL and sent to a special laboratory (Eurofins/ C.mark) for further analysis. The samples are transported immediately after sampling using a cooled transport container (4 °C). 29 NIOZ Ballast Water Report 4.5.5 Sampling for additional incubation (viability) experiments Additional incubation experiments, which are not required by G8, serve to better assess the effect of the different ballast water treatment systems and the five day tank storage on cell viability and concentration. In case the treatment is insufficient and residual viable organisms remain present or resting stages or cysts germinate, growth of the plankton will be stimulated under favourable conditions. This incubation method also allows studies on the effect of the treatment over a period longer than 5 days (up to 20 days). The experiments usually involve control and treated water that were sampled at T5, the day of discharge. They are performed in 10 L flasks in a climate room under optimal growth conditions for the plankton community, including irradiance, temperature and turbulence. A sufficiently high level of nutrients is ensured through the addition of nitrate, phosphate and silicate, favouring phytoplankton growth and stimulating cyst germination throughout these experiments. The standard variables measured include phytoplankton and microzooplankton abundance (<10µm and 10≤µm<50), the viability of phytoplankton (PAM fluorimetry) and the abundance of bacteria. Usually the incubation time is seven days. In more elaborate experiments samples are taken daily and may include multiple analyses of phytoplankton and heterotrophic bacteria. 30 NIOZ Ballast Water Report 5 M EASUREM EN T OF VARI ABLES A list of all abiotic and biotic variables that are required by G8 is provided in Table 5.1. All variables are measured in samples of test water, taken during intake and discharge as required. Turbidity is a function of TSS, and because turbidity is difficult to measure reliably at relatively low TSS concentrations, this variable is only measured in-line and not in separate samples. Vibrio cholerae is not present in NIOZ test water, cannot be added, and hence is not sampled for. An additional measurement is that of phytoplankton <10 µm, which is not an IMO requirement (Table 5.1). All measurements are described in the Standard Operating Procedures (SOPs) that are listed in section 3 of this project plan. Samples for E. coli and enterococci are outsourced and analysed according to NEN-ISO standards (Table 5.1). A brief description of all relevant methods is given in the following paragraphs. 5 .1 Abiot ic va r ia ble s 5.1.1 Salinity, Temperature and pH Water samples for salinity, temperature and pH are collected in 10 L buckets. Measurements are either done immediately or after storage (maximum 6 hours) in the dark and at ambient temperature. Salinity is measured with a digital conductivity meter. Temperature is measured with a calibrated digital thermometer. pH is measured with a calibrated digital pH meter. 5.1.2 TSS/POC (Total Suspended Solids/Particulate Organic Carbon) For TSS analysis filters are dried at 60°C for at least 8 hours and weighed again. The concentration of TSS per litre can be calculated from the sample volume and the weight difference of the filter before and after sampling. TSS is expressed as mg/L. Next, to determine the POC concentration the same filter is combusted overnight at 500°C and allowed to cool in a dessicator and weighed again. The POC is calculated from the weight difference between this measurement and the dry TSS weight. POC is expressed as mg C/L. 5.1.3 Dissolved Oxygen (DO) Fixed samples in Winkler bottles are acidified with H2SO4 prior to measuring the optical density (OD) at 456 nm with a spectrophotometer. The oxygen concentration is calculated using standards and expressed as M O2/L (or mg O2/L = M O2 * 0.032). Since both salinity and temperature change over the season the oxygen concentrations is expressed as percentage relative to the natural saturation value for the given temperature and salinity. 5.1.4 Dissolved Organic Carbon (DOC) The DOC concentration is determined in the laboratory by a high temperature combustion method using a Shimadzu TOC-Vcpn analyser according to Reinthaler & Herndl (2005). Standards are prepared with potassium hydrogen phthalate (Nacalao Tesque, Inc, Kioto, Japan). The mean concentration of triplicate injections of each sample (three in total) is calculated. The average analytical precision of the instrument is <3 %. 31 NIOZ Ballast Water Report Table 4. List of variables measured in land-based tests at NIOZ Variable unit IMO required Reference Salinity PSU Y SOP Temperature °C Y SOP pH - Y SOP TSS mg/L Y SOP Particulate Organic Carbon mg/L Y SOP Dissolved Oxygen % saturation Y SOP Dissolved Organic Carbon mg/L Y SOP Viable organisms ≥50 µm, including diversity 3 number per m , number of phyla and species Y SOP Organisms 10-50 µm (phytoplankton) number per mL Y SOP Phytoplankton diversity number of phyla and species Y SOP Phytoplankton viability (PAM fluorimetry) Fv/Fm Y SOP Phytoplankton viability (SYTOX Green) number per mL Y SOP Organisms 10-50 µm (microzooplankton) number per mL Y SOP Microzooplankton diversity number of phyla and species Y SOP Microzooplankton viability + or - Y SOP Organisms <10 µm (phytoplankton) number per mL N SOP Heterotrophic bacteria number per mL Y SOP E. coli cfu per 100 mL Y NEN-EN-ISO 9308-1 Enterococci cfu per 100 mL Y NEN-EN-ISO 7899-2 5 .2 Biologica l va r ia ble s 5.2.1 Counting of organisms ≥50 µm For minimum dimension measurements the "body" of the organism should be measured, i.e. not antennae, tails etc. Examples are presented in Figure 15. C A E D B F G Figure 15. Minimum dimension measurements (red line) in selected organism types: A = bivalve larvae, B = gastropod larvae, C = worm, D = echinodermata larvae, E and F = crustacean larvae and G = copepod. The viability of the organisms is assessed with Neutral Red, which stains living organisms only and does not affect their survival rate. This viability assessment remains unaffected by the possible 32 NIOZ Ballast Water Report death of organisms during staining or during sample analysis due to, for instance, warming of the sample. This is because organisms that die after addition of the Neutral Red will still be clearly stained, while those already dead prior to the addition will not be stained. Neutral Red is pipetted in a ratio that yields an end concentration of approx. 1:50.000. The Neutral Red stock solution is 1:2.000, i.e. approximately 4 mL of stock solution is needed to stain a sample of 100 mL. The staining time is ≥ 2 hours. Stained samples are filtered over a 30 µm sieve and flushed into a Bogorov-dish with filtered seawater. Samples are analysed using a binocular with a 20x magnification for counting and up to 80x for species identification and measurements when necessary. Neutral Red stains all major plankton groups, including phytoplankton, but it seems to have some limitations for bivalve larvae. For the latter movement, including that of hart and gill is used to verify viability. This is dependent on the expertise of the person analysing the samples. Therefore, only persons with a dedicated training period will analyse samples. Organisms that are able to swim are also considered alive. In doubt, the organism can be poked with a dissection needle. The procedure is outlined in Figure 16. Organisms larger 50µm – landbased tests Viability testing Filling/emptying of test tanks Structural integrity undisturbed Structural integrity disturbed Sampling with 50µm-net * Stained Transfer of organisms into filtered water & transport to lab and/ or Adjustment of volume to 100 – 200 ml and addition of stain in a 1:50.000 ratio; Staining time 1+ hrs. Count at 20x magnification Unstained or light colour and/or no movement Physical manipulation with dissection needle or observation at higher magnificaton Filter stained sample over 30 µm sieve Transfer of organisms into Bogorov-dish with filtered, unstained water Movement No movement Alive / Viable Dead * Retain filtered water for further analysis of organisms < 50µm Figure 16. Sampling and viability assessment for organisms larger than 50 µm during land-based tests. 5.2.2 Counting of organisms 10≤µm<50 5.2.2.1 Counting viable microzooplankton The sample bottles are transferred to the laboratory and left undisturbed in the dark for all organisms and material to settle. After at least 24 hours the full bottle weight is measured. Using a water-jet pump and specialized tubing, the supernatant is aspirated. The bottle is weighed once more. The concentrate is transferred to small storage bottles that can be stored refrigerated for one year. The bottle is weighed once more to determine the sample and concentrate volumes. The samples are analyzed with an inverted microscope at 200x magnification (method by Utermöhl). The fixed samples (or sub-samples thereof) are transferred into settling chambers and 33 NIOZ Ballast Water Report neutralized using sodium thiosulfate. After this, the sample is stained using Bengal rose stain. This stain specifically stains organic material and helps to identify organisms between sediment particles. After staining the samples are left undisturbed in the dark to settle. The time of settling depends on the settling chamber used, but should be at least 1 hour per cm height of the settling chamber. The iodide component of the Lugol’s solution increases the weight of particles. Therefore they settle on the bottom-glass and can be counted. Live-dead-separation in these samples is mainly based on the structural integrity of organisms. This method can be applied for both zooand phytoplankton. Nevertheless certain groups are known to be affected by this standard method of fixation and therefore they will be systematically underestimated, if present. 5.2.2.2. Counting viable phytoplankton Organisms in the 10≤µm<50 size class will be analyzed via flow cytometry (Figure 17), a semiautomated method used in the NIOZ for the counting of phytoplankton, bacteria and viruses. In principle, flow cytometry allows to assess a complete view of the effectiveness of the applied treatment technique for all organisms, irrespective of their size (Veldhuis & Kraay, 2000). By applying special staining techniques the numerical abundance of heterotrophic as well as autotrophic bacteria can also be estimated. The vitality of the different organisms present will be addressed by using a specific fluorescent dye method (Veldhuis et al. 2001, Cassoti et al. 2005, Veldhuis et al. 2006, Peperzak & Brussaard 2011). In addition, the viability will be assessed by incubating discharge water (see § 4.5.5). The diversity of the phytoplankton is measured by microscopy of Lugol-fixed samples of the NIOZ test water by Koeman & Bijkerk (The Netherlands). This company is actively involved in international quality assessments (http://www.planktonforum.eu/) Three replicate samples from both control and treated water are placed in the carousel of a bench top flow cytometer (Beckman Coulter XL-MCL or Becton Dickson Canto II), of which the Canto flow cytometer has an elaborate quality control system. All procedures and handling are conducted according to standard procedures (e.g. Shapiro 2003). Samples will be counted using standard protocols covering the particles in the size range of ca. 2 to 50 µm. Total analysis time will be equal to an exact sampling volume of 1 mL or otherwise when relevant. Of all particles present in the volume counted, the cell size and the presence or absence of chlorophyll-a fluorescence will be measured. Only phytoplankton has chlorophyll-a fluorescence (Figure 18a,b). Absolute numbers, cell sizes and chlorophyll-a content of the particles will be analyzed using the software package FCS Express V3 or V4 (DeNovo, US). Cell sizes will be estimated relative to 10µm standard fluorescent beads (Flow-Check Fluorospheres, Beckman Coulter #660539) or relative to 10 and 50 µm beads on the Canto II. For measuring viable phytoplankton, three subsamples will be stained with SYTOX Green (Veldhuis et al, 2001). This nucleic acid specific dye only stains DNA of cells with a compromised cell membrane. Of each phytoplankton cell present the green SYTOX fluorescence (Figure 15b) will be determined and compared with the green autofluorescent signal (Veldhuis et al, 2001, Cassoti et al, 2005, Peperzak & Brussaard 2011). 34 NIOZ Ballast Water Report Figure 17. Bench top flow cytometer (Becton Dickinson Canto II), an instrument to enumerate live and dead organisms <50 µm. Figure 18. (a) Epifluorescence microscopic picture of a live phytoplankton cell. The red signal is due to the presence of chlorophyll-a, and (b) a dead phytoplankton cell with a yellow-green fluorescence of the nucleus after staining with SYTOX Green. 5.2.3 Counting total heterotrophic bacteria The classical method for counting bacteria in many applications is based on plating on selective media. Unfortunately, for studies in the aquatic environment this approach is by far insufficient for various reasons (Gasol & Del Giorgio 2000). Therefore, the total bacteria concentration in fixed samples is accurately determined by flow cytometry using the DNA-specific stain PicoGreen (cf. Gasol & Del Giorgio 2000, Veldhuis et al. 1997). 35 NIOZ Ballast Water Report Figure 19. Epifluorescence microscopic picture showing bacteria and viruses in a natural water sample. The yellowgreen fluorescence signal is DNA stained with a nucleic acid dye. The dye PicoGreen is a green nucleic acid specific dye that only stains dsDNA, with little or no cross-over for ssDNA and RNA (Veldhuis et al, 1997). This makes the staining method ideal to for staining of DNA and therefore to determine bacterial abundance. Flow cytometric analysis shows a clear signal with an excellent signal to noise ratio and bacteria are made visible easily and distinguishable from viruses and larger organisms. This approach has extensively been compared with bacteria staining and counting using an epifluorescent microscope (Figure 19), resulting in nearly identical results. However, because the flow cytometer method is much faster (results are obtained within 100 seconds and over 100 samples can be analyzed per day), and highly reproducible this counting method is to be preferred above the far more time consuming and labour intensive microscopic observations. 5.2.4 Human pathogens The samples for microbiological analysis are taken in special bottles of 300 or 600 mL and send to a special laboratory (Eurofins/ C-mark, Quality system: Testing RVA L154) for further analysis. All analyses are carried out according to NEN-ISO standards. Escherichia coli Analysis for Escherichia coli is carried out according to NEN-EN-ISO 9308-1 for the analysis of surface waters. For this the samples are filtered through membrane filters (pore size 0.45 µm) and these filters are incubated on a selective agar plate. Incubation is 4.5 ± 0.5 hours at 37 ± 1°C and then another 19.5 ± 0.5 hours at 44 ± 0.5 °C. After that the incubated filters are transferred on sterile filters soaked with Indol reagent. For colonies of E. coli this yields a red colour. These red colonies are counted and set into relation to the sample volume. Results are confirmed via a positive and a negative control. For the latter sterilized water is incubated like a regular sample and to confirm the results it may only yield less than 1 colony forming unit (cfu) per mL. The positive control uses a special strain of E. coli also incubated like a normal sample to confirm that this species can grow and form colonies on the used media. 36 NIOZ Ballast Water Report Ent erococci group Analysis for this group is carried out according NEN-EN-ISO 7899-2. For this the samples are filtered through membrane filters (pore size 0.45 µm) and these filters are incubated on a selective agar plate. Incubation is 44 ± 4 hours at 36 ± 2°C on Slanetz & Bartley medium. After that red and pink colonies are counted. If the presence of enterococcus bacteria can be suspected after the colour of the colonies the filter is transferred to a pre-heated, selective agar plate and incubated for another 2 hours at 44 ± 0,5 °C. After that the medium is examined whether or not a brown to black colour can be found in it. Results are confirmed via a positive and a negative control. For the latter sterilized water is incubated like a regular sample and to confirm the results it may only yield less than 1 colony forming unit (cfu) per 100 mL. The positive control uses a strain of Ent erococcus faecium . 5.2.5.2 PAM measurement for total phytoplankton viability The photochemical efficiency of photosystem II is an indicator of the physiological ‘health’ condition of phytoplankton cells. It is a bulk variable that is measured using a Pulse Amplitude Modulated (PAM) fluorimeter (Schreiber et al 1993, Figure 20). The simple fluorescence ratio Fv/Fm gives a qualitative indication of the photosynthetic efficiency of the phytoplankton community. In addition, the maximum fluorescence value Fm is an indication of phytoplankton biomass. Prior to the measurement the sample is kept in the dark for at least 30 minutes. 3 mL of unfiltered sample water (control and treated, each in triplicate) are filled into a glass cuvette and analysed within 2 minutes. In the case of a high photosynthetic efficiency of the bulk phytoplankton community, samples can be filtered using 50 and 10 m Hydrobios™ gauze to determine the exact size class of the viable phytoplankton fraction. Figure 20. PAM fluorimetry, a fast method to determine (bulk) phytoplankton biomass and the physiological condition of the photosynthetic apparatus of the cells. 5.2.5.3 Counting phytoplankton <10 µm Organisms in this size class will be analyzed via flow cytometry, as explained for the 10≤µm<50 phytoplankton size class. 37 NIOZ Ballast Water Report 38 NIOZ Ballast Water Report 6 QUALI TY ASSURAN CE/ QUALI TY CON TROL ( QA/ QC) The Quality Management Program (QMP) addresses the quality control management structure and policies of the test facility. Sampling and analysis standard operating protocols (SOPs) contain QA/QC measures where applicable. 6 .1 Ba lla st w a t er t e st s For all ballast water test scenarios piping and instrumentation diagrams are available. Prior to each test a tool box meeting is held to ensure that the proper procedures are followed during intake and discharge. During the ballast water project all samples are taken, stored and analysed according to the dedicated SOPs. Prior to all tests sample codes are assigned following the rules explained in Table 4. Because the test site is within very short distance of the main NIOZ building all samples containing fresh and live material are immediately transported to the laboratory for direct analysis. The sample storage flasks as well as cryovial boxes are labelled with the same coloured labels and codes. Samples that are fixed for long-term storage are stored in specifically designated refrigerators (4°C) and freezers (-20°C, -80°C). The samples for microbiological analysis of the presence and number of human pathogens will be taken in special bottles of 300 and 600 mL and sent to “Eurofins/C.mark” in Heerenveen (accreditation certificate: RvA lab. no. L043). The samples will be transported immediately after sampling using a cooled transport container (4 °C). 6 .2 La bor a t or y a na lyse s The analyses of abiotic and biological variables are described in general in other parts of this project plan. Detailed descriptions of each analysis are available. These Standard Operating Procedures (SOPs) of sampling, sample storage, sample analyses, data analyses and data management are part of the NIOZ Ballast Water QMP. Specific quality assurance and quality control measures are contained in each SOP. 6 .3 D a t a a n a lysis The sample codes assigned a priori to the harbour tests (Table 4) are also used in data handling, i.e. the transfer of data from laboratory instruments to Excel™ files, dedicated to specific analyses. All data files are collected on a NIOZ network disk that is backed-up at least once a day. The separate data files are combined in one Excel™ file in which all appropriate calculations for D-2 and G8 will be conducted. The data on the NIOZ network disk are accessible to authorised NIOZ test facility personnel only. Statistical analyses will be performed in Excel™ version 14. Additional analyses will be performed in either SYSTAT version 13 or Primer version 6. SYSTAT and Primer allow for more sophisticated statistical analyses of the BWTS’ performance than the t-tests that are recommended in §2.3.37 of the G8-guidelines. The scientific hypothesis that will be tested, the so-called null-hypothesis, is that there are no differences between treated and control water samples. Quality data are compiled in tables, and when possible visualised in diagrams such as, for instance, Shewhart control charts. NIOZ will report the total number of tests that were needed to meet the D2-standard five times for each salinity range. 39 NIOZ Ballast Water Report Table 5. Example of the assignment of coloured codes prior to tests. Sample flasks contain the appropriate code on a coloured label to prevent misidentification. T0 is the day of treatment and Tx is the xth day of sampling. Usually x = 5 at discharge. Test numbers are Roman numerals (I, II, III, etc.) using a new number for every test (e.g. I to X). Replicates are denoted with normal numbers (1, 2, 3, etc.). The example codes I-T5-M(1-4)-1 is, for each manufacturer, the first replicate sample of Test I on day 5 (T5). Sample Quay Label colour Wadden Sea (harbour inlet) Navicula WSn Red Wadden Sea (harbour inlet) Pelagia WSp Red+Orange Control tank (T0) Navicula Cn Green Control tank (T0) Pelagia Cp Green+Red Treatment tanks for T0 to Tx: 40 Code e.g.: Manufacturer 1 Navicula I-T5-M1-1 Orange Manufacturer 2 Navicula I-T5-M2-1 Yellow Manufacturer 3 Pelagia I-T5-M3-1 Purple Manufacturer 4 Pelagia I-T5-M4-1 Blue NIOZ Ballast Water Report 7 REFEREN CES Cassoti, R., S. Mazza, C. Brunet, V. Vantrepotte, A. Ianora & A. Miralto (2005) Growth inhibition and toxicity of the diatom aldehyde 2-trans, 4-trans-decadiental on Thalassirosira weissflogii (baciillariophycea). J. Phycol. 41: 7 - 20. Falcioni, T., S. Papa, and J. A. Gasol. 2008. Evaluating the flow-cytometric nucleic acid doublestaining protocol in realistic situations of planktonic bacterial death. Applied and Environmental Microbiology 74: 1767-1779. Gasol JM, del Giorgio PAD (2000) Using flow cytometry for counting natural planktonic bacteria and understanding the structure of planktonic bacterial communities. Sci. Mar. 64:197 - 224 Gregori, G. and others 2001. Resolution of Viable and Membrane-Compromised Bacteria in Freshwater and Marine Waters Based on Analytical Flow Cytometry and Nucleic Acid Double Staining. Appl. Environ. Microbiol. 67: 4662-4670. Jeffrey SW, Mantoura RFC, Wright SW (1997) Phytoplankton pigments in oceanography. In: S.W. Jeffrey, R.F.C. Mantroura and S.W. Wright (eds) Phytoplankton pigments in oceanography: guidelines to modern methods SCOR-UNESCO, Paris pp. 661. IMO (2005) Guidelines for approval of ballast water management systems (G8). Annex3 Resolution MEPC.125(53) Annex: Parts 1,2,3 and 4. IMO (2008) Guidelines for approval of ballast water management systems (G8). Annex 4 Resolution MEPC.174.58. Kraay G, Zapata M, Veldhuis MJW (1992) Separation of chlorophylls c1, c2 and c3 of marine phytoplankton by reversed-phase-C18-high-perfomance liquid chromatography. J. Phycol. 28:708 - 712 Mackey MD, Mackey DJ, Higgins HW, Wright SW (1996) CHEMTAX- a program for estimating class abundances form chemical markers: application to HPLC measurements of phytoplankton. Mar. Ecol. Progr. Ser. 144:265 – 283. Peperzak, L, & CPD Brussaard. 2011. Flow cytometric applicability of fluorescent vitality probes on phytoplankton. J. Phycol. 47: 692-702. Reinthaler T, Herndl GJ (2005) Seasonal dynamics of bacterial growth efficiencies in relation to phytoplankton in the southern North Sea. Aquat . Microb. Ecol. 39:7 - 16 Schreiber U, Neubauer C, Schliwa U (1993) PAM fluorimeter based on medium-frequency pulsed Xe-flash measuring light: A highly sensitive new tool in basic and applied photosynthesis. Phot osynt h. Res. 36:65 - 72 Shapiro HM (2003) Practical flow cytometry. John Wiley & Sons, Inc. New Jersey. Veldhuis MJW, Cucci TL, Sieracki ME (1997) Cellular DNA content of marine phytoplankton using two new fluorochromes: taxonomic and ecological implications. J. Phycol. 33:527 - 541 Veldhuis MJW, Kraay GW (2000) Application of flow cytometry in marine phytoplankton research: current applications and future perspectives. Sci. Mar. 64:121 – 134. Veldhuis MJW, Kraay GW, Timmermans KR (2001) Cell death in phytoplankton: correlation between changes in membrane permeability, photosynthetic activity, pigmentation and growth. Eur. J. Phycol. 36:167 – 177. Veldhuis MJW, Fuhr F, Boon JP, Hallers-Tjabbes C.C. (2006) Treatment of ballast water; how to test a system with a modular concept? Environ. Technol. 27:909 – 921. 41 NIOZ Ballast Water Report Quality Management Plan (QMP) /, / S ned on Texel, The Netherlands on: 29 August 2013 L. Peperzak, Ph.D. NIOZ Royal Netherlands Institute for Sea Research P.O. Box 59 NL-1790 AB Den Burg, The Netherlands TABLE OF CON TEN TS 1 2 3 4 5 6 7 8 9 10 11 I N TROD UCTI ON 7 QUALI TY SYSTEM M AN AGEM EN T AN D ORGAN I SATI ON 8 QUALI TY SYSTEM COM PON EN TS 9 PERSON N EL QUALI FI CATI ON S AN D TRAI N I N G 1 0 PROCUREM EN T OF I TEM S AN D ACTI VI TI ES 1 0 D OCUM EN TS AN D RECORD S 1 0 COM PUTER H ARD W ARE AN D SOFTW ARE 1 1 PLAN N I N G 1 1 I M PLEM EN TATI ON OF W ORK PROCESSES 1 1 ASSESSM EN T AN D RESPON SE 1 2 QUALI TY I M PROVEM EN T 1 2 Aerial phot o on cover by Piet er de Vries Phot ography. All ot her phot os by NI OZ. 1 I N TROD UCTI ON The NI OZ Ballast Wat er Treat m ent Syst em ( BWTS) t est facilit y is part of t he depart m ent of Biological Oceanography of t he Royal Net herlands I nst it ut e for Sea Research ( NI OZ) . NI OZ is an inst it ut e liaised t o t he Net herlands Organizat ion for Scient ific Research ( NWO) . The m ission of NI OZ is t o gain and com m unicat e scient ific knowledge on coast al seas and oceans for a bet t er underst anding of t he syst em and sust ainabilit y of our planet , t o m anage t he nat ional facilit ies for sea research and t o support research and educat ion in t he Net herlands and in Europe. NI OZ is an independent academ ic research inst it ut e part icipat ing in num erous int ernat ional research proj ect s in coast al seas and t he oceans. I n addit ion, t im e series of physical, chem ical and biological dat a from t he Wadden Sea area are m aint ained in order t o st udy long- t erm changes in t he ecology of t his UNESCO World herit age sit e. I n t his cont ext t he research on t he efficacy of Ballast Wat er Treat m ent Syst em s ( BWTSs) and relat ed environm ent al quest ions fit s wit hin t he NI OZ work field. NI OZ cont inues t o build on it s years of experience: since 2007 NI OZ has t est ed nine BWTSs ( Table 1) . Table 1. Ballast Wat er Treat m ent Syst em s t est ed at NI OZ. Ye a r Com pa n y Syst e m 2007 Ham ann SEDNA 2008 EcoChlor EcoChlor 2008 Hyde Marine Hyde Guardian 2009 Mahle Ocean Prot ect ion Syst em 2009 Severn Trent De Nora BalPure STDN 2010 Aquaworx AquaTricom b 2010 Erm a- First ESK SA Erm aFirst 2011 Ham wort hy/ Wärt silä Aquarius- EC 2012 Ham wort hy/ Wärt silä Aquarius- UV NI OZ works const ant ly on im proving it s m et hods and t echnologies for t he accurat e and precise enum erat ion of aquat ic organism s and t he m easurem ent of t heir vit alit y and viabilit y. These m et hods are com pared wit h ot her organisat ions and t est facilit ies in workshops and wit hin t he global net work of BWTS t est sit es GloBal Test Net , of which NI OZ is a m em ber. On a European level NI OZ is t he lead beneficiary of t he Nort h Sea Ballast Wat er Opport unit y proj ect . I t is policy of t he inst it ut e t o com m unicat e scient ific result s as m uch as possible t hrough int ernat ional peer reviewed publicat ions. The NI OZ BWTS t est facilit y not only perform s land- based G8 or G9 t est s. I t is also equipped for laborat ory t est s t o invest igat e t he principles and efficiency of new t echnologies as well as for bench- scale t est s t o exam ine prot ot ypes and com ponent s of BWTSs. I n addit ion, t he t est facilit y is able t o analyse and evaluat e sam ples from ot her t est facilit ies, from ship- board t est s and ot her ballast wat er relat ed act ivit ies. This evaluat ion m ay range from com pliance checking wit h I MO st andards t o advanced st at ist ical analyses. I n co- operat ion wit h I MARES ( Den Helder, The Net herlands) and Go- Consult it also offers a one- st op shop for com plet e G8 or G9 t ype approval, including t oxicit y t est ing, ship- board t est s and dossier form at ion. I n all act ivit ies t he NI OZ t est facilit y st rives t o achieve highly accurat e and precise result s. This Qualit y Managem ent Plan ( QMP) describes t he organisat ion of t he NI OZ qualit y syst em . This consist s of t he qualit y syst em m anagem ent and organisat ion, t he qualit y syst em com ponent s, personnel qualificat ions and t raining, procurem ent of it em s and act ivit ies, docum ent s and records, com put er hardware and soft ware, planning, im plem ent at ion of work processes, assessm ent and response and, finally, qualit y im provem ent . 7 NI OZ Ballast Wat er Report 2012- 9 2 QUALI TY SYSTEM M AN AGEM EN T AN D ORGAN I SATI ON The qualit y syst em of t he NI OZ is devot ed t o t he reliable t est ing of BWT syst em s. This m eans t hat accurat e and precise m easurem ent s of t he t est ballast wat er and t he t reat ed wat er, including t he experim ent al cont rol wat er, need t o be assured. Openness of experim ent al and m easurem ent pr ot ocols, qualit y cont rol, dat a and dat a analysis should lead t o a high fidelit y in t he conclusions reached during G8/ 9 t est s of BWTS perform ance and ot her relevant research act ivit ies. NI OZ is an I MO recognised t est inst it ut e and is cert ified by Lloyd’s Regist er. The proj ect leader of ballast wat er research is dr. Louis Peperzak. He is responsible for t he proper funct ioning of t he t est facilit y and for carrying out BWTS t est s, laborat ory analyses, product ion of St andard Operat ing Procedures ( SOPs) , new m et hods in ballast wat er research ( t reat m ent , enum erat ion, vit alit y/ viabilit y m easurem ent s, com pliance m onit oring) and t he support of all st udent s t hat are involved in t his research. I n cooperat ion wit h m em bers of t he ballast wat er t eam he analyses t he BWTSs t est result s and writ es t he G8/ G9 report s as first aut hor. Co- proj ect leader is dr. Jan Boon. He m anages t he overall Ballast Wat er Proj ect at NI OZ, especially in relat ion t o t he Nort h Sea Ballast Wat er Opport unit y ( NSBWO) proj ect of t he European Union of which t he NI OZ is t he lead beneficiary. He is also responsible for t he ext ernal relat ions of t he Ballast Wat er proj ect . Because of his experience in chem ical qualit y assurance program s, Dr. Boon also act s as t he qualit y m anager. He is responsible for t he QMP and will evaluat e all QA/ QC act ivit ies of BWTS t est s. He is co- aut hor of t he G8/ G9 report s. Bot h proj ect leaders are assist ed by Mrs. Dört e Poszig M.Sc. ( general m anagem ent ) , Mr. Marcel van der Linden ( financial m anagem ent ) and Mrs. Marieke Holt huizen- Vloem ans ( ext ernal com m unicat ion) . Sam pling, sam ple analyses and first dat a analyses are carried out by Mrs. Josj e Snoek, Mrs. Eveline Garrit sen, Mrs. Eva I m m ler, Mr. Dennis Mosk and Mr. Alex Blin. Mrs. Eva I m m ler is responsible for t he correct operat ion of t he first NI OZ t est inst allat ion on t he Pelagia quay and for correct sam pling, sam ple handling and st orage. Mr. Dennis Mosk is responsible for t he correct operat ion of t he NI OZ t est inst allat ion on t he Navicula quay and for correct sam pling, sam ple handling and st orage. The operat ion and m aint enance of bot h NI OZ t est inst allat ions is cont ract ed t o Mr. A. Sm it of Sm it t ech ( Den Hoorn, The Net herlands) and Mr. J. Wit t e ( Wit t e Klusbedrij f, Den Burg, The Net herlands) The NI OZ ballast wat er t eam advisory com m it t ee consist s of prof. Dr. Hein de Baar ( chem ist ry) , Dr. J. van Bleij swij ck ( m olecular biology) , Dr. Corina Brussaard ( m icrobial ecology) and Dr. Klaas Tim m erm ans ( head of t he depart m ent of Biological Oceanography at NI OZ) . The Qualit y Managem ent Plan ( QMP) and Qualit y Assurance Proj ect Plan ( QAPP) will be reviewed annually by an ext ernal independent consult ant . I n 2012 t his was perform ed by dr. S. Kools of Gront m ij ( The Net herlands) . I n addit ion, by request of t he BSH a review on QA/ QC aspect s was perform ed by dr. A. Cangelosi of GSI ( USA) . Com m ent s of bot h part ies have been used in t he present proj ect plan t hat includes bot h QMP and QAPP. 8 NI OZ Ballast Wat er Report 2012- 9 3 QUALI TY SYSTEM COM PON EN TS The qualit y syst em of t he NI OZ BWTS t est facilit y cont ains several com ponent s of which t his QMP is t he m ain docum ent . The QMP is t he j oint responsibilit y of bot h proj ect leaders of t he NI OZ Ballast Wat er Proj ect . The QMP form s t he basis of t he proj ect ’s qualit y assurance and qualit y cont rol ( QA/ QC) . The Qualit y Assurance Proj ect Plan ( QAPP) is t he proj ect - specific t echnical docum ent reflect ing t he specifics of t he NI OZ t est facilit y, t he BWTS t est ed, and ot her condit ions affect ing t he act ual design and im plem ent at ion of t he required experim ent s. The QAPP consist s of general inform at ion, specific inform at ion of t he t est facilit y and t he BWTS t est ed, t est wat er qualit y, sam pling and sam ple st oring, t he m easurem ent of I MO- required variables and a general out line of t he QA/ QC. Variable specific QA/ QC m easures are cont ained in each individual SOP, t hat t oget her form sect ion t hree of t he QAPP. Not ebooks are used t o record dat a, observat ions and deviat ions from SOPs, t hat are m ade during BWTS t est s as well as during laborat ory analyses. All not ebooks are st ored in t he NI OZ Ballast Wat er archive. I n a num ber of cases, such as in m onit oring NI OZ harbour t est wat er t em perat ure and salinit y, and in t he in- line m easurem ent of t urbidit y and salinit y of t est wat er at int ake, dat a loggers are used t o st ore inform at ion elect ronically. All digit al inform at ion is st ored on a dedicat ed server t hat is accessible t o Ballast Wat er proj ect personnel only. Specific form s are used t o record dat a during specific rout ine m onit oring act ivit ies. These act ivit ies include m onit oring of m et eorological and environm ent al dat a and equipm ent funct ioning during BWTS t est s, as well as t he ident ificat ion and enum erat ion of > 50 µ organism s. All form s are st ored on paper in t he NI OZ Ballast Wat er archive or in elect ronic form at on t he Ballast Wat er proj ect server. Specific form s for sam ple cust ody are also used in case of t he analyses of pat hogenic bact eria or specific chem ical ( t oxicological) analyses, which are carried out in t hird part ies com m ercial laborat ories. St andard Operat ing Procedures or SOPs are available for each I MO variable t hat t he t est facilit y is obliged t o m easure. For abiot ic variables t he analysis m et hods st em from decades of NI OZ experience as an oceanographic inst it ut e. New m et hods, in part icular t hose for biological variables, are or will be published in int ernat ional peer- reviewed scient ific j ournals. I n addit ion, SOPs are present for specific act ions during t he BWTS t est ing such as for adj ust ing t he salinit y of t he t est wat er, flow cyt om et er dat a analysis or t he cleaning of ballast wat er t anks. SOPs are num bered by year and version. Paper copies are kept in t he NI OZ t est facilit y archive. Elect ronic copies are st ored on a dedicat ed server t hat is accessible t o Ballast Wat er proj ect personnel only. SOPs will be crit ically reviewed during t he operat ion of t he t est facilit y as well in general annual reviews by t he qualit y m anager. SOPs relevant t o t he QAPP can be found in sect ion 3 of t his proj ect plan. The t est prot ocol ( QAPP, QMP and SOPs) are subm it t ed before t he st art of t he BWTS t est s t o t he class societ ies t hat were designat ed by t he nat ional aut horit ies. These are t he BSH ( Bundesam t fuer Seeschifffahrt und Hydrographie or Federal Marit im e and Hydrographical Agency, Ham burg) for Germ any and Lloyds Regist er ( London, Rot t erdam ) for The Net herlands ( I nspect ie Leefom geving en Transport , I LT) , Unit ed Kingdom ( Marit im e and Coast guard Agency, MCA) and Greece. The BSH and LR are not ified in advance of t he BWTS t est dat es including t he days of int ake and discharge, and are invit ed t o wit ness all t est relat ed act ivit ies at t he NI OZ t est facilit y. I n 2012 addit ional oral present at ions on BWTS t est ing at NI OZ were given t o t he Dut ch I MO represent at ive and I LT, t he BSH and t o Lloyds Regist er. 9 NI OZ Ballast Wat er Report 2012- 9 4 PERSON N EL QUALI FI CATI ON S AN D TRAI N I N G All research personnel of t he NI OZ t est facilit y are act ively involved in t he developm ent of SOPs and t he QA/ QC m easures wit hin t hese SOPs. The qualit y m anager is responsible for t he QA/ QC in each SOP and he checks t he proper execut ion of QA/ QC during BWTS t est ing and t he analysis of sam ples and dat a. The qualit y m anager will report t he acquired QA/ QC inform at ion t o t he proj ect leader of ballast wat er research who will, if necessary, inst ruct t he personnel t o adj ust QA/ QC m easures. The qualit y m anager will also use t his inform at ion in his evaluat ion of t he BWTS t est result s. All research personnel of t he NI OZ t est facilit y is t rained in such a way t hat at least t wo st aff m em bers are able t o perform a specific sam pling or analysis. This should prevent personal bias in sam ple and dat a analysis. I n addit ion, t his procedure ensures t hat in case of unexpect ed absence sam pling or sam ple analysis can st ill be carried out by t rained personnel. I n case of non- aut om at ed sam ple analysis, t he m icroscopic ident ificat ion and enum erat ion of plankt onic organism s t he research personnel is t rained in groups of t hree. At t he beginning of each year NI OZ t est wat er is analysed by all t hree st aff unt il t he difference in individual plankt on concent rat ions is < 10% . Furt herm ore, in t he case of > 50 µm organism s, t he correct execut ion of sam ple and analysis procedures and ident ificat ion and enum erat ion of t he organism s is audit ed by annually by an ext ernal independent consult ant . I n 2012 t his was perform ed by Mr. F. Fuhr of KiTe Aquat ic Resources Consult ing ( The Net herlands) . Addit ional t raining of st aff m em bers t akes place on- t he- j ob during int er- com parison workshops of t he ballast wat er t est t eam in cooperat ion wit h t he plankt onlab of t he depart m ent of biological oceanography of NI OZ. One such workshop was t he com parison of flow cyt om et ers held in January 2012. Furt herm ore, a st at ist ics course is planned for aut um n- wint er 2012. 5 PROCUREM EN T OF I TEM S AN D ACTI VI TI ES The BWTS t est facilit y is part of t he NI OZ research inst it ut e and is required t o use t he NI OZ facilit ies for procuring it em s and services t hat include all sam pling and laborat ory equipm ent and chem icals. The financial m anagem ent assist ant t o t he t est facilit y ensures t hat all procedures are as required by int ernal NI OZ rules and by Dut ch law. Mat erial and equipm ent for t he t est inst allat ions is procured by Mr. A. Sm it of Sm it t ech ( Den Hoorn, The Net herlands) . I n all cases of procurem ent t he qualit y, cost s and supplier reput at ion are evaluat ed by research st aff or Mr. A. Sm it in collaborat ion wit h t he proj ect leader of Ballast Wat er research or, in his absence, t he qualit y m anager. 6 D OCUM EN TS AN D RECORD S Docum ent s relat ed t o t he NI OZ t est facilit y and BWTS t est ing include: legal and financial cont ract s, BWTS- specific proj ect plans ( including QAPP, QMP, SOPs) , Nort h Sea Ballast Wat er Opport unit y ( NSBWO) docum ent s, not ebooks, dat a and cust ody form s, st udent report s, int ernal report s on for inst ance int er- com parison workshops and scient ific publicat ions. Legal and financial cont ract s are archived as required by NI OZ under t he responsibilit y of t he financial m anagem ent assist ant and t he overall proj ect m anager. Nort h Sea Ballast Wat er Opport unit y ( NSBWO) docum ent s are m aint ained by t he general and financial m anagem ent assist ant s or by t he proj ect leaders. Not ebooks, dat a and cust ody form s will be archived for at least five years by t he proj ect leader of ballast wat er research. BWTS- specific 10 NI OZ Ballast Wat er Report 2012- 9 proj ect plans ( including QAPP, QMP, SOPs) , st udent report s, int ernal report s and scient ific publicat ions are also archived by t he proj ect leader of ballast wat er research. Report s on new t echnologies as well as for bench- scale t est s t o exam ine prot ot ypes and com ponent s of BWTSs are num bered sequent ially as “ NI OZ Ballast Wat er Report yyyy1,2,..” . The generic BWTS- specific proj ect plan ( including QAPP, QMP, SOPs) as well as t he G8 and G9 report s will also be num bered sequent ially as NI OZ Ballast Wat er Report s. These docum ent s will be m ade publically available on t he NI OZ web sit e. 7 COM PUTER H ARD W ARE AN D SOFTW ARE The com put er hardware t hat is used in t he NI OZ t est facilit y consist s of lap t ops and personal com put ers t hat use Windows™ based soft ware. Bot h hard- and soft ware are m aint ained by t he NI OZ “ I nform at ion and Present at ion Cent re” ( I PC) . I PC is also responsible for t he securit y of dat a and ot her inform at ion, for inst ance by up- t o- dat e virus prot ect ion and daily back- ups. The NI OZ net work can only be accessed by aut horised personnel and st udent s. I n addit ion, all BWTS t est dat a are st ored on a dedicat ed net work- share t hat is accessible only t o aut horised ballast wat er t eam m em bers. This aut horisat ion needs t o be grant ed by bot h I PC and one of t he proj ect leaders of t he ballast wat er proj ect . All soft ware used by t he NI OZ t est facilit y, including Microsoft Office and dedicat ed soft ware for dat a analysis, is legally obt ained. 8 PLAN N I N G Manufact urers of BWTSs t hat approach t he NI OZ facilit y for t est ing of t heir equipm ent should be aware of several planning crit eria. First of all, because NI OZ uses nat ural t est wat er spring and sum m er are t he only periods of t he year in which proper t est ing according t o I MO regulat ions and NI OZ qualit y obj ect ives can be perform ed. Second, as part of a research inst it ut e it is of int erest t o t he facilit y t hat t he BWTS t o be t est ed is of a different design as previously t est ed BWTSs. The t wo proj ect leaders of t he t est facilit y j oint ly decide on t he adm ission of a BWTS for land- based t est ing. I n case of request s for com bined land- based and ship- board t est s t he adm ission will be discussed wit h t he NI OZ part ners I MARES and GoConsult . Cont ract s on behalf of t he NI OZ will be signed by one of t he NI OZ direct ors. The provisional proj ect plan and planning for t est ing t he BWTS is m ade by t he proj ect leader of ballast wat er research. Next , t he provisional proj ect plan and planning is discussed in t he ballast wat er t eam where all pract ical issues including t hose relat ed t o qualit y m anagem ent will be dealt wit h. 9 I M PLEM EN TATI ON OF W ORK PROCESSES Qualit y m anagem ent obj ect ives as specified in t his QMP and in t he QAPP and SOPs will be im plem ent ed in t he work process. At t he lowest level, individual m em bers of t he facilit y’s t est t eam are responsible for carrying out qualit y checks as det ailed in SOPs on a daily basis. The qualit y m anager is responsible for supervising QA/ QC act ivit ies during all t est and laborat ory act ivit ies. The qualit y m anager will give his feedback during each t eam m eet ing, t hat is scheduled at least bi- weekly during BWTS t est s. On advice of t he qualit y m anager, t he proj ect leader of ballast wat er research gives perm ission in cases t hat qualit y docum ent s need t o be revised or new ones have t o be m ade. 11 NI OZ Ballast Wat er Report 2012- 9 10 ASSESSM EN T AN D RESPON SE During BWTS t est s inspect ions m ay be m ade by inspect ors of Lloyds Regist er or t he BSH depending on t he nat ional aut horit y t hat will apply for t ype approval at I MO. All ballast wat er t eam m em bers are obliged t o report deviat ions from qualit y st andards or procedures t o t he qualit y m anager. At t he end of each BWTS t est t he qualit y m anager will report on all deviat ions from t he QAPP or from QA/ QC m easures in SOPs. The qualit y m anager also checks t he BWTS t est dat a t hat are com piled by t he proj ect leader of ballast wat er research. The proj ect leader of ballast wat er research will report any deviat ions in harbour t est wat er m onit oring dat a and int ake t est wat er dat a from t he QAPP. 11 QUALI TY I M PROVEM EN T All t eam m em bers are m ot ivat ed t o enhance specific QA/ QC m easures and m et hods. Regular feedback bet ween t eam m em bers and t he qualit y m anager will enhance self- im provem ent . I n addit ion, t he NI OZ qualit y obj ect ives are subm it t ed t o independent ext ernal review. NI OZ t est facilit y m et hods are com pared and discussed in NSBWO workshops wit h ot her t est facilit ies and expert s in t he field of ballast wat er research. Proficiency t est s for t he enum erat ion of aquat ic organism s will im prove t he qualit y of analyses and will enhance t he com parison of result s bet ween t est facilit ies. The NI OZ t est facilit y invit es com m ent s t o im prove t he qualit y of it s t est and it s t est dat a, for inst ance from class societ ies and t hrough it s m em bership of Global Test net . 12 NI OZ Ballast Wat er Report 2012- 9 CATHELCO BWMS NIOZ QUALITY MANAGEMENT PLAN END PAGE Revision 01 00 Revision 01 10/10/2013 Date 13/09/13 13/09/13 Description Revision Initial Issue Cathelco Marine House, Dunston Road Chesterfield, Derbyshire ENGLAND S41 8NY Author PH PH Checked RF Approved MD Page 16 of 16