1
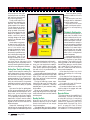
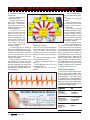
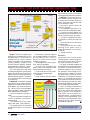
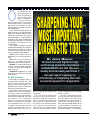
O
ne characteristic of a
great automotive technician is the ability to
perform efficient and
effective diagnostics.
These techs seem to
know what they need to know and the
tools and tests to get it. Of course, this is
partly due to an accumulation of meaningful experience—experience based on
real understanding.
One of the skills that distinguishes an
expert is a knack for finding the relevant
details of his diagnostic experiences and
making the “connections” and “putting
the pieces together.” These abilities are
what lead to an in-depth understanding
of automotive systems and to “meaningful experience.” Can we do this for ourselves? Certainly.
In this article, I’m going to present a
fundamental framework for the basis of
the behaviors that I believe will lead us
to become diagnostically the best we
can be. It’s based on these elements:
Goal: Become the best I can be diagnostically (in the shortest amount of
time).
How: Learn to “put the pieces together” so I can develop an in-depth
understanding of automotive systems.
Mindset: I’m not going to spend my
career as a go/no-go gauge dependent
on others. I’m going to be a diagnostic
learning machine.
Perspective: Diagnostics is not just
about the fix; it’s about the fix through
understanding.
The Tools for Success
To accomplish our diagnostic tasks, it’s
important to have the right tools. They
are the interface between us and our
ability to put the pieces together. The
diagnostic tools on the top of the list are
the scan tool and the lab scope.
What makes these tools particularly
valuable is that, when used together,
they give a unique and complementary perspective of any automotive system that’s being diagnosed, right from
the system’s core information
pipeline—from the nuts & bolts that
make up the mechanics of the system
to the strategies that run it. In Fig. 1
on page 36, we can see how the scan
tool and oscilloscope allow us to understand the functions of the PCM,
34
May 2013
SHARPENING YOUR
MOST IMPORTANT
DIAGNOSTIC TOOL
BY JORGE MENCHU
The scan tool and digital storage
oscilloscope should be considered
indispensable tools. But they can
quickly become nearly worthless if
the user doesn’t develop an
effective way of integrating them into
an overall approach to diagnostics.
the circuit wiring and related circuit
components.
Scan Tool. We’re all familiar with
the scan tool’s text, discrete values format and the smarts that come with using it. It’s a powerful tap into the brain
at the center of the automotive system, giving us the software’s perspective. In general, the scan tool is certainly strong on the system strategy
side and relatively weaker when it
comes to the details of the mechanical
side of the system.
Lab Scope. A lab scope taps directly
into the information and energy pipelines of the system—the circuits. A key
characteristic is the extreme detail offered by the line drawing format, in
which even the smallest changes can be
crucial information. The result is a detailed insight into the technology’s perspective of the system. The lab scope is
Photoillustration: Harold A. Perry; images: Thinkstock
very strong on the technology side and
relatively weaker on the strategy side.
When we combine the characteristics
of the scan tool and the lab scope, we
discover three applicable values: They
provide different perspectives of the
same problem, they complement each
other’s weakness and each tool extends
into depths of the system where the
other does not.
For diagnosis, the scan tool typically
is connected to a vehicle before the lab
scope, and the scope is used to complement the scan data in several ways.
First, it validates the values in the scan
data. The scan tool interprets the information from the PCM; the PCM reports information from the circuit. The
displayed values of either one can be incorrect. The waveform from the scope
can be used to validate the quality and
values of the signal to the PCM.
The lab scope also validates expected
actions. Scan data indicates a command
sent to operate an actuator. Did it actually accomplish this goal?
The second way the lab scope complements the scan tool is by pinpointing
a problem in a circuit. While the scan
tool’s code points to a problem in a circuit, the scope’s waveform pinpoints it.
Take, for example, a code for a highside short in an injector circuit. A lab
May 2013
35
SHARPENING YOUR MOST IMPORTANT DIAGNOSTIC TOOL
Getting Your Tools Up & Running
I expect almost everyone reading this
article has access to or owns a scan tool.
But what about a lab scope? It’s been
said that we’re only as good as our
greatest weakness. If you do have both a
scan tool and a lab scope, it would certainly be unfortunate if the greatest
weakness turned out to be the one easiest to overcome: the ability to operate
them.
Here are a few tips for getting started: Set up your workspace so your tools
are accessible and convenient to use. If
they’re not, you’re less likely to get
them out when under time pressure.
This is especially important for laptopbased tools. You don’t want to make a
job more stressful because you haven’t
figured out how to fit the tools into an
active workspace.
Master the “buttonology” ASAP. It’s
hard to focus on a tough job when you’re
trying to figure out what feature you need
36
May 2013
•Next, we gather enough
additional data to fill in the
blanks.
•At some point, we have
enough data to understand
how the system works.
Now let’s focus on some
details, techniques and behaviors for accomplishing
this.
PCM
Circuit
Wiring
Circuit
Components
Mechanics
to access and what button to hit to get it.
Master the features, too. Do you
know your test equipment’s capabilities? The tool is there to give you diagnostic power; make sure you’re getting
the most out of it by understanding its
features and options.
A key to getting over these challenges
is getting your tools out before you need
them. In fact, until you’re comfortable
with them, get them out and use them
every chance you get.
During the learning process, especially with a lab scope, you’ll see mostly
“known-good” waveforms. These are
essential parts of your waveform analysis foundation.
When you go to classes or read a case
study, keep an eye out for the new diagnostic tools and learn how their features
are being used.
Reading the Data
What do we do with the scan and
waveform data once it’s in our heads?
Here’s a brief outline of how we put
the pieces together:
•We gather data, then give it meaning
by relating it to the system and other data.
Thinking In Relationships
Beyond comparing specs to a
spec chart, the value of test
data is determined by our
ability to relate it to what we
want to accomplish. Even advanced waveform analysis is
simply the practice of making
finer and more detailed relationships. So it seems that to
get the most from our diagnostic experiences, it’s advisable to be in a heightened
state of awareness.
A good place to start is to
put the word relationships at
the forefront of your diagnostic thoughts. Then build on this by
training yourself to ask active questions
that will help guide you, such as: What
can I relate this to? How does this relate? Can I relate this to that? Here are
some practical examples:
•How does the current in a circuit
relate to the buildup of a coil’s magnetic field?
•How does the 5-volt frequency signal that’s peaking only to 4.1 volts relate
to the performance of the engine and
the scan data?
•How does this bent VRS sensor
wheel relate to the waveform?
•How does the block learn on a GM
vehicle relate to the oxygen and mass
airflow (MAF) sensors?
Illustrations & waveform: Jorge Menchu
scope pinpoints the exact
components that are failing
and confirms those that are
still functioning properly.
Finally, a lab scope fills in
the blanks not covered by the
scan tool. The PCM monitors
certain aspects of the system.
The lab scope can be configured to monitor almost anything; the detail of the waveform offers insights into the
details of the system. For example, a scan tool reports
charging voltage; a lab scope
zooms in on alternator diode
performance.
Here’s another very powerful way to look at all of this:
The PCM is connected to the
rest of the vehicle only
through the electrical circuits,
as illustrated in Fig. 1. All of
the smarts to operate the system, including the energy and
information, have to go
through the electrical circuits.
Fig. 1
Working without either
tool (scan tool or lab scope) is like
working half-blind, especially when it
comes to learning about the system, as
well as for many diagnostic situations.
Dynamic Picture
To further enhance the capabilities of
relationships, consider live test data
as a dynamic picture of everything
that’s related to it. This is especially
powerful for waveforms, due to the
extreme detail. Check out Figs. 2A, B
and C on page 38. Each of these
items helps to influence the shape of
the waveform or is influenced by it.
SHARPENING YOUR MOST IMPORTANT DIAGNOSTIC TOOL
The waveform dynamically
•What is the pathway for
relates them.
the information/energy/sigHere’s an example of two
nal?
Circuit
of these relationships:
•What is the input and
Circuit
System
Components
Information
The static description in a
output?
manual of a variable relucAnother strategy is to simtance sensor: The waveform
ply observe the processes
PCM/
Mechanics
Strategy
brings it alive through its dethat occur when the system
tailed and dynamic movie of
is in operation.
a running waveform.
This is also an important
Waveform:
System
The mechanics of the
mindset specifically for diagManuals
A Dynamic
Behavior &
Diagrams
Picture &
sensor includes its physical
nosis. For example, a failure in
Environment
Movie
parts and mounting: The
a system means a broken
waveform dynamically repprocess. Diagnosis is finding
resents the integrity of the
where it’s broken. A technique
sensor wheel profile and
for doing this is to follow the
the distance of the pickup
processes of operation.
to the wheel. Change any Fig. 2A
Here’s an example of a noof these variables and the
crank on a simple starter cirThinking In Threads
waveform changes.
cuit, from the “learner’s” perspective:
In these examples, the waveform At this point we’ve collected data and The process of turning the key results in
adds to our understanding of the physi- made relationships. The next step is a running engine. But on the next start,
cal parts and supplements the static de- to think in threads and/or processes, we turn the key and nothing happens. If
scription in the manuals. As a result, we to gather enough pieces to reveal the we’re not familiar with the system, we
not only understand the parts and sequences in which they fit and inter- could literally follow the flow of energy
pieces better but we also learn their act.
by following the wires—starting at the
To help put this mindset into action, battery and every step of the way to the
character and behavior.
When you think of a waveform from ask yourself these questions:
starter, perhaps—a voltage test to see if
•Is what I’m observing an action or a the voltage disappears. At some point,
this perspective, it’s easy to see why it
has become such an important part of reaction?
the broken step in the process will be
•What happened before “this” and revealed—voltage in and no voltage out,
learning, diagnosing and communicating…just as scan data is essential for un- what happens after?
or voltage in and no action out.
•Where does “this” fit in to the
derstanding the strategies and the sysA Full Systems Approach
process?
tem’s perspective.
To this point we’ve discussed the tools
and how they’re used to gather data.
Now, let’s wrap everything up into a “full
systems approach.” The overall concept
of the approach is to take advantage of
the different levels of information and analyze them in the way we naturally learn.
This means following the same steps an
engineer uses to design a system.
Fig. 2B
Variable Reluctance Sensor
Signal
2.7K Ohms
Minimum 2V
Peak-to-Peak
0V
Return
ECM Triggers on Falling Edge of Signal, Corresponding to
Edge of Tooth Moving Away From Sensor Centerline
Fig. 2C
38
May 2013
Engineer
Us
Develop an
overview
of the project.
A target for
our actions.
Define the
functional
building blocks
of the system.
A framework
to work within.
A road map
to guide us.
Get into the
details to
design and
build.
Apply.
SHARPENING YOUR MOST IMPORTANT DIAGNOSTIC TOOL
A/C Switch Indicator
ECM
A/C ECU
A/C
Control Signal
Engine
RPM
Compressor
RPM
Battery
A/C
Compressor
Relay
Belt Lock
Controller
Dual
Pressure
Switch
ECM
Simplified
Circuit
Diagram
Compressor On/Off
Refrigerant
Temperature Sensor
A/C
Compressor
Clutch
Fig. 3
Target. Defining the target means
developing an understanding of how
the system works. This information is
typically found in a service manual’s
“theory of operation” and sometimes in
a training module. It might include
function, operation, behavior, variables,
requirements and conditions. The actual target is to restore proper operation.
This is vital today due to high levels
of networked integration among vehicle
systems. We simply don’t know what to
expect because of shared data among
individual vehicle systems. The question
is, Do we want to learn it the costly way
or the easy way?
Framework. A framework is basically
the mechanics of the system operation.
Ideally, the information is found in a functional diagram, such as the one shown in
Fig. 3 above. It’s like a wiring diagram
without the detail. Ideally, it’s supplied
within a system’s theory of operation.
Functional diagrams typically include:
•The key components involved in the
function of operation, including networked devices.
•The relationships of key components to each other—their placement.
•The operational flow of information
throughout the system—the lines and
arrows.
40
May 2013
Unfortunately, functional diagrams
are not always available. No problem;
you can make your own. In fact, it’s
worth it to reinforce these thought
processes. Here’s how:
1. Bring together the “theory of operation” and a wiring diagram.
2. Pick out the main players of the
system and the main variables (including the networked connections).
3. Draw boxes around the components to construct a logical layout.
4. Label each.
5. Draw arrows to show the relation-
System
Description
Functional
Diagram
Wiring Diagram
Test Point
Test Data
Fig. 4
Target
Framework
ships indicating the flow of information.
And always identify data line connections.
Road Map. The arrows of the functional diagram illustrate the basic flow
of actions and information within the
system. Using the road map will keep
you focused and on track.
Here’s how it goes for using a lab
scope (Fig. 4 below):
1. We understand the theory of operation and know the diagnostic target.
2. Use the functional diagram as a
guide and map for testing based on the
flow of information within the system.
3. Consult the detailed information
of a diagram to identify the exact test
point.
4. Go to the test point on the vehicle
and gather data.
5. Plug the data into your understanding of the system, which is
graphically displayed in the functional diagram.
6. Repeat until done.
Conclusion
Let’s go back to the “turn the key and
nothing happens” example (page 38),
but this time from the point of view of
the “expert” instead of the “learner:”
The expert has already mastered the
understanding of the parts and pieces of
the system. He understands how the
parts work together to carry out the system processes. There’s already a functional layout of the system in his mind.
He doesn’t have to follow the “flow of
information” from the start if he doesn’t
want to. He can literally test any point
in the system and still know where he is
within the system processes. He understands the implication of the test results.
He can quickly isolate the problem.
Most of us already understand the
operation of a basic starter system. If
you do, too, does the above description
apply to you also? If so, perhaps you
know what it is to be an expert (on a
particular system). You also know the
rewards of true understanding, which
are efficiency and effectiveness. It also
means this article is about something
you already do, naturally.
This article can be found online at
www.motormagazine.com.