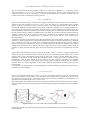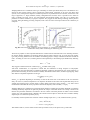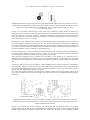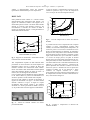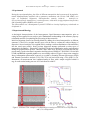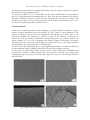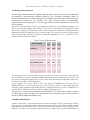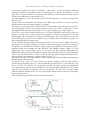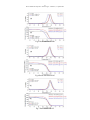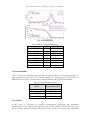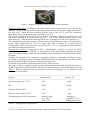
1
Rivista Italiana di Compositi e Nanotecnolgie – Volume 7, n°1 Aprile 2012 Editoriale La crisi economica globale sta influenzando in maniera radicale tutti i principali settori tecnologici. Le nanotecnologie e i materiale compositi, avendo un carattere trasversale risentono anch’essi di un forte rallentamento, non tanto nel comparto della produzione, quanto e soprattutto in quello R/D. Infatti, in periodi in cui a trainare gli andamenti della Società Globalizzata sono gli aspetti di riduzione e di riallocazione dei budget disponibili, il contesto della Ricerca va immediatamente in sofferenza rispetto a quei settori critici, che necessitano comunque per la loro sopravvivenza di fondi, e che rappresentano le soluzioni di breve periodo per uscire dalla crisi. La Ricerca e lo Sviluppo, visti sia in ambito Accademico che Industriale, impongono periodi di lungo respiro ai quali associare risorse economiche di notevole entità e da considerarsi per così dire ‘’a fondo perduto’’, ovvero senza un ritorno produttivo immediato/diretto, ma quale strumento di innovazione tecnologica in grado di sviluppare nel tempo nuove soluzioni che siano aderenti alle richieste dei mercati, e con un’evidente ritorno economico per chi le ha implementate. Soprattutto le nanotecnologie sono un asset particolarmente critico perché ancora non del tutto integrate in Prodotti e Sistemi, e quindi con la necessità di avere tempi e risorse adeguate a un loro inserimento consolidato nel mondo delle tecnologie, inteso quest’ultimo nell’accezione più ampia del termine. La spinta motivazionale dei Ricercatori rimane sempre la stessa, e sarà sicuramente questa la chiave di volta da contrapporsi alle suddette difficoltà economiche che caratterizzano questo periodo. Lo scopo della Rivista è quello di fornire uno strumento divulgativo completo e multidisciplinare che consenta di rispondere in maniera efficiente ed efficace alla domanda del ‘’chi fa cosa’’, così da creare un network conoscitivo e capacito in grado di avvicinare gli operatori del settore. In questo numero i Lettori troveranno una serie di articoli che danno evidenza della forza trainante del settore R/D e della già citata multidisciplinarità sia dei compositi che delle nanotecnologie. Ritornando agli aspetti dell’attuale crisi economica e degli impatti negativi che può avere nel mondo dell’Innovazione, mi piace concludere questo editoriale con una famosa frase di Winston Churchill che sotto riporto: ‘’il pessimista vede pericoli in ogni opportunità, l’ottimista opportunità in ogni pericolo’’ Buona lettura. Prof. Mario Marchetti 1 Rivista Italiana di Compositi e Nanotecnolgie – Volume 7, n°1 Aprile 2012 NANOSTRUCTURED POLIMER COATINGS FOR ELECTRONIC CIRCUIT PROTECTION S. Bellucci, F. Micciulla INFN – Laboratori Nazionali di Frascati, Via Enrico Fermi 40, 00044 Frascati, Italy e- mail: [email protected], [email protected] SOMMARIO / ABSTRACT Through the centuries, the history of human civilization is related to development of scientific discoveries into new technologies and materials, and vice versa. Civilization evolved from the Stone Age to Bronze Age, the Iron Age, the Steel Age and to nowadays: the Nano Age. Each age is marked by advent of certain materials. For example the Iron Age brought tools and utensils; the Steel Age gave rails and Industrial Revolution. The Nano Age is a promising a “Novel Age” where different kinds of scientific fields and technologies will contribute, together, to realize high performance materials. It is used to call it as Nanotechnology Age. This term was neologized, for the first time, by Eric Drexler, in 1986: “…a technology at molecular level that can let us set every atom where we want it to be. We called this ability “Nanotechnology”, because it works on nanometric scale, one billionth of meter”. Nanotechnology is a pervasive and enabling technology and promises breakthroughs in different areas, due to this, it is spreading on several fields: medicine, aerospace, electronic, mechanical, manufacturing, biology, materials, information technology, national security and go on. Nanotechnology is the control of matter at the nanoscale and the exploitation of the novel properties and phenomena developed at that scale in the creation of practical materials, devices, and systems. It will have a profound impact on worldwide economy and society in 21st century, comparable to that of semiconductor technology, information technology, or cellular and molecular biology. It is easy to believe that nanotechnology will be the next Industrial Revolution. The discovery of novel materials, processes, and phenomena at the nanoscale and the development of new experimental and theoretical techniques for research provide new opportunities for the development of innovative nanosystems and nanostructured materials. The real hit of Nanotechnology can be found in the study of the matter and wanted modification of properties of materials at the nanoscale, they can be very different from those at a larger scale. Nanomaterials especially biologically based ones, have always been around us, but it has only been in recent years that we have had the tools to identify these materials, to study and characterize them, and to manipulate in a controlled process. Development of new systems of investigation, as electronic microscopes, has helpful on discovering and characterization of nanomaterials. When the dimension of a material is reduced from a large size, the properties remain the same at first, and then small changes occur, until finally when the size drops below 100 nm, dramatic changes in properties can occur. Materials can be nanostructured for new properties and advanced performances. This field is opening new avenues in science and technology. Here we have focused our analysis on a specific class of nano - materials: nanocomposites, for Electromagnetic shielding application. Nanocomposites In the last 70 years the world of macro-composites [1] and the nanocomposites [2], now, rise very much. Different kinds of composites have been designed and employed in wide fields of applications, in these years: Aerospace and Aeronautics Industry, Automotive Industry, Civil Engineering, Electronics, Medical Equipments and Sport tools. As demand for more composite applications increases in the coming years, gaining insight on major market drivers, supply and demand, price movements, market opportunities and competitive forces proves critically important. Composite materials are interesting because they are a multifunctional materials, joining of different phases they generate themselves unique and high performance materials. As simple definition, it is possible to relate to a composite when two or more different materials are combined together to create a superior and unique material. Composite materials are multiphase materials, with high properties. Usually single phases which make up composite material haven’t so high properties or only one of these. It is possible to design a composite material for own properties with precise and specific combination of phases. In lot of cases, it is easy to identify a phase as a matrix, which includes the other phase, and the other one as a filler. It is useful to define a classification of composite materials: - Composites with metal matrix Composites with ceramic matrix Composites with polymeric matrix Each kind of composite has its own properties and field of application. In this chapter, focusing the attention on Polymer composites, it is easy to observed, as they are important commercial materials with applications that include filled elastomers for damping, electrical insulators, thermal conductors and high performance composites for use in aircraft. It is possible to achieve high stiff composite materials but light-weight, for example, with addition of Carbon fiber into the polymer matrix. Polymeric composite materials‘s high performances is a compromise of right equilibrium between the matrix and filler. It is important to achieve a homogenous dispersion of the filler materials inside the 2 Rivista Italiana di Compositi e Nanotecnolgie – Volume 7, n°1 Aprile 2012 polymeric matrix. Phases have to be well homogenized to create composite materials with high and uniform properties. It is necessary to take care on this during the designing procedure of material. In other hands, non uniform dispersion or exceeding amount of filler, into the matrix, can decrease the performances of composite materials. In the last years new hope to obtain high performance composite material is coming to give a new class of composite: the nanocomposite. Nanocomposites are a class of composite where one or more separate phases have one dimension in nano scale. The field of nanocomposites involves the study of multiphase material where at least one of the constituent phases one dimension less than 100nm [3]. Nanostructure materials could be distinguished in three main categories [4, 5]: - Nanoparticles: When the three dimensions of particulates are in the order of nanometers, they are related to equi-axed (isodimensional) nanoparticles or nanogranules or nanocrystals. Example silica. Nanotubes: When two dimensions are in the nanometer scale and the third is larger, forming a lengthened structure, they are normally identified to “nanotubes “or nanofibers / whiskers/ nanorods. Example, carbon nanotubes (CNTs), cellulose whiskers. Nanolayers: The particulates which are characterized by only one dimension in nanometer scale are nanolayers/ nanosheets. It is present in the form of sheets of one to a few nanometer thick to hundreds to thousands nanometers long. Clay (layered silicates), layered double hydroxides (LDHs), Graphene. Fig 1 Various types of nanostructured materials [8]. Nanocomposites improves the good properties of the matrix with the enhanced performance of the nanostructures. The interest on applying nanoscaled fillers into polymer matrices is the attainment of potentially unique properties, as a result of nanometric dimensions. In particular it is possible to achieve high results using a low volume or weight fraction of nanomaterials, comparing to micro fillers. For example, the inclusion of equi – axed nanoparticles in thermoplastics, and in particularly in semi crystalline thermoplastic, increases the yield stress, the tensile strength, and Young’s modulus compare to pure Polymer. A volume fraction of only 0.04%wt mica – type’s silicates in epoxy increase the modulus below the glass transition temperature by 58% and modulus in the rubbery region by 450% [6, 7]. The extreme aspect ratios of the nanofiller, compared to the conventional micro-fillers, lead nanocomposite successful. It is possible to distinguish its effects in six interrelated characteristics on the obtained nanocomposites: (1) low-percolation threshold (~0.1–2 vol. %), (2) particle–particle correlation (orientation and position) arising at low-volume fractions ( ØC < 0.001) (3) Large number density of particles per particle volume (106–108 particles/µm3), (4) extended interfacial area per volume of particles (103–104m2/ml), (5) short distances between particles (10–50nm at Ø ~ 1–8 vol.%), (6) comparable size scales among the inclusion of rigid nanoparticles, the distance between particles, and the relaxation volume of polymer chains [8]. It is good to notice how downscaling the size to the nanoscale, the materials has an interfacial area per volume many times higher than the same one at the microscale. In addition with this aspect, the use of the nanofiller allows one to reduce drastically the amount to add to the polymer: even at low contents of nanofiller (below 5% in weight of the nanofiller against greater than percentages of 15% by weight of classic filler) you can obtain much better performances. So it is an important hit to achieve high performances and low weight, especially, for aerospace or aeronautic applications. This happens substantially because of the "nano-effect" [9], surface effects become important at nanoscale. The interfacial region drives the communication between the nanofiller and polymeric matrix and thus it controls the properties of composite materials. Because of its proximity to the surface of the filler, it shows, conventionally, properties different from the bulk matrix. Locally, it is possible to have different chemistry, curing degree, polymer chains‘s mobility, crystal order‘s degree. It is explained in terms of the radius of gyration of the matrix (R g), which is key spatial parameter to which the majority of the polymers’s static and dynamic properties can be ultimately related 3 Rivista Italiana di Compositi e Nanotecnolgie – Volume 7, n°1 Aprile 2012 and has a value in a few tens of nanometers [8]. So, it exists a strong dependence of interfacial area per volume fraction (µm−1=m2/ml) of filler on the aspect ratio (α) of nanoscale particles with varying shapes. The aspect ratio (α =H/R) is based on approximating particles as cylinders (area/volume = 1/H+1/R). Afterwards, the relative volume fraction of interfacial material to bulk is drastically increased as the size becomes smaller, fig2. Fig 2 Surface area per unit volume vs. particle size [3]. Aspect ratios greater than one correspond to rods (length/diameter) and less than one to plates (height/diameter) [10]. For example, fully exfoliated and dispersed high-aspect ratio plates or rods, such as montmorillonite or Single Wall Carbon NanoTubes(SWCNTs), generate internal interfacial area comparable to that of macromolecular structures, such as dendrimers or proteins, and two to three orders of magnitude more than classic mineral fillers. It’s useful to underline how, the interaction of polymer’s macro molecular with the nanoparticles gives significant opportunity for changing the polymer mobility and relaxation dynamics. For example, polystyrene chains intercalated between the layers of a smectic clay have more mobility locally than in the bulk polymer [11]. This may create an ordering between layers and then it generates formation of low and high density regions with different degree of mobility of polymeric chains, in the low- density regions there are more opportunity for mobility. It is clear, how; the rheological / glass transition temperature of a polymer can be controlled by changing of the polymer mobility with nanocomposites interfaces. The molecular mobility highly depends on the available free volume, which plays an important role in deciding the mechanical properties, diffusion of small molecules through the polymer and so on. The the glass transition temperature (Tg) is the most important thermal transition that a polymer undergoes. At the Tg, the polymer softens due to the onset of long-range coordinated molecular motion accompanied by a change in the free volume properties in the polymer [12]. In other words, It is a temperature range beyond which the polymer becomes soft and leathery. Below Tg, polymer becomes hard and cannot be used under dynamic loading conditions [13]. For example, Tg can be eliminated for clay nanocomposites with intercalated polymer chains. This indicates a limited ability for cooperative chain motion when the polymers are confined between layers, the Tg doesn’t change significantly. If the polymer is tightly bound to the nanofiller, Tg can be increased without help of confinement [14]. Recently, Ana M. Díez-Pascual et al showed, how it is possible to achieve a remarkable increase in the storage and Young’s modulus, Tg and degradation temperatures of the poly (ether ether ketone) (PEEK) matrix with the addition of small amounts of Single Wall Carbon Nanotubes (SWCNTs) wrapped in compatibilizing agents, such as polysulfone, an amorphous thermoplastic miscible with and structurally similar to PEEK [15, 16]. Polysulfone possesses dual affinity with PEEK and the SWCNTs; its phenyl moieties interact with the matrix through p–p stacking as well as with the sp2-bonded hexagonal networks of the nanofillers. Furthermore, chemical interaction of polar segments of the compatibilizer (sulfone, ether, etc.) to surface groups located on the SWCNT structure and defect sites (side-walls or open ends) boosts the compatibilization effect, leading to composites with enhanced nanofiller dispersion and CNTpolymer load transfer; as a result, the mechanical properties of these composites are superior to those containing pristine CNTs. The significant Tg enhancement in the compatibilized systems is attributed to the high Tg of the amorphous polysulfone combined with the strong restrictions on polymer chain motion induced by the improved adhesion between the matrix 4 Rivista Italiana di Compositi e Nanotecnolgie – Volume 7, n°1 Aprile 2012 and nanofiller phases. In contrast, the non-compatiblized samples show a smaller increase, probably due to partial agglomeration of the SWCNTs at the fiber interface. The agglomerates could alter the flow behavior of the matrix during impregnation, resulting in nanometer scale porosities [17]; this leads to an increase in the free volume between the polymer molecules, allowing additional mobility, which may explain their lower Tg[18]. P. Karapappas et al , analyzed, the effect of the addition of four different commercially available nanofillers into a state of the art epoxy based gelcoat. They showed how the inclusion of the nanofillers had no practical impact on Tg, but they found a different improvement of the composite’s properties related to nano inclusions; in fact the addition of CNTs and the exfoliated nanographite lead to an enhancement of all properties, while the addition of nanoclay and nano-titanium dioxide was beneficial only for the tensile and thermal conductivity properties. The presence of the nanofillers brought a lot of improvements in the properties of the gelcoats. The aforementioned improvements include the tensile and fracture properties as well as, the electrical and thermal ones. The presence of the nanofillers also decreased the coefficient of linear thermal expansion and made the nanodoped epoxy gelcoats more resistant to UV degradation. One of the drawbacks of the introduction of the nanofillers into the resin was the increase of viscosity which can be an issue of workable ability of those materials when composite manufacturing is considered. The most common gelcoats are based on epoxy or unsaturated polyester resin chemistry. Gelcoats are modified resins which are applied to moulds in the liquid state. They are cured to form crosslinked polymers and are subsequently backed up with composite polymer matrices, often mixtures of polyester resin and fibreglass or epoxy resin with glass, kevlar and/or carbon fibers. The manufactured component, when sufficiently cured and removed from the mould, presents the gelcoated surface. This is usually pigmented to provide a colored, glossy surface which improves the aesthetic appearance of the component. Gelcoats are designed to be durable, providing resistance to ultraviolet degradation and hydrolysis. Specialized gelcoats can be used to manufacture the moulds which in turn are used to manufacture components. The nanofillers were introduced into the gelcoat in the form of a master batch which was prepared by using a high shear mixing device i.e. a 3-roll mill. [19]. Therefore, it is easy to understand, how through, an appropriate choice of the type of nanoinclusions and of a just combination of them into the polymer matrix and a precise method of dispersion; you can control and transfer the high properties of the nanostructure in the resulting nanocomposite. The key concept of nanocomposites is not only focused on the shape of the particle, but on the engineering and tailoring of the exact nanoparticles’s morphology with specific characteristics to achieve a desired property suite from the resultant composite materials. The incorporation of nanoscale particles into polymer can generally be done in four ways as follows: (a) Solution method: It involves dissolution of polymers in adequate solvent with nanoscale particles and evaporation of solvent or precipitation. (b) Melt mixing: In this method, the polymer is directly melt-mixed with nanoparticles. (c) In-situ polymerization: In this method, the nanoparticles are first dispersed in liquid monomer or monomer solution. Polymerization is performed in presence of nanoscale particles. (d) Template synthesis: This method is completely different from other methods. In this method, using polymers as template, the nanoscale particles are synthesized from precursor solution. Nanocomposites, as these types of materials are often referred to, have received much attention over the past decade as scientists search for ways to enhance the properties of engineering polymers while retaining their processing ease. Unlike traditional filled polymer systems, nanocomposites require relatively low-dispersant loadings (~2 wt. %) to achieve significant property enhancements. Some of these enhancements Include increased Young’s modulus, increase mechanical behavior, increased electrical conductivity, increased gas barrier, increased thermal performance, increased atomic oxygen resistance, resistance to small molecule permeation and improved ablative performance. As a result of these enhancements, nanocomposites have the potential to play a significant role in future space systems, for example, and in many other fields like biology, medicine, electronics, automotive industry and so on. Launch vehicles would greatly benefit from appropriately designed nanocomposites that could provide improved barrier properties and gradient morphologies enabling linerless composite cryogenic fuel tanks. Self-rigidizing, self-passivating nanocomposite materials could be used to construct space vehicle components that are both highly resistant to space-borne particles and resistant to degradation from electromagnetic radiation, while reducing the overall weight of the spacecraft . Current estimates for launching payloads into space orbit stand at $10,000/lb ($22,000/kg) [20]. Significant weight, and hence cost, reductions can be realized with the use of organic materials, but such materials tend to perform very poorly in the harsh space environment. Organic polymers with uniformly dispersed nanoscale inorganic precursors may enable these materials to withstand the harsh space environment and be used as critical weight-reduction materials on current and future space systems [8]. 5 Rivista Italiana di Compositi e Nanotecnolgie – Volume 7, n°1 Aprile 2012 Table 1 Estimation of Worldwide volume and value for polymer–nanocomposites 2003–2008 [21] In this work it will study a nanostructured epoxy materials which were prepared, used as coatings for electrical equipments in order to protect them from electromagnetic interference (EMI) that can occur when the electromagnetic waves of a device interfere with another device, causing an unwanted response. As nanofiller Carbon Nanotubes were used. Electromagnetic Compatibility The rapid increase in the use of telecommunication and digital systems, fast processors, more generally, electronics devices and the introduction of new design practices, Electromagnetic compatibility (EMC) has always became more important and been brought to the forefront of advanced design. In fact, proliferation of electronic equipment and various devices in both industrial and domestic environments has given rise to a great number of sources and receptors of EMI, which increases the potential for interference. According to growth of number of electronic devices, the miniaturization of components in electronic systems increases their susceptibility to interference. Nowadays a large number of the units are smaller and more portable equipments, such as mobile phones and laptop computers, can be used anywhere instead of only in a controlled environment like an office. It is better to notice, how developments in interconnection technology have lowered the threshold for EMI. It’s useful to underline how high-speed digital circuitry generally generates more interference than traditional analog circuitry. This leads to EMI problems. Reducing or eliminating coupling paths by proper layout; shielding, filtering, and grounding practices; Due to these reasons it is to understand how it becomes important to design hardware with an inherent immunity to EMI; and adopting defensive programming practices to develop software that has a high level of immunity to EMI[22]. Reliability and EMC compliance have become important marketing features of electronic equipment in an increasingly competitive industry; electronic discharge has been a major concern due to the destruction of microchips during handling; Electromagnetic discharge (ESD) also poses problems for aircraft and automobiles. It is necessary to ensure security of data has been one of the main driving forces in the growth of the shielding market; people are becoming aware of the potential health risks associated with all types of EMI radiation; military systems involve protection against electromagnetic pulse (EMP) and electronic countermeasures including microwave weapons and stealth technology. Considerations of an array of communications and radars in battle conditions are also important. It is useful to explain what are EMC, EMI and Susceptibility: Electromagnetic compatibility (EMC) is the capability of electrical and electronic systems, equipment, and devices to operate in their intended electromagnetic environment within a defined margin of safety, and at design levels or performance, without suffering or causing unacceptable degradation as a result of EMI. EMC can generally be achieved by suppressing EMI and immunizing susceptibility of the systems and devices. EMC is a field of science and engineering concerned with the design and operation of electrical and electronic systems/devices in a manner that makes them immune to certain amounts of EMI, while at the same time keeping their EMI emissions within specific limits. Electromagnetic interference (EMI) is the process by which disruptive electromagnetic energy is transmitted from one electronic device to another via radiated or conducted paths or both. Suppression is the process of reducing or eliminating EMI energy. It may include shielding and filtering. Susceptibility is a relative measure of a device’s or a system’s propensity to be disrupted or damaged by EMI exposure to an incident field or signal. It indicates the lack of immunity. Immunity is a relative measure of a device’s or system’s ability to withstand EMI exposure while maintaining a predefined performance level. Radiated immunity is a product’s relative ability to withstand electromagnetic energy that arrives via free space propagation. Conducted immunity is a product’s relative ability to withstand electromagnetic energy that penetrates it through external cables, power cords, and input/output (I/O) interconnects. Electromagnetic discharge (ESD) is a transfer of electric charge between bodies of different electrostatic potential in proximity or through direct contact [23]. In general, EMI problems can be caused by electromagnetic energy at any frequency in the spectrum, as shown in Figure 3. 6 Rivista Italiana di Compositi e Nanotecnolgie – Volume 7, n°1 Aprile 2012 Fig3 Electromagnetic spectrum [27]. Most problems are caused by energy in the radio frequency range, which extends from about 100 kHz to 1 GHz. Radio frequency interference (RFI) is a specific form of EMI. Microwave, light, heat, x-rays, and cosmic rays are other specific types of electromagnetic energy. Other common interference includes EMP, which is a kind of broadband; high-intensity short duration burst of electromagnetic energy, such as lightning or nuclear explosion; and electrostatic discharge (ESD), which is a transient phenomenon involving static electricity friction. In these analyses, EMI shielding is an important and effective method in EMC design. Certainly, advanced materials and process technology is the key to achieving successful EMI shielding [24]. EMI can be dominated by radiation or conduction, depending upon the type of coupling or propagation path involved. Usually, conduction always accompanies some radiation, and vice versa. Radiated interference happens when a component predominately emits energy, which is transferred to the receptor through the space. Conducted interference occurs when the source is connected to the receptor by power or signal cables, and the interference is transferred from one unit to the other along the cables or wires. Conducted interference usually affects the main supply to and from the system/device and can be controlled using filters. Either magnetic or electric could be the origin of the EMI. When a circuit with large dV/dt (voltage slew rate) has a significant parasitic capacitance to ground EMI is electrically generated. Magnetically generated EMI appears when a circuit loops with large dI/dt (current slew rate) it has significant mutual coupling to a group of nearby conductors. In addition, there is an important energy exchange between two modes. This effect is known as differential–common mode conversion. Radiated EMI emission starts from an emitting source, propagates via a radiating path, and reaches a susceptible receiver. The strength of the radiated EMI is determined by the source, the media surrounding the source, and the distance between the source and the susceptive element. The space surrounding a source of radiation can be broken into two regions, as shown in figure 4. Close to the source is the near or induction field. At a distance greater than the wavelength (λ) divided by 2π (approximately one sixth of a wavelength) is the far or radiation field. The region around λ/2π is the transition region between the near and far fields. Fig.4 The space surrounding a source of radiation can be divided into two regions, the near field and the far field. The transition from near to far field occurs at a distance of λ/2π [25]. The basic component of EMI is an electromagnetic wave. Any source of the radiated EMI energy generates expanding spherical wave fronts, which travel in all directions from the source. At any point the wave consists of an electric field (E) and a magnetic field (H), which are perpendicular to each other and to the direction of propagation. 7 Rivista Italiana di Compositi e Nanotecnolgie – Volume 7, n°1 Aprile 2012 The ratio of the electric field (E) to the magnetic field (H) is the wave impedance (Z0). In the far field, this ratio equals the characteristic impedance of the medium (e.g., E/H=Z0=377Ω for air or free space). In the near field, the ratio is determined by the characteristics of the source and the distance from the source to where the field is observed. If the source has high current and low voltage (E/H < 377), the near field is predominantly magnetic. Conversely, if the source has low current and high voltage (E/H > 377), the near field is predominantly electric. The source of the radiated interference may be part of the same system as the receptor or a completely electrically isolated unit. If the conducted emissions are reduced, the relative radiated emissions are also often reduced. However, the dominant radiated interference can affect any signal path within and outside the system/device and is much more difficult to shield [25]. Electromagnetic Interference Shielding Properties What is EMI shielding meaning? It means to use a shield (a shaped conducting material) to partially or completely envelop an electronic circuit, that is, an EMI emitter or susceptor. Therefore, it limits the amount of EMI radiation from the external environment that can penetrate the circuit and, conversely, it influences how much EMI energy generated by the circuit can escape into the external environment. So, it is possible to identify two purpose of shied: the first it is to prevent the emissions of the electronics of the product or a portion of those electronics from radiating outside the boundaries of the product, as it shows in Figure 5a); the second it is to prevent radiated emissions external to the product from coupling to the product’s electronics, which may cause interference in the product, as it shows in Figure 5 b). Fig.5 Illustration of the use of a shielded enclosure: (a) to contain radiated emissions and (b) to exclude radiated emissions [26]. The basic requirement of an Electromagnetic (EM) shielding material is that a shield fabricated with this material should meet the EMC aspects of achieving a specified extent of shielding under given EMI environmental. Generally, the choice of EM shielding material is decided by: - Electromagnetic properties of material to provide a given shielding effectiveness (SE); Its compatibility for specific shielding applications vis-a-vis interference due to electric, magnetic, or, electromagnetic (radiated) fields; Geometrical considerations, shape and size; Mechanical considerations such as rigidity, flexibility, weight. Structural mating ( fastening and joints), and withstand ability against shocks and vibration; Performance under hostile thermal environments Bandwidth of operation: it is the effective frequency range with acceptable shielding performance; Ease of fabrication of shields Cost – effectiveness [27]. Reminding that EM energy could be associated with static and/or time-varying electric and magnetic force fields (known as induction fields) in the vicinity of the source; or it could be a radiated field detached from the source, as it shows in figure6, it is easy to understand how suitable materials for EMI shielding mechanism depend on specific and distinct EMI source involved. Several materials could be, and have been, chosen and used for EMI shielding for their own properties: electrical conductivity, magnetic permeability, mainly, with addition of, high mechanical performances, chemical stability, fire retardant, thermal management and geometries [27]. The mechanism of shielding is that the shielding medium(of appropriate material and geometry) when placed in the region of electromagnetic field offer a barrier impedance Zm sufficiently large in comparison to Z0 in case of an electric 8 Rivista Italiana di Compositi e Nanotecnolgie – Volume 7, n°1 Aprile 2012 field dominant ambient so that the waves is impeded sufficiently and shielded off from entering the region beyond the shielding barrier, for magnetic field where value of Ym , barrier admittance, must be higher than value of Y0 (Y0 = 1 / Z0). a) b) Fig.6 a) Electric field dominant ambient ; b) Magnetic field dominant ambient[30] When it wants to design a shield which works in time – varying fields it is important to consider the appropriate choice of material and the geometry to provide the necessary barrier – immittance parameter. Also, it is relevant to underline as shields invariably contain apertures or openings used for access and ventilation, as well as a number of joints and seams for practical manufacturing. Shields for practical equipment also allow attachment to wires or pipes used for signaling and services. All these components constitute breaches of the shield integrity and play a decisive part in the overall performance of the shield [26]. Shielding effectiveness Shielding can be specified in the terms of reduction in magnetic (and electric) field or plane-wave strength caused by shielding. The effectiveness of a shield and its resulting EMI attenuation are based on the frequency, the distance of the shield from the source, the thickness of the shield, and the shield material. For a quantitative description of main aspects of shielding it possible to consider three phenomena as responsible for effective shielding (SE): Conductive Reflection: The time – varying magnetic field component of incident EM waves induce electric current in the shielding material and these currents in turn provide opposing magnetic field ( Faraday – Lenz’s law) minimizing the total field beyond the shield; Magnetic Reflection: when the shielding material has high magnetic permeability, the magnetic flux lines (time – varying or static) are confined as conductive (low reluctant) paths through the shield and do not link to the region being shielded; Conductive Energy Absorption: the energy dissipated into conductive shielding medium manifesting as the field attenuation [27]. Shielding effectiveness is normally expressed in decibels (dB) as a function of the logarithm of the ratio of the incident and exit electric (E), magnetic (H), or plane-wave field intensities (F): SE (dB) = 20 log (E0/E1) SE (dB) = 20 log (H0/H1) SE (dB) = 20 log (F0/F1) With any kind of EMI, there are three mechanisms contributing to the effectiveness of a shield. Part of the incident radiation is reflected from the front surface of the shield, part is absorbed within the shield material, and part is reflected from the shield rear surface to the front where it can aid or hinder the effectiveness of the shield depending on its phase relationship with the incident wave, as shown in figure7. 9 Rivista Italiana di Compositi e Nanotecnolgie – Volume 7, n°1 Aprile 2012 Fig.7 Graphical representation of EMI shielding [24]. Total shielding effectiveness (SE) of a shielding material equals the sum of the absorption factor (A), the reflection factor (R), and the correction factor to account for multiple reflections in thin shields: SE (dB) = R (dB) + A (dB) + B (dB) (1) The higher the SE value in decibel (dB) is, the less the energy passes through the sample. It’s important to notice how the multiple reflection factor B can be neglected if the absorption loss A is greater than 10 dB. In practical calculation, B can also be neglected for electric fields and plane waves. Explaining two main terms of SE: Absorption Loss Absorption losses A are a function of the physical characteristics of the shield and they are independent of the type of source field. When an electromagnetic wave passes through a medium, used as a shield, its amplitude decreases exponentially. This decay is an effect of currents induced in the medium which produce ohmic losses and heating of the material, and E 1 and H1 can be expressed as: E1 = E0 e-t/δ (37); H1 = H0 e-t/δ (2) where t is the thickness of shielding material, expressed in mm, and δ is called as the skin depth, and it is defined as the distance required for the wave to be attenuated to 1/e or 37%. Therefore, the absorption term A is given by: A (dB) = 20 (t/δ) log (e) = 8.69 (t/δ) = 131 t √f μr σr (3) It is better to underline as the absorption term A is the same for all three waves, in fact in its expression it doesn’t appear a particular field (E, H, and F). 10 Rivista Italiana di Compositi e Nanotecnolgie – Volume 7, n°1 Aprile 2012 Fig.8 Skin-depth variation with frequency for copper, aluminum, steel, and stainless steel [24]. In the expression (3), f is frequency in MHz; μr is relative permeability (1 to copper); σr is conductivity relative to copper in IACS (International Annealed Copper Standard) σr = σ /σ0, where σ0 is the conductivity of copper at room temperature (σ0 = 5.80 x 10 -7 Siemens / meter) [26]. The skin depth d can be expressed as: δ = 1 / (√πfμrσr) (4) The absorption loss of one skin depth in a shield is approximately 9 dB. Skin effect becomes relevant at low frequencies, where usually magnetic field has predominant effects with lower wave impedance than 377 W. Figure 11 shows the skin depth variation with frequency for copper, aluminum, steel, and stainless steel. Copper and aluminum have over five times the conductivity of steel, so are very good at stopping electric fields, but, they have a relative permeability of 1 (the same as air). Typical mild steel has a relative permeability of around 300 at low frequencies, falling to one as frequencies increase above 100 kHz, and its Higher permeability gives it a reduced skin depth, making a reasonable thickness of mild steel better than aluminum for shielding low frequencies. Different grades of steel (especially stainless) have different conductivity and permeability, and their skin depth varies considerably as a result. Summarizing, it is possible to conclude a good material for a shield will have high conductivity and high permeability, and sufficient thickness to achieve the required number of skin depths at the lowest frequency of concern [24], from the absorption loss point of view. Reflection Loss The reflection loss, R at the interface between two media is related to the difference in characteristic impedances between the media, in other words, relative mismatch between the incident wave and the surface impedance of the shield, as shown in figure9. Fig.9 An incident wave is partially reflected from, and partially transmitted through, an interface between two media. The transmitted wave is E1 and the reflected wave is E r [25]. 11 Rivista Italiana di Compositi e Nanotecnolgie – Volume 7, n°1 Aprile 2012 The computation of reflection losses can be greatly simplified by considering shielding effectiveness for incident electric fields as a separate problem from that of electric, magnetic, or plane waves. The equations for the three principal fields are given by [24, 25] : RE= 321.8 + 10log (σr/ (f3r2μr=0)) (5a) RH = 14.6 + 10log ( fr2 σr/ μr=0) (5b) Rp = 168 - 10log (fμr=0/σr) (5c) where RE, RH, and RP are the reflection losses for the electric, magnetic, and plane wave fields, respectively, expressed in dB; σr is the relative conductivity referred to copper; f is the frequency in Hz; μr=0 is the relative permeability referred to free space; and r is the distance from the source to the shielding in m. Multiple Reflection Correction Factor The factor B can be mathematically positive or negative (in practice it is always negative), and becomes insignificant when the absorption loss A > 6 dB. It is usually only important when metals are thin and at low frequencies (i.e., below approximately 20 kHz). The formulation of factor B can be expressed as [24, 28]: B (dB)= 20 log │1 – [ (K-1)/ (K+1)] (10 -A/10) (e -i227A)│ (6) where A is the absorption loss (dB); K = ZS/ZH = 1.3(μ/fr2s)1/2 (7) Zs is the shield impedance; and ZH is the impedance of the incident magnetic field. When ZH << ZS, the multiple reflection factor for magnetic fields in a shield of t and skin depth δ can be simplified as B = 20log (1- e -2t/δ) (8) The total shielding effectiveness for electric, magnetic, and plane wave fields can be obtained by Equation (1) with a combination of the related equations of absorption and reflection losses, as well as correction factor B. At low frequencies, the absorption losses are low and rise gradually to high levels at high frequencies. Increasing the thickness of the shield or by using a metal with high permeability, it is possible to improve the absorption performance. But metals with high permeability exhibit low electrical conductivity, usually. So in that case it is better to use only magnetic materials which effectively shield against magnetic fields at low frequencies. If magnetic shielding is required, particularly at frequencies below 14 kHz, it is customary to neglect all terms in Equation (1) except the absorption term A. Conversely, if only electric field or plane-wave protection is required, reflection (R) is an important factor to consider in the design. When frequency is around 1 GHz, the value of reflection losses is nothing and the total shield effectiveness of the material in all three fields tends to be the same. Moreover, higher electrically conductive materials (like copper) seem to give a better electrical and magnetic shielding, at higher frequencies, where both reflection and absorption losses increase. Summarizing, the amount of reflection loss depends on the impedance of the EM wave and the shield. When an EM wave encounters a shield, if the wave’s impedance differs significantly from that of the shield, the wave is partially reflected back. Conversely, if the wave’s and the shield’s impedance are closely matched, the EMI energy will pass through the shield with minimal reflection. Reminding that when we said before an electrically dominant wave (E-field) in the near field has high impedance (Z0 > 377 Ω). Higher conductive metals have low impedance and, therefore, are successful at reflecting back electrically dominant waves because of the impedance mismatch. Reflection of EMI is the primary shielding mechanism for electrically dominant waves. Magnetically dominant waves (H-fields), on the other hand, have low impedance (Z0 <377 Ω). With these waves, absorption plays an important role in shielding. Magnetic waves are more difficult to shield; however, their energy generally diminishes as the distance from the source increases. Over greater distances (far field), the electric field component dominates the wave, and it is this electrical component that must be dealt with through EMI shielding. On the amount of the absorbed wave’s energy from shielding material, its relative thickness plays an important role. However, thickness has little effect on the amount of the wave’s energy that is reflected. Both the absorption and 12 Rivista Italiana di Compositi e Nanotecnolgie – Volume 7, n°1 Aprile 2012 reflection of EMI are important considerations in selection of a shielding method. Attenuation or reduction of E-fields can be handled effectively by metal sheet, foil, and metal coatings since Reflection loss is very large relative to absorption loss. Primary reflection occurs at the front surface of the shield, so that very thin sections of conductive material provide good reflection properties. Moreover, multilayer shields provide increased reflection loss due to the additional reflecting surfaces. Conversely, where absorption plays a key role in attenuation, strong magnetic fields are better handled by thick magnetic materials or thick-skin shields, such as those provided by conductive paints (GE Plastics, n.d.)[24]. Epoxy Nanocomposite based on Carbon Nanotubes for EMI shielding The conventional EMI shielding materials include applying metal-based shielding materials, but metal is heavy and tendency to corrode. The conducting plastics and coatings are good potential EMI shielding materials. There are two types of conductive coatings: intrinsic conductive polymer and composite conductive coating. The intrinsic conductive polymers include polyaniline, polypyrrole and polypydine. Their poor processing ability and chemical toxicity limit their applications. The composite conductive coatings consist of electromagnetic absorbents (EMA) and coating matrix. Typical EMI absorbents, such as ferromagnetic metal oxides, carbon clusters, silicon carbide like materials, are widely applied to EMI shielding coating. However, there are still numerous drawbacks, such as oxidation and corrosion of metal like absorbents, inadequate conductive of carbon like absorbents, inferior dispersing power and bonding strength with coatings, narrow frequency range shielding, thick and heavy coating layer, etc[29]. In recent years, as EM shielding, Conductive Polymeric composites filled with carbon fibers have been used. They have many advantages because they combine their good mechanical, chemical stability properties of matrix, to significant reinforcing effects of fillers. Their low density which makes them suitable for light-weight shielding materials, and their ease of forming by extrusion or injection molding, which makes them suitable for being processed in batches. These materials could have a wide range of applications in military, industrial and commercial fields. For example, they can be used as casings for computers and television sets to shield electromagnetic waves and thus make them work safely. However, an obvious weakness of the shielding materials filled with carbon fibers is that the conductivity of carbon fibers is much lower than the metal [28], so a greater volume fraction of carbon fibers is needed in order to provide the same shielding effect. So, according to decrease the amount of carbon fibers content and still retain a good shielding effect, a layer of metal is usually plated on the surface of fibers. Nickel and copper are the two main metals used as coatings. Nickel is generally preferred because of its stability and because of the readiness with which copper is oxidized [30,31]. With the recent improvements in nanotechnology, it is expected to exploit the promising nanomaterials [32,33] to overcome the above drawbacks and to develop EMI shielding coating with high shielding efficiency, broad band frequency, light and thin coating layer, and chemical stability as well as user friendliness[29]. The nanoscale design and engineering of multifunctional materials and devices based on a new type of carbon composites: Carbon Nanotubes composites. They have moved from a large numbers of science-based activities a thriving, to a remarkable numbers of industrial products. A large part of these research activities it has focus on studies of multifunctional composites based on Carbon materials as EMI shielding materials, but not only. Carbon Nanotubes Carbon nanotubes are an allotropic structure of Carbon. In the solid phase it can exist in three allotropic forms: graphite, diamond and buckminsterfullerene. Graphite is made by layered planar sheets of sp2 hybridized carbon atoms bonded together in a hexagonal network. Graphite soft, slippery, opaque, and electrically conductive is made by different geometry of the chemical bonds. Electrons can move freely from an unhybridized p orbital to another, forming an endless delocalized π bond network that gives rise to the electrical conductivity. Diamond has a crystalline structure where each sp3 hybridized carbon atom is bonded to four others in a tetrahedral arrangement. The crystalline network gives diamond its hardness (it is the hardest substance known) and excellent heat conduction properties (about five times better than copper). The sp3 hybridized bonds account for its electrically insulating property and optical transparency. Buckminsterfullerenes, or fullerenes, are the third allotrope of carbon and consist of a family of spheroidal or cylindrical molecules with all the carbon atoms sp2 hybridized. The tubular form of the fullerenes is called nanotubes. They were discovered by in 1991 by Dr. S. Iijima, a researcher of NEC Corporation during his analysis by Transmission Electron Microscope on fullerenes achieved by arc discharge method, in 1991[34,35]. Fullerenes were discovered in 1985 by Rick Smalley and coworkers [36]. The first fullerene to be discovered was C 60. 60 carbon atoms 13 Rivista Italiana di Compositi e Nanotecnolgie – Volume 7, n°1 Aprile 2012 bonded together in pentagons and hexagons compose an icosahedral -shaped molecule, as a soccer ball (“bucky ball”). The carbon atoms are sp2 hybridized, but in contrast to graphite, they are not arranged on a plane. The geometry of C60 strains the bonds of the sp2 hybridized carbon atoms, creating new properties for C60. Graphite is a semimetal, whereas C60 is a semiconductor. Studying interstellar dust, the long-chain polyynes formed by red giant stars, Kroto discovered C60 fullerene its discovery was, like many other scientific breakthroughs, an accident. Existing two families of CNTs: CNTs are concentrically rolled Graphene sheets with a large number of potential helicities and chiralities rather than a graphene sheet rolled up like a scroll, each ones are separated from one another by approximately 0.34 nm. These types of CNTs are called MultiWall carbon NanoTubes (MWNTs). Or it is possible to have an only one sheet of graphite to roll up. It can be visualized as a hollow cylinder. It is called Single Wall carbon NanoTubes (SWNTs) [37] as shown in figure 10. Figure 11 shows the TEM image of three types of MWNTs, with different diameters and number of walls. The way, as, the Graphene sheet is rolled determines the electronic properties of the tube. In fact it is possible to have two types of electric behavior of CNTs, metallic or semiconductor due to the different electronic structure of tube itself. It is determinate by Chirality vector Ch and 1D Translation vector Τ of the nanotubes. Τ is normal to Ch, together define the elementary cell of Carbon lattice, or unit cell. Fig.10 a) Cartoon of a multiwalled nano tube b) Cartoon of a singlewalled nano tube Fig.11 Transmission electron images (TEMs) of the first observed multiwalled carbon nanotubes (MWNTs) reported by Iijima in 1991 [34]. Ch is the vector that defines the circumference on the surface of the tube connecting two equivalent carbon atoms, Ch= nâ1 + mâ2 (9) 14 Rivista Italiana di Compositi e Nanotecnolgie – Volume 7, n°1 Aprile 2012 Ch (n,m) Fig.12 Graphite sheet and Chirality vector and Translation vector. where â1 and â2 are the two basis vectors of graphite and n and m are integers. n and m are also called indexes and determine the chiral angle θ = tan–1[√3(n/ (2m + n))] (10) It is used to separate carbon nanotubes into three classes differentiated by their electronic structure: The tubes with m = n are commonly referred to as Armchair tubes and m = 0 as Zigzag tubes. Others are called Chiral tubes. The chiral angle (θ) ranges from 0 for zigzag (m = 0) and 30° for armchair (m = n) tubes. It is a convention to refer to n ≥ m. Figure 12 illustrates a sample of different chirality of Tubes. Armchair carbon nanotubes are metallic (a degenerate semimetal with zero band gap). Zig-zag and chiral nanotubes can be semimetals with a finite band gap if (n – m)/3 = q (11) where q is an integer and m ≠ n the tube is metallic and semiconductor in all other cases. Figure 13 a) and b) show the different Electronic density of states and bands gap, respectively, relate to different chiral structures. Electronic properties of nanotubes have received the greatest attention in research fields and applications. Extremely small size and the highly symmetric structure allow for remarkable quantum effects and electronic, magnetic, and lattice properties of the nanotubes. Fig.13 Examples of the three types of SWNTs identified by the integers (n, m)[35]. It is possible to describe the electronic properties of a nanotube, using the simplest model [37–39], these properties derived from the dispersion relation of a graphite sheet with the wave vectors (Kx, Ky) E (Kx, Ky) = ±γ{1+ 4cos((√3Kx a)/2 )cos( Ky a/2 )+ 4cos2 ( Ky a/2)}1/2 (12) where γ is the nearest neighbor-hopping parameter and a is lattice constant. γ = 2.5 – 3.2 eV from different sources [40] and a = 0.246 nm. When the graphite is rolled up to form a tube, a periodic boundary condition is imposed along the tube circumference or the Ch direction. This condition quantizes the two-dimensional wave vector K = (Kx, Ky) along this direction. The K satisfying kγCh = 2πq (13) is allowed where q is an integer. This leads to the following condition at which metallic conductance occurs, as it is showed in formula number (11). All that suggests that one third of the tubes are metallic and two thirds are semiconducting. The band gap for a semiconducting tube is give by 15 Rivista Italiana di Compositi e Nanotecnolgie – Volume 7, n°1 Aprile 2012 Eg = 2dccγ/D (14) where dcc = 0.142 nm is the C–C bond length and D is the diameter of tube, it is expressed by D = |Ch|/π = a (n2 + nm + m2)1/2/π (15) The band gap of a 1-nm semiconducting tube is roughly 0.70 eV to 0.9 eV. It is necessary to underline it is important to consider the intertube coupling when the results of a SWNT are used for a SWNT rope or a MWNT. Calculations have showed interesting intertube coupling properties. The intertube coupling induces a small band gap for certain metallic tubes but a reduced band gap by 40% for semiconducting tubes in a SWNT rope. Similar observations can be expected for a MWNT as well, but the intertube coupling is relatively smaller because of bigger diameter in a MWNT [41 – 46]. The first discovered CNTs was multi-walled and they were made by Arc Discharge method. Alternative methods for preparing CNTs were reported by Smalley's group using laser evaporation [47] and Dai et al. [48] by chemical vapor deposition. Summarizing the most used method of synthesis is • Arc discharge, using two pure graphite electrodes; • Chemical Vapor Deposition (CVD), filling hydrocarbon gas, or, into a hot furnace , or near hot filament, or system where it could be possible to dissociate hydrogen and carbon atoms; • Laser Ablation, focusing a high powered laser on a substrate covered by carbon. Each technique has a particular advantages and drawbacks. It is possible to see them in Table 2. The choice of method of synthesis depends on which kind of application CNTs need. Pro • Cons Arc Discharge • • • • • Laser Ablation CVD Quite easy process Suitable for synthesis without the use of a catalyst Few topological defects • • • • • • Long CNTs SWNT diameters controllable • • High yield Possibility to grow oriented CNTs and with predefined geometries • • • Low yield rate Wide range of dimensions among the synthesized CNTs Purification needed High concentration of defects Complexity of the apparatus Requires the use of a catalyst for hydrocarbons decomposition High concentration of defects Table 2 the pros and contras of different technique of synthesis of CNTs Epoxy Nanocomposite filled with Carbon Nanotubes: DC measurements Using CNTs as reinforcement in epoxy nanocomposites can widen their use in potential applications such as coatings, adhesives, potting compounds, encapsulates, structural materials, liquid crystal display, etc [49, 50]. 16 Rivista Italiana di Compositi e Nanotecnolgie – Volume 7, n°1 Aprile 2012 Electromagnetic shielding applications request highly conductive, highly strength, easily processing, light weight and low cost materials. High electrical conductivity and high aspect ratio make the carbon nanotubes (CNTs) one of the most promising fillers for highly conductive polymer composites, with a widely number of studies [51–60] on that. They have prospective applications in aerospace, biomedical and electronic systems and going on. Epoxy resins are categorized as thermosetting resins as well as being phenol resins, urethane resins, etc. The history of epoxy resins began with the development of dental materials in 1938. The characteristics of these resins can be summarized as follows [61-63]: 1. 2. 3. 4. 5. 6. Because their viscosity is low due to comparatively small molecular weight, they can be used for various applications and can be molded under various conditions. Epoxy resins show smaller curing shrinkage and better dimensional stability than condensation thermosetting resins such as phenol resins and radical polymerization-type resins such as unsaturated polyester resins, because their cross-linking reactions are open-ring addition polymerization. Various molecule designs are possible because of different phenol compounds as the raw materials. By selecting suitable hardeners based on the required characteristics, the expected high performance is drawn out. High heat resistance, electrical properties, adhesion, and mechanical properties. The curability and moldability of epoxy resins are better than polyimides. Due to these excellent characteristics, epoxy resins have been used in a wide range of applications, such as in coating, electronics, adhesives, engineering work, etc. In Japan, epoxy resins are primarily used in electronics. Twenty-five percent of the total consumption of epoxy resins in the Japanese market is used for electromagnetic components and printed circuit boards (PCB) [64]. Generally, epoxy resin is combined with hardeners, or curing agents, which are chemical substances that have active hydrogen atoms. The high reactivity of the epoxides with amines, anhydrides, and other curing agents provides facile conversion into highly cross-linked materials. During the curing process, the addition reaction between epoxy groups in the epoxy resins and hydroxyl groups in the hardeners is carried out. After curing process, epoxy resins provide a low dielectric constant, for this reason they are useful for several applications such as in semiconductor devices and PCB used for high performance computers, cellular phones, and satellite communications equipments. Mainly, it is used as coating on PCB, power supply and packaging. Low dielectric constant materials make it possible to improve the operating speed of high frequency equipment. Following expression (16) gives the relationship between the dielectric constant of an insulating material and the signal propagation speed, when μr = 1, c = 1 / √ ε0 µ0 (16) V c / √ ε (17) where V is the rate of propagation, C is the velocity of light, and ε is the dielectric constant. Generally, for electromagnetic components, plastic packages is used to use in substitution of ceramic packages because, they have showed improvements in semiconductor packages. Because the dielectric constant of plastics is lower than ceramics, it will minimize decreases signal propagation speed under high frequency and disordered wave shape [64]. Here, the idea is to modify the electrical properties of net epoxy resin loading it with carbon nanotubes: decreasing the resistivity of resin and increasing its conductivity to achieve a high conductivity coating, paint which can reduce the EMI and so, work as a good EMI shielding. Therefore, it is important to quantify the amount of enhance the conductivity of resin materials when they are loaded with CNTs, then to evaluate the EM properties of nanocomposites. In order to evaluate the electric behavior of a epoxy nanocomposite loaded with CNTs, testing was made using, as standard specification, a U.S. military standard (MIL-I-4658C), on measurement of resistivity of common epoxy coating on electric circuit for aircrafts. Using a ‘‘Y’’ shaped electrical circuit (as shown in figure 14) with two parallel lines as the tail of the ‘‘Y’’ with a 1 mm gap between them and a length of about 2.5 cms[65 - 68]. 17 Rivista Italiana di Compositi e Nanotecnolgie – Volume 7, n°1 Aprile 2012 Fig14 Schematic of circuit used for electrical measurements. The circuits were made on a PC base with silver print and the two arms of the ‘‘Y’’ were connected to the picoammeter and a high voltage supply. The composite mixtures were spread, like thin films, on the circuit and electrical resistance tests were carried out using Keithley 6485 Picoammeter with short circuit protection. The current through the sample was recorded for three different applied DC voltages, namely 200 V, 500V and 1000 V, and for each value of voltage the measurement was taken at four times: 2s, 10 s, 60 s and 120s. The EPIKOTE resin that was used is a commercial Hexion product, namely, Epon 828, it is a DGEBA resin, main properties of resin it shows in following table 3. Viscosity 100÷150 Pa s at 25°C Epoxy equivalents 182÷194 Density 1,16 g/cm3 Table3 Resin data sheet: Epon 828 DGEBA type Two types of patented curing agent were used along with the resin; mainly A1 curing agent and PAP8 agent. A1 is a POLYAMINOALKYLOLIC curing agent. It was obtained by reacting TETRAETHYLENEPENTAMINE (TEPA) with FORMALDEHIDE; the molecular ratio between the reagents is (1:1), they determine the insertion of alkylolic groups on the amino groups of the POLYAMINE [69]. PAP8 is a POLYAMINOPHENOLIC curing agent. It was obtained by reacting between TEPA, FORMALDEHIDE and PHENOL; in the molecular ratio is 1:1:0.8; the CH2O group was added to solution of Phenol in TEPA, gradually. After a thermal treatment, CH2O creates the condensation and insertion of phenolic group onto the Amino groups of the TEPA[70]. For preliminary testing, epoxy resin was mixed with graphite. It was bought by Aldrich Company, table 4 shows data sheet of graphite. The samples were loaded by 20wt% of graphite. Density 2,24g/m3 Granulometry < 20μm Purity 99,99% Table4 Graphite data sheet It is important to underline as the first curing agent, A1, possesses polar groups in its chemical composition, whereas the second agent, PAP8, contains benzene groups. As a consequence, the mechanical properties of composites where the PAP8 agent has been used turn out to be improved. To understand the stability of the behavior of the curing agent, in the first step, the experiment was repeated under three different pressures – atmospheric, 10-2 mbar and 10-6 mbar. 18 Rivista Italiana di Compositi e Nanotecnolgie – Volume 7, n°1 Aprile 2012 The low pressure measurements indirectly gave the effect of moisture on the resistivity values of the samples. The plots, in figures 15 –16, show the resistivity vs. applied voltages for various samples under varying voltage and pressure conditions. a) b) Fig15 a) Plot of resistivity vs. voltage for the samples. Resin +A1 with no graphite added; b) Plot of resistivity vs. voltage for the sample. Resin+A1 graphite added. Fig16 a) Plot of resistivity vs. voltage for the samples. Resin +PAP8 with no graphite added; b) Plot of resistivity vs. voltage for the sample. Resin+PAP8 graphite added. It is important to note that the absolute change in resistivity is less over a wide voltage range of 200 volts to 1000 volts for the sample with A1 curing agent (as seen from figures 15 a) and 15 b) ), whereas for the sample with PAP8 curing agent the resistivity changes marginally more with increasing voltage. Note that the resistivity data were collected with the same samples at two different times of the year (i.e., July 2005 and September 2005) in order to have a rough estimate of the influence of climatic and environmental conditions on the performance. It appears, from a preliminary analysis of the data (figures 16 a) and 16 b) ), that the resistivity values of composites employing PAP8 agent shows a large difference between atmospheric and low pressure conditions and its behavior was not affected by the addition of graphite. In the case of composites with A1 curing agent the behavior is quite different (figures15 a ) and 15 b) ), i.e., the stability of the material increases as graphitic additions are included. This seems to favor the use of A1 curing agent from the point of view of the optimization of its use in aerospace applications. So it is possible to conclude that the resin+A1 curing agent+ graphite seems to be an ideal candidate for applications in various pressure ranges as well as voltage ranges. In the second step, for studying resistivity versus concentration, the data was taken under atmospheric pressure conditions only. The samples were loaded with micro powder of micro-size of Graphite, from Sigma Aldrich Company, and CNTs, made by arc discharge method (at Frascati National Laboratories (LNF) -INFN, “NEXT” Group). 19 Rivista Italiana di Compositi e Nanotecnolgie – Volume 7, n°1 Aprile 2012 Carbon nanotubes were synthesized in a DC arc plasma system in helium atmosphere at a pressure of 700 mbar. The arc was struck between two electrodes of high purity graphite rods (purity 99.97%), bought from Goodfellow company. The discharge is typically carried out at a voltage of 22V and a current in the range of 90-100A for 50minutes. Some of the evaporated carbon condenses on the tip of the cathode, forming a slag-like hard deposit, as it possible to see in figure 17. The deposit, essentially on the cathode, consists of bundles of carbon nanotubes mixed with a small quantity of amorphous carbon. Fig 17 Scanning Electronic Microscope images of cathode deposit of carbon nanotubes; they are taken using ISI ABTDS 130S Microscope by A. Grilli[65]. Solution processing of CNTs - epoxy resin was the employed method. Samples are prepared in this way: At beginning the fillers were mixed in isopropylic alcohol and ultrasonicated for 30 mins. Then this solution is mixed with a known quantity (weight) of resin (around 1gr) and heated in an oven for 2 hrs at 80°C. The alcohol evaporates off and the resin with CNT is again sonicated for 15 mins. Immediately after this the hardener A1 is mixed and the mixture is applied on the surface of the electrical circuit and allowed to set. Composites of resin A1 mixed with both graphite as well as CNTs were studied separately with three compositions of 0.1, 0.5 and 20 weight% and 0.1, 0.25 and 0.5 weight%, respectively. Mean resistivity measurements gave following data, showed in table 5. Matrix + CNTs 0.1% 0.25% 0.5% wt Resistivity 1,63E+02 9,19E+00 5,24E-02 MΩ x cm Matrix + Graphite 0.1% 0.50% 20% wt Resistivity 7,95E+05 1,17E+05 1,79E+00 MΩ x cm Table5 Graphite and CNTs Resistivity As can be seen in the plot of figure 18, the resistivity decreases drastically from thousands of mega ohms to hundred mega ohms with even a small (0.1 wt %) addition of CNTs. Further increase (0.25 wt %) in CNTs concentration results in the resistivity value of 9.19MΩ (a decrease of two orders of magnitude). An increase of CNTs to 0.5wt% results in the decrease of resistivity to 0.05MΩ, i.e. again a change by two orders of magnitude. The concentration of 0.25wt% was considered only for the CNTs sample but not for graphite. Fig 18 Resistivity vs Concentration of CNTs [65]. 20 Rivista Italiana di Compositi e Nanotecnolgie – Volume 7, n°1 Aprile 2012 It is seen clearly the sharp fall in resistivity (from few thousand MΩ to few hundred MΩ) for even a small change in the concentration of 0.1 wt%. The change in the resistivity values for CNT-based composites turns out to be significant, even for small changes in the added CNT percentage. These results might be important for determining the most suitable ‘‘recipe’’ for the realization of composite materials for High-fidelity circuits in aerospace applications or even in devices exposed to disturbances predominantly electromagnetic in their nature. It is possible to carry out the measurement of electric properties of composite using other testing method. According to the specific standard ASTM D257 and ASTM D4496-04 the evaluation of the electric behavior of a epoxy nanocomposite loaded with carbon material was done by “two-probe method” . The morphology of CNTs is an important factor which affects the SE of CNTs composites. The used epoxy resin was EPON 828 and carbon materials employed were: ü MWNTs produced by Heji, using Chemical Vapor Deposition method. Following some its characteristics and image, figure19 True density Appearent density Length Diameter Synthesis method Composition Surface Area (BET) 2,1 g/cm3 0,05 g/cm3 0,5÷200 µm 20÷40 nm CVD MWNTs content > 95% 400 – 600 m2/g Fig.19 TEM micrography of multiwalled nanotubes ü SWNTs produced by Heji with the characteristics given in the table and the morphology shown in the TEM micrograph below (Figure20): Appearent density 0,3 g/ cm3 a 25°C Length 10÷20 µm Diameter 1÷2 nm Synthesis method Composition Surface Area (BET) CVD Purity > 95% with SWNTs > 90% 400 m2/g Fig.20 TEM micrography of singlewalled nanotubes ü Cnts produced by arc discharge method (at Frascati National Laboratories (LNF) -INFN, “NEXT” Group). They were obtained by the method of arc discharge, based on the electric arc primer in the presence of an inert gas (helium gas was used). The equipment for the synthesis by arc discharge we used was described earlier. Such a kind of CNTs, owing to its chemical purity and low defectiveness. 21 Rivista Italiana di Compositi e Nanotecnolgie – Volume 7, n°1 Aprile 2012 Fig.21 TEM micrography of arc discharge multiwalled nanotubes, performed by CIGS. ü Carbon black is a particulate form of industrial carbon which has a microstructure "nearly-graphitic", but unlike the graphite, the layers’ orientation is random [71]. Carbon black used here is Printex 90 (mean particle diameter 14 nm, BET Surface Area 300 m2/g, volatile matter at 950°C (%) ~1), generously provided to our group by Evonik Degussa GmbH. Samples were made in “bar” shape, length 12 cm and width and depth 1cm. Then the bars, once removed from the mould, were cut in many “cubes” (dimension 10mm x 10mm x 10mm), figure22 shows the samples. On these the electrical measurements were carried out; the current intensity, in order to obtain the value of the resistance, and consequently that of the resistivity (or conductivity) was measured. a) b) c) d) Fig.22 Images of a) preparation; b) brass mould; c) “bar” samples; d)“cube” samples. Table 6 shows the procedure of preparation of “bar” samples. Solution processing of CNTs - epoxy resin was the employed method. It is based on mixing of two components into a certain solvent and, then, evaporate the latter to form a composite material (film, bar, i.e.). This one is the most common method for preparing CNT–polymer composites. Ultrasonication is an effective method to disperse CNTs in liquids having a low viscosity, such as water, acetone, propanol and ethanol. However, most polymers are either in a solid or viscous liquid state, which requires the polymer to be dissolved or diluted using a solvent to reduce the viscosity before dispersion of CNTs, or heating of polymer. Other sintering process widely employed are: melt shear mixing, bulk mixing, calendaring mixing, roll mixing, polymerization in situ and also it is possible a combination of these methods. Standard laboratory sonicators (in a water bath) run at 20– 23 kHz with a power less than 100 W. Commercial probe sonicators have an adjustable amplitude ranging from 20% to 70% and a power of 100–1500 W. The probe is usually made of an inert metal such as titanium. Most probes are attached with a base unit and then tapered down to a tip with a diameter from 1.6 to 12.7 mm [73, 74]. Preparation procedure • • • • • • • • • • • Degassing of the resin under vacuum (1÷3 mbar), t=12÷14h CNTs’ dispersion in propanol through ultrasonication for 1h 30 mins Mixing of the obtained suspension (CNT-propanol) with epoxy resin followed by alcohol Evaporation at 130-150°C x 2h Further sonication of CNTs into the epoxy resin,1 h 30’ Slow manual mixing with the curing agent (A1) x ~ 7 min The mix is poured into the moulds 20 min in air 1 h in oven at 40°C for further degassing 20 h in air 6 h at 80°C Table6 Preparation procedure 22 Rivista Italiana di Compositi e Nanotecnolgie – Volume 7, n°1 Aprile 2012 The effective utilization of CNT material in composite applications depends strongly on their ability to be dispersed individually and homogeneously within a matrix. An optimized interfacial interaction between the CNT sidewalls and the matrix should result in an efficient load transfer to the “hard” component of the composite. Using a power supply in DC, tests were performed on each "cube" at different voltages: 50, 100, 200, 300, 500, 750, and 1000 V. The current intensity was measured at four time intervals: 2, 10, 60, and 120 sec. Each type of mixture (i.e. the mixture containing carbon black, the one with MWNT, SWNTt and with INFN-CNTs) was loaded at different concentrations of fillers, such as 0.1%, 0.25% and 0.5% wt (estimated percentage on the weight of the resin). From each mixture we obtained 12 "cubes": each one was tested at different voltages for different times. I-V graphs (where I denotes the average of the current's values measured for the different cubes obtained from each bar of a given mixture and filler concentration) were realized for each type of filler at different concentrations for different times; the I-V graphs related to the time 120 sec and to the concentration of 0.5% wt are shown below in figures 23, 24, 25. Fig.23 Plot of current (I) vs voltage (V) of only resin composites a) b) Fig.24 Plot of current (I) vs voltage (V) : a) resin + CB composites; b) resin+ INFN CNTs composites Fig.25 Plot of current (I) vs voltage (V) : a) resin +Heiji MWNTs composites; b) resin+ Heiji SWNTs composites . 23 Rivista Italiana di Compositi e Nanotecnolgie – Volume 7, n°1 Aprile 2012 When the resin is loaded with filler, at the same percentage in weight , it is easy to identify a linear trend of (I , V) plots, as an ohmic behavior .Especially, when the matrix is loaded with 0.5%wt of carbon nanotubes. Other ways, trend of net resin, at different time of measurement, shows a quite different behavior, not ohmic behavior, due to absence of a conductivity path and the presence of tunneling resistance. The resistance to electron flow in conductive nanocomposites is comprised of three resistances: the intrinsic resistivity of the filler material, the particle-particle contact resistance and the tunneling resistance [75]. The particle-particle contact resistance is the resistance due to forcing of an electron through a small distance between two conduct particles. The tunneling resistance is a result of electrons passing through a very thin insulating film which is possible when the film thickness is less than 100 Å. Any modifications to the composite which affect at least one of the three resistances can change the composite conductivity. In order to achieve conduction in filled polymer systems, conductive pathways of filler particles are required throughout the polymer matrix so as to allow electrons to move freely through the material. CNTs possess high aspect ratios, and have the added advantage of achieving percolation at lower compositions than spherical fillers. Percolation describes the range of compositions where a three-dimensional network of the filler is formed. When percolation is reached, the conductivity increases dramatically because the network has created a conductive path. The percolation behavior can be expressed by a power law equation [76 - 78] σv ≈ (v-vc)t (18) where σv is the conductivity as a function of the filler concentration, v is the volume fraction of filler, vc is the volume fraction where percolation occurs, and t is the critical exponent , which seems to depend on sample dimensionality. Fig.26 σDC as a function of filler fraction v . A steep increase in conductivity is observed at a critical filler fraction vc. For v < vc the filler fraction is too small to form a continuous network through the sample, as shown in the left drawing of the nanocomposite, whereas for v > vc such a continuous network exists . vc v However, numerous studies show that the percolation threshold and conductivity depend strongly on the polymer type and synthesis method, geometric parameters of CNTs(length and diameter), disentanglements of CNTs, agglomeration , uniform spatial distribution of individual CNTs and degree of alignment[79-81]. Table 9 presents a comparison between the different types of polymeric matrices, CNTs type and additional treatment (purification/functionalization), processing method and electrical characteristics such as room temperature. Also it clearly reveals a large variation of the electrical properties values as a function of the polymer matrix, processing method, alignment or not of tubes and CNT type (amount of defects, impurity inside the tubes). Correlations and general dependencies between the above mentioned parameters are difficult to establish [82].During engineering and designing process it is better to take in account all these parameters to obtain a high performance material. Analyzing trend of resistivity vs. concentration, in figure 27, it is easy to see that, while the values of resistivity of the matrix with arc discharge and the one with MWNTs by CDV are comparable with each other, the value of resistivity of the matrix with SWNTs is approximately three orders of magnitude lower. This means that doubling the CNTs concentration (from 0.25% to 0.5%) shifts the relevance of the parameter affecting the most the performance in conductivity of the nanocomposite, from the density of topological defects (or equivalently the CNTs deposition method) to the aspect ratio of the filler. Remember that the value of the aspect ratio of SWNTs is higher than the one of MWNTs, which means that the extension’s value of the matrix-filler interface, at equal weight concentration, is higher in the first ones than the latter. Therefore, increasing the amount of nanotubes, a mechanism of percolation is activated, in which an interconnected network is formed (so we are beyond the percolation threshold), in order to create a preferential way for the current passage inside the loaded matrix [83], as it is possible to see in figure 26, where it shows a schematic representation of interconnection of CNTs inside a cubic volume, as used sample for this analysis. The addition of conductive particles into an insulating polymer can result in an electrically conductive composite if the particle concentration exceeds the percolation threshold. CNTs are very effective fillers, with an electric current-carrying capacity cited to be as large as 1000 times higher than copper wires [84]. A good dispersion and well alignment, less defective and high aspect ratio of CNTs into the composite, give quite different conductivity behavior of nanocomposites. There are clearly differences in electrical conductivity due to CNT features, especially 24 Rivista Italiana di Compositi e Nanotecnolgie – Volume 7, n°1 Aprile 2012 distribution, degree of alignment, CNT–CNT and CNT–polymer interactions and hopping or tunneling behavior [85– 87], but also differences due to the polymer and test methods (particularly surface resistivity testing of films vs. bulk resistivity, for example)[88]. Formation of CNTs networks can be induced by the application of an external electric field (DC field of 100 V/cm)[88]. So, electric fields not only align CNT but also enhance the attractive forces between neighboring CNT. Conduction may occur by electron hopping from a nanotube to an adjacent one when they are close enough. Above percolation, conductive paths are formed through the composites due to quantum tunneling effects where the distance between the conductive inclusions is such that electron hopping can occur. Percolation theory assumes that paths are made up of conductive inclusions in direct contact [89]. 3-D Rapresentation of CNTs inside a polymer Fig 27 Resistivity vs Concentration of Carbonaceous fillers and 3D representative [91] CNTs volume elements inside polymer. For polymer nanocomposites, the electrical conductivity is mostly determined by the tunneling resistance among neighboring nanotubes, under condition of uniform dispersion of conductive CNTs into insulating matrix materials. The tunneling resistance between a CNT-polymer-CNT is very sensitive to polymer separation layer thickness and also depends on the relative orientation between the CNTs. At low concentration in volume, an average value more than one order larger in magnitude than the diameter of nanotubes is possible to take account as the average value of distance of separation between nanotubes, thus the CNT curvature effect can be neglected in theoretical analysis and simulations. In a typical insulating polymer matrix, value of average effective junction resistance due to tunneling among CNTs was estimated in (R0 = )1013Ω by Foygel et al.[90], by fitting their formula to the experimental results reported by Ounaies et al[89]. They demonstrated as the high value of resistance is driven by contacts between the nanotubes belonging to the backbone percolation cluster. To understand and know better, the real mechanism of percolation into the polymer, a lot of simulation modeling were tested. In their simulation modeling, Y. Yu et al. showed, how the conductivity of CNTs inside the insulator polymer material, is determinate by tunneling resistance, which can be explained by two following factors: • • the large difference in the tunneling resistance ; the resistance of individual nanotubes and the unique structure of resistor networks consisting of alternating these two types of resistors. They have considered that the simulation the parameters characterizing the nanotube properties are assumed to be constant or follow simple distributions: the position and the orientation of CNTs are assumed to follow the uniformly random distribution and tubes are assumed to be identical in shape and size. If there is a good dispersion of CNTs inside the resin it will be possible to ignore the resistance of nanotubes, during the calculation. In this simulation “soft core” model was used in current Monte Carlo simulation with the expectation that CNTs bend at the junctions [92]. Using Simmons formula, the tunneling resistance between two neighboring CNTs can be approximately estimated as [91] Rtunnel = V/AJ =[h2d /(Ae2 √2mλ)]exp[(4πd/h)(√2mλ)] (19) where J is the tunneling current density, V the electrical potential difference, e the quantum of electricity, the mass, h the Planck’s constant, d the distance between CNTs, k the height of barrier (for epoxy, 3.98 eV), and A the crosssectional area of tunnel (the cross-sectional area of the CNT is used here as an approximation). 25 Rivista Italiana di Compositi e Nanotecnolgie – Volume 7, n°1 Aprile 2012 They have showed that the tunneling resistance, between two crossed CNTs separated by a 1 nm thick epoxy layer, ranges from around 3 X 10¹⁰ to 5 X 10¹¹ Ω as the diameter of CNTs changes from 8 to 2 nm correspondingly. The resistance increases to 1019 Ω for a separation of 1.8 nm and the tube diameter of 2 nm intrinsic resistance. Also, the resistance of the CNTs was estimated by following formula Rtube = ρ X (L/πR2) (20) where ρ is the nanotube resistivity, L and R are the length and the radius of the tube, respectively. The resistivity of conductive CNTs was reported to be as low as 5.1 X 10⁻⁸ Ω m. The resistivity of a typical metallic CNTs is usually taken as 10−6 Ω m by Thostenson et al.[83]. Given this resistivity, the intrinsic tube resistance is around 106 Ω for a nanotube with length of 3 μm and a diameter of 2 nm. But it is important to underline how, two tunneling resistors have to be connected by a tube segment, and similarly, two tube resistors are always bridged by one tunneling resistor. This unique configuration of effective networks and fact that the tunneling resistors are much larger in value as compared to the tube intrinsic resistances justifies the simplification of only taking into account the tunneling resistance during the simulation, therefore R tube can be negligible. Under these considerations the simulation results showed a good agreement with the classic percolation theory on estimation of the critical behavior of the conductivity of nanocomposite [92]. It is better to notice that, in real material systems, physical parameters, such as the tunneling resistance, can have large variations as a function of the junction configuration and materials properties of nanotubes and polymer. It is important also to consider that “the soft core” model seems to contradict the physical principle that tubes can never penetrate through each other. On the other hand, the “hard core” model has not the above mentioned contradiction, but its implicit assumption that the tube have to be infinitely stiff, leads to high rejection rates of the generation of tubes during the simulation. In reality, the tubes with high aspect ratios can be easily bent at junctions to avoid penetrating each other [92]. Using a Monte Carlo simulation, Ning Hu et al. decided to consider CNTs, as ‘‘soft-core” cylinders of length L and diameter D, and they are allowed to penetrate each other, also it was considered the distance between two no contact CNTs(J), where J there is the tunneling current, figure 32. They want to create a “3D-cell” model, more exactly, a combination of 3D resistor network and 3D fiber reorientation model , to predict the electrical conductivity of the nanocomposite. Most of these models have been based on the RC (resistance–capacitance) of a simulated microstructure. For convenience, in their research, the electrically conductive paths in the matrix phase are completely neglected. There is no obvious aggregation in their various specimens using different fabrication processes for this nanocomposite. For a CNT with two contacting points i and j with neighboring CNTs, the conductance gij between i and j (the inverse of resistance Rij) can be evaluated as gij = σCNT (SCNT/ lij) (21) where l ij is the length between the points i and j, σCNT and SCNT are electrical conductivity and cross- sectional area of the CNT, respectively, as shown in figure 33. The tube–tube contacts among CNTs are assumed here to be perfect with zero resistance. Using formula (53) , the tunneling resistance effect on electrical conductivity of nanocomposite was estimated as shown in figure 34(for epoxy, K = 0.5–2.5 eV). The tunneling effect was identified by the increase in electrical conductivity when the volume fractions of CNTs are near the percolation threshold of the composite [93]. The tunneling effect disappears gradually with increasing additions of CNTs. Fig 28 Schematic of a resistor model with a random distribution of CNTs [91]. Comparing their results they found a good agreement between numerical simulation and experimental measurement, as shown in figure29. 26 Rivista Italiana di Compositi e Nanotecnolgie – Volume 7, n°1 Aprile 2012 Wolfgang Bauhofer et al. underlined as this type of modeling on statistic percolation theory have some limitation. It is derived for ideal systems and they doesn’t consider that CNTs/polymer composites are far away from being ideal systems, in fact, homogeneous dispersion of identical particles is very difficult to achieve. Because, CNTs have a wide range of properties, i.e., length, diameter, chirality, entanglement and waviness; also it is possible to have effects of CNTs in bundles and ropes, well or not well alignment and interfacial bonding. Also they try to identify main parameters to lead the conductivity in polymer composite. They suggest the shear mixing technology and the presence of solvent, during the making processing composite, seem to have an action on the improvement of the conductivity of composite. Fig 29 Results of electrical conductivity of nanocomposites: (a) comparison of experimental and numerical conductivities and (b) effect of tunneling on conductivity [93]. The choice of polymer it is more important than that one of fillers because each matrix has an own tunneling resistance, the extreme distance dependence of tunneling through polymer barriers between CNT. It seems that some polymer types and processing methods favor the formation of insulating polymer coatings of different thicknesses around the CNTs. According to Connor et al., tunneling between CNT separated by a thin isolating layer should lead by following form lnσDC ~ - v 1/3 (22) They suggest a relation between DC conductivity (σDC) and filler load (v) [94]. After these considerations, it is important to remark that, the mechanism of charge transport in CNT/polymer composites has also been addressed by temperature dependent conductivity measurements [95]. Charge transport via phonon-induced tunneling of electrons between randomly distributed localized states (variable range hopping, VRH) often follows a temperature dependence of the type σdc exp[ -(T0 /T) γ] (23) where T0 is a parameter depending on the density of states at the Fermi level on the distance of the wave functions decay, the value of γ and the interpretation of T0 depend on the details of the model. The original Mott theory for 3D variable range hopping with a constant density of states (DOS) at the Fermi energy predicts γ = 1/4, while several modifications of the model have been proposed to describe the frequently observed value γ = 1/2[95]. Wolfgang Bauhofer et al identified as powerful theoretical method to estimate the percolation threshold of composites containing statistically dispersed non-spherical particles the concept of excluded volume. The concept is based on the idea that the percolation threshold is not linked to the true volume of the filler particles but rather to their excluded volume (Vex). The excluded volume is defined as the volume around an object in which the center of another similarly shaped object is not allowed to penetrate [96,97]. For randomly oriented cylinders with volume V =πD2 L/4 and high aspect ratio η = L/D, excluded volume is given by (Vex) ≈ DL2π/2 (24) vc ~ V/Vex = 1/(2η). [98] (25) This formula relates vc (it is the volume fraction where percolation occurs) to the aspect ratio( η) of the tubes. 27 Rivista Italiana di Compositi e Nanotecnolgie – Volume 7, n°1 Aprile 2012 Fig 30 Excluded volume (or area) of objects given by the dashed lines for a sphere (left) and a stick (right), where for the latter the angle between the stick and a second stick is fixed and given by the angle between de dark grey and the light grey stick. The excluded volumes of the dark grey objects are shown, while the light grey objects are a guide to the eye [99]. Chunyu Li et al. indicated, through results of their Monte Carlo simulations, that the electrical conductivity of composites with wavy nanotubes is lower than that of composites with straight nanotubes. The critical exponent of the power-law dependence of electrical conductivity on nanotube concentration decreases with increasing nanotube curl ratio. They showed as the electrical conductivity exhibits an inverse power-law dependence on the curl ratio with a critical exponent in the range of 2.2–2.6[100]. Recently, Kovacs et al. reported the observation of two percolation thresholds in the same MWCNT/epoxy system. The lower one attributed to a kinetic and the higher one to a static network formation process. Statistical percolation refers to a situation where randomly distributed filler particles form percolating paths. In kinetic percolation, the particles are free to move and thereby can form a conducting network at much lower particle concentrations. Particle movement can be caused by diffusion, convection, shearing, or external fields [101]. Iosif D. Rosca and Suong V. Hoa demonstrated as the MWCNT aspect ratio increased 5.5 times the conductivities of the corresponding composites increased by almost 10 times. Low percolation thresholds and optical micrographs evidenced a presence of kinetic percolation rather than a statistic one [98, 102]. They found how temperature plays an important role on influence of the conductivity as it determines the reaggregation of the nanotubes, at low loadings, close to the percolation threshold. At high loadings, due to the high viscosity and extended entanglement of the nanotubes, the composite conductivity increases slightly with temperature [102]. Comparing several types of epoxy nanocomposites , loaded with different CNTs, Florian H. Gojny et al. found that any kind of treatment, leading to a reduction of the aspect ratio (functionalisation, ultrasonication, etc.) correspond increases of the percolation threshold[103]. In figure 31 plots of electrical conductivity versus CNTs concentration of several types of CNTs with different high aspect ratios are shown. One of the most important parameters that determine the composite conductivity and the percolation behavior of the CNTs, mainly of MWCNTs is the aspect ratio. Higher aspect ratio resulted in lower percolation threshold and higher conductivity. a) Filler content v [Vol%] b) log(v-v c) v [Vol%] Fig 31: a) Electrical conductivity of the nanocomposites as function of filler content in volume percent [101]; b) Critical behavior of the electrical conductivity σ as a function of CNT volume fraction V in cases of high aspect ratios. The data is replotted in the inset [98]. Kim YJ et al. investigated the electrical conductivity of oxidized MWCNT-epoxy composites [104]. Two groups of specimens were made: the MWCNTs were oxidized under both mild and strong conditions. Strong oxidation conditions produce partially damaged nanotubes. Consequently, their conductivity decreases and the percolation threshold 28 Rivista Italiana di Compositi e Nanotecnolgie – Volume 7, n°1 Aprile 2012 increases. On other hands, the second group of MWCNTs, which were oxidized under mild conditions, present a high conductivity, independent of oxidation conditions. Fu M. et al. studied electrical conductivity as a function of film thickness of nanocomposites and nanotubes volume fraction. They showed that decreasing the thickness of film to a value comparable with the MWCNT length, the percolation threshold significantly diminishes. The authors explain this considering that different conductive paths appear with different probabilities in a film of MWCNT embedded in polymer [105]. They discovered that using the microwave curing technique, MWCNTs can not only be uniformly dispersed in the matrix, but also align in a direction, this unique structure of MWCNTs allows the development of novel composites with a very higher dielectric constant and extremely low dielectric loss. This investigation suggests a new method to develop high performance electric conductor/polymer composites through controlling the dispersion and spatial distribution of conductors using different curing techniques [107]. It is useful to remark as the application of both AC and DC electric fields during nanocomposite curing was used to induce the formation of aligned conductive nanotube networks between the electrodes. The network structure formed in AC fields was found to be more uniform and more aligned compared to that in DC fields. In this case it is possible to obtain a good path where the carriers can move easily. Epoxy Nanocomposite filled with Carbon Nanotubes: shielding effectiviness measurements All EMC regulations and testing standards are under the International Electrotechnical Commission (IEC). Within the IEC, three technical committees are related to EMC: CISPR (International Special Committee on Radio Interference), TC77 (concerned mainly with EMC in electrical equipment and networks), and TC65 (concerned mainly with immunity standards). The CISPR committee gives outputs in the form of standards. These one cover a wide range of EMC-related topics with the designation CISPR10 to CISPR23. One of the most useful designations is CISPR 22 for conducted and radiated emissions of information technology equipments; it has formed the foundation for most of the major national standards. It is important to underline, there has been incompatibility between the requirements of different countries because: (a) the recommendations proposed by CISPR cannot become law unless the individual member countries take the appropriate action themselves; (b) individual countries have made adjustments to the recommendations before adopting them as national standards. In Europe, the European Standards Committee (ESC), through the European Committee for Electrotechnical Standards (CENELEC), is responsible for the adoption of suitable standards. These standards cover broad terms and broad classes of equipments: Class 1 (residential, commercial, and light industry) Class 2 (heavy industry); Basic standards (setting out test procedures); Product standards (covering specific types of apparatus, e.g., information technology equipment). In United States of America, civilian radio, communications, and interference are regulated by The Federal Communications Commission (FCC). An individual or organization must comply with all applicable FCC standards and equipment authorization requirements to legally import or market a product in the United States. FCC regulations specify EMC standards, test methods (ANSI C63.4), equipment authorization procedures, and marking requirements. For the military market, electronic systems designed, generally, have to comply with MIL-STD-461, which imposes limits on the susceptibility of a system to conduct and radiate EMI, as well as specifying its maximum conductedand radiated emissions. The companion document, MIL-STD-462, specifies the testing methods. Mil-STD-461 has been recognized and applied by many defense organizations outside the United States, as well as some nonmilitary agencies [28]. For commercial applications, the target value of the EMI shielding effectiveness needed is around 20 dB (i.e., equal to or less than 1% transmission of the electromagnetic wave). 29 Rivista Italiana di Compositi e Nanotecnolgie – Volume 7, n°1 Aprile 2012 Commercially conducted emission limits of the FCC, ESC, and CISRR 22 are more severe than those for military equipment because the ambient noise in which commercial systems operate must be kept to a minimum since there are generally no susceptibility requirements for this type of equipment. Other hands, the more stringent military standard for radiated emissions takes into account the closer proximity of electronic equipment in aircraft, ships, tanks, and so forth, compared with commercial installations, which are typically more widely dispersed. EMI shielding is a rapidly growing application of carbon materials, especially discontinuous carbon fibers. It is better to remark some characteristic of the parameter which combines to give the (36) equation of SE. REFLECTION parameter: shield has to have mobile charge carriers (electrons or holes) which interact with irradiated EM waves. As a result shield has a good conductivity, it is not requested high conductivity specifically, and it has a volume resistivity of 1 Ω cm, typically [106,107]. ABSORPTION of the radiation, the shield should have electric and/or magnetic dipoles which interact with the electromagnetic fields in the radiation. The electric dipoles may be provided by BaTiO3or other materials having a high value of dielectric constant. The magnetic dipoles may be provided by FeO or other materials having a high value of the permeability (μ) [108], which may be enhanced by reducing the number of magnetic domain walls through the use of a multilayer of magnetic films [109-111]. In order to increase the shielding effectiveness through multiple internal reflections, it is important to have a conductive polymer nanocomposite [112]. The advantage of internal reflections is that the material absorbs and attenuates instead of reflecting electromagnetic radiation. For answering to requirements of a new generation of high performance materials to use as light shield against EMI, several studies on carbon materials were made and are making, now. Wide ranges of polymers, more generally, plastic materials were used as matrix. Taking in account the first experiments on polymer filled with carbon nanotubes, mainly on foamy materials: Yang et al. developed carbon nanofiber and carbon nanotubes filled polystyrene conductive foams for lightweight EMI shielding [113]. They obtained a composite with a density about 0.56 g/cm3 and obtained an EMI shielding effectiveness of approximately 20 dB. Compared to carbon nanofiber filled composite foams, carbon nanotube filled foams had higher EMI shielding effectiveness at lower concentrations [114]. Thomassin et al. developed MWNT/polycaprolactone composite foams by using supercritical CO2 foaming technology and achieved EMI shielding effectiveness as high as 60/80 dB together with low reflectivity at very low volume concentrations of MWNT (0.25 vol %). The shielding effectiveness that Thomassin et al. achieved is comparable to that of the most efficient metallic EMI shielding materials [115]. They also found that increasing the carbon nanotubes concentration the shielding effectiveness increases, possibly due to increased conductivity [116]. The shielding effectiveness in conductive carbon nanotube/polymer composite foams results mostly from the loss due to internal multiple reflections; increasing the bubble density (and hence increasing internal area) should increase the shielding effectiveness [109]. Increasing the bubble density, the alignment of the nanotubes changes, this can decrease the conductivity and thus, the shielding effectiveness [117]. Controlling the properties of the MWNTs and the bubble density inside the nanocomposite foams to get high shielding effectiveness is of great importance for such EMI shielding applications [118]. Yang Y. L et al , loading MWNTs in polystyrene (PS), have tested in the frequency range of 8.2-12.4 GHz (X band) achieves nanocomposites. They found a value of SE of 20 dB for 7% MWNTs [119]. H. M. Kim et al. studied the electrical conductivity and EMI properties of MWNTs in poly(methyl methacrylate) (PMMA) containing Fe. They obtained the value of 27dB (SE) for 40% MWNTs loading. MWNT composites with encapsulated Fe have also been studied for their microwave absorption, but with a different phases and shapes of included Fe [120-122]. Grimes et al. reported that SWNT-polymer composites possess high real permittivity (polarization, ε’) as well as imaginary permittivity (adsorption or electric loss, ε’’) in the 0.5-5.5 GHz range. They found that the permittivity decreases rapidly with increasing frequency [123]. Ning Li et al. measured SE of epoxy nanocomposte with 10 wt % SWNTs-long loading,they found as values of the reflectivity (R), absorptivity (A), and transmissivity (T) are 0.90, 0.08, and 0.02 at 1.0 GHz. Thus, the contribution of reflection to the total EMI shielding effectiveness is much larger than that from absorption. Similar results were observed at other frequencies and with other loadings above the percolation threshold [124]. Studying the shielding mechanism of MWNTs, with Fe catalyst, into different polymers, for polystyrene, for the PMMA-MWNTs Fe and epxoy-MWNTs with crystalline Fe, it was observed that the contribution from absorption to total EMI - SE was larger than that from reflection. However, the authors identified this with the ferromagnetic Fe in the system [124]. The influence of carbon nanotube properties such as aspect ratio is high, aspect ratio of carbon materials is essential for conductivity and SE of nanocomposites [91]. 30 Rivista Italiana di Compositi e Nanotecnolgie – Volume 7, n°1 Aprile 2012 Nanocomposites typically contain 2% to 15% loadings on a weight basis, yet property improvements can equal and sometimes exceed traditional polymer composites, even containing 20% to 35% mineral or glass. The shielding effectiveness of 20 to 30 dB has been obtained in the X-band (8.2 to 12.4 GHz) range for 15% SWCNTs-loaded epoxy composites [125]. The EMI shielding effectiveness of a composite material depends mainly on the filler’s intrinsic conductivity, permittivity, and aspect ratio. Acknowledgements The research has been supported by EU FP7 project FP7-266529 BY-NanoERA and by the Italian Ministry PRIN 2008 research program Development and Electromagnetic Characterization of Nano Structured Carbon Based Polymer CompositEs (DENSE). Printex 90 was generously provided to our group by Evonik Degussa GmbH. Epikote 828 resin was generously provided from Hexion Specialty Chemicals Inc. (now known as Momentive Specialty Chemicals Inc.). References [1] Applied Materials Science Applications of Engineering Materials in Structural, Electronics, Thermal, and Other Industries, author Deborah D. L. Chung, editor CRC Press 2001, Print ISBN: 978-0-8493-1073-7 [2] Springer Handbook of Nanotechnology 3rd revised and extended edition, Ed. Bharat Bhushan, © Springer-Verlag Berlin Heidelberg 2010, ISBN: 978-3-642-02524-2 DOI 10.1007/978-3-642-02525-9. [3] Nanocomposite Science and Technology. Edited by P.M. Ajayan, L.S. Schadler, P.V. Braun Copyright © 2003 WILEY-VCH Verlag GmbH Co. KGaA, Weinheim, ISBN: 3-527-30359-6 [4] Alexandre M, Dubois P. Polymer-layered silicate nanocomposites: preparation, properties and uses of a new class of materials. Mater Sci Eng: R: Rep 2000;28:1–63. [5] Herron N, Thorn DL. Nanoparticles: uses and relationships to molecular clusters. Adv Mater 1998;10:1173–84. [6] Messersmith PB, Giannelis EP. Synthesis and characterization of layered silicate-epoxy nanocomposites. Chem Mater 1994;6:1719–25. [7] Sumita M, Tsukumo Y, Miyasaka K, Ishikawa K. Tensile yield stress of polypropylene composites filled with ultrafine particles. J Mater Sci;18:1758–64(1983). [8] Annamalai Pratheep Kumara, Dilip Depana, Namrata Singh Tomerb, Raj Pal Singha Nanoscale particles for polymer degradation and stabilization—Trends and future perspectives. Progress in Polymer Science 34, 479–515 (2009); M. Meyyappan, S. Bellucci, Nanotechnology for aerospace applications, Rivista Italiana di Compositi e Nanotecnologie Materiali, Aerospazio, Tecnologie Speciali, Volume 1, N° 1 – December 2005, p. 7-15; S. Bellucci, L. Coderoni, F. Micciulla, and I. Sacco, Development of Micro and Nano Electro—Mechanical Technologies for Space Transportation Systems, Nanoscience and Nanotechnology Letters, Volume 3, Number 6 (December 2011), 03NNL06-1243. [9] R. Krishnamoorti, Vaia R.A. (Eds), Polymer nanocomposites: synthesis,characterization and modeling, ACS Symposium Series, Vol. 804, ACS, Washington DC, (2001). [10]Vaia RA,Wagner HD. Framework for nanocomposites. Mater Today;7:32–7 (2004). [11] D.B. Zax, D.-K. Yang, R.A. Santos, H. Hegemann, E.P. Giannelis and E. Manias. Dynamical heterogeneity in nanoconfined poly(styrene) chains J. Chem. Phys., 112 , 2945, (2000). [12] Sung Ho Kim, Jae Woo Chung, Tae Jin Kang, Seung-Yeop Kwak, Takenori Suzuki Determination of the glass transition temperature of polymer/layered silicate nanocomposites from positron annihilation lifetime measurements Polymer 48 4271 – 4277 (2007). [13] Sandeep S. Ahankari, Kamal K. Kar Processing and characterization of functionally graded materials through mechanical properties and glass transition temperature Materials Letters 62 ,3398–3400 (2008). [14] R. Krishnamoorti, R. A. Vaia, E. P. Giannelis Structure and Dynamics of Polymer-Layered Silicate Nanocomposites Chem. Mater. 8, 1728 - 1734 (1996). [15] Dı´ez-Pascual AM, Naffakh M, Go´nzalez-Domı´nguez JM, Anson A, Martinez-Rubi Y, Simard B, High-performance PEEK/carbon nanotube composites compatibilized with polysulfones. I – Structure and thermal properties. Carbon 48(12):3485–99 (2010). [16] Dı´ez-Pascual AM, Naffakh M, Go´nzalez-Domı´nguez JM, Anson A, Martinez-Rubi Y, Simard B,. High-performance PEEK/carbon nanotube composites compatibilized with 31 Rivista Italiana di Compositi e Nanotecnolgie – Volume 7, n°1 Aprile 2012 polysulfones. II – Mechanical and electrical properties. Carbon 48(12):3500–11 (2010). [17] Fan Z, Hsiao K-T, Advani SG. Experimental investigation of dispersion during flow of multi-walled carbon nanotubepolymer suspension in fibrous porous media. Carbon 42(4):871–6 (2004). [18] Ana M. Díez-Pascual, Behnam Ashrafi, Mohammed Naffakh,Jose´ M. Gonzá lez-Domínguez, Andrew Johnston, Benoit Simard, M. Teresa Martínez, Marián A. Gómez-Fatou Influence of carbon nanotubes on the thermal, electrical and mechanical properties of poly(ether ether ketone)/glass fiber laminates Carbon 49 ,2817 – 2833 (2011). [19] P. Karapappas, P. Tsotra*, K. Scobbie Effect of nanofillers on the properties of a state of the art epoxy gelcoat eXPRESS Polymer Letters Vol.5, No.3 pp 218–227, (2011). [20] Lincoln DM, Vaia RA, Brown JM, Benson Tolle TH. Revolutionary nanocomposite materials to enable space systems in the 21st century. IEEE Aerospace Confer Proc 4:183–92 (2000). [21] Business Communications Company Inc. RP-234 Polymer nanocomposites: nanoparticles, nanoclays and nanotubes. [22] Principles and Techniques of Electromagnetic Compatibility (Electronic Engineering Systems) author/editor Christopoulos Christos Publisher CRC Press © 1995 by Taylor & Francis Group, LLC, ISBN: 0849378923 [23] Emc and the Printed Circuit Board, Design, Theory and Layout Made Simple author Mark I Montrose editor Wiley-IEEE Press 1999 ISBN: 0-7803-4703-X [24] Advanced Materials and Design for Electromagnetic Interference Shielding author Colin Tong and Xingcun Colin Tong editor CRC Press © 2009 by Taylor & Francis Group, LLC, ISBN: 1420073583 [25] Electromagnetic Compatibility Engineering author Henry W. Ott editor Copyright ©2009 by John Wiley & Sons, Inc. ISBN 978-0-470-18930-6 [26] Introduction to Electromagnetic Compatibility, Second Edition, author Clayton R. Paul Copyright © 2006 John Wiley & Sons, Inc ISBN-10: 0-471-75500-1 [27] Handbook of Electromagnetic Materials, Monolitic and Composite Version and their Applications, author P. S. Neelakanta e Perambur S. Neelakanta editor Crc Pr Inc © 1995 ISBN-10: 9780849325007 [28] Theory, design and engineering evaluation of radio-Frequency shielded rooms author G. J. Vasaka (Report NADC-EL-54129). Johnsville, PA: U.S. Naval Development Center (1956). [29] Ping Li, Yueyan Shan, Junhong Deng, Yin Xijiang Electromagnetic Interference Shielding Effectiveness of Carbon-Nanotubes Based Coatings Asia-Pacific International Symposium on Electromagnetic Compatibility, ©2010 IEEE . [30] Bigg, D. M., Mechanical, thermal and electrical properties of metal fiber filled polymer composites. Polym. Eng. Sci., 19, pp 1188-92 (1979). [31] Guanghong Lu, Xiaotian Li & Hancheng Jiang Electrical and Shielding Properties of ABS Resin Filled with Nickel-Coated Carbon Fibers Composites Science and Technology 56, pp 193-200 (1996). [32] T. S. Wang, G. H. Chen, C. L. Wu and D. J. Wu, Study on the Graphite Nanosheets/resin Shielding Coatings. Progress in Organic Coatings, vol. 59, pp. 101-105, 2007. [33] L. L. Wang, B. K. Tay, K. Y. See, Z. Sun, Li. K. Tan and D. Lua, Electromagnetic Interference Shielding Effectiveness of Carbon-based Materials Prepared by Screen Pinging, Carbon, vol. 47, pp.1905-1910, 2009. [34] S. Iijima. Helical microtubules of graphitic carbon. Nature, 354, 56 (1991). [35] Carbon Nanotubes - Properties and Applications Edited by Michael J. O’Connell CRC press © 2006 by Taylor & Francis Group, LLC (2006). See also S. Bellucci, Nanotubes for particle channeling, radiation and electron sources Nucl. Instr. Meth. B 234, 57 (2005). [36] H. W. Kroto, J. R. Heath, S. C. Obrien, R. F. Curl, and R. E. Smalley. C60 Buckminsterfullerene, Nature, 318, 162–163, (1985). [37] Carbon Nanotubes Edited by Morinubo Endo, Sumio Iijima, Mildred S. Dresselhaus Pergamon Copyright © 1996 Elsevier Science Limited (1996). See also S. Bellucci, Carbon nanotubes: physics and applications, Phys. Stat. Sol. (c) 2, 34 (2005). [38] Noriaki Hamada, Shin-ichi Sawada, and Atsushi Oshiyama, New one-dimensional conductors: Graphitic microtubules, Phys. Rev. Lett. 68, 1579–1581 (1992). [39] J. W. Mintmire, B. I. Dunlap, and C. T. White, Are fullerene tubules metallic?, Phys. Rev. Lett. 68, 631–634 (1992). 32 Rivista Italiana di Compositi e Nanotecnolgie – Volume 7, n°1 Aprile 2012 [40]A.M. Rao, E. Richter, S. Bandow, B. Chase, P.C. Eklund, K.A. Williams, S. Fang, K.R. Subbaswamy, M. Menon, A. Tess, R.E. Smalley, G. Dresselhaus, and M.S. Dresselhaus, Diameter-selective raman scattering from vibrational modes in carbon nanotubes, Science, 275, 187, (1997). [41] Carbon Nanotubes - Science and Applications, authors Laurie Kelly, M. Meyyappan edited by M. Meyyappan Copyright © 2005 by CRC Press LLC (2005). [42] P. Delaney, H. J. Choi, J. Ihm, S. G. Louie and M. L. Cohen, Broken symmetry and pseudo-gaps in ropes of carbon nanotubes, Nature 391, 466-468(1998). [43] P. Delaney, H. J. Choi, J. Ihm, S. G. Louie, M. L. Cohen, Broken symmetry and pseudogaps inropes of carbon nanotubes , Physical Review B 60, 7899-7904 (1999). [44] P. Lambin, L. Phillippe, J.C. Charlier and J.P. Michenaud, Electronic band structure of multilayered carbon tubules , Comp. Mat. Sci. 2,350 (1994) [45] Riichiro Saito, Mitsutaka Fujita, G. Dresselhaus, and M. S. Dresselhaus, Electronic structure of graphene tubules based on C60 , Phys. Rev. B, 46, 1804 (1992). [46] H. Kataura, Y. Kumazawa, Y. Maniwa, I. Umezu, S. Suzuki, Y. Ohtsuka and Y. Achiba, Optical properties of single- wall carbon nanotubes, Synthetic Metals, 103, 2555–2558, (1999). [47] Andreas Thess, Roland Lee, Pavel Nikolaev, Hongjie Dai, Pierre Petit, Jerome Robert, Chunhui Xu, Young Hee Lee, Seong Gon Kim, Andrew G. Rinzler, Daniel T. Colbert, Gustavo E. Scuseria, David Tománek, John E. Fischer and Richard E. Smalley, Crystalline Ropes of Metallic Carbon Nanotubes, Science 273, 483 (1996). [48] J. Kong, A. M. Cassel, H. Dai, Chemical Vapour Deposition of methane for singlewalled carbon nanotubes, Chem. Phys. Lett. 292, 567-574 (1998). [49] Yoon YG, Delaney P, Louie SG, Quantum conductance of multiwall carbon nanotubes, Phys Rev B, 66, 073407, (1-4) (2002). [50] E. Camponeschi, B. Florkowski, R. Vance, G. Garrett, H. Garmestani, R. Tannenbaum, Uniform directional alignment of single-wall carbon nanotubes in viscous polymer flow, Langmuir 22, 4, pages 1858-1862 (2006). [51] S. Ganguli, M. Bhuyan, L. Allie, H Aglan, Effect of multi wall carbon nanotube reinforcement on fracture behavior of a tetrafunctional epoxy, Journal Material Science, 40, 13, pages 3593- 5 (2005) [52] P. M. Ajayan, O. Stephan, C. Colliex and D. Trauth, Aligned Carbon Nanotube Arrays Formed by Cutting a Polymer Resin— Nanotube Composite, Science, 265 , 5176, pp. 1212-1214 (1994). [53] J Sandler, M.S.P Shaffera, T Prasseb, W Bauhoferb, K Schulte and A.H Windle, Development of a dispersion process for carbon nanotubes in an epoxy matrix and the resulting electrical properties, Polymer 40, 21, pages 5967-5971, (1999). [54] K.-T. Lau, D. Hui, The revolutionary creation of new advanced materials – carbon nanotube Composites, Composites: Part B, 33, 263 (2002). [55] M.J. Biercuk, M. Liaguno, M.C. Radosavljevic, J.K. Hyun, J.E. Fischer, A.T. Johnson, Carbon nanotube composites for thermal management, Appl. Phys. Lett., 80, 2767 (2002). [56] J.K.W. Sandler, J.E. Kirk, I.A. Kinloch, M.S.P. Shaffer and A.H. Windle, Ultra-low electrical percolation threshold in carbonnanotube-epoxy composites, Polymer , 44, 19, pages 5893-5899 ( 2003). [57] M. B. Bryning, M. F. Islam, J. M. Kikkawa, A. G. Yodh, Very Low Conductivity Threshold in Bulk Isotropic Single-Walled Carbon Nanotube–Epoxy Composites, Advanced Materials Volume 17, Issue 9, pages 1186–1191( 2005). [58] Florian H. Gojny, Malte H.G. Wichmann, Bodo Fiedler, Ian A. Kinloch, Wolfgang Bauhofer, Alan H. Windle and Karl Schulte, Evaluation and identification of electrical and thermal conduction mechanisms in carbon nanotube/epoxy composites, Polymer, 47, 6, pages 2036-2045, (2006). [59] A. Vavouliotis, E. Fiamegou, P. Karapappas, G.C. Psarras, V. Kostopoulos, DC and AC conductivity in epoxy resin/multiwall carbon nanotubes percolative system, Polymer Composites 31, 11, pages 1874–1880 (2010). [60] Epoxy Resin Technology, P. F. Beuins, Wiley, New York, (1968). [61] Epoxide Resin, W. G. Potter, Butterworth, London,(1970). [62] Epoxy Resins, C. A. May, Dekker, New York, (1988). 33 Rivista Italiana di Compositi e Nanotecnolgie – Volume 7, n°1 Aprile 2012 [63] Handbook of Low and High Dielectric Constant Materials and Their Applications, edited by H.S. Nalwa Volume 1: Materials and Processing Copyright © 1999 by Academic Press(1999). [64] Fundamentals of Microsystems Packaging, Author : Rao R. Tummala, published by The McGraw-Hill Companies, Inc (2001). [65] S. Bellucci, C. Balasubramanian, F. Micciulla, G. Rinaldi, CNT composites for aerospace applications, Journal of Experimental Nanoscience, 2:3, pages 193 – 206 (2007); see for materials preparation also S. Bellucci, C. Balasubramanian, F. Micciulla, A. Tiberia, Study of field emission of multiwalled C nanotubes from arc discharge, Journal of Physics Condensed Matter 19 (2007) 395014 (7pp). [66] S. Bellucci, F. Micciulla, I. Sacco, G. De Bellis, G. Rinaldi, Mechanical and electrical characterization of epoxy nanocomposites for electromagnetic shielding devices in aerospace applications, International Symposium on Electromagnetic Compatibility, 2009 ( EMC 2009). IEEE (2009); see for materials preparation also S. Bellucci, A. Tiberia, G. Di Paolo, F. Micciulla, C. Balasubramanian, Emission characteristics of carbon nanotubes at large electrode distances , Journal of Nanophotonics, 4 (2010) 043501. [67] S. Bellucci , C. Balasubramanian , G. De Bellis , F. Micciulla , G. Rinaldi, Screening Electromagnetic Interference Effect using Nanocomposites, Macromolecular Symposia Volume 263 Issue 1, Pages 21 – 29, Special Issue: From Polymer Structure and Rheology to Process Modeling EUPOC 2007, (2007); S. Bellucci, L. Coderoni, F. Micciulla, G. Rinaldi, I. Sacco, The electrical properties of epoxy resin composites filled with CNTs and Carbon Black, Journal of Nanoscience and Nanotechnology 11 (2011) 9110-9117. [68] S. Bellucci, C. Balasubramanian, P. Borin, F. Micciulla and G.Rinaldi, CNT Composites for Aerospace Applications, Clean Technology 2007 Technical Proceedings: Cleantech Conference and Trade Show , Chapter 8: Nanoparticle Processes & Applications Pages:246 – 250 (2007), ISBN:1-4200-6382-0; S. Bellucci, L. Coderoni, F. Micciulla, G. Rinaldi, I. Sacco, Mechanical and electrical characterization of polymer nanocomposites with carbon nanotubes, Nanoscience and Nanotechnology Letters, Volume 3, Number 6 (December 2011), 03NNL06-1248. [69] G. Rinaldi, D. Rossi, Particulate composites from epoxy resin and fly-ash for the confinement of medium and low level radwastes, Polymer International , 31, 3, pages 227–233 (1993). [70] G. Rinaldi, G. Maura, Durable Glass – Epoxy composites cured at low temperatures – effects of thermal cycling, UV irradiation and wet environmental , Polymer International , 31, 3, pages 339–345 (1993). [71] John V. Accorsi, Impact of morphology and dispersion of carbon black on the weather resistance of polyethylene, Paper given at the International Wire & Cable Symposium, Atlantic City, November 18, (1999) KGK Kautschuk Gummi Kunststoffe 54. Jahrgang, Nr. 6/(2001). [72] <http://www.sonifier.com>, sonifier products, Branson ultrasonics corp (accessed June 2010). [73] Peng-Cheng Ma, Naveed A. Siddiqui , Gad Marom , Jang-Kyo Kim, Dispersion and functionalization of carbon nanotubes for polymer-based nanocomposites: A review, Composites: Part A 41 (2010) 1345–1367 [74] Science of Fullerenes and Carbon Nanotubes, M. Dresselhaus, G. Dresselhaus, and P. C. Eklund, Academic Press, San Diego (1996). [75] Scott Kirkpatrick, Percolation and Conduction, Rev. Mod. Phys. 45, 574–588 (1973). [76] C. A. Martina, J. K. W. Sandler, M. S. P. Shaffer, M.-K. Schwarz, W. Bauhofer, K. Schulte and A. H. Windle, Formation of percolating networks in multi-wall carbon-nanotube–epoxy composites, Composites Science and Technology , 64, 15, pages 23092316 (2004). [77] L. Valentini, D. Puglia, E. Frulloni, I. Armentano , J.M. Kenny and S. Santucci, Dielectric behavior of epoxy matrix/singlewalled carbon nanotube composites, Composites Science and Technology, 64, 1, pages 23-33 (2004). [78] Moniruzzaman M, Winey KI, Polymer nanocomposites containing carbon nanotubes, Macromolecules,39, pages 5194– 205(2006). [79] Bauhofer W, Kovacs JZ, A review and analysis of electrical percolation in carbon nanotube polymer composites, Compos Sci Techno, l, 69, pages 1486–98(2009). [80] Sandler J, Shaffer MSP, Prasse T, Bauhofer W, Schulte K, Windle AH, Development of a dispersion process for carbon nanotubes in an epoxy matrix and the resulting electrical properties, Polymer, 40, pages5967–71(1999). [81] Sandler JKW, Kirk JE, Kinloch IA, Shaffer MSP, Windle AH. Ultra-low electrical percolation threshold in carbon–nanotubeepoxy composites, Polymer, 44, pages 5893–9(2003). [82] Zdenko Spitalsky, Dimitrios Tasis, Konstantinos Papagelis, Costas Galiotis, Carbon nanotube–polymer composites: Chemistry, processing, mechanical and electrical properties, Progress in Polymer Science, 35, pages 357–401(2010). 34 Rivista Italiana di Compositi e Nanotecnolgie – Volume 7, n°1 Aprile 2012 [83] Ning Hu, The electrical properties of polymer nanocomposites with carbon nanotube fillers, Nanotechnology 19, 215701 (2008); [84] Collins GP, Different stripes – physicists struggle to explain high-temperature superconductivity, Sci Am., 283, 3(2000). [85] Li C, Thostenson ET, Chou TW, Effect of nanotube waviness on the electrical conductivity of carbon nanotube-based composites, Compos Sci Technol, 68, pages1445–52(2008). [86] Li CY, Thostenson ET, Chou TW, Dominant role of tunneling resistance in the electrical conductivity of carbon nanotubebased composites, Appl Phys Lett , 91(2007). [87] Valdes LB, Effect of electrode spacing on the equivalent base resistance of point-contact transistors, In: Proceedings of the IRE, p. 1429–34, (1952). [88] Martin CA, Sandler JKW, Windle AH, Schwarz M-K, Bauhofer W, Schulte K, Shaffer MSP. Electric field-induced aligned multi-wall carbon nanotube networks in epoxy composites. Polymer, 46(3), pages 877-86(2005). [89] Z. Ounaies, C. Park, K.E. Wise, E.J. Siochi, J.S. Harrison, Electrical properties of single wall carbon nanotube reinforced polyimide composites, Composites Science and Technology, 63,pages 1637–1646(2003). [90] M. Foygel, R. D. Morris, D. Anez, S. French and V. L. Sobolev, Theoretical and computational studies of carbon nanotube composites and suspensions: Electrical and thermal conductivity, Physical Review B 71, 104201 (2005). [91] Y. Yu, G. Song, and L. Sun, Determinant role of tunneling resistance in electrical conductivity of polymer composites reinforced by well dispersed carbon nanotubes, Journal of Applied Physics 108, 084319 (2010). [92] J. G. Simmons, Generalized formula for the electric tunnel effect between similar electrodes separated by a thin insulating film, Journal of Applied Physics 34, 6 (1963). [93] Ning Hu, Yoshifumi Karube, Cheng Yan, Zen Masuda, Hisao Fukunaga, Tunneling effect in a polymer/carbon nanotube nanocomposite strain sensor, Acta Materialia 56, pages 2929–2936 (2008). [94] Marco T. Connor, Saibal Roy, Tiberio A. Ezquerra and Francisco J. Balta´ Calleja, Broadband ac conductivity of conductorpolymer composites, Phys. Rev. B 57, 2286–2294 (1998). [95] N. F. Mott, Philos. Mag. 19, 835 (1969) [96] Wolfgang Bauhofer , J Kovacs, A review and analysis of electrical percolation in carbon nanotube polymer composites, Composites Science and Technology, 69, 10, pages 1486-1498, CNT-NET 07 Special Issue with regular papers (2009). [97] Onsager L., The Effects of shape on the interactions of colloidal particles, Ann NY Acad Sci 1949;51:627–59. [98] Balberg I, Anderson CH, Alexander S, Wagner N, Excluded volume and its relation to the onset of percolation, Phys Rev B, 30(7),3933–43(1984). [99] Huijbregts, L.J, Charge transport and morphology in nanofillers and polymer nanocomposites, Technische Universiteit Eindhoven, Eindhoven, the Netherlands (2008). ISBN 978-90-386-1195-2 [100] Chunyu Li, Erik T. Thostenson and Tsu-Wei Chou, Effect of nanotube waviness on the electrical conductivity of carbon nanotube-based composites, Composites Science and Technology, 68, 6, pages 1445-1452(2008). [101] Kovacs JZ, Velagala BS, Schulte K, Bauhofer W. Two percolation thresholds in carbon nanotube epoxy composites. Compos Sci Technol, 67,(5), pages 922-8(2007). [102] Iosif D. Rosca, Suong V. Hoa, Highly conductive multiwall carbon nanotube and epoxy composites produced by three-roll milling, Carbon, 47,pages 1958 –1968, (2009). [103] Florian H. Gojny, Malte H.G. Wichmann, Bodo Fiedler, Ian A. Kinloch, Wolfgang Bauhofer, Alan H. Windle, Karl Schulte, Evaluation and identification of electrical and thermal conduction mechanisms in carbon nanotube/epoxy composites, Polymer, 47, pages 2036–2045, (2006). [104] Kim YJ, Shin TS, Choi HD, Kwon JH, Chung YC, Yoon HG, Electrical conductivity of chemically modified multiwalled carbon nanotube/epoxy composites, Carbon, 43, pages 23-30(2005). [105] Fu M, Yu Y, Xie JJ, Wang LP, Fan MY, Jiang SL, Zeng YK, Significant influence of film thickness on the percolation threshold of multiwall carbon nanotube/low density polyethylene composite films, Appl Phys Lett, 94:012904, (1-3)( 2009). 35 Rivista Italiana di Compositi e Nanotecnolgie – Volume 7, n°1 Aprile 2012 [106] R. Coelho, Fundamental studies in engineering 1- Physics of Dielectrics for the Engineer, Elsevier Scientific Publishing Company(1979) [138] J. C. Maxwell Garnett, Philos. Trans. R. Soc. London, Ser. A 203,385 (1904). [107] C. J. Kerr, Y. Y. Huang, J. E. Marshall, and E. M. Terentjev, Effect of filament aspect ratio on the dielectric response of multiwalled carbon nanotube composites, Journal of Applied Physics 109, 094109 (2011) [108] Chung DDL, Electromagnetic interference shielding effectiveness of carbon materials,Carbon,39, pages 279 – 85(2000). [109] Lu G, Li X, Jiang H, Electrical and shielding properties of ABS resin filled with nickel-coated carbon fibers, Compos Sci Technol, 56, 193 – 200(1996). [110] Sadchikov VV, Prudnikova ZG, Amorphous materials in electromagnetic shields, Stal’,4:, pages 66–9(1997). [111] Grimes CA, EMI shielding characteristics of permalloy multi layer thin film In: IEEE Aerospace Applications Conf Proc., IEEE, Computer Society Press Los Alamitos, California, USA: IEEE, 1994, pp. 211–21. Plastics Engineers, pages 1492–8(1997). [112] Biter WJ, Jamnicky PJ, Coburn W. In: 7th International SAMPE Electronics Conference, Shielding improvement use of thin multilayer films, vol. 7, Covina, California, USA: SAMPE, pages 234–42(1994). [113] Yang YL, Gupta MC, Dudley KL, Lawrence RW, A comparative study of EMI shielding properties of carbon nanofiber and multi-walled carbon nanotubi filled polymer composites, J Nanoscience Nanotechnol, 5, pages 927 – 31(2005). [114] Chung DDL, Materials for electromagnetic interference shielding, J Mater Eng Perform, 9, pages 350 – 4(2000). [115] Thomassin J-M, Pagnoulle C, Bednarz L, Huynen I, Jerome R, Detrembleur C, Foams of polycaprolactone/MWNT nanocomposites for efficient EMI reduction, J Mater Chem,18,pages 792- 6(2008). [116] Li N, Huang Y, Du F, He X, Lin X, Gao H, et al, Electromagnetic interference (EMI) shielding of single-walled carbon nanotube epoxy composites, Nano Lett , 6, pages 1141 – 5(2006). [117] Limeng Chen, Rahmi Ozisik, Linda S. Schadler, The influence of carbon nanotube aspect ratio on the foam morphology of MWNT/PMMA nanocomposite foams, Polymer 51, pages 2368 - 2375(2010). [118] Wern-Shiarng Jou, Huy-Zu Cheng, Chih-Feng Hsu, The electromagnetic shielding effectiveness of carbon nanotubes polymer composites, Journal of Alloys and Compounds 434–435, pages 641–645, (2007). [119] Yang Y. L., Gupta, M. C Dudley K. L., Lawrence, R. W., Novel Carbon Nanotube −Polystyrene Foam Composites for Electromagnetic Interference Shielding, Nano Lett. 5,page 2131(2005). [120] Yang Y. L., Gupta, M. C Dudley K. L., Lawrence, R. W.,Electromagnetic interference (EMI) shielding of single-walled carbon nanotube epoxy composites, J. Nanosci. Nanotechnol. 5, 927(2005). [121] Kim, H. M., Kim, K. Lee, C. Y.; Joo, J., Cho, S. J., Yoon, H. S. Pejakovic, D. A.; Yoo, J. W.; Epstein, A, Electrical conductivity and electromagnetic interference shielding of multiwalled carbon nanotube composites containing Fe catalyst, J. Appl. Phys. Lett. 84, 589(2004). [122] Che RC, Peng LM, Duan XF, Chen Q, Liang XL, Microwave absorption enhancement and complex permittivity and permeability of Fe encapsulated within carbon nanotubes., Adv Mater, 16(5), pages401-5( 2004 ). [123] C.A. Grimes, C. Mungle, D. Kouzoudis, S. Fang, P.C. Eklund, The 500 MHz to 5.50 GHz Complex Permittivity Spectra of Single-Wall Carbon Nanotube-Loaded Polymer Composites, Chemical Physics Letters, 319, 5-6, pages 460-464 (2000). [124] Ning Li, Yi Huang, Feng Du, Xiaobo He, Xiao Lin, Hongjun Gao, Yanfeng Ma, Feifei Li, Yongsheng Chen, and Peter C. Eklund, Electromagnetic Interference (EMI) Shielding of Single-Walled Carbon Nanotube Epoxy Composites, Nano Lett., 6, 6 (2006). [125] Ning Li, Yi Huang, Feng Du, Xiaobo He, Xiao Lin, Hongjun Gao, Yanfeng Ma, Feifei Li, Yongsheng Chen, and Peter C. Eklund, The influence of single-walled carbon nanotube structure on the electromagnetic interference shielding efficiency of its epoxy composites, Carbon 45(8): 1614–1621, (2007). 36 Rivista Italiana di Compositi e Nanotecnolgie – Volume 7, n°1 Aprile 2012 BREVE BIOGRAFIA DELL’AUTORE Dr. Stefano Bellucci , obtained in 1986 his Ph.D. in Physics of elementary particles at SISSA, Trieste, Italy. He worked as a Research Associate at Brandeis Univ., Waltham, MA, USA (1983-1985); as a visiting researcher at M.I.T., Cambridge, MA, USA (1985-1986); as a visiting researcher at the Univ. of Maryland, USA (1986-1987); as a visiting researcher at the Univ. of California at Davis, USA (1987-1988). He was appointed as a Tenured Researcher (Research Staff) at INFN (Istituto Nazionale di Fisica Nucleare) Laboratori Nazionali di Frascati in 1987. He was appointed as a First Researcher (Senior Research Staff), at the same Institute in 2005. He currently coordinates all theoretical physics activities at his Institution in Frascati. He is a member of the Laboratory Council of INFN Laboratori Nazionali di Frascati, participating to the activities of the Council and providing scientific and managerial advice to the Laboratory Director. He is a member of the INFN-LNF Committee for organizing and managing General Seminar and Laboratory Scientific Colloquia. His research interests include theoretical physics, condensed matter, nanoscience and nanotechnology, nanocarbon based composites, biomedical applications. His lab has cultivated more than 10 between PhD students and master students in the fields of theoretical physics, condensed matter, nanoscience and nanotechnology. His scientific contributions to the community include (i) supersymmetric mechanics, (ii) black holes in supergravity, (iii) toxicity of nanomaterials, (iv) pion polarizabilities, (v) gravitational waves. He has published over 300 papers in peer-reviewed journals (with h = 34), and more than 10 invited book chapters. He is the Editor of 7 books with Springer. He appears in the list of Top Italian Scientists published by the VIA Academy. Since March 2007 he lectures on Nanotechnology for Occupational Physicians at the Postgraduate Course On Occupational Health And Safety In The Workplace, organized by the International Training Centre Of The International Labour Organization of the United Nations in Turin, Italy. Dr. Bellucci was the recipient of the B.W. Lee Prize at the Erice School of Subnuclear Physics (Erice, Italy) 1982. In 1980 he was selected as a Summer student at CERN (Geneva). The paper "Spin currents polarization in low dimensional nanostructures" by S.Bellucci, F.Corrente and P.Onorato was awarded the Best Communication Prize in Section II: Condensed Matter Physics at the “XCIII National Congress Italian Physical Society” Pisa, 24 - 29 September 2007. Dr. Bellucci serves as the Editorial Board Member of the Springer Lecture Notes in Nanoscale Science and Technology, as well as the Editorial Board Member of the Global Journal of Physics Express, and the Journal of Physics & Astronomy. Engineer Federico Micciulla is a contractor researcher at Frascati National Laboratories – Italian National Institute of Nuclear Physics. He obtained his Master degree in 2007 in Aerospace Engineering at University of Rome “La Sapienza”. He has worked in Nanotechnology field on Carbon Nanotubes and their applications since 2005 at Frascati National Laboratories - INFN. He has focused on their skill on characterization of nanomaterials using several techniques, mainly electron microscopy. Because of that, he has attended several courses on these topics : Scanning Electron Microscope; Transmission Electron Microscope; Atomic Force Microscope. He has job experiences in different laboratories in Italy and outside like: Brookhaven National Laboratory (Upton-New York, USA); National Institute for Research and Development in Micro-technologies (Bucharest, Romania); Synchrotron Light Laboratory: ELETTRA. Member of Italian Society for Microscopical Sciences (SIMS) and European Microscopy Society (E.M.S.). Member of European Microwave Association (EuMA). He has published over 20 papers in peer-reviewed journals. He is a co author of a chapter of Book “The Nanomechanics In Italy”, Research Signpost (Ind), PUGNO N. Editor ,2007 - ISBN: 978-81-308-0237-4. 37 Rivista Italiana di Compositi e Nanotecnolgie – Volume 7, n°1 Aprile 2012 Studio delle proprietà meccaniche di compositi rinforzati con nanotubi in carbonio mediante un nuovo approccio numerico misto Antonio Pantano Università degli Studi di Palermo Dipartimento di Ingegneria Industriale, Edificio 8 - viale delle Scienze, 90128, Palermo, ITALY Tel: +39 091-6657142 e- mail: [email protected], [email protected] ________________________________________________________________________________________________ SOMMARIO / ABSTRACT Sommario I CNTs primeggiano in rigidezza, resistenza a rottura, resilienza, allungamento a rottura, conducibilità termica e conducibilità elettrica. Un modo di avvantaggiarsi delle loro singolari proprietà consiste nell’incorporarli in una matrice per costruire materiali compositi nanostrutturati. Questo articolo presenta un nuovo modello misto, numerico-analitico, che consente di prevedere le caratteristiche elastiche di nanocompositi con distribuzione random dei CNTs, tenendo conto della curvatura che gli stessi mostrano quando sono immersi nel polimero. L’approccio ibrido rappresenta un’apprezzabile evoluzione della modellazione micromeccanica e può essere applicato a qualsiasi composito nanostrutturato. Abstract CNTs have superior stiffness, strengh to failure, thermal and electrical conductivity. One way to take advantage of their incredible properties consists in incorporating them in a matrix to build nanostructured composite materials. Here we present a mixed model, numerical-analytical, that allows predicting the elastic properties of the nanocomposites with random distribution of CNTs, keeping into account of the curvature that they show when immersed into the polymer. The hybrid approach is a significant evolution over the micromechanical modeling and can be applied to every nanostructured composites. 1. INTRODUZIONE Nell’ultimo decennio i nanotubi di carbonio (CNTs) hanno attratto l’interesse della comunità scientifica internazionale e dell’industria a causa delle loro eccezionali caratteristiche [1-3]. I CNTs primeggiano in rigidezza, resistenza a rottura, resilienza, allungamento a rottura, conducibilità termica e conducibilità elettrica. Un modo di avvantaggiarsi delle loro singolari proprietà consiste nell’incorporarli in una matrice per costruire materiali compositi nanostrutturati. I migliori candidati per questo compito sono indubbiamente i polimeri, che grazie alla loro resistenza, resilienza, leggerezza e facilità produttiva, sono stati usati in un’ampia varietà di applicazioni industriali. Tuttavia la realizzazione di nanocompositi a matrice polimerica che sfruttassero al meglio le straordinarie proprietà dei CNTs ha presentato fin dai primi tentativi dei problemi di non facile soluzione. In questo compito possono essere di valido aiuto i modelli numerici. Il potenziale dei nanotubi di carbonio come strutture di rinforzo, dipende principalmente dall’abilità nel disperderli all’interno della matrice in modo omogeneo e sulla capacità di trasferire il carico meccanico dalla matrice ai nanotubi. Se i nanotubi sono aggregati in strutture di dimensioni superiori, a seguito della deformazione della matrice si disgregheranno in agglomerati più piccoli con scarso contributo alla rigidezza del composito. Quando l’adesione interfacciale tra le fasi è debole, il carico non viene trasferito al nanotubo che non potrà svolgere la sua azione di rinforzo. Inoltre, i nanotubi si comportano come buchi o difetti nanostrutturati, introducendo concentrazioni di tensioni localizzate e annulandone i potenziali benefici. Queste difficoltà ostacolano la realizzazione dei nanocompositi ad alte prestazioni basati sui CNTs. In conseguenza, nonostante qualche incoraggiante risultato [per esempio, 4], vi sono molti esperimenti che dimostrano miglioramenti solamente modesti in resistenza e rigidezza del polimero a seguito dell’incorporazione dei CNTs [per esempio, 5-7]. Andrews e colleghi [5] hanno realizzato un composito polystyrene/CNTs e testato le sue proprietà meccaniche. Essi hanno ottenuto un limitato incremento del 15% nel modulo elastico rispetto alla pura matrice e un decremento della resistenza meccanica per una concentrazione del 5% in volume di nanotubi del tipo a parete multipla. Xia e colleghi [6] hanno preparato un composito polipropilene (PP)/CNTs dove una buona dispersione è ottenuta utilizzando un innovativo processo 38 Rivista Italiana di Compositi e Nanotecnolgie – Volume 7, n°1 Aprile 2012 di polverizzazione nanomeccanica. Si è riscontrato solo un modesto incremento del 8.8% nel modulo elastico, per un composito con un carico in peso di nanotubi di carbonio del 3%. Risultati simili sono stati trovati da Song e colleghi [7] nella misura delle proprietà meccaniche dei nanocompositi resina epossidica/CNTs con diversi livelli di dispersione. Le proprietà meccaniche del composito sono migliorate del 17% in termini di modulo di Young per una frazione in peso del 1.5%. I modesti miglioramenti nelle proprietà meccaniche sono in gran parte dovuti al debole legame all’interfaccia tra CNTs e matrice. Sono stati sviluppati dei modelli numerici [8-11] nel tentativo di migliorare la comprensione dell’effetto meccanico dei CNTs in una matrice polimerica. Questi studi si basano su modelli micromeccanici, visto che i modelli atomistici sono computazionalmente troppo dispendiosi per simulare il comportamento anche di una piccola porzione del nanocomposito. Odegard e colleghi [8] hanno sviluppato un elemento rappresentativo di volume, Representative Volume Element (RVE), realizzando con elementi asta un modello continuo del materiale composito basato sull’equilibrio della struttura molecolare ottenuta tramite simulazioni di dinamica molecolare. La relazione costitutiva della fibra trasversalmente isotropia equivalente a tale RVE sono quindi determinate applicando 5 sets di condizioni al contorno sia al modello con aste che alla fibra effettiva. Brinson e colleghi [9] hanno analizzato l’effetto della curvatura, forma ad onda, dei nanotubi di carbonio sulla loro capacità di rinforzo in un composito. Si è ricercato un valore rappresentativo che quantificasse la riduzione in rigidezza dovuta alla curvatura del CNT, rispetto al modulo elastico determinato dalla presenza del nanotubo dritto. L’inclusione di forma ondulatoria rappresentata dal CNT è stata studiata tramite un modello agli elementi finiti nel quale il tubo è riprodotto come tubo pieno, elastico lineare e perfettamente legato alla matrice. Una riproduzione, quindi, piuttosto semplificata della situazione reale. La forma ondulata del CNT viene introdotta assumendo per il nanotubo una forma sinusoidale. In un altro articolo [10], Brinson e colleghi utilizzano un approccio alternativo nel quale il CNT e modellato come una fibra sinusoidale infinitamente lunga. Shi e colleghi [11] hanno applicato il modello di Mori-Tanaka con la soluzione classica di Eshelby ad una matrice polimerica elastica lineare rinforzata da CNTs in essa dispersi. Ogni CNT è modellato come una lunga fibra con proprietà trasversalmente isotropiche. Diversi compositi sono stati considerati con nanotubi di varia forma e orientamento: allineati e dritti, casualmente orientati e dritti, allineati e curvi, casualmente orientati e curvi. I CNTs curvi sono stati modellati come molle elicoidali. Ognuno di questi modelli micromeccanici assume perfetta adesione tra CNTs e matrice polimerica, ipotesi che determina previsioni sulle proprietà meccaniche del composito che sono altamente ottimistiche rispetto ad i risultati sperimentali. Comunemente all’interfaccia tra nanotubi e polimero esiste solamente un’interazione di van der Waals che è in grado di produrre solo delle deboli forze attrattive normali e una resistenza allo scorrimento tangenziale quasi nulla, come è stato investigato da Frankland e colleghi [12]. Nel loro lavoro la resistenza allo scorrimento tangenziale all’interfaccia tra un CNT e una matrice polimerica, con e senza legami covalenti, è stata calcolata utilizzando simulazioni di dinamica molecolare. I modelli numerici prevedono che tale resistenza possa essere migliorata di oltre un ordine di grandezza con la formazione di legami covalenti che coinvolgano meno dell’1% degli atomi di carbonio del nanotubo. Questi legami possono essere creati utilizzando CNTs funzionalizzati, per esempio tramite pretrattamento con acidi. Tuttavia il costo già molto elevato dei CNTs cresce ulteriormente di un ordine di grandezza. Questo articolo presenta un nuovo modello misto, numerico-analitico, che consente di prevedere le caratteristiche elastiche di nanocompositi con distribuzione random dei CNTs, tenendo conto della curvatura che gli stessi mostrano quando sono immersi nel polimero. Un modello tridimensionale di un singolo CNT all’interno di una matrice infinita permette di valutare numericamente il tensore di concentrazione della deformazione a basse concentrazioni tramite un set di sette analisi agli elementi finiti per ciascuna tipologia d’inclusione presente nel composito. Un modello MoriTanaka utilizza questo tensore per prevedere il modulo elastico effettivo del nanocomposito con CNTs orientati in modo random. Questo approccio ibrido rappresenta un’apprezzabile evoluzione della modellazione micromeccanica [13-14] e può essere applicato a qualsiasi composito nanostrutturato. Per simulare il comportamento meccanico dei CNTs si è adottato un modello strutturale nonlineare precedentemente sviluppato [15], che a sua volta rappresenta una versione modificata di una metodologia conosciuta e apprezzata dalla comunità scientifica [16-19]. L’approccio per investigare la deformazione dei CNTs si basa su modelli agli elementi finiti accuratamente sviluppati in base alla conoscenza dalla distribuzione spaziale degli atomi nella struttura del nanotubo e alla natura dei legami interatomici. Nel modello le proprietà del nanotubo si aggiornano in dipendenza dello stato di deformazione sentito localmente. Per modellare l’interfaccia nanotubomatrice sono state opportunamente implementate nel modello le interazioni che possono essere sia di tipo attrattivo, dovute alle forze di van der Waals, che di tipo repulsivo dovute al principio di esclusione di Pauli. La nuova metodologia è stata convalidata tramite il confronto con i risultati di esperimenti di laboratorio su compositi resina epossidica-CNTs. I risultati sperimentali ottenuti sono in totale accordo con i valori predetti mediante l’impiego del nuovo modello numericoanalitico. 2. MODELLO NUMERICO-ANALITICO L’approccio proposto nella presente trattazione è un modello misto, numerico-analitico, che consente di prevedere le caratteristiche elastiche di nanocompositi a matrice polimerica con distribuzione random dei nanotubi di carbonio, tenendo conto della curvatura che gli stessi mostrano quando sono immersi nel polimero, osservabile 39 Rivista Italiana di Compositi e Nanotecnolgie – Volume 7, n°1 Aprile 2012 da immagini micrografiche ad elevata risoluzione. Il modello propone una soluzione efficace alla complessa problematica della caratterizzazione di nanocompositi mediante l’impiego di un calcolatore e di un codice FEM. Tale modello consta essenzialmente di due sezioni: la prima strettamente numerica e la successiva analiticoteorica. La parte numerica consiste nella conduzione di un set di sette analisi agli elementi finiti da eseguire mediante uno qualsiasi dei codici di calcolo disponibili sul mercato. La parte analitico-teorica consiste nell’elaborare i dati, costituenti l’output delle analisi agli elementi finiti, secondo quanto previsto dal metodo MoriTanaka, strumento analitico estremamente attendibile per la predizione del comportamento elastico dei compositi. (a) 2.1. Metodo Mori-Tanaka Il metodo Mori-Tanaka consente la determinazione della matrice di rigidezza di un materiale composito costituito da N fasi disposte in maniera random nello spazio tridimensionale [20]. Ciascuna fase rappresenta una tipologia di inclusione avente data geometria e proprietà elastiche. La matrice di rigidezza del composito multifase è calcolabile dalla seguente espressione: N −1 N −1 C = f 0 ⋅ C0 + ∑ f r ⋅ {Cr ⋅ Ardil } ⋅ f 0 ⋅ I + ∑ f r ⋅ { Ardil } r =1 r =1 (1) (2) La determinazione analitica della matrice Ardil è possibile mediante la seguente relazione: Ardil = I + S r ⋅ C0−1 ⋅ ( Cr − C0 ) −1 fig. 1 - (a) Disposizione dei nanotubi all’interno della matrice polimerica. Immagine ottenuta mediante microscopio SEM. (b) Uno dei provini in resina epossidica-MWNTs utilizzato per le prove di flessione a tre punti. −1 dove C è la matrice di rigidezza del composito ad N fasi, C0 è la matrice di rigidezza della resina, Cr è la matrice di rigidezza della r-esima inclusione, Ardil è la matrice di correlazione della r-esima inclusione, I è la matrice identità, f0 è la frazione di volume della resina, fr è la frazione di volume della r-esima inclusione. La matrice Ardil correla le deformazioni medie sentite dalla r-esima inclusione con quelle medie sentite dalla resina circostante, secondo quanto di seguito riportato: ε r = Ardil ⋅ ε 0 (b) (3) dove la matrice Sr rappresenta il tensore di Eshelby, la cui forma è esprimibile in forma chiusa solo per inclusioni aventi geometria semplice (inclusioni sferiche, ellissoidali, etc…). Nel presente lavoro la matrice Ardil è determinabile per via numerica mediante la conduzione di un opportuno set di analisi agli elementi finiti. Nel caso dei provini CNTs-matrice polimerica di nostra realizzazione, indagini condotte al microscopio SEM mostrano che la disposizione dei nanotubi, inglobati dal polimero, è ben approssimabile mediante rappresentazione sinusoidale, si veda ad esempio Figura 1 (a). Numerose immagini ottenute al microscopio SEM sui provini da noi realizzati mostrano inoltre che la popolazione dei nanotubi nei nostri provini è ben rappresentata da un’inclusione equivalente avente andamento sinusoidale caratterizzato dai seguenti parametri geometrici: lunghezza d’onda λ=800nm, ampiezza 200 nm, diametro esterno 30 nm, diametro interno 15 nm, numero di sinusoidi n=2. L’espressione (1) particolarizzata al caso di una sola inclusione equivalente diviene: ( )( ) C = f0 ⋅ C0 + f1 ⋅ {C1 ⋅ A1dil } ⋅ f0 ⋅ I + f1 ⋅ { A1dil } −1 (4) Le quantità racchiuse entro parentesi graffa {} devono essere sottoposte alla procedura di randomizzazione, per mezzo della quale è possibile tenere in conto la disposizione random dei nanotubi inglobati nel polimero. Di seguito, per brevità di esposizione, si riporta solamente la procedura numerica mediante cui effettuare la randomizzazione delle grandezze d’interesse. L’operazione di randomizzazione nello spazio 3D, può essere facilmente suddivisa in due operazioni da eseguire l’una di seguito all’altra. La prima denotata con il seguente simbolo { }TI e riassumibile nelle seguenti espressioni: X TI = { X }TI TI X 11TI = X 22 = (5) 3 ⋅ X 11 + X 12 + X 21 + 3 ⋅ X 22 + 2 ⋅ ζ ⋅ X 66 8 TI X 33 = X 33 TI TI X 44 = X 55 = (6) (7) X 44 + X 55 2 (8) 40 Rivista Italiana di Compositi e Nanotecnolgie – Volume 7, n°1 Aprile 2012 X 11 − X 12 − X 21 + X 22 + 2 ⋅ ζ ⋅ X 66 (9) 4⋅ζ X + 3 ⋅ X 12 + 3 ⋅ X 21 + X 22 − 2 ⋅ ζ ⋅ X 66 TI (10) X 12TI = X 21 = 11 8 X + X 23 TI X 13TI = X 23 = 13 (11) 2 X + X 32 TI TI (12) X 31 = X 32 = 31 2 dove ζ = 1 per X = Cr ⋅ Ardil e ζ = 2 per X = Ardil . TI X 66 = La seconda denotata con il seguente simbolo { }3D e sola delle sei deformazioni ε p , di valore noto, imposto dall’esterno mediante assegnazione di un opportuno campo di spostamenti alle superfici esterne dell’EVR tale che le rimanenti deformazioni siano nulle e che quella d’interesse abbia il valore desiderato. Risolta l’analisi, in fase di post-processing è possibile calcolare le deformazioni medie sentite dal nanotubo usufruendo della seguente relazione: ∫ε εi = V riassumibile nelle seguenti espressioni: X 3 D = { X TI } 3D X 3D 11 =X 3D 22 = {{ X }TI } =X = 8 ⋅ X 11 + 2 ⋅ X 13 + 2 ⋅ X 31 + 3 ⋅ X 33 + 4 ⋅ ζ ⋅ X 44 15 3D 3D 3D 3D X 12 = X 21 = X 13 = X 313D = X 23 = X 323 D = (14) X + 5 ⋅ X 12 + 4 ⋅ X 13 + 4 ⋅ X 31 + X 33 − 2 ⋅ ζ ⋅ X 44 = 11 15 3D X − X 123 D 3D 3D 3D X 44 = X 55 = X 66 = 11 ζ (15) = (16) L’equazione (4) mostra come per il calcolo della matrice di rigidezza del nanocomposito sia necessaria la conoscenza della matrice di correlazione A1dil e della matrice di rigidezza dell’inclusione equivalente C1 . La determinazione di tali grandezze è stata ottenuta per via numerica mediante un set di sei analisi agli elementi finiti per il calcolo della matrice A1dil e di un’ulteriore analisi ausiliaria per il calcolo della matrice C1 , secondo quanto di seguito riportato. Determinazione della matrice di correlazione A1dil Riscrivendo in forma esplicita l’equazione (2), si ottiene la seguente: ε r11 A11 ε r 22 A21 ε r 33 A31 = ε r 23 A41 ε r13 A51 ε r12 A61 A12 A13 A14 A15 A22 A32 A23 A33 A24 A34 A25 A35 A42 A52 A43 A53 A44 A54 A45 A55 A62 A63 A64 A65 A16 ε 011 A26 ε 022 A36 ε 033 ⋅ A46 ε 023 A56 ε 013 A66 ε 012 ⋅ dV ∫ dV V (13) 3D 3D 33 i ∑ε ⋅ v ≈ ∑v i j j j r ∈ [1...6 ] j Per ciascuna delle sei analisi, l’espressione (18) consente di determinare tutte e sei le deformazioni medie sentite dal nanotubo e conseguentemente tutti i termini della matrice A1dil mediante la seguente espressione: Aip = εi εp p ∈ [1...6] (19) Determinazione della matrice di rigidezza dell’inclusione equivalente C1 Si suppone che l’inclusione abbia macroscopicamente comportamento isotropo e sia quindi caratterizzata da un coefficiente di Poisson v = 0.19, verificato sperimentalmente per i CNTs, ed un modulo di Young equivalente E eq, che tenga conto della presenza di una curvatura non nulla, dal momento che il nanotubo presenta un andamento sinusoidale. La determinazione del modulo di Young equivalente Eeq è ottenuta mediante la conduzione di un’analisi agli elementi finiti, nella quale il nanotubo è sollecitato longitudinalmente al fine di valutare la rigidezza complessiva del treno di sinusoidi che lo costituiscono. 2.2. Costruzione del modello FEM Geometria dell’EVR (17) L’equazione (17) mostra che per la completa conoscenza della matrice A1dil occorre determinare 36 coefficienti indipendenti del tipo Aip . A tal fine è stato messo a punto un opportuno set di sei simulazioni agli elementi finiti da condurre su un elemento rappresentativo di volume (EVR) del materiale in esame, costituito essenzialmente dal nanotubo immerso nella resina circostante. In ciascuna delle sei simulazioni l’EVR è soggetto ad una (18) j fig. 2 - Elemento rappresentativo di volume. 41 Rivista Italiana di Compositi e Nanotecnolgie – Volume 7, n°1 Aprile 2012 Il modello da costruire è un elemento rappresentativo di volume (EVR), costituito da un CNT avente andamento sinusoidale immerso in un cubo di resina epossidica che rappresenta la matrice circostante l’inclusione. Il CNT e la matrice costituiscono due elementi separati che interagiscono lungo l’interfaccia mediante la presenza di elementi di contatto. La Figura 2 mostra l’elemento rappresentativo di volume. La matrice che circonda il nanotubo deve essere sufficiente a far sì che il nanotubo stesso non risenta della presenza di effetti di bordo durante la fase di carico, nella quale viene imposto un determinato campo di spostamenti alle superfici esterne del cubo affinché si generi lo stato di deformazione desiderato. A tal fine occorre che le estremità del nanotubo siano sufficientemente distanti dalle facce esterne del cubo di resina. Il parametro da tener sotto controllo è la frazione di volume occupata dal nanotubo nell’EVR. Affinché le simulazioni risultino veritiere tale parametro dovrà rispettare la condizione: f CNT ≤ 0.05% . Modello costitutivo della resina La matrice è globalmente isotropa ed è caratterizzata da un comportamento lineare-elastico. Per tale modello di comportamento è necessario specificare le seguenti costanti elastiche del materiale, nel nostro studio la resina utilizzata per la realizzazione dei provini possiede le seguenti caratteristiche: modulo di Young Em=3620 MPa e coefficiente di Poisson v = 0.39 . Nanotubo di carbonio Il modello utilizzato è reperibile in letteratura [15] sotto la dicitura “EOR model” intendendo per EOR l’acronimo di “Equivalent Orthotropic Representation”. Il modello EOR si avvale di una rappresentazione micro-meccanica, secondo la quale i piani d’ortotropia sono allineati con le direzioni radiale r, tangenziale θ ed assiale z del nanotubo. Svolgendo puntualmente le pareti cilindriche, è possibile costruire un elemento di volume rappresentativo di un punto materiale, affinché, a partire da esso, sia possibile stimare le proprietà meccaniche equivalenti del nanotubo di carbonio. Il materiale rappresentato mediante il modello EOR può essere trattato come un microlaminato composito costituito dall’alternanza di strati di grafene e porzioni di spazio vuoto. Applicando la classica regola delle miscele (ROM) è possibile determinare analiticamente le proprietà equivalenti dell’intera microstruttura. L’imposizione delle condizioni d’equilibrio e compatibilità, nelle configurazioni di carico considerate, consente di calcolare le effettive proprietà del composito che sono a loro volta funzioni delle proprietà dei singoli fogli, costituenti il nanotubo, e della loro frazione di volume. Per una descrizione completa e dettagliata del modello EOR si rimanda il lettore alla referenza [15]. Tutte le equazioni descrittive del modello EOR sono state implementate in linguaggio FORTRAN, mediante compilazione di una subroutine da rendere parte integrante dell’analisi agli elementi finiti. Modello di contatto Il modello impiegato per la descrizione del contatto nanotubo-matrice in direzione normale prevede la possibilità di trasmettere forze locali d’attrazione tra il nanotubo e la matrice simulando in tal modo l’adesione tra i due materiali. Durante ciascun incremento di carico la tensione di trazione all’interfaccia nanotubo-matrice dovrà superare il valore pmin affinché le due superfici si separino e si perda in tal modo il contatto tra di esse. La tensione di trazione pmin, nel caso in esame, è stata posta pari alla massima tensione di trazione che può avere luogo tra le pareti del MWCNT. Essa è ricavabile dal calcolo del minimo della legge che descrive l’andamento della pressione in funzione della distanza tra le pareti: p= ψ 6 c 10 c 4 ⋅ 0 − 0 c c (20) N dove ψ = 3.65 ⋅ 10 2 e c0 = 0.34 [ nm] . nm Dal calcolo del minimo dell’espressione (20) si ottiene: N pmin = −1.98152 ⋅ 10 −9 2 nm −8 Modalità di deformazione Secondo quanto detto, per la determinazione della matrice di correlazione, è necessario che l’EVR sia separatamente sottoposto alle tre deformazioni (ε11, ε22, ε33) ed ai tre scorrimenti (ε12, ε13, ε23). Determinazione del modulo di Young equivalente del MWNT La determinazione del modulo di Young equivalente dell’inclusione è eseguita vincolando del tutto una delle due superfici d’estremità ed applicando alla rimanente uno spostamento noto (nel caso in esame si è scelto di u1 = 10 nm). Dalla misura della operare con deformazione media ε media secondo la direzione assiale del nanotubo e della corrispondente forza di reazione F che si desta all’incastro a seguito dello spostamento imposto, è possibile ricavare il modulo di Young equivalente Eeq . Determinazione numerica del tensore di Eshelby La fase di post-processing consiste nell’elaborazione dei risultati riportati nei files di report delle analisi agli elementi finiti. Dalle elaborazioni in ambiente MATLAB® è stato ottenuto il seguente risultato numerico: A1dil 0.1495 0.1053 -0.1123 0.0004 0.0001 0.0131 0.1504 0.1449 -0.0980 0.0003 0.0000 -0.0139 -0.1668 -0.1167 0.2930 -0.0009 -0.0003 0.0012 = 0.0007 0.0007 0.0008 0.2574 -0.0001 0.0005 0.0002 -0.0002 0.0006 0.0000 0.2759 -0.0007 -0.0058 0.0003 -0.0009 0.0002 0.0009 0.0957 (21) Il tensore di Eshelby S1 è legato alla matrice di correlazione A1dil dalla relazione (3) nella quale figurano le grandezze qui di seguito elencate e calcolate: 42 Rivista Italiana di Compositi e Nanotecnolgie – Volume 7, n°1 Aprile 2012 Em 1 −ν 2 m ν m ⋅ Em 1 −ν 2 m ν m ⋅ Em 1 − ν m2 C0 = 0 0 0 ν m ⋅ Em 1 − ν m2 ν m ⋅ Em 1 − ν m2 0 0 Em 1 − ν m2 ν m ⋅ Em 1 − ν m2 0 0 ν m ⋅ Em 1 − ν m2 Em 1 − ν m2 0 0 0 0 Em 2 ⋅ (1 + ν m ) 0 0 0 0 0 Em 2 ⋅ (1 + ν m ) 0 0 0 0 Em 2 ⋅ (1 + ν m ) 0 0 0 0 (22) MWNTs del 5%. La Figura 3 riporta funzione densità di probabilità di una distribuzione gaussiana dei valori del modulo di Young dei provini testati. 0.01 0.009 0.008 0.007 0.006 0.005 0.004 0.003 0.002 0.001 0 dove Em = 3620 MPa e ν m = 0.39 . Er 1 −ν 2 r ν r ⋅ E r 1 −ν 2 r ν r ⋅ E r 1 −ν 2 r C1 = 0 0 0 3900 4000 4050 4100 4150 4200 4250 4300 E[MPa] ν r ⋅ Er 1 − ν r2 ν r ⋅ Er 1 − ν r2 0 0 Er 1 − ν r2 ν r ⋅ Er 1 − ν r2 0 0 ν r ⋅ Er 1 − ν r2 Er 1 − ν r2 0 0 0 0 Er 2 ⋅ (1 + ν r ) 0 0 0 0 Er 2 ⋅ (1 + ν r ) 0 0 0 0 0 0 0 0 Er 2 ⋅ (1 + ν r ) 0 (23) dove E r = 6.0495 ⋅ 104 MPa e ν r = 0.19 . Risolvendo l’equazione (3) rispetto all’incognita S1 si ottiene: −1 −1 S1 = ( A1dil ) − I ⋅ C0−1 ⋅ ( C1 − C0 ) 3950 fig. 3 - Funzione densità di probabilità-distribuzione gaussiana dei valori del modulo di Young dei provini testati. L’equazione (4) mostra come la matrice di rigidezza del nanocomposito sia funzione solo della frazione in volume di nanotubi presenti in soluzione dal momento che tutte le altre quantità che figurano in essa sono note. Va ricordato che la procedura di randomizzazione fa sì che la matrice di rigidezza del nanocomposito assuma la forma di quella propria di un materiale isotropo secondo le tre direzioni spaziali. Nel grafico che segue in Figura 4 la linea nera mostra l’andamento del modulo di Young del nanocomposito in funzione della frazione di nanotubi V g predetto mediante l’impiego del modello numericoanalitico. I punti rappresentati in corrispondenza del valore di frazione di volume del 5% indicano i risultati sperimentali ottenuti dai provini in nanocomposito. (24) numericamente: 2.4785 -0.0576 1.1999 -0.0002 0.0010 -0.3649 -1.7092 1.0391 -0.3590 0.0001 -0.0010 0.3947 0.9281 0.5703 0.8378 0.0005 0.0004 -0.0527 S1 = -0.0056 -0.0050 -0.0055 0.1558 0.0000 -0.0010 -0.0045 -0.0004 -0.0027 -0.0000 0.1417 0.0021 0.1724 0.0015 0.0862 -0.0005 -0.0018 0.4859 (25) La conoscenza del tensore di Eshelby consente di predire l’andamento delle proprietà elastiche del nanocomposito al variare della frazione in volume di nanotubi in soluzione. 3. RISULTATI Il lotto di provini testati è composto da resina DGEBF, diglycidyl ether of bisphenol-F, e da una percentuale di fig. 4 - Andamento del modulo di Young del nanocomposito in funzione della frazione di nanotubi. La Figura 4 mostra come i risultati siano perfettamente in accordo con il valore predetto mediante l’impiego del modello numerico-analitico. Ricordando che i provini testati possiedono una percentuale in volume di nanotubi del 5%, dalla Figura 4 si vede come il modello preveda per essi un modulo di Young di 4096.8 MPa. Tale valore risulta in ottimo accordo con il valore medio del modulo di Young dei provini che è di 4097.9 MPa. 43 Rivista Italiana di Compositi e Nanotecnolgie – Volume 7, n°1 Aprile 2012 4. CONCLUSIONI Questo articolo presenta un nuovo modello misto, numerico-analitico, che consente di prevedere le caratteristiche elastiche di nanocompositi con distribuzione random dei CNTs, tenendo conto della curvatura che gli stessi mostrano quando sono immersi nel polimero. L’approccio ibrido rappresenta un’apprezzabile evoluzione della modellazione micromeccanica e può essere applicato a qualsiasi composito nanostrutturato. La nuova metodologia è stata convalidata tramite il confronto con i risultati di esperimenti di laboratorio su compositi resina epossidicaCNTs. Il modello ha consentito di investigare l’influenza della frazione di volume, occupata dai nanotubi di carbonio all’interno del composito, sulle principali caratteristiche elastiche del materiale nano rinforzato. Il modello possiede i seguenti vantaggi. L’impiego del modello EOR per la descrizione del comportamento del nanotubo consente che le proprietà del nanotubo si aggiornino in dipendenza dello stato di deformazione sentito localmente dal CNT; in tal modo è possibile tener conto della locale ortotropia del nanotubo secondo una triade cilindrica di riferimento. Il modello di contatto adottato descrive realisticamente l’interazione nanotubo-resina. L’utilizzo congiunto dei due metodi, FEM e MoriTanaka, ha consentito la messa a punto di un modello numerico-analitico che garantisce elevata attendibilità nella predizione del comportamento elastico dei nanocompositi. Il modello presentato si presta perfettamente al caso in cui si vogliano conoscere le caratteristiche elastiche di compositi costituiti da inclusioni di diversa natura (forma e materiale). In tal caso occorrerà condurre un set di sette analisi agli elementi finiti per ciascuna tipologia d’inclusione presente nel composito. BIBLIOGRAFIA 1. 2. 3. 4. 5. J.N. Coleman, U. Khan, W.J. Blau, Y.K. Gun’ko, “Small but strong: A review of the mechanical properties of carbon nanotube–polymer composites”, Carbon, 44, 2006, 1624-1652. M. Moniruzzaman, K.I. Winey, “Polymer Nanocomposites Containing Carbon Nanotubes”, Macromolecules, 39, 2006, 5194-5205. O. Breuer and U. Sundarara,. “Big Returns From Small Fibers: A Review of Polymer/Carbon Nanotube Composites”, Polymer Composites, 25, 6, 2004, 630-645. D. Qian, E.C. Dickey, R. Andrews, T. Rantell, “Load transfer and deformation mechanisms in carbon nanotube-polystyrene composites”, Appl. Phys. Lett., 76, 2000, 2868–2870. R. Andrews, D. Jacques, M. Minot, T. Rantell, “Fabrication of Carbon Multiwall Nanotube/Polymer Composites by Shear Mixing”, 6. 7. 8. 9. 10. 11. 12. 13. 14. 15. 16. 17. 18. Macromolecular Materials and Engineering, 287, 2002,395-403. H. Xia, Q. Wang, K.L., G.H. Hu, “Preparation of Polypropylene/Carbon Nanotube Composite Powder with a Solid-State Mechanochemical Pulverization Process”, Journal of Applied Polymer Science, 93, 2004, 378–386. Y.S. Song, J.R. Youn, “Influence of dispersion states of carbon nanotubes on physical properties of epoxy nanocomposites”, Carbon, 43, 2005, 1378–1385. G.M. Odegard, T.S. Gates, K.E. Wise, C. Park, E.J. Siochi, “Constitutive modeling of nanotube– reinforced polymer composites”, Compos.Sci. Technol., 63, 2003, 1671–1687. F.T. Fisher, R.D. Bradshaw, L.C. Brinson, “Fiber waviness in nanotube-reinforced polymer composites—I: Modulus predictions using effective nanotube properties”, Compos. Sci. Technol., 63, 2003, 1689–1703. R.D. Bradshaw, F.T. Fisher, L.C. Brinson, “Fiber waviness in nanotube-reinforced polymer composites—II: modeling via numerical approximation of the dilute strain concentration tensor”, Compos. Sci. Technol., 63, 2003, 1705– 1722. D. Shi, X. Feng, Y. Huang, K. Hwang, H. Gao, “The Effect of Nanotube Waviness and Agglomeration on the Elastic Property of Carbon Nanotube- Reinforced Composites”, Journal of Engineering Materials and Technology, 126, 2004, 250-257. S.J.V. Frankland, A. Caglar, D.W. Brenner, M. Griebel, “Molecular Simulation of the Influence of Chemical Cross-Links on the Shear Strength of Carbon Nanotube-Polymer Interfaces”, J. Phys. Chem. B, 106, 2002, 3046-3048. A. Pantano, F. Cappello, “Numerical model for composite material with polymer matrix reinforced by carbon nanotubes”, MECCANICA Journal of the Italian Association of Theoretical and Applied Mechanics, 43, 2008, 263-270. A. Pantano, G. Modica, F. Cappello, “Multiwalled Carbon Nanotube Reinforced Polymer Nanocomposites”. Materials Science and Engineering A, 486, 2008, 222-227. M. Garg, A. Pantano, M.C. Boyce, “An Equivalent Orthotropic Representation of the Nonlinear Elastic Behavior of Multiwalled Carbon Nanotubes”, Journal of Engineering Materials and Technology, 129, 2007, 431-439. A. Pantano, D.M. Parks, M.C. Boyce, “Nonlinear Structural Mechanics Based Modeling of Carbon Nanotube Deformation”, Phys. Rev. Lett., 91, 2003, 145504. A. Pantano, M.C. Boyce, D.M. Parks, “Mechanics of deformation of Single and Multiwall Carbon Nanotubes”, J. Mech. Phys. Solids, 52, 2004, 789821. A. Pantano, M.C. Boyce, D.M. Parks, “Mechanics and Mechanical Behavior of Carbon Nanotubes”, J. 44 Rivista Italiana di Compositi e Nanotecnolgie – Volume 7, n°1 Aprile 2012 of Eng. Materials and Technology, Trans. ASME, 126, 2004, 279-284. 19. A. Pantano, D.M. Parks, M.C. Boyce, M. Buongiorno Nardelli, “Mixed finite element-tight binding electromechanical analysis of carbon nanotubes”, J. of Applied Physics, 92, 2004, 67566760. 20. Mori T, Tanaka K, “Average stress in matrix and average elastic energy of materials with misfitting inclusions”, Acta Metallurgica, 21, 1973, 571-574. BREVE BIOGRAFIA DELL’AUTORE Il Prof. Antonio Pantano ha ottenuto un M.S. in Engineering Mechanics nel 1999 e un Ph.D. in Engineering Mechanics nel 2002 dalla Michigan State University, dove è anche stato premiato come il miglior studente del dipartimento (2000-2001). Fino al 2004 è stato ricercatore nel dipartimento di Mechanical Engineering del Massachusetts Institute of Technology (MIT). Al MIT ha lavorato su un progetto di ricerca riguardante i materiali rinforzati con nanotubi in carbonio. Nel 2004 è ritornato come professore a contratto “Rientro dei Cervelli” nel dipartimento di meccanica dell'Università degli Studi di Palermo, dove si era laureato in ingegneria meccanica prima di partire per gli USA. Il contratto di ricerca ed insegnamento “Rientro dei Cervelli” nasce da un’iniziativa del governo italiano indirizzata a promuovere il rientro in Italia di scienziati di chiara fama operanti all’estero. Dal 2007 è professore associato presso il dipartimento di meccanica, confluito recentemente nel dipartimento di ingegneria industriale. I suoi principali di settori di ricerca sono la meccanica computazionale, i metodi numerici per l'ingegneria e gli aspetti meccanici della ingegneria della micro/nanoscala. 45 Rivista Italiana di Compositi e Nanotecnolgie – Volume 7, n°1 Aprile 2012 MATERIALI SPAZIALI E CONTAMINAZIONE DA BIOFILM MICROBICI: GLI ESPERIMENTI “BIOFILM” E “VIABLE” F. Canganella1,2, G. Bianconi1,3, E. Di Mattia2,3 1 Dipartimento per l’Innovazione nei sistemi Biologici, Agroalimentari e Forestali, 2Gruppo di Ricerca in EsoAgroBiologia, e 3 Dipartimento di Scienze e Tecnologie per l’Agricoltura, le Foreste, la Natura e l’Energia; via C. de Lellis 01100 Viterbo Tel: 0761-357282; e-mail: [email protected] SOMMARIO I biofilm batterici sono complessi di cellule microbiche che si formano generalmente in condizioni ad esse avverse o in seguito all’esposizione a specifici stress. L’importanza della tematica sta nella stretta associazione che esiste tra la loro formazione e le alterazioni causate a strutture antropiche quali manufatti cementizi, condutture, beni artistici. Inoltre in campo medico spesso la loro presenza è stata evidenziata quale causa di infezioni gravi e complicazioni postchirurgiche. In questo contesto è di notevole rilievo il potenziale uso di batteri e/o di alcune molecole da essi prodotte per applicazioni in campo ambientale e medico. Tra di esse in particolare vengono descritti i biosurfattanti come sostanze dalle grandi potenzialità applicative per l’ampia gamma di proprietà e la significativa versatilità funzionale che sono in grado di esprimere. Dotati infatti di attività antimicrobiche, antivirali, antitumorali e certo di molte altre ancora da scoprire, i biosurfattanti possono diventare importanti agenti terapeutici e antibiofilmogeni. La stretta associazione tra questi ultimi e i fenomeni di biocorrosione fa ipotizzare per i biosurfattanti ulteriori applicazioni in campo ambientale, nelle biotecnologie, e persino in realtà industriali quali quelle petrolifera e spaziale. Gli esperimenti “BIOFILM” e “VIABLE” sono stati condotti nell’ambito di progetti spaziali e hanno riguardato lo studio dei materiali e il loro pretrattamento con varie sostanze al fine di ridurre o evitare le sviluppo dei biofilm microbici. Parole chiave: biofilm batterici, biosurfattanti, biotecnologie, materiali per lo spazio, MARS500, esperimento BIOFILM, esperimento VIABLE I BIOFILM BATTERICI I biofilm batterici sono aggregazioni complesse di cellule microbiche che vengono a formarsi generalmente in condizioni ad esse avverse o in seguito all’esposizione a specifici stress ambientali. Ciò contrariamente a quanto avviene in condizioni ottimali, in cui i batteri tendono a svilupparsi come forme planctoniche. In alcuni casi specifici quale quello delle “bacterial mats”, i biofilm possono assumere dimensioni ed estensioni macroscopiche, e sembra giochino un ruolo fondamentale negli ecosistemi acquatici. L’importanza dei biofilm microbici sta nella stretta associazione che esiste tra la loro formazione e le alterazioni causate a strutture antropiche quali manufatti cementizi, condutture e beni artistici. Inoltre in più occasioni la loro presenza è stata evidenziata quale causa di infezioni gravi e complicazioni post-chirurgiche; ad esempio è stato riportato che in più del 90% dei casi di infezione a carico di protesi artificiali, la causa può essere ricondotta alla formazione di biofilm da parte di Staphylococcus aureus e Staphylococcus epidermidis. L’importanza della tematica rispetto ai materiali spaziali è stata già messa in evidenza da Di Mattia et al. (2008). La formazione del biofilm come illustrato in Figura 1 non avviene come un processo casuale, ma si verifica in fasi coordinate che sono principalmente riconducibili a: i) preliminare adsorbimento di molecole organiche a fasi inorganiche di supporto (matrici solide o liquide); ii) avvicinamento delle cellule microbiche planctoniche alle molecole adsorbite; iii) adesione microbica al supporto; iv) crescita cellulare attiva con formazione di microcolonie ancorate saldamente al supporto mediante composti di neosintesi; v) morte programmata di alcune cellule e fasi di replicazione attiva del biofilm in crescita. Fig. 1 Modello di sviluppo del biofilm microbico e interazioni fisico-chimiche coinvolte (gentilmente fornita da Elena Di Mattia). Per quanto riguarda la fase di adsorbimento delle molecole organiche ai materiali di supporto, va detto che tale condizionamento interessa principalmente le fasi d’interfaccia liquido-solido in grado di attrarre e trattenere soluti e particolato fine con formazione di gradienti chimici nutrizionali localizzati su scala nanometrica. La diversa natura fisico-chimica dei 46 Rivista Italiana di Compositi e Nanotecnolgie – Volume 7, n°1 Aprile 2012 materiali può determinare variazioni nel tipo di soluto adsorbito dalla fase liquida, nel suo orientamento molecolare superficiale e nell’intensità dell’interazione di adsorbimento. I soluti organici come gli zuccheri, gli aminoacidi e gli acidi nucleici possono adsorbire sia sulle superfici solide di materiali inerti (vetro e metalli) sia sui tessuti delle mucose animali, nonché su altre superfici solide organiche (policarbonato e polistirene). L’adesione specifica delle cellule batteriche alle superfici solide è un altro momento determinante nella formazione dei biofilm. In questa fase dominano le forze di legame covalente che, operando nell’intervallo corto e su scala nanometrica (>5nm), guidano l’instaurarsi di interazioni fisico-chimiche specifiche, altamente localizzate e spazialmente confinate tra i gruppi molecolari della superficie cellulare e del substrato, stabilizzando così gli equilibri energetici interfacciali di adesione. I BIOFILM IN MEDICINA In campo medico i biofilm presentano il rischio di diventare formazioni batteriche radicate, non esistendo al momento terapie in grado di eliminarli; è stato infatti dimostrato che le cellule batteriche all’interno del biofilm risultano particolarmente resistenti a terapie antibiotiche e molto più adattabili a condizioni di stress, visto che tra di loro avvengono scambi di materiale genetico con frequenze di molto superiori alla media. Le evidenze cliniche mostrano comunemente la capacità dei microrganismi di aderire e crescere sessilmente su superfici che si comportano da substrato di tipo biologico e/o inerte. E’ importante considerare che i biofilm possono essere coinvolti in un’ampia varietà di infezioni ospedaliere e che più della metà delle malattie infettive con produzione di biofilm - le quali colpiscono gli individui moderatamente immunodepressi - interessano specie che sono commensali con l’organismo umano o comuni specie ambientali. In ambito nosocomiale le infezioni associate alla formazione dei biofilm possono riguardare le superfici dei cateteri, le protesi, i bendaggi delle ferite ed altri tipi di dispositivi medici. Frequentemente le immagini ottenute in microscopia elettronica a scansione delle superfici di materiali utilizzati in campo medico, mostrano la presenza di comunità batteriche sessili circondate da una matrice polimerica esoprodotta. In differenti contesti clinici i biofilm stessi possono agire come focolai di infezione acuta se le difese mobilitate dall’ospite non riescono ad eliminare le cellule planctoniche liberate dalla popolazione sessile. Dati sperimentali riferiti allo studio dei procarioti supportano l’ipotesi che il rilascio di cellule batteriche planctoniche da parte del biofilm possa rispondere ad un modello naturale di distacco programmato che costituisce una risposta adattativa di colonizzazione dell’ospite. Le infezioni da biofilm condividono comuni caratteristiche cliniche: si sviluppano preferibilmente su superfici inerti; si presentano solitamente su dispositivi medici e frammenti di tessuto morto o di osso in necrosi; possono tuttavia anche formarsi su tessuti vivi come nel caso dell’endocardite. Diversi fattori contribuiscono a rendere le strumentazioni mediche suscettibili alla crescita microbica sessile. In primo luogo l’impianto di cateteri spesso compromette la barriera protettiva della pelle; in aggiunta, la zona di inserzione è velocemente ricoperta dalle proteine dell’ospite, che spesso facilitano l’adesione microbica. E’ inoltre evidente che il materiale abiotico impiantato sia esso stesso causa di locale attenuazione della risposta immune antimicrobica. I cateteri sono frequentemente contaminati nel compartimento interno dove i microrganismi, liberi di muoversi nel lume, possono ancorarsi alla superficie per effetto di varie interazioni fisico-chimiche di adesione, iniziando così un processo di crescita e maturazione del biofilm. Per ovviare al problema dell’antibiotico-resistenza, si stanno studiando alcune strategie innovative di prevenzione dello sviluppo dei biofilm microbici sui dispositivi medici, come ad esempio quelle che contemplano attività enzimatiche in grado di disgregare la matrice polisaccaridica esoprodotta dalle cellule. Diverse strategie sono state messe a punto al fine di sviluppare materiali capaci di inibire la crescita sessile ed il successivo sviluppo di biofilm. L’adsorbimento su matrici polimeriche di uno o vari composti antimicrobici (rifampicina, vancomicina, nitrofurazone, argento, benzalconio) o di sostanze antifungine (fluconazolo) rappresenta una delle principali strategie messe in atto. Cateteri di lattice siliconizzato impregnati con antibiotici risultano già commercialmente disponibili, e in questa prospettiva di ricerca notevoli sforzi sono stati compiuti per ottimizzare sia le quantità di farmaco adsorbite dal polimero che quelle rilasciate nel tempo. Recentemente è stato proposto l’impiego di biomateriali polimerici di nuova generazione, in cui le matrici polimeriche poliuretaniche sono rivestite da agenti antibiofilmogeni non battericidi come i biosurfattanti, l’eparina, l’acido usnico e i furanoni, in grado di perturbare i meccanismi di formazione e sviluppo del biofilm. In merito a questo aspetto è estremamente interessante l’impiego di agenti capaci di interferire con i sistemi di comunicazione cellulare (quorum sensing). I BIOSURFATTANTI E LE LORO APPLICAZIONI La quasi totalità dei surfattanti oggi commercializzati è caratterizzata da importanti attività di superficie, quali la capacità di ridurre la tensione superficiale e interfacciale tra liquidi, solidi e gas. In genere sono surfattanti chimici principalmente derivati dal petrolio, e come tali poco biodegradabili, scarsamente eco-compatibili, tossici per l’ambiente e talvolta anche per l’uomo. I surfattanti rappresentano oggi una fondamentale classe di composti che trovano larga applicazione in ogni settore industriale, rientrando nella formulazione di moltissimi prodotti di uso quotidiano. Per questo motivo negli ultimi anni è andato sempre più crescendo l’interesse per i biosurfattanti, composti di origine microbica dotati delle 47 Rivista Italiana di Compositi e Nanotecnolgie – Volume 7, n°1 Aprile 2012 stesse attività di superficie dei surfattanti sintetici, ma aventi numerosi vantaggi rispetto ad essi. Queste molecole di origine microbica, dato il carattere di composti naturali, sono innanzitutto assolutamente ecocompatibili, biodegradabili e non tossiche. Possono inoltre essere ottenute dalla fermentazione batterica a partire da substrati di basso prezzo o addirittura di scarto, condizione che ne può ridurre notevolmente i costi di produzione. Essendo tensioattivi di origine naturale, i biosurfattanti trovano collocazione nel vasto mercato dei prodotti per la pulizia della casa e la cura del corpo e della persona. I soforolipidi in particolare, sintetizzati da Candida sp. sono molto apprezzati per la buona azione idratante e la perfetta compatibilità con la pelle, tanto che cosmetici contenenti tali molecole sono attualmente commercializzati dalla Kao Chemical Corporation. Impiegati principalmente come agenti emulsionanti e grazie alle loro molteplici funzionalità, i biosurfattanti possono trovare un più ampio spettro di applicazione come potenziali additivi per molti prodotti alimentari. l’uso commerciale di alcuni pesticidi a base di biosurfattanti. Un’altra loro possibile applicazione è nella formulazione di fertilizzanti, con il compito di aumentare la solubilità in acqua dei principi attivi. Si possono così ottenere prodotti dal più facile assorbimento da parte delle piante, consentendo una riduzione della quantità di principio attivo somministrata. In campo petrolifero i biosurfattanti, grazie alla capacità di diminuire la tensione interfacciale tra roccia e petrolio, riducono le forze capillari che ostacolano la risalita del greggio ottimizzandone quindi l’estrazione. Inoltre l’azione emulsionante esercitata sul petrolio ne favorisce il distacco dalle rocce. Nelle raffinerie sono spesso usati i biosurfattanti ramnolipidici per la pulizia dei serbatoi di stoccaggio di petrolio e derivati, attraverso un processo noto come “mobilizzazione e recupero degli idrocarburi”. In tal caso viene sfruttato il potere emulsionante/disemulsionante di tali molecole per rimuovere i residui idrocarburici dalle pareti e dal fondo del serbatoio e poi recuperarli e riconvogliarli alla catena di raffinazione. Questo processo ha un duplice vantaggio, consentendo da un lato la pulizia del serbatoio, e dall’altro il recupero degli idrocarburi anche fino al 90%. Inoltre l’impiego dei biosurfattanti può offrire un significativo contributo al disinquinamento di tratti marini e costieri in seguito a fuoriuscite di petrolio da navi cisterna. I ramnolipidi ad esempio agiscono emulsionando il petrolio in acqua, così da incrementarne la biodisponibilità per i microrganismi degradatori. Queste molecole, essendo costituite da domini idrofilici (le teste) e da parti idrofobiche (le code lipidiche) possono agire sulla superficie d’interfaccia come film organici condizionanti, in grado di ostacolare o favorire l’adesione e/o il distacco delle cellule batteriche, perturbando le interazioni di tipo idrofobico e idrofilico nelle fasi di interazione adesive iniziali. I biosurfattanti ramnolipidici, diffondendosi in una fase acquosa, possono creare un film condizionante monocostituito in grado di interagire diversamente con superfici di tipo idrofobico e idrofilico. Alcune ricerche hanno permesso di verificare che la formazione di film condizionanti su diverse superfici tende a mascherare fino ad annullare alcune proprietà fisico-chimiche delle stesse. Su una superficie substrato di adesione di tipo idrofobico, il film ramno lipidico può determinare considerevoli variazioni delle caratteristiche idropatiche del materiale. E’ stato sperimentalmente verificato che, se sulla superficie idrofobica il film condizionante ramnolipidico si presenta orientato con le code idrofobiche a contatto con la superficie e le teste idrofiliche esposte all’interfaccia acquosa, unicamente le cellule idrofiliche sono in grado di aderire con l’interfaccia-substrato, diventata in questo modo maggiormente idrofilica. Analogamente, l’effetto condizionante può avvenire anche su materiali substrato di adesione con caratteristiche idrofiliche che, trattate con film ramnolipidici orientati in maniera opportuna, potranno risultare più idrofobici. In entrambi i casi sopra citati lo sviluppo del biofilm microbico può essere ostacolato o addirittura inibito. Dunque i ramnolipidi possono essere applicati su materiali destinati ad un uso agroalimentare, medico, petrolifero e spaziale, facendo sì che un opportuno pretrattamento delle superfici porti ad un adsorbimento attivo ed efficace delle biomolecole. I biosurfattanti sono anche in grado di facilitare l’estrazione mineraria dei metalli. Particolarmente indicati a questo scopo sono i ramnolipidi che, grazie al carattere anionico, riescono a complessare e rimuovere metalli e ioni di varia natura. Con un meccanismo simile a quanto avviene per i substrati idrocarburici, queste biomolecole dapprima stimolano il distacco del metallo dalla matrice solida, quindi vi si legano a formare complessi che sono più o meno stabili a seconda dell’affinità tra le due specie. Biosurfattanti dotati di spiccate attività antibiotiche, antifungine, antivirali rappresentano la frontiera dei prodotti per il controllo biologico dei patogeni delle piante. Molti studi sperimentali hanno infatti dimostrato l’effetto zoosporicida dei ramnolipidi prodotti da Pseudomonas sp.. A questo riguardo l’Agenzia americana per la Protezione dell’Ambiente (EPA) ha già approvato I RAMNOLIPIDI Negli ambiti che vanno dalla biologia alle scienze e tecniche per lo spazio, è possibile considerare potenzialmente utile l’impiego di una particolare classe di biosurfattanti: i ramnolipidi. Si è visto infatti che, a differenza di quanto osservato per altri glicolipidi, essi presentano una scarsa attività di stimolo della differenziazione delle cellule umane, e ciò li rende candidati ideali per le applicazioni mediche. 48 Rivista Italiana di Compositi e Nanotecnolgie – Volume 7, n°1 Aprile 2012 BIOFILM, MATERIALI INDUSTRIALE E BREVETTAZIONE Negli ultimi anni la ricerca inerente lo sviluppo, il monitoraggio ed il controllo dei biofilm microbici ha avuto un forte incremento, dettato in parte dai numerosi risvolti applicativi menzionati. Lo dimostrano numerosi studi rivolti allo sviluppo di patenti e brevetti che sono stati portati avanti a livello internazionale. Nella Tabella che segue sono riportati alcuni dei principali brevetti depositati nell’ultimo decennio. Brevetto Proprietà WO 2011/089 591 A1 Cupron Scientific GB 2477914 2010 University of Newcastle upon Tyne US 2009/015 9533 SNU R&DB Foundation Titolo Biofilm resistant materials Compounds and methods for biofilm disruption and prevention Magnetic carrier comprising enzyme for inhibiting biofilm formation immobilized thereon, and membrane bioreactor system and method for inhibiting biofilm formation using the same US 2009/025 5536 Enox Biopharma Biofilminhibiting catheters and tubings WO 2008/092 011 Cook Inc. Biofilminhibiting medical products US 2007/024 4059 David KR Karaolis US 2007/019 1793 Epien Medical US 2006/018 0552 Bradley Downs Method for attenuating virulence of microbial pathogens and for inhibiting microbial biofilm formation Method and material for reducing biofilm Anti-biofilm forming structure and method of manufacturing the same Bacterin Int. WO 2005/030 186 University of Maryland US 2003/006 8667 Merle Edwin Olson Howard Ceri Effects of materials and surface coatings on encrustation and biofilm formation Messa a punto di un metodo per valutare l’efficienza di coating superficiale rispetto alla formazione del biofilm Baylor College of Medicine Composition and methods for preventing and removing biofilm embedded microorganisms from the surface of medical devices Sviluppo di un coating per applicazioni in campo medico al fine di prevenire lo sviluppo di biofilm microbici US 6475434 2002 Sviluppo di un carrier magnetico inclusivo di un enzima inibente il quorum sensing e il biofilm microbico Sviluppo di materiali e apparati medici a base di ossido nitrico in grado di inibire lo sviluppo di biofilm Messa a punto di un prodotto medico inibitore del biofilm contenente un agente biocida a base di tiol-bismuto Utilizzo di dinucleotidico ciclico c-di-GMP e analoghi per inibire la formazione di biofilm Messa a punto di un metodo per rimuovere il biofilm dalle superfici Sviluppo di un sistema di trasporto fluidi resistente al biofilm basato su un materiale a base di resina polimerica e di un biocida contenente ioni metallici Sviluppo di un coating antimicrobico composto da un idrogel e da un agente bioattivo WO 2005/107 455 Contenuto Sviluppo di un materiale basato su ossido di rame resistente al biofilm Utilizzo di nucleasi microbiche per la distruzione e la prevenzione di biofilm superficiali Antimicrobial coating for inhibition of bacterial adhesion and biofilm formation Method for attenuating virulence of microbial pathogens and for inhibiting microbial biofilm formation Utilizzo di un dinucleotidico ciclico c-di-GMP e analoghi per ridurre la colonizzazione di patogeni ATTIVITA’ SPERIMENTALI SU SPAZIALI E BIOFILM MICROBICI MATERIALI La biocontaminazione dei moduli spaziali abitati, in particolare della Stazione Spaziale Internazionale (SSI), è stata studiata sia riguardo alla microflora ambientale che allo sviluppo di biofilm, senza tralasciare le alterazioni a danno dei materiali (Gu 2007; Roman e Minton-Summers 1998; Gu et al. 1998; Novikova et al. 2006; Alekhova et al. 2005; Vasin e Trofimov, 1995; Vasin et al. 1993). Negli ultimi anni il nostro gruppo di lavoro ha studiato la risposta biofilmogena batterica di specie note di riferimento su materiali di uso spaziale, esplorando la possibilità di applicazione dei biosurfattanti ramnolipidici nelle tecnologie di condizionamento dei materiali al fine di favorire il controllo della biocontaminazione microbica. Per lo svolgimento dell’attività sperimentale sono stati selezionati 2 ceppi batterici di origine ambientale: Pseudomonas fluorescens DSMZ 50090 ed Escherichia coli DSMZ 498. Queste specie, ampiamente diffuse e ubiquitarie di habitat come nosocomi, alimenti, acque e suoli, tessuti vegetali e animali, sono state ritenute un modello di studio idoneo perchè già note per le loro capacità biofilmogene su materiali convenzionali come polistirene, vetro e acciaio. I ceppi sono stati prescelti anche alla luce della loro capacità di crescita attiva a 20-25°C, temperatura esistente all’interno dei moduli della SSI e probabilmente registrabile in futuro anche all’interno delle serre spaziali. Entrambi i ceppi batterici sono stati già utilizzati nell’ambito della missione spaziale ENEIDE, svoltasi nel 2005 per conto della Regione Lazio e dell’ESA, quindi 49 Rivista Italiana di Compositi e Nanotecnolgie – Volume 7, n°1 Aprile 2012 rappresentano dei modelli di studio utili per approfondire il comportamento di microrganismi formanti biofilm in condizioni sperimentali di rilevanza spaziale. Per la produzione dei biosurfattanti è stato utilizzato il ceppo di Pseudomonas aeruginosa isolato nel Laboratorio di Microbiologia Agraria dell’Università della Tuscia. P. fluorescens DSMZ 50090 e E. coli DSMZ 498 sono stati regolarmente coltivati in aerobiosi su terreno LB alla temperatura di 30°C. Per la produzione di biosurfattanti P. aeruginosa è stato coltivato in aerobiosi a 30°C su terreno minimo contenente diesel 2% (v/v) come precedentemente descritto (Di Mattia et al., 2008). Per la loro caratterizzazione è stato utilizzato il sovranatante ottenuto dopo centrifugazione a 6000 rpm di 1 litro di coltura. La miscela risultata dall’estrazione in solvente organico è stata posta in soluzione acquosa a concentrazione finale nota e sterilizzata per filtrazione. Il prodotto così ottenuto, denominato Biosurf, è stato sottoposto a caratterizzazione chimica per confermare la presenza ramnolipidica negli estratti grezzi utilizzati nelle prove di biosaggio. Questa analisi ha dimostrato la presenza di biosurfattanti di tipo Rha-C10-C10 e RhaRha-C10-C10. I materiali di uso spaziale utilizzati negli esperimenti (Fig. 2) sono stati i seguenti: Kevlar, Nomex, Betacloth, Kapton alluminizzato, Kapton convenzionale, Combitherm, Mylar, lamina di rame, guaina in Teflon, alluminio non anodizzato, composito in fibra di carbonio, isolante multistrato, adesivo in alluminio, tappetino termodissipatore, riscaldatore a nastro. Il condizionamento dei materiali oggetto di studio è stato effettuato immergendo ciascun campione nel Biosurf per circa 18 ore. Dopo di ché, sempre operando in condizioni di sterilità, il materiale è stato asciugato prima di essere utilizzato nelle prove di incubazione con i ceppi batterici biofilmogeni. Lo sviluppo di biofilm è stato indagato in prove di crescita in beuta e in micropiastre di polistirene. La quantificazione del biofilm prodotto è stata condotta con metodi spettrofotometrici convenzionali e utilizzo di due diverse procedure di incubazione e colorazione della biomassa cellulare adesa. Le incubazioni batch di studio della crescita sessile hanno mostrato la buona attitudine biofilmogena dei ceppi Gram-negativi non sporigeni esaminati sulla quasi totalità dei materiali ad uso spaziale, ad eccezione del rame e del Teflon di rivestimento dei cavi elettrici. A prescindere dal diverso grado di idropatia cellulare delle specie considerate, note tuttavia per il pronunciato carattere idrofilico, sia E. coli che P. fluorescens hanno dato risposte analoghe nelle condizioni di saggio fissate, formando dei biofilm strutturati sia sulla superficie idrofilica del vetro che su quelle più idrofobiche dei metalli, delle plastiche e dei tessuti. Fig. 2 Materiali modello di uso spaziale utilizzati per gli esperimenti in vitro sullo sviluppo di biofilm microbici (Foto F. Canganella). Nel caso del Kevlar, del Betacloth e del tessuto termodissipatore si è potuto osservare uno sviluppo differenziale del biofilm, principalmente a carico di una sola delle due facce esposte del materiale. L’ispezione visiva ed il confronto delle risposte biofilmogene dei materiali adesivi metallici (alluminizzato e termico), e plastici (Kapton tape) ha fatto riscontrare invece una maggiore crescita sessile sul lato cartaceo di rivestimento protettivo (non considerato nella quantificazione spettrofotometrica). E’ stata ulteriormente osservata una buona diffusione del biofilm nell’ambiente microaerofilo della parte adesiva protetta. In generale il Mylar ed il Kapton alluminizzato possono essere considerati tra i materiali plastici meno biofilmogeni, mentre i rimanenti denotano una moderata capacità di supporto della crescita sessile. Tra i tessuti esaminati il Betacloth è risultato essere il materiale più scarsamente biofilmogeno, mentre generalmente la risposta è stata molto alta in termini di formazione del biofilm sulle superfici dei materiali sintetici degli altri tessuti spaziali. E’ del tutto probabile che questa consistente formazione di biofilm sui tessuti sintetici sia da ricondurre alla maggiore effettiva microsuperficie esposta, che conferisce una migliore capacità di assorbenza ed adsorbenza dei nutrienti disciolti e di allocazione delle microcolonie sessili e del biofilm strutturato tra le maglie della complessa tramatura del materiale, come mostrato per il Betacloth e il Nomex alluminizzato analizzati alla microscopia elettronica. I risultati hanno dimostrato una diversificata affinità dei vari materiali esaminati verso la formazione di biofilm batterico, mettendo in luce talvolta una totale refrattarietà alla colonizzazione batterica sessile. In vari casi il precondizionamento dei materiali con la miscela di biosurfattanti ha portato ad una buona riduzione del biofilm rispetto al controllo. Il lavoro svolto in questa sperimentazione, pur limitato ad ottenere indicazioni preliminari, può risultare utile per impostare una selezione sperimentale dei materiali più appropriati da utilizzare in ambito spaziale, basata su un approccio biologico. I dati potrebbero inoltre risultare utili per definire una tecnologia di trattamento dei materiali atta a limitare o impedire la formazione di biofilm batterico mediante l’utilizzo di sostanze microbiche naturali biocompatibili. 50 Rivista Italiana di Compositi e Nanotecnolgie – Volume 7, n°1 Aprile 2012 IL PROGETTO “MARS500” E L’ESPERIMENTO “BIOFILM” E’ sorprendente che settori come quello spaziale per la fisica e l’ingegneria, e quello biotecnologico per le scienze della vita, pur essendo sempre più spinti verso la specializzazione, si possano fondere per gettare le basi di nuovi ambiziosi traguardi, primo fra tutti le missioni umane nello spazio. In tale prospettiva si collocano gli esperimenti portati avanti dal nostro Laboratorio a partire dalla Missione “ENEIDE” nel 2005 e più recentemente nell’ambito del Programma di simulazione “MARS500” e la Missione NASA-ASI “DAMA” (Canganella et al. 2010; Canganella, 2011). Il MARS500 rappresenta una pietra miliare nel percorso che farà giungere tra qualche decennio l’Uomo su Marte; il fine è la comprensione degli innumerevoli aspetti legati ad una missione umana di lunga durata. Si tratta di un grande progetto sponsorizzato dall’Agenzia Spaziale Europea (ESA) e da quella Russa, una simulazione svoltasi presso la facility NEK dell’Istituto per i Problemi BioMedici (IBMP) di Mosca dal giugno 2010 al novembre 2011 (Fig. 3). Cinquecento giorni è infatti il tempo richiesto con le attuali tecnologie per arrivare su Marte, permanere sulla sua superficie circa due mesi e tornare sulla Terra. Sei scienziati (3 russi, 1 cinese, un italiano e 1 francese) sono entrati nei moduli del NEK simulando il più possibile le condizioni di una reale missione, ed hanno svolto molteplici attività tra le quali ben 140 esperimenti medico-biologici. Colonia, l’Università della Tuscia e l’IBMP di Mosca. Il nostro Gruppo di ricerca ha trattato l’aspetto della biocontaminazione ambientale proponendo e realizzando due esperimenti scientifici di cui uno, chiamato appunto “BIOFILM”, riguarda la tematica della crescita microbica sessile e l’impiego di sostanze con attività antibiofilmogene. L’esperimento (Fig. 4) è incentrato sulle problematiche legate alla contaminazione ambientale ad opera dei microrganismi che, come già menzionato, causano in particolari condizioni la formazione di una struttura microbica multistratificata denominata appunto “biofilm”. Esso può comportare fenomeni di danneggiamento dei materiali: ne sanno qualcosa i russi, che forti della loro esperienza cosmonautica fin dai tempi della MIR, conoscono bene i fenomeni di “biocorrosione”, ovvero corrosione di materiali spaziali da parte di microrganismi che, se si insediassero per esempio su sensori, potrebbero addirittura inattivarli. Fig. 4 L’esperimento BIOFILM nella sua configurazione finale all’interno della NEK facility presso l’Istituto IBMP di Mosca (Foto G. Bianconi). Fig. 3 La struttura all’interno dell’Istituto IBMP di Mosca in cui è stata realizzata la simulazione MARS500 (Foto F. Canganella). Dal nostro punto di vista, ovvero quello microbiologico, il MARS500 ha costituito un’ottima opportunità scientifica per studiare due aspetti fondamentali senza la conoscenza dei quali la sopravvivenza dell’uomo nello spazio sarebbe ardua: la biocontaminazione ambientale e la microflora intestinale. Entrambe le tematiche sono state affrontate nell’ambito di un progetto internazionale denominato MICHA (MIcrobiological monitoring in Confined HAbitat), approvato dall’ESA e finanziato dall’ASI, che ha coinvolto il Centro di Ricerca Aerospaziale (DLR) di L’impianto sperimentale è stato ideato e sviluppato presso il nostro Laboratorio, che lo ha messo in opera in collaborazione con la Thales Alenia Space e il Politecnico di Torino, la Gammarad Italia, l’IBMP e l’Università Statale di Mosca. Sono stati impiegati pannelli costituiti della stessa lega di alluminio utilizzata per molti moduli della SSI, i quali sono stati sottoposti a cinque diversi trattamenti antimicrobici. Tra di essi, uno con perossido di idrogeno al 6%, uno a base di silice e argento del Politecnico di Torino (progetto NABLA), e uno basato sull’impiego di del prodotto a base di biosurfattanti microbici ottenuto da noi ottenuto allo scopo di impedire la colonizzazione delle superfici trattate, con enormi risvolti applicativi in tutti quei contesti spaziali in cui sarà presente l’uomo (moduli abitativo, medico, orbitale e persino nelle future serre che garantiranno cibo fresco agli astronauti). Ogni tre mesi i volontari all’interno del modulo hanno effettuato un campionamento delle superfici dei pannelli, seguito da un’analisi delle Unità Formanti Colonie (UFC). Gli ultimi tre pannelli installati di ciascuna serie non sono stati campionati per mantenere intatto il biofilm eventualmente formatosi sulle superfici. Ciò, una volta conclusasi la simulazione, ha permesso di avere materiale 51 Rivista Italiana di Compositi e Nanotecnolgie – Volume 7, n°1 Aprile 2012 sperimentale imperturbato su cui poter effettuare analisi sia molecolari che strutturali. LA MISSIONE “DAMA” E L’ESPERIMENTO “VIABLE” Gli studi simulati, seppure utilissimi, purtroppo non permettono di analizzare tutte quelle variabili legate ad esempio all’assenza di gravità, alle radiazioni, alla reale consapevolezza di essere lontani dalla Terra e, spesso, da una concreta possibilità di salvezza in caso di guasti o incidenti. Da qui la necessità di investire anche in missioni spaziali che contemplino la possibilità di posizionare strumentazioni scientifiche a bordo e di poterle seguire durante le varie fasi di volo. E’ questo il caso dello Shuttle e della Stazione Spaziale Internazionale (SSI), entrambi protagonisti dell’esperimento VIABLE nell’ambito della missione DAMA, alla quale nel maggio 2011 ha partecipato il Colonnello Roberto Vittori. Ancora una volta si tratta di una indagine sulla biocontaminazione microbica e la formazione di biofilm, ma grazie al volo STS-134 sarà possibile discriminare tra le variabili legate all’ambiente spaziale e quelle connesse all’ambiente confinato della simulazione. Lo Shuttle Endeavour ha portato sulla SSI quattro contenitori (pouch) di Nomex con materiali spaziali quali lega di alluminio, Betacloth e Armaflex, che rimarranno a bordo per circa quattro anni. In aggiunta a ciò sono stati inseriti campioni di acqua potabile solitamente usata per la Stazione, proveniente dalla SMAT di Torino e trattata secondo le procedure richieste dall’Agenzia Spaziale Russa. Una volta che i campioni verranno riportati sulla Terra si procederà alla valutazione della dose cumulativa di radiazioni, nonché alle analisi microbiologiche sia convenzionali che molecolari al fine di valutare quantiqualitativamente l’eventuale biofilm microbico presente sui materiali esposti all’aria e sulle piastrine metalliche all’interno delle fiale d’acqua. Gli obiettivi sperimentali alla base di VIABLE sono i seguenti: 1) Valutare la formazione del biofilm batterico e/o fungino all’interno della SSI su alcuni materiali per un uso spaziale nel settore dell’“Advanced Life Support (ALS)”, simulando sia l’esposizione in aree libere da strumentazioni o contenitori, che in micronicchie causate da scarsa ventilazione o esposizione; 2) Esaminare gli effetti dell’applicazione dei biosurfattanti sull’eventuale sviluppo dei biofilm; 3) Investigare l’effetto del trattamento preventivo convenzionale con acqua ossigenata al 6% sull’eventuale sviluppo dei biofilm; 4) Analizzare gli effetti della microgravità e delle altre condizioni presenti nei moduli abitati attraverso il confronto tra i campioni che hanno volato e quelli rimasti a terra come controllo; 5) Studiare lo sviluppo del biofilm su alcuni materiali comunemente impiegati in ambito spaziale attraverso microrganismi-modello, sia in condizioni standard che previo trattamento con prodotti antimicrobici. Questa indagine viene condotta su tre tipi di materiali: il Betacloth (tessuto ignifugo a base di silice utilizzato anche per le tute spaziali), l’Armaflex (isolante a base di gomma sintetica altamente flessibile impiegato sia per applicazioni spaziali che industriali in genere) ed una particolare lega di alluminio costituente la maggior parte dei moduli della ISS e fornita dalla Thales Alenia Space di Torino, da anni leader nella costruzione di strutture spaziali. L’attività pre-volo ha previsto la definizione dell’experimental design, la scelta e selezione dei materiali da utilizzare, la messa a punto delle soluzioni disinfettanti, la progettazione e costruzione delle pouch, l’assemblaggio finale dell’hardware sperimentale ed il suo trasporto alla NASA. L’attività in volo ha contemplato il posizionamento delle pouch nel sito prescelto per l’esperimento, la loro apertura durante il primo periodo di permanenza sulla SSI dell’astronauta Vittori, la loro chiusura al termine della missione del Colonnello, il loro mantenimento a bordo sino allo svolgimento della missione 2013-’14 che contemplerà il loro recupero. L’hardware è essenzialmente rappresentato da pouch in Nomex simili a quelle precedentemente utilizzate nell’esperimento MICROSPACE, condotto durante la missione ENEIDE del 2005, ma di dimensioni e struttura ridisegnata per il posizionamento dei materiali oggetto di studio (Figura 5). Fig. 5 Configurazione di volo delle pouch in Nomex con i materiali Allumino, Betacloth e Armaflex posizionati sul coperchio e all’interno (Foto G. Bianconi). I materiali sperimentali (ciascuno suddiviso in campioni di circa 5x5 cm) sono stati fissati alla superficie esterna del coperchio della pouch; lo stesso set di materiali è stato posizionato all’interno del contenitore, che ospita anche due flaconi con l’acqua potabile usata a bordo della SSI. Sono state allestite otto pouch sperimentali: un set di quattro per l’esperimento di volo ed un identico set come controllo a terra. Ognuno comprende una pouch con i 52 Rivista Italiana di Compositi e Nanotecnolgie – Volume 7, n°1 Aprile 2012 materiali di controllo, una con i materiali condizionati con i biosurfattanti prodotti dal nostro Laboratorio, una con i materiali trattati con l’acqua ossigenata, ed una con i materiali ricoperti di un coating di silice e argento messo a punto dal Politecnico di Torino. I flaconi delle ultime due pouch presentano al loro interno piastrine dello stesso acciaio utilizzato per i serbatoi dell’acqua, al fine di valutare l’eventuale formazione del biofilm nel mezzo liquido. Prima di assemblare i set sperimentali gli otto contenitori sono stati sterilizzati con irradiazione gamma presso la Gammarad Italia (Bologna). La preparazione finale del payload, effettuata sotto cappa a flusso laminare, ha compreso l’inserimento nelle pouch dei dosimetri tipo TLD e CR-39, dei datalog per la temperatura e dei flaconi contenenti l’acqua per uso spaziale; si è proceduto poi al confezionamento finale in sterilità per il trasporto alla NASA. Una volta a bordo della SSI l’esperimento è stato rimosso dagli imballaggi e posizionato nell’US Lab secondo quanto previsto dal protocollo sperimentale. Dopo questa fase le pouch sono state trasferite nel modulo FGB e poste nel locker come mostrato in Fig. 6. tecniche convenzionali che di biologia molecolare quali FISH, microscopia confocale e proteomica. Saranno inoltre studiate eventuali modificazioni strutturali dei materiali attraverso analisi di microscopia elettronica a scansione e trasmissione, per mezzo di microscopia a forza atomica e analisi spettrofotometriche. La quantificazione del biofilm sarà effettuata mediante analisi eco-fisiologiche, biochimiche e microscopiche, mentre la determinazione del Carbonio Organico Totale e di altri parametri chimici e microbiologici sarà possibile analizzando i campioni di acqua di volo. Una permanenza a bordo di circa quattro anni è un periodo eccezionalmente lungo in ambito spaziale, ma necessario dal punto di vista microbiologico poiché il biofilm è una stratificazione complessa di cellule microbiche che ha tempi di sviluppo medio-lunghi. Dal punto di vista applicativo è cruciale mettere a punto trattamenti che possano diminuire drasticamente le probabilità che avvengano fenomeni di contaminazione o addirittura corrosione di componenti fondamentali per la sicurezza dell’equipaggio (ad esempio sensori antincendio, rilevatori della CO2, ecc.). Gli esperimenti inerenti le scienze dei materiali e la loro risposta ai fenomeni biologici sono dunque fondamentali per il futuro: poter realizzare strutture che meglio garantiscano la sicurezza degli equipaggi è considerata dalle Agenzie Spaziali di tutto il mondo una priorità, soprattutto in vista di missioni di lunga durata come quelle verso Marte, previste tra una ventina di anni. RINGRAZIAMENTI Fig. 6 Disposizione finale dell’esperimento VIABLE a bordo della Stazione Spaziale Internazionale (Foto NASA). La fase sperimentale attualmente in atto verrà portata avanti sino al momento del downloading, che avverrà presumibilmente nel 2014. Essa prevede che una volta al mese un astronauta soffi sui coperchi delle pouch e tocchi i materiali sperimentali esterni in modo da simulare una casuale interazione tra il materiale sperimentale e l’astronauta. Inoltre l’equipaggio ha la responsabilità di monitorare l’esperimento per valutare eventuali fenomeni anomali quali presenza di odori sgradevoli e/o eccessivo sviluppo esterno di biofilm. L’instaurarsi di tali situazioni è ritenuto altamente improbabile, data la natura dei materiali ed i parametri ambienti del modulo spaziale. In ogni caso, per far fronte anche a queste evenienze, è stato approntato un protocollo per il confezionamento in sicurezza della pouch coinvolta ed il suo più rapido ritorno a Terra. La fase finale comporterà il download delle quattro pouch e quindi lo svolgimento di una serie di analisi sperimentali per la valutazione quantitativa e qualitativa del biofilm. Ciò avverrà attraverso lo studio dei microrganismi e della loro organizzazione sulle superfici dei materiali. Per le indagini verranno impiegate sia Questo lavoro non sarebbe stato realizzabile nella sua completezza senza il contributo di molte persone. Gli Autori esprimono dunque la loro gratitudine in particolare a: Salvatore Pignataro, Gabriele Mascetti e Delfina Bertolotto dell’ASI; Alessandro Bellomo, Alberto del Bianco e Rosa Sapone dell’ALTEC di Torino; Dario Castagnolo di Telespazio; Cesare Lobascio, Antonio Saverino e Lucia Grizzaffi della Thales Alenia Space di Torino; Sergio Perero e Monica Ferraris del Politecnico di Torino; Vincenzo Roca della Università di Napoli Federico II; Roberto Battiston, Stefano Lucidi e Antonio Faba dell’Università di Perugia; Andrea Margonelli del CNR di Montelibretti; Agata Gambacorta, Annabella Tramice e Assunta Giordano del CNR di Napoli; Francesco Santoro del JFK Space Center. Grazie inoltre al team della Gammarad Italia per la sterilizzazione con irraggiamento γ dei materiali sperimentali e alla SMAT di Torino per la fornitura dell’acqua di volo. Un ringraziamento davvero speciale va naturalmente a Roberto Vittori per l’esperimento “VIABLE” e a Diego Urbina per l’esperimento “BIOFILM”. Il lavoro di ricerca è stato realizzato grazie al contributo finanziario dell’ASI (progetti ASI-VUS e ASIMICHAm). Legenda delle figure 53 Rivista Italiana di Compositi e Nanotecnolgie – Volume 7, n°1 Aprile 2012 Figura 1. Modello di sviluppo del biofilm microbico e interazioni fisico-chimiche coinvolte (gentilmente fornita da Elena di Mattia). Figura 2. Materiali modello di uso spaziale utilizzati per gli esperimenti in vitro sullo sviluppo di biofilm microbici (Foto F. Canganella). biofilm inside the ISS. Abstract V° Congresso Nazionale ISSBB, Padova, p. 32. . Di Mattia E., Bianconi G., Canganella F. (2008) Induzione di biofilm batterici su materiali utilizzati dall’industria spaziale e valutazione dell’effetto bioprotettivo Figura 3. La struttura all’interno dell’Istituto IBMP di Mosca dove si è realizzata la simulazione MARS500 (Foto F. Canganella). Figura 4. L’esperimento BIOFILM nella sua configurazione finale all’interno della NEK facility presso l’Istituto IBMP di Mosca (Foto G. Bianconi). Figura 5. Configurazione di volo delle pouch in Nomex con i materiali Allumino, Betacloth e Armaflex posizionati sul coperchio e all’interno (Foto G. Bianconi). Figura 6. Disposizione finale dell’esperimento VIABLE a bordo della Stazione Spaziale Internazionale (Foto NASA). dovuto biosurfattanti. Rivista a pretrattamento Italiana di Compositi con e Nanotecnologie 4: 7-14. Gu JD (2007) Microbial colonization of polymeric materials for space applications and mechanisms of biodeterioration: A review. International Biodeterioration and Biodegradation 59: 170-179. Gu J.D., Roman M., Esselman T., Mitchell R. (1998) The role of microbial biofilms in deterioration of space station candidate materials. International Biodeterioration and Biodegradation 41: 25-33. Novikova N., De Boever P., Poddubko S., Deshevaya BIBLIOGRAFIA E., Polikarpov N., Rakova N., Coninx I., Mergeay M. Alekhova T.A., Aleksandrova A.A., Novozhilova T.Y., (2006) Survey of environmental biocontamination on Lysak L.V., Zagustina N.A., Bezborodov A.M. (2005) board the International Space Station. Research in Monitoring of microbial degraders in manned space Microbiology 157: 5-12. stations. Applied Biochemistry and Microbiology 41: Roman M.C., Minton-Summers S. (1998) Assessment 382-389. of biofilm formation in the International Space Station Canganella F., Bianconi G., di Mattia E., Taddei A.R., Water Recovery and Management system. Life support & Rettberg P., Iylin V., Novikova N., Fani R., Brigidi P., biosphere science: International Journal of Earth Space 5: Vitali B., Candela M., Lobascio C., Saverino A., 45-51. Simone A., Fossati F., Ferraris M. (2010) Microbiological issues related to biocontamination and Vasin V.B., Trofimov V.I. (1995) The experimental human life support in the MARS500 Programme: the study of microbial contamination of the space hardware. MICHA experiment. Proceedings Life in Space for Life Advances in space research 15: 273-276. on Earth, ELGRA-ESA-ISSBB Symposium, Trieste, p. 132 Vasin V.B., Ivanov M.V., Stolbova K.A., Trofimov V.I. (1993) Microorganism contamination of polymer Canganella F. (2011) VIABLE: a long-term flight and composite-materials used in space technology. experiment to monitor the development of microbial Microbiology 62: 230-235. 54 Rivista Italiana di Compositi e Nanotecnolgie – Volume 7, n°1 Aprile 2012 NANOCOMPOSITI A MEMORIA DI FORMA REALIZZATI IN SCHIUMA EPOSSIDICA Loredana Santo e Fabrizio Quadrini Dipartimento di Ingegneria Industriale Università di Roma “Tor Vergata” Via del Politecnico 1, 00133 Roma Tel: 0672597165 e- mail: [email protected] ________________________________________________________________________________________________ SOMMARIO Nuovi materiali nanocompositi a memoria di forma sono stati realizzati a partire da un processo di schiumatura allo stato solido di polveri di resina termoindurente a base epossidica. In tale processo le polveri sono pressate e ridotte in forma di pasticca per poi essere opportunamente schiumate all’interno di uno stampo posto in un forno a muffola, ottenendo schiume polimeriche con una buona distribuzione delle cavità e spiccate proprietà di memoria di forma. All’interno della schiuma è stata inserita, nella fase di pressatura, una nanoargilla derivante da montmorillonite (MMT) in percentuale variabile fino ad un massimo del 10%. Al fine di caratterizzare sia la sola schiuma che il nanocomposito, al variare del contenuto di particelle di rinforzo, sono state effettuate alcune prove sperimentali per la misura della densità, prove di compressione e prove termomeccaniche per valutare le proprietà di memoria di forma. L’aggiunta di nanoparticelle migliora le prestazioni meccaniche, anche se comporta un effetto di riduzione del rapporto di schiumatura, mentre non sembra influenzare le proprietà di recupero della forma. Questi materiali risultano di grande interesse non solo per il settore terrestre, ma anche per il settore aerospaziale ed in particolare in applicazioni quali strutture autodispieganti o per attuatori a rilascio graduale di energia. INTRODUZIONE I nanocompositi a matrice polimerica sono attualmente oggetto di numerose ricerche, poiché di grande interesse per le proprietà di varia natura (ottiche, elettriche, meccaniche, ecc.) che possono esibire. In particolare, riguardo alle proprietà meccaniche è possibile incrementare rigidezza e resistenza, resistenza ad usura e danneggiamento mediante aggiunta di nanoparticelle in percentuali generalmente molto basse (solitamente inferiori al 5 % in peso). In [1] Maniar ha classificato le resine epossidiche tra i polimeri più comuni in termini di ricerca e sviluppo e la montmorillonite (MMT) come la più utilizzata nanocarica per la realizzazione di tali materiali. La montmorillonite, che talvolta viene opportunamente modificata, è una nanoargilla che presenta una struttura unica, perché piatta con alto aspect ratio (1000:1) e spessore molto basso (circa 1nm). Li e Zeng in [2] hanno studiato nanocompositi epoxy/organophilic MMT come agenti ritardanti della fiamma, mentre Cai e altri in [3] hanno studiato le proprietà termiche di un nuovo nanocomposito dove lo stesso rinforzo (MMT) era stato miscelato con un monomero liquido epossidico. Più recentemente per produrre nanocompositi a matrice epossidica sono state utilizzate differenti nanoparticelle, come allumina, silice o nanotubi di carbonio [4-6]. Dall’esame dei risultati si può asserire che la soluzione di resina epossidica caricata con MMT appare ancora una delle migliori soluzioni tecniche, grazie alle performance finali che si riescono ad ottenere [7,8]. Un altro aspetto interessante da considerare è che le resine epossidiche generalmente mostrano spiccate proprietà di memoria di forma, ossia possono fissare una data deformazione quando raffreddate al di sotto della temperatura di transizione vetrosa (Tg) e possono recuperare la forma che avevano in origine se riscaldati oltre la Tg.In [9] è mostrato come campioni in resina epossidica possano esibire deformazioni relativamente basse durante la fase di memorizzazione (meno del 10%), mentre nel caso di schiume dello stesso materiale si possano raggiungere livelli decisamente superiori (oltre il 50%), anche dopo diversi cicli di memorizzazione [10]. Se dunque l’interesse è un grande recupero di forma sicuramente le schiume risultano più adeguate allo scopo. Visto l’interesse nell’impiego di tali schiume in diversi settori, negli ultimi anni gli autori del lavoro hanno studiato dei nuovi materiali nanocompositi a memoria di forma che vengono realizzati con un processo innovativo di schiumatura allo stato solido [11-13]. Essi potranno essere impiegati per la realizzazione di strutture leggere e autodispieganti o di attuatori a rilascio di energia controllato. Alcuni risultati molto interessanti, relativi alla sola schiuma polimerica, sono stati ottenuti in [1315]. In tali lavori si presenta l’attività di ricerca che è stata condotta per la realizzazione di un esperimento sulla Stazione Spaziale Internazionale, lanciato in orbita nella missione STS 134 nel maggio 2011. Oggetto dell’esperimento è stato lo studio del comportamento di 55 Rivista Italiana di Compositi e Nanotecnolgie – Volume 7, n°1 Aprile 2012 schiume polimeriche a memoria di forma in ambiente di microgravità. In questo lavoro si presenta la caratterizzazione di nanocompositi realizzati in schiuma epossidica, con differente percentuale di particelle di rinforzo (MMT). Tale caratterizzazione è stata realizzata mediante prove per la misura di densità, misura del rapporto di schiumatura, prove di compressione e prove termomeccaniche per valutare le proprietà di memoria di forma. MATERIALI E METODI DI PROVA Il materiale impiegato nella sperimentazione è una resina commerciale a base epossidica ( 3M ScotchkoteTM 206 N) che si presenta in forma di polvere ed è comunemente utilizzata per la protezione a corrosione di cavi. La polvere ha una dimensione del grano tipica per applicazioni di verniciatura e una densità reale di 1.44 g/cm-3. Il rinforzo utilizzato è una nanoargilla (Laviosa Dellite 43B) derivante da montmorillonite (MMT) che è stata opportunamente modificata con un sale quaternario di ammonio (dimethyl benzyl-hydrogenated tallow ammonium). La dimensione delle particelle, in condizioni a secco, è di circa 7-9 nm con una densità reale di 1.6 gcm-3 e una densità di bulk di 0.40 gcm-3. Per la fabbricazione dei campioni è stato utilizzato un processo di schiumatura allo stato solido [11,12] sviluppato dagli autori, per mezzo del quale la polvere viene pressata in uno stampo di acciaio cilindrico di diametro interno di 20 mm. La compattazione è stata realizzata con una macchina universale di prova (MTS Alliance RT/50), utilizzando una velocità di 5 mm min-1 e una pressione massima di 125 MPa. In fig. 1 si riporta in sintesi il processo. fig. 1 – Procedura per la realizzazione delle schiume Le pasticche sono state fabbricate con 4 g di polvere e l’aggiunta di differenti percentuali di MMT (0, 1, 3, 5 e 10 % in peso), facendo grande attenzione alla miscelazione di queste ultime all’interno della polvere. E’ importante la dispersione delle particelle e la completa esfoliazione nella matrice. Nessun agente schiumante è stato aggiunto alla polvere in quanto la schiumatura ha luogo solo per ebollizione del polimero, che nel forno a muffola utilizzato si realizza a 320 °C per 8 min. Il processo di schiumatura è stato condotto in aria ed il campione dopo la schiumatura è stato lasciato raffreddare in aria e successivamente estratto dallo stampo in acciaio inossidabile che lo conteneva. In fig. 2 si riporta un campione in schiuma in sezione. Sono ben evidenti le porosità distribuite pressoché uniformemente all’interno del campione, anche se in [15] è stato valutato l’effetto della gravità su tale distribuzione. fig. 2 – Sezione di un campione in schiuma. Al fine di caratterizzare i campioni realizzati con il processo su menzionato, diverse prove sperimentali sono state condotte sulle schiume nanocomposite con diverse percentuali di MMT: prove per la misura di densità, misura del rapporto di schiumatura, prove di compressione e prove termomeccaniche per valutare le proprietà di memoria di forma. Le prove di compressione sono state realizzate con la stessa macchina universale di prova utilizzata per la compattazione delle polveri e quindi per la realizzazione delle pasticche. I parametri di prova utilizzati sono i seguenti: velocità 5 mm/min, massima deformazione 80%, temperatura ambiente. I campioni avevano diametro di 20 mm ed altezza di 10 mm. Per le prove termomeccaniche di memorizzazione e recupero della forma sono stati utilizzati provini cilindrici di diametro 20 mm e altezza 20 mm. Tali provini sono stati inseriti in uno stampo cilindrico e pressati ad una temperatura di 130°C fino al 60% lungo la direzione dell’asse del cilindro . La temperatura è stata scelta ben al di sopra della temperatura di transizione vetrosa Tg, che in studi precedenti si è vista variare da 98 a 103 °C al variare della percentuale di MMT [11] (i valori minori della Tg sono relativi al più alto contenuto di MMT). I campioni sono stati poi raffreddati fino a temperatura ambiente mantenendo la nuova configurazione. Successivamente sono stati riscaldati in un forno a 130°C per 10 min al fine di valutare il recupero della forma. Due cicli di memorizzazione sono stati ripetuti al fine di 56 Rivista Italiana di Compositi e Nanotecnolgie – Volume 7, n°1 Aprile 2012 valutare il danneggiamento subito dal materiale. Quest’ultimo valutato tramite prove di compressione. Al fine di valutare il comportamento meccanico di tali schiume si riportano in fig. 5 le curve di compressione stress-strain per i diversi nanocompositi realizzati. RISULTATI 25 Nella produzione delle schiume si è valutato l’effetto dell’inserimento delle nanocariche sulla densità e sul rapporto di schiumatura, definito come rapporto tra la densità della pasticca iniziale e la densità della schiuma ottenuta. Si è rilevato, come mostrato in figura 3, che incrementando il contenuto del rinforzo in MMT il rapporto di schiumatura decresce e conseguentemente la densità della schiuma aumenta. Tensione (MPa) 15 10 5 0.6 2 0.5 1 0 Rapporto di schiumatura Densità della schiuma 0 2 4 6 8 10 Contenuto di MMT (% in peso) 0.4 0.3 fig. 3 – Rapporto di schiumatura e densità della schiuma in funzione del contenuto di MMT. Tale comportamento dipende sia dalla riduzione della percentuale di resina all’interno del nanocomposito sia dall’effetto negativo che ha il rinforzo sul flusso del materiale necessario alla realizzazione della schiuma. Inoltre l’incremento della densità della schiuma dipende anche dalla differente densità che hanno la resina e il rinforzo, oltre che dal rapporto di schiumatura. Con un contenuto del 10% di MMT la pasticca raddoppia la sua altezza durante il processo di schiumatura e la schiuma si presenta con una struttura molto compatta. Nel caso di sola schiuma, in assenza di nanocariche, il rapporto di schiumatura è di circa 4 e la minore densità ottenuta è inferiore a 0.4 gcm-3. In figura 4 si riporta un’immagine della pasticca iniziale e dei campioni schiumati con diverse percentuale di MMT (10,5,3,1,0 %). Si può ben notare il diverso rapporto di schiumatura. 80 fig. 5 – Curve di compressione al variare del contenuto di MMT. E’ possibile osservare che a compressione tutti i campioni mostrano il tipico comportamento mostrato dalle schiume, con uno stadio iniziale pseudo-elastoplastico, un successivo plateau e un successivo incremento di carico dovuto alla densificazione del materiale. Si individuano dunque tre zone, nella prima lo stress aumenta in maniera pressoché lineare poiché la schiuma si comporta in modo rigido, nella seconda zona i pori cominciano a collassare e si osserva un ampio plateau, nel quale la schiuma dissipa energia per mezzo dello schiacciamento dei pori, nella parte finale, ad elevate deformazioni, si osserva un incremento della tensione a causa della densificazione del materiale. Il valore della tensione e l’estensione del plateau dipendono dal contenuto di MMT. Una elevata tensione di plateau è misurata nel caso del più elevato contenuto di MMT, ma la sua estensione è molto contenuta. Un migliore confronto tra i diversi nanocompositi può essere realizzato estraendo dalle curve di compressione la tenacità nel tratto di deformazione 060%, come mostrato in figura 6. 700 900 Deformazione 10-60% 600 800 500 700 400 600 300 Tenacità Tenacità specifica 200 0 fig. 4 – Sezioni di schiuma ottenute con diverse percentuali di MMT. 40 60 Deformazione % 1 2 3 4 5 Contenuto di MMT (% in peso) 500 400 Tenacità specifica (J/g) 3 20 3 0.7 Tenacità (J/cm ) 4 0 3 0.8 Densità della schiuma (g/cm ) Rapporto di schiumatura 0 5 MMT (% in peso) 0 1 3 5 10 20 fig. 6 – Tenacità a compressione in funzione del contenuto di MMT. 57 Rivista Italiana di Compositi e Nanotecnolgie – Volume 7, n°1 Aprile 2012 In tale figura si riporta anche la tenacità specifica ottenuta rapportando la tenacità alla densità. Per tale analisi ci si è limitati al valore massimo di MMT pari a 5%. Incrementando il contenuto di nanoparticelle la tenacità aumenta ma la tenacità specifica raggiunge un plateau. Un migliore comportamento a compressione è dunque atteso per una percentuale di particelle nel range 1-3% di MMT. In fig. 7 si mostrano i risultati di una prova di memorizzazione e recupero della forma relativi a una geometria cilindrica. Per tutti i diversi nanocompositi utilizzati (con percentuale di MMT massima del 5%) si è ottenuto un recupero della forma iniziale senza alcun danneggiamento apparente. L’altezza recuperata dei provini non è stata mai inferiore al 97%. [11] che a un fissato numero di cicli termo meccanici incrementando il contenuto di MMT la curva di compressione si sposta verso più alti valori dello stress perché il materiale diventa più resistente. Piccole differenze si misurano tra la sola schiuma e il composito con l’1% di MMT, ma il contributo derivante da più alti valori di MMT è evidente. L’effetto del contenuto di MMT di rendere più resistente il materiale è collegato alle particelle che bloccano la mobilità della resina e ovviamente non alla diretta azione delle stesse particelle sotto compressione. In riferimento alla fig. 9 si osserva che la tenacità generalmente incrementa all’aumentare del contenuto di MMT, ma dopo ogni ciclo termomeccanico subisce un decremento. L’unico nanocomposito che non segue questo trend è quello relativo ad un contenuto di MMT del 5%. Ulteriori prove saranno necessarie per giustificare tale comportamento. Infine dall’esame dei campioni non si è rilevata alcuna rottura o danneggiamento all’interno della schiuma, come già osservato in [11] dove sono riportate immagini allo stereoscopio della superficie della schiuma prima e dopo un ciclo di memorizzazione e recupero della forma. fig. 7 – Prove di memorizzazione e recupero della forma. 500 Deformazione 10-60% 400 3 Tenacità (J/cm ) In fig. 8 si riportano la tensione e la deformazione in funzione del tempo registrati durante la fase di impacchettamento e della fase di raffreddamento successiva, in un ciclo termomeccanico subito dal materiale per la memorizzazione della forma. Si può osservare che la capacità di un materiale nel fissare una data deformazione a temperatura più elevata della Tg è visibile dalla diminuzione della tensione durante la fase di raffreddamento. 300 100 Deformazione % Tensione (MPa) 5 0 20 40 Temperatura di 90°C 60 60 Ciclo termomeccanico 0 1 2 200 0 1 2 3 4 5 Contenuto di MMT (% in peso) MMT 1% in peso 4 3 impacchettamento fig. 9 – Tenacità a compressione in funzione del contenuto di MMT per 2 cicli termo meccanici, nell’intervallo di deformazione 0-60%. raffreddamento 2 1 0 CONCLUSIONI 0 1 2 3 Tempo (min) 4 5 fig. 8 – Tensione in funzione del tempo e deformazione durante la fase di impacchettamento e raffreddamento successivo in un ciclo termomeccanico (contenuto di MMT: 1%). Per valutare l’abilità della schiuma a subire differenti cicli di memorizzazione senza perdere le caratteristiche meccaniche sono state condotte prove di compressione successive ai cicli termomeccanici. In fig.9 si riporta la tenacità a compressione in funzione del contenuto di MMT per 2 cicli termomeccanici nell’intervallo di deformazione 0-60%. Si è osservato in Il processo di schiumatura allo stato solido è stato utilizzato per la realizzazione di schiume polimeriche a base epossidica e di nanocompositi, mediante aggiunta di nanoparticelle di MMT alla polvere di partenza. L’aggiunta di nanocarica provoca una diminuzione dell’efficienza della schiumatura, un aumento di densità e della resistenza e tenacità a compressione. Le particelle di MMT interagiscono difatti con la resina e tendono a cambiare il comportamento della schiuma sotto carico. Si è ottenuto comunque un buon rapporto di schiumatura ed un miglioramento delle proprietà della schiuma in termini di tenacità a compressione per basso contenuto di MMT. In particolare per il contenuto di MMT pari al 3% si sono ottenuti i migliori risultati. 58 Rivista Italiana di Compositi e Nanotecnolgie – Volume 7, n°1 Aprile 2012 In riferimento alle proprietà di memoria di forma, l’aggiunta di nanocariche in basse percentuali, come quelle adottate nella sperimentazione, non influenza il recupero della forma. Ciò che cambia durante i cicli termomeccanici è il carico necessario alla memorizzazione della forma, che aumenta all’aumentare della percentuale di MMT. I risultati di questa e delle precedenti sperimentazioni hanno permesso di caratterizzare questa nuova classe di materiali che per le sue caratteristiche potrà trovare impiego non solo nel settore terrestre, ma anche in quello aeronautico ed aerospaziale in cui è necessario disporre di materiali leggeri, con elevate caratteristiche meccaniche e per alcune applicazioni dotati anche di memoria di forma. BIBLIOGRAFIA memory performances. J. Mater. Chem., 2010, 20, 3431-3441. 10. Di Prima, M.A.; Lesniewski, M.; Gall, K.; McDowell, D.L.; Sanderson, T.; Campbell, D, Thermo-Mechanical behavior of epoxy shape memory polymer foams. Smart Mater. Struct., 2007, 16, 2330-2340. 11. Squeo E. A. and F. Quadrini, Shape memory epoxy foams by solid-state foaming, Smart Mater. Struct. 19 (2010)105002 (9pp). 12. F. Quadrini, A. Guglielmotti, F. Lamastra, C. Lucignano, F. Nanni, L. Santo, E.A. Squeo, Epoxy nanocomposite foams by solid-state foaming, ICCE17, 26 July - 1 August 2009, Hawaii, USA. 13. Fabrizio Quadrini, Loredana Squeo, Solid-state foaming thermoset foams with shape accettato per pubblicazione Technology and Engineering. Santo, Erica Anna of nano-clay filled memory properties,, su Polymer-Plastics 1. Maniar, K.K. Polymer nanocomposites: A review. Polym.-Plast. Technol., 2004, 43, 427-443. 2. Li, T.; Zeng, X., Synergistic effect of epoxy/organophilic montorillonite nanocomposites and triphenyl phosphate on flame retardance enhancement of polypropylene. Polym.-Plast. Technol., 2007, 46, 1011-1020. 3. Cai, Z.Q.; Sun, J.; Ren, H.; Zhao, Q.; Zhou, Q., Effects of the heating rate and the amount of organic montmorillonite on the thermal properties of the novel liquid crystalline epoxy nanocomposite. Polym.-Plast. Technol., 2008, 47, 363-366. 15. Loredana Santo, Shape Memory Epoxy Foams: New Materials for Aerospace Applications, Materials Science Forum, (2012), Volumes 706 – 709, pp. 165-172. 4. Zheng, Y.P.; Zheng, J.X.; Li, Q.; Chen, W.; Zheng, X., The influence of high content nano-Al2O3 on the properties of epoxy resin composites. Polym.-Plast. Technol., 2009, 48, 384-388. 16. F. Quadrini, L. Santo, E.A. Squeo, Shape memory epoxy foams for space applications, Materials Letters, Volume 69, 15 February 2012, Pages 20– 23. 5. Nikje, M.M.A.; Tehrani, Z.M.; Garmarudi, A.B.; Haghshenas, M., Chemical treatment of silica nanoparticles by diethanolamine and γglycidoxypropyltrimethoxysilane and application of modified nanoparticles in epoxy-based composites. Polym.-Plast. Technol., 2009, 48, 891-896. 6. Zheng, Y.P.; Zhang, J.X.; Yu, P.Y.; Shi, W.; Wang, B., Investigation of the microstructure of epoxy resin/MWNTs nanocomposite by the positron annihilation technique. Polym.-Plast. Technol., 2010, 49, 1016-1021. 7. Zaarei, D.; Sarabi, A.A.; Sharif, F.; Gudarzi, M.M.; Kassiriha, S.M., Using of p-phenylenediamine as modifier of montmorrilonite for preparation of epoxy-clay nanocomposites: Morphology and solvent resistance properties. Polym.-Plast. Technol., 2010, 49, 285-291. 8. Lim, S.R; Chow, W.S., Fracture toughness enhancement of epoxy by organo-montmorillonite. Polym.-Plast. Technol., 2011, 50, 182-189. 9. Rosseau, I.A.; Xie, T., Shape memory epoxy: composition, structure, properties and shape 14. Santo L., Mascetti G., Villadei W., Bernabei M., Zolesi V., Shape Memory Epoxy Foams for Aerospace: Experimentation on ISS, Proceedings of 61 Int. Astronautical Congress, Prague, CZ, (2010) ref. IAC-10-A2.6.6. BREVE BIOGRAFIA DELL’AUTORE Loredana Santo è professore associato presso il Dipartimento di Ingegneria Industriale dell’Università di Roma “Tor Vergata” dal 2005. E’ titolare del corso di Tecnologia Meccanica e del corso di Sistemi Produttivi e Sostenibilità Energetica. La sua attività di ricerca è prevalentemente rivolta al settore dei materiali e processi innovativi. E’ autrice di più di 100 lavori pubblicati su riviste internazionale e atti di convegni internazionali. E’ nell’editorial board e revisore di riviste internazionali. Collabora con numerose aziende a progetti di ricerca industriale. E’ stata principal investigator dell’esperimento IFOAM realizzato sulla stazione spaziale internazionale con la missione STS 134 nel maggio 2011. 59 Rivista Italiana di Compositi e Nanotecnolgie – Volume 7, n°1 Aprile 2012 Compositi polimerici rinforzati con fibre naturali per applicazioni ecosostenibili. Claudio Scarponi Dipartimento di Ingegneria Meccanica e Aerospaziale,Università “La Sapienza”, Roma Via Eudossiana 18, 00184, Roma e- mail: [email protected] ________________________________________________________________________________________________ SOMMARIO / ABSTRACT Negli ultimi anni si è resa evidente una sempre crescente sensibilità verso le problematiche ambientali, sia negli ambienti politici internazionali che, più in generale, in ogni ambito socioeconomico. Sono pertanto in forte sviluppo tecnologie compatibili con lo sviluppo sostenibile, strettamente connesse a produzioni di energia da fonte pulita, con conseguente abbassamento della produzione di CO2 ed altri inquinanti, compresi i residui solidi. Il settore dei materiali svolge un ruolo importante in questo ambito e tra questi si stanno facendo strada i materiali compositi in fibra naturale (CFN), di recente introduzione nei processi produttivi. In un primo tempo le applicazioni sono consistite in impieghi di fibre corte con resine sintetiche, per passare poi alle fibre lunghe. Attualmente industrie, laboratori universitari e centri di ricerca internazionali stanno lavorando alacremente sui cosiddetti “green-composites”, integralmente biodegradabili, ottenuti mediante impregnazione di fibre naturali quali canapa e lino, solo per citare le fibre di maggiore importanza per l’Europa, con resine naturali. A titolo di esempio si possono citare il CNSL (Cashew Nut Shell Liquid) ed il PLA (PolyLactic Acid); quest’ultima matrice è quella su cui si sta operando maggiormente. La pressoché completa bio-degradabilità, l’assenza di agenti tossici ed il basso quantitativo di energia necessario per l’impiego di questi materiali, ne faranno dei protagonisti nell’immediato futuro. Numerosi studi sulla LCA (Life Cost Analysis) di particolari realizzati con compositi in fibra di vetro, comparati con analoghi, ottenuti con fibra naturale, dimostrano i consistenti vantaggi di questi ultimi. Presto la legislazione internazionale acquisirà il concetto che chi produce dovrà avere anche la responsabilità del riciclo. Tale aspetto non potrà più essere trascurato nella determinazione dei costi di produzione. Il problema dell'ecosostenibilità Nel secolo passato il rapidissimo e scarsamente regolamentato sviluppo tecnologico ha portato grandi ed innegabili benefici, ma è indubbio che è stato pagato un prezzo altissimo. Il nostro pianeta è arrivato a livelli terrificanti di inquinamento ambientale, cui sono facilmente ricollegabili sconvolgimenti climatici e danni spaventosi alla salute. Il problema dell'eco-sostenibilità dei materiali e delle energie rinnovabili è diventato un punto di prima importanza per l’immediato futuro, anzi, direi già nel presente. La continua evoluzione tecnologico-scientifica, che l'uomo alimenta giorno per giorno per migliorare la propria esistenza, non conosce soste e richiede un fabbisogno energetico che ha come risvolto negativo la lenta, ma inesorabile distruzione della salute del nostro pianeta e dei suoi abitanti. Nel tentativo di ridurre questo fenomeno risulta quindi necessario e non più rinviabile il ricorso ad uno sviluppo sostenibile, volto a garantire il benessere delle generazioni future. Ciò è indifferibile, sia nel mondo sviluppato che in quello in via di sviluppo. Nonostante tale necessità, sono ancora molti gli ostacoli da superare, primo fra tutti la diffidenza di approccio verso le moderne tecnologie a basso consumo energetico. Per scongiurare un danno irreversibile, le cui conseguenze ricadrebbero soprattutto sulle generazioni future, i Paesi più industrializzati hanno pianificato una serie di interventi per ridurre nel tempo la concentrazione atmosferica dei composti gassosi ad effetto serra, senza causare danni economici al settore produttivo. Tali interventi sono racchiusi nel Protocollo di 60 Rivista Italiana di Compositi e Nanotecnolgie – Volume 7, n°1 Aprile 2012 Kyoto, negli accordi di Copenaghen e nell'accordo sul pacchetto clima ed energia 2020-20, raggiunto in seno al Consiglio europeo, che prevede, da parte dei paesi membri dell'Unione Europea, di conseguire entro il 2020 la riduzione del 20% delle emissioni di gas serra, l'aumento dell'efficienza energetica del 20% ed il raggiungimento della quota del 20% di fonti di energia alternative. Un primo, fondamentale passo di salvaguardia è stato fatto. Ora occorre darsi da fare. Le diffuse preoccupazioni circa la conservazione delle risorse e la protezione dell’ambiente hanno condotto allo sviluppo di una varietà di tecniche di gestione dei rifiuti solidi per ridurre sia l’impatto ambientale delle differenti tipologie di rifiuto, sia l'impoverimento delle risorse naturali. La gestione dei rifiuti plastici non deve essere trattata come un problema individuale, piuttosto deve essere considerata come parte integrante del globale sistema di gestione dei rifiuti. Ad oggi, tale gestione considera, tra le altre, due opzioni fondamentali: Riciclo: consente di reintrodurre i rifiuti nel ciclo di consumo generalmente in applicazioni secondarie, visto che praticamente nella quasi totalità dei casi i prodotti riciclati hanno qualità inferiore rispetto a quelli originari. Risulta evidente che tale opzione può essere applicata solo nel caso in cui la quantità di energia consumata nel processo di riciclo stesso sia minore di quella richiesta per la produzione dei nuovi materiali. Recupero di energia: qualora non fosse possibile il riciclo dei rifiuti o non ci fosse mercato per il prodotto riciclato, l’incenerimento può essere utilizzato per produrre energia dal calore di combustione del rifiuto. Il recupero energetico prevede di riutilizzare l’energia contenuta nei rifiuti polimerici, interamente sfruttabile in quanto il loro potere calorifico è quasi pari a quello del carbone. In tal caso è importante vedere se possono essere implementati metodi per evitare nuova produzione di inquinanti, ad esempio recuperando l’anidride carbonica dai fumi di scarico. Risulta pertanto evidente che la disponibilità e l’utilizzo di materie prime ecosostenibili riduce fortemente i problemi di riciclaggio e le emissioni di gas inquinanti. E’ in questa direzione che si sta andando con l’opzione delle resine e fibre naturali. Life Cycle Assessment & Life Cycle Cost Si è già accennato che con molta probabilità nuove norme presto obbligheranno il fornitore di prodotti a riciclare a fine vita quanto immesso sul mercato. Nella realtà odierna sta prendendo sempre maggiore importanza la determinazione del cosiddetto LCC (Life Cycle Cost). Nel computo dei costi di produzione dovranno essere compresi anche i costi del riciclaggio del bene prodotto. Ciò significa che per ogni prodotto occorrerà identificare i metodi di smaltimento e definire procedure e costi conseguenti già in via di avvio della produzione. Risulta evidente che i costi di smaltimento, l’energia necessaria ed il conseguente inquinamento sono molto inferiori per i compositi “green”: per la produzione di fibre naturali, rispetto alle fibre di vetro, è necessario un quantitativo di energia decisamente inferiore. Lo sviluppo dell'analisi del “ciclo vitale” o altrimenti detta Life Cycle Analysis (LCA), prevede un approccio metodologico atto a studiare l'impatto ambientale dei prodotti industriali, considerando questi ultimi all'interno del loro intero ciclo vitale. Life Cycle Analysis è una metodologia di analisi che valuta un insieme di interazioni che un prodotto o un servizio ha con l'ambiente, considerando il suo intero ciclo di vita, che include i punti di pre-produzione (quindi anche estrazione e stoccaggio dei materiali), produzione, distribuzione, uso (quindi anche riuso e manutenzione), riciclaggio e dismissione finale. La LCA è riconosciuta a livello internazionale attraverso alcune norme ISO (International Organization for Standardization). In questo senso si intendono i vari steps che caratterizzano il ciclo vitale di un prodotto. Tra questi si distinguono: ñ Acquisizione del materiale grezzo: include tutte le operazioni di estrazione, 61 Rivista Italiana di Compositi e Nanotecnolgie – Volume 7, n°1 Aprile 2012 dalla ricerca e il recupero del materiale grezzo fino alla ricerca delle risorse energetiche per sostenere questo processo; ñ Produzione: include tutte le operazioni che trasformano il materiale grezzo ed è composto da tre sottofasi che sono il trattamento del materiale di base, la produzione del prodotto finale e la distribuzione; ñ Uso e manutenzione: ha inizio successivamente alla distribuzione e include sia l'utilizzo che ogni operazione di stoccaggio mirata a prolungare o comunque a mantenere il prodotto integro nell'arco della sua vita operativa; ñ Riciclo: inizia al termine della vita operativa del prodotto ed include anche le operazioni per inserire il prodotto in un processo di sviluppo economico e tecnologico per migliorare e convalidare sempre più le tecniche di riciclaggio. Le recenti serie standard, dalla ISO 14040 alla ISO 14043, prevedono linee guida dettagliate per condurre una corretta Life Cycle Analysis: ñ ISO 14040: Goal Definition and Scoping ñ ISO 14041: Life Cycle Inventory Analysis ñ ISO 14042: Life Cycle Impact Assessment ñ ISO 14043: Life Cycle Interpretation In figura 1 si può vedere un esempio della struttura della Life Cycle Analysis. fig. 1 – Fasi fondamentali della Life Cycle Analysis Rispetto alle specifiche applicazioni dei prodotti industriali possiamo riscontrare, per ognuno di questi, diversi consumi di energia, diversi processi di smaltimento e diverse emissioni. La metodologia di analisi Life Cycle Cost (LCC) riguarda la stima dei costi, in termini monetari, che originano in tutte le fasi della vita utile dell’opera, ossia costruzione, gestione, manutenzione ed eventuale demolizione/recupero finale. Lo scopo del LCC è quello di minimizzare la somma dei costi, opportunamente attualizzati, associati ad ogni fase del ciclo di vita, garantendo in tal modo benefici economici sia al proprietario/gestore che agli utilizzatori finali. Per svolgere un’analisi di tipo LCC è necessario stimare in anticipo il momento in cui si verifica un evento che dà origine ad un costo. Nella forma più semplice, questi eventi comprendono la costruzione, il costo dei materiali, del personale, dell’energia necessari al funzionamento dell’impianto, la manutenzione ordinaria e straordinaria, i processi a fine vita. Un sistema LCC, per essere affidabile, deve consentire di prevedere, tramite un modello probabilistico, quando la struttura o parti di essa si deteriora fino ad uno stato che richiede un intervento e quale tasso di sconto utilizzare per ogni intervento. Tale approccio consente di ottimizzare la progettazione di strutture e di ottenere migliori risultati in termini di durata, performance e sostenibilità dell’opera, grazie ad un adeguato dimensionamento, ai minori sprechi, al risparmio energetico e al contenimento della produzione di rifiuti. Rispetto all’approccio tradizionale, secondo il quale vengono stimati solamente i costi monetari diretti per la costruzione e la manutenzione, l’innovativa metodologia permette di estendere l’analisi del progetto a tutta la vita utile dell’opera, evidenziando in tal modo la reale economicità dell’investimento. L’analisi congiunta LCA e LCC consente effettivamente di valutare aspetti come quelli ambientali e sociali che normalmente sono tenuti in scarsa considerazione, ma che, come conseguenza del mutato clima internazionale che influenza le politiche per ambiente, conservazione dell’energia, sostenibilità e questioni sociali, acquisteranno sempre più importanza nell’immediato futuro. Vengono così tenuti in conto gli effetti sulla salute umana, sulla qualità dell'ecosistema e sull'impoverimento delle risorse, gli impatti di carattere economico e sociale. Gli obiettivi consistono nel definire un quadro completo 62 Rivista Italiana di Compositi e Nanotecnolgie – Volume 7, n°1 Aprile 2012 delle interazioni con l'ambiente di un prodotto o di un servizio, contribuendo a comprendere le conseguenze ambientali direttamente o indirettamente causate e quindi dare a chi ha potere decisionale (chi ha il compito di definire le normative) le informazioni necessarie per definire i comportamenti e gli effetti ambientali di un’attività e identificare le opportunità di miglioramento al fine di raggiungere le migliori soluzioni per intervenire sulle condizioni ambientali. La figura 2 riassume le principali relazioni tra i vari stadi del Life Cycle Assessment. fig. 2 – Life Cycle Assessment Le fibre naturali Questi nuovi materiali possono rappresentare una valida alternativa bio-compatibile ai compositi ottenuti da fibre e matrici polimeriche di natura sintetica, in particolare alle fibre di vetro con varie matrici polimeriche, quali le epossidiche, le poliestere e le vinilestere. L’interesse è giustificato da molteplici fattori, quali: • • • • bassa densità basso costo e facile reperibilità buone proprietà meccaniche specifiche “bio-compatibilità”, non nocività verso l’ambiente, non tossicità o Ambiente di lavoro più sicuro e salutare • • • • • • trattamenti chimici semplici ed efficaci ridotta usura degli utensili eccellente drappabilità caratteristiche crash-safe (antiframmentazione) buone proprietà isolanti termiche, acustiche ed elettriche buona resistenza agli impatti L’insieme di queste caratteristiche, unitamente ad un prezzo sufficientemente interessante per le applicazioni industriali, le rende particolarmente idonee all’utilizzo come rinforzo a basso costo, alternativo alle fibre di vetro. Un ulteriore importante fattore che ne facilita lo sviluppo è la possibilità di impiegare stessi processi, attrezzature, manodopera, equipaggiamenti, controlli e know-how. Ad introduzione di questo nuovo interessante argomento si ritiene opportuno fare chiarezza sulla nomenclatura generalmente utilizzata nello stato dell’arte, partendo dalla microstruttura. Le fibre naturali (FN) sono composte principalmente da filamenti di cellulosa immersi in una matrice di emicellulosa e/o lignina; altre componenti quali pectina, umidità, cera, hanno generalmente effetti negativi dal punto di vista meccanico. Dalle fibre si ottengono tessuti e nastri unidirezionali. In alcuni casi, quali il lino, sono in commercio anche tessuti e nastri preimpregnati. fig. 3a – Struttura interna di uno stelo di canapa In figura 3 sono visibili una sezione trasversale di uno stelo di canapa (a) ed una 63 Rivista Italiana di Compositi e Nanotecnolgie – Volume 7, n°1 Aprile 2012 rappresentazione schematica della struttura interna di uno stelo di lino fig. 3b – Struttura interna di uno stelo di lino Con l’ausilio della figura 3b, ove sono visibili le differenze tra le varie componenti, possiamo distinguere in particolare tra: ñ singola cellula, approssimativamente cilindrica cava, molto allungata, generalmente detta fibra elementare, è composta a sua volta da microfibrille cementate tra loro da emicellulose ñ fibra vegetale multicellulare (solitamente chiamata fibra tecnica) consistente in varie fibre elementari cementate insieme da una sostanza intercellulare isotropa diversa dalla cellulosa; presentano inoltre una cavità centrale detta “lacuna”, di posizione e dimensioni variabili ñ filo, ossia più fibre tecniche affasciate ed eventualmente torte. Caratteristiche meccaniche, dimensioni e composizione variano non solo ovviamente tra le diverse specie di piante considerate, ma anche all’interno della singola pianta notevoli differenze possono essere rilevate in dipendenza dal luogo di provenienza, dalle condizioni climatiche, variabili generalmente di anno in anno, oltre alle diverse tecniche di estrazione delle fibre dalla pianta madre. L’insieme di questi fattori produce variazioni anche sensibili delle caratteristiche elastiche e meccaniche delle fibre; per questo motivo in letteratura si leggono valori dei parametri che ne descrivono le proprietà anche considerevolmente diversi. I maggiori produttori di dette fibre molto spesso sono paesi in via di sviluppo; è possibile capire il crescente interesse per tali materiali soprattutto in queste aree. La FAO ha dedicato l’anno 2009 alle fibre naturali. Come esperienza diretta di quanto detto, basterà ricordare che nell’ottobre 2007, a Roma, in occasione della “International Conference on Innovative Natural Fibre Composites for Industrial Applications”, sono pervenuti contributi da tutti e cinque i continenti: Francia, Germania, GB, Paesi Bassi e Lituania dall’Europa, Kenia e Tanzania dall’Africa, Texas dall’USA, Brasile ed Argentina dal Sud America, Cina, India, Bangladesh e Giappone dall’Asia e Nuova Zelanda dall’Oceania. Un interessante confronto tra le fibre naturali e le fibre di vetro. In tabella 1 è possibile vedere un confronto in termini di costi energetici, tra le fibre naturali e le fibre di vetro: Costo energetico per 1000 kg di fibra prodotta Fibre di vetro Fibre naturali Consumo energetico (GJ) 48,33 3,64 Emissioni di CO2 (Kg) 2040,00 660,00 Emissioni Cox (Kg) 0,80 0,44 Emissioni Sox (Kg) 8,79 1,23 Emissioni Nox (Kg) 2,93 1,07 Particolato 1040,00 240,00 (Kg) Tab.1 – Impatto ambientale ed energetico delle FN e delle Fiberglass La produzione di fibre di vetro richiede inoltre una fornace che operi alla temperatura 1550°C, il che fornisce un saggio dei consumi di combustibile necessari per tale processo rispetto all'impiego di fibre naturali. Altre importanti caratteristiche sono riportate in tabella 2: 64 Rivista Italiana di Compositi e Nanotecnolgie – Volume 7, n°1 Aprile 2012 Caratteristiche Fibre naturali Fibre di vetro Densità Bassa Alta Costi Bassi Bassi Rinnovabilità Sì No Riciclabilità Sì No Consumo di energia Basso Alto Disponibilità Ampia Ampia Usura degli utensili No Sì Pericolo per inalazione No Sì Biodegradabilità Sì No Tab.2 – Confronto tra FN e Fiberglass Un ulteriore vantaggio importante delle fibre naturali è il fatto che queste possono essere incenerite al termine del loro Life Cycle per produrre energia (magari recuperando i fumi per evitare ulteriori formazioni di prodotti della combustione), oppure possono essere tagliuzzate in fibre corte e riutilizzate tal quali per produrre piastrelle o altri semilavorati da impiegare, per esempio, nell’edilizia. Il futuro delle fibre naturali Nei precedenti paragrafi si è mostrato come le fibre naturali sono estremamente favorite in campi connessi con problemi ambientali: disponibilità di materia prima, costo dei macchinari, impatto ambientale e complessità del processo produttivo, pericolosità dei rifiuti, sprechi energetici. Il successo del materiale è inoltre strettamente connesso con le sue proprietà meccaniche, termiche ed acustiche, responsabili della qualità del prodotto finito. Queste proprietà hanno dimostrato l’effettiva concorrenzialità di questi materiali con le fibre di vetro E e, per alcune applicazioni, anche con alluminio e acciaio. I sorprendenti valori delle caratteristiche specifiche permettono di considerare le fibre naturali applicabili in campo aeronautico, a cominciare dall’aviazione ultraleggera, che non deve sottostare agli onerosissimi vincoli e costi della certificazione, giustamente considerati nell’aviazione di categorie di peso superiori. In tutto il mondo, sia nei paesi sviluppati che in quelli in via di sviluppo, le proprietà delle fibre naturali sono studiate in centri di ricerca e in industrie per le più svariate applicazioni. Alla prima Conferenza del 2007, precedentemente citata, se ne è aggiunta una seconda nell’Aprile del 2009 ed una terza, sempre a Roma, si è conclusa con ottimi risultati nel 2011. La buona risposta ai test d'impatto, congiuntamente all'ecosostenibilità, la biocompatibilità, le buone proprietà meccaniche e la possibilità di produrre energia dal riciclo del materiale, ha aperto nuove possibilità alle fibre naturali. I campi di interesse delle fibre naturali sono i più diversi: • • • • • • • • • Agricoltura (oggi) Costruzioni civili (oggi) Industria Nautica (oggi) Industria Automobilistica (oggi) Conservazione (in futuro) Imballaggio (in futuro) Telecomunicazioni (in futuro) Ingegneria Biomedica (in futuro) Industria Aerospaziale (in futuro) Applicazioni Industriali I compositi fatti con FN non sono dei materiali nuovi; i maggiori esempi storici del nostro secolo sono: • 1939-45: a causa della carenza di alluminio in Inghilterra, per dei pannelli di rivestimento della fusoliera degli Spitfire fu creato il “Gordon-Aerolite”, un composito fenolo-formaldeide rinforzato con fibre di lino, considerato come il “più vicino approccio a qualunque materiale plastico mai fatto con resistenza paragonabile al metallo” (FLIGHT) • 1942: Henry Ford, prototipo di automobile costruita usando compositi rinforzati in fibra di canapa (non entrò in produzione a causa delle limitazioni economiche di quel tempo) • Trabant (1950-90): la carenza di acciaio portò alla prima auto di 65 Rivista Italiana di Compositi e Nanotecnolgie – Volume 7, n°1 Aprile 2012 produzione di massa ad essere costruita con FN. Oggi le FN sono utilizzate con successo nell’industria automobilistica, con una riduzione di peso fino al 30% delle equivalenti parti costruite con materiali diversi. In genere si utilizzano tra i 10 ed i 35 Kg di FN per veicolo, a seconda del tipo e delle dimensioni. Uno degli esempi più recenti è la Lotus Eco Elise. Presentata al British International Motor Show l’8 Luglio 2010, è costruita con materiali ecosostenibili, quali canapa e sisal, insieme con tecnologie green e vernici a base d’acqua. Il suo peso è di 32 Kg inferiore rispetto alla Elise modello standard. L’impiego di FN (ad eccezione di lana e cotone) nell’industria automobilistica tedesca è aumentato da 9.600 a 19.000 tons dal 1999 al 2005; questa rapida crescita è un chiaro esempio dei vantaggi e del potenziale dei bio-compositi. In figura 4 è possibile vedere alcune applicazioni in una Mercedes classe E. • influenza delle variabili ambientali e requisiti addizionali di durata, affidabilità e manutenibilità • riproducibilità delle caratteristiche meccaniche e più in generale “confidenza” con le performances del materiali • requisiti relativi alla certificazione (non necessaria per l’aviazione ultraleggera) Per questi motivi la sostituzione con un nuovo materiale ha un elevato impatto sui costi ed i tempi richiesti dalle procedure di certificazione; il processo è generalmente lungo e costoso in termini di prove sperimentali e simulazioni numeriche. Pertanto i ricercatori universitari si stanno orientando a perseguire l’obiettivo in maniera molto graduale e si sono quindi dedicati a quattro principali filoni di ricerca, con il fine di migliorare/determinare: • qualità del processo • miglioramento delle caratteristiche d’interfaccia • caratterizzazione meccanica e riproducibilità delle proprietà • caratterizzazione elettromagnetica • resistenza all’impatto ed all’environment aeronautico • Life Cycle Assessment (LCA) & impatto ambientale fig. 4 – Mercedes Classe E Le fibre naturali sono attrattive anche per applicazioni civili (prefabbricati, pavimenti, pannelli, materiali per muratura), in particolare per i paesi in via di sviluppo, grazie al loro basso costo, facile reperibilità, riduzione dei tempi di costruzione e delle emissioni inquinanti: in GB circa il 50% delle emissioni di CO2 proviene dal settore delle costruzioni civili. Nelle costruzioni aeronautiche la situazione è profondamente differente per varie ragioni: • alti livelli di carico • fatica termica e/o meccanica e/o acustica Come primo passo, si è partiti con l’introduzione dei CFN per la costruzione di parti strutturali non primarie per l’aviazione ultraleggera, per la quale le procedure di certificazione non sono applicabili, per poi passare in una seconda fase ad applicazioni per la cosiddetta “aviazione generale”, soggetta a certificazione. Poi si vedrà. Grazie alla loro bassa densità ed alle buone proprietà isolanti i CFN potrebbero essere usati principalmente in: • interni, quali cappelliere, sedili, pannelli, tavoli • applicazioni esterne non strutturali, quali cappottature, raccordi alafusoliera, superfici di controllo. 66 Rivista Italiana di Compositi e Nanotecnolgie – Volume 7, n°1 Aprile 2012 Nelle figure 5 e 6 sono riportate le due realizzazione fatte per velivoli ultraleggeri con tessuto in fibra di canapa e resina epossidica, rispettivamente i prototipi di un timone di direzione e di un naca motore. March 2004.Scarponi C., Pizzinelli C. S., Sanchez-Saez S. & Barbero E:, Impact Load Behaviour of Resin Transfer Moulding (RTM) Hemo Fibre Composite Laminates, Journal of Biobased Materials and Bioenergy, Vol. 3 N. 3 Special Issue, September 2009, pagg. 298-310 BREVE BIOGRAFIA DELL’AUTORE fig. 5 - Timone di ultraleggero Storm 280 SI fig. 6 - Naca motore di ultraleggero MAG 1 BIBLIOGRAFIA 1. 2. 3. 4. 5. 6. 7. Scarponi C., “Fibre Naturali, Applicazioni industriali”, Compositi Magazine, Anno III, Dicembre 2008, pagg. 14-18 Scarponi C., “Fibre Naturali, Applicazioni industriali”, Compositi Magazine, Anno IV, Marzo 2009, pagg. 8-12. Scarponi C. & Andreotti C., “Industrial Applications of Natural Fibres Advanced Composites: Environmental Effects and Comparative Life Cycle Analysis”, Int. Journal of Materials &Product Technology, vol. 36 Special Issue 1/2/3/4, 2009, pagg. 241-260 Witten E., “The European Composites Market: market development, challenges and chances”, 1th International AVK Conference , September 22-23, 2008. Suddell B. C., “Industrial Fibres: Recent & Current Developments”, FIMMM FAO event, Rome, October 20, 2008. Thomas S., “Natural Fibre Composites: Macro to Nanoscales, Int. Journal of Materials &Product Technology, vol. 36 Special Issue 1/2/3/4, 2009, pagg. 317-333 Joshi S.V., Drzal L.T., Mohanty A.K., Arora S., “Are natural fiber composites environmentally superior to glass fiber reinforced composites?”, Composites, Part A: Applied Science and Manufacturing, Vol. 35, Issue 3, pages 371-376, Claudio Scarponi è professore di Tecnologia delle Costruzioni Aerospaziali presso la Facoltà di Ingegneria dell'Università “Sapienza” di Roma. Presta la sua attività di ricerca all’interno del Dipartimento di Ingegneria Meccanica e Aerospaziale. E’ autore di numerose pubblicazioni su tutte le più prestigiose riviste internazionali dedicate ai materiali compositi, a partire dall’anno 1983. Per molte di queste esercita l’attività di revisore scientifico. Ha iniziato ad occuparsi di materiali compositi con fibre naturali nel 1999, anno in cui risalgono le prime pubblicazioni sull’argomento. Ogni due anni a Roma, Facoltà di Ingegneria, a partire dal 2007, è organizzatore, in qualità di Chairman, delle Conferenze Internazionali dedicate alle Applicazioni Industriali dei materiali compositi realizzati con fibre naturali, la cui terza edizione si è tenuta a ottobre 2011. In ambito europeo esercita l’attività di Esperto Valutatore nel programma europeo denominato “CLEAN SKY”. 67 Rivista Italiana di Compositi e Nanotecnolgie – Volume 7, n°1 Aprile 2012 Polymer Nanocomposites for Injected Molded Applications Sandro Mileti a, Emily Yaneth Scianna b, Sergio Bocchini b, Claudio Soffietti a, Giulio Malucelli b a Aviospace S.r.l. an EADS Astrium company b Department of Materials Science and Chemical Engineering - Politecnico di Torino Abstract Nanocomposites made through Resin Transfer Molding (RTM) technology are gaining much interest recently. Significant efforts are underway to control the nano-structures via innovative synthetic approaches. The properties of nanocomposite materials depend not only on the properties of their individual constituents but also on the homogeneity of nanoparticle distribution and on the interfacial characteristics. Indeed, thermal stability and mechanical properties such as elastic modulus, toughness, electric conductivity and flame retardancy can be enhanced by optimizing the fabrication process and controlling nanoparticle dispersion,. The improvements that can be achieved strongly depend on the type of employed nanoparticles; furthermore the nanofillers are not able to ameliorate all the nanocomposite features at the same time. Therefore, a multi nano-dispersion strategy has been investigated. The possibilities of producing materials with tailored physical & electronic properties at low cost could result in interesting applications for the aerospace industry. 1. Introduction In the last two decades, polymer nanocomposites have drawn serious attention both from industry and academic research. Indeed, significant improvements in various properties at low filler concentration are very attractive to industry. In addition, researchers show growing interest in studying the influence of nanofiller particles on the thermal, electrical and mechanical properties of the composites [1]. There are two main challenges in developing nanocomposite materials after the desired polymer has been selected for this purpose. First, the choice of nano-particles requires an interfacial interaction and/or compatibility with the polymer matrix. Second, the processing technique should address proper uniform dispersion and distribution of nano-particles or acceptable nano-particle aggregates within the polymer matrix. In addition, the amount of nanoparticulate added to polymer matrix also plays a significant role in designing the mechanical properties of the nanocomposites: usually it is enough to employ very small quantities in order to achieve significant improvements. As well described in literature, the addition of some inorganic nanoparticles, such as layered clays [2-3], carbon nanotubes [4-5] or spherical silica [6-7], into an epoxy matrix is an effective method to improve such properties as stiffness, impact resistance, electric conductivity and thermal stability. As a matter of fact, epoxy resins exhibit good stiffness, strength, thermal stability and creep resistance and are widely applied for coatings, adhesives, and composites. However, because of their highly cross-linking density, they show low toughness and poor crack resistance at room temperature. This is the basic reason why a large body of literature has been devoted to toughen this matrix. However, a hybrid approach of adding different nanofillers into epoxy resin has not been widely investigated. The major focus of this work is the study and development of multifunctional epoxy nanocomposites for Resin Transfer Molding (RTM) applications containing two types of nanofillers and the investigation on their synergistic effects as well, for improving the mechanical and thermal properties of the pure epoxy resin. Indeed, the main task was to successfully disperse the nano particles into the high viscosity of RTM resin which made this work difficult and challenging. To this aim, SEM, TGA, DMTA, rheological and mechanical tests have been performed. 68 Rivista Italiana di Compositi e Nanotecnolgie – Volume 7, n°1 Aprile 2012 2. Experimental During the experimental phase, the effect of different nanoparticles has been assessed. In particular, natural Montmorillonite modified with a quaternary ammonium salt (Cloisite 30B, MMT), two types of Polyhedral Oligomeric Silsesquioxanes (namely POSS-OC - Octakis[2-(3,4epoxycyclohexyl)ethyl] dimethylsiloxy] octasilsesquioxane, POSS-POG (PolyglycidylOctasilsesquioxane) and expanded graphite (BNB90) were selected. The chosen matrix was a bicomponent Cycom 823 RTM low viscosity liquid epoxy resin based on a bisphenol A. 3. Dispersion and Rheology A rheological characterization of the heterogeneous, liquid thermoset nanocomposites prior to curing has been applied in our study to gain a fundamental understanding of the structure–property relationship and also for optimizing the processing of these materials. Initial investigations focused on forming blends by adding the selected nanoparticles at different amounts (2.5 and 5% by weight) into the epoxy resin in order to evaluate the achieved degree of dispersion. Several strategies were applied before reaching a uniform distribution of the nanofillers into the cured epoxy matrix. Some previous dispersion attempts performed on other types of nanoparticles (boehmites - Disperal60, SepioliteCD1) showed sedimentation and/or agglomeration during the polymerization process. Therefore, these fillers were obviously screened out from the present study. On the other hand, suspension and dispersion of POSS-OC, POSS-POG, Cloisite30B (C30B) and BNB90 expanded graphite were successfully achieved. Figure 1 shows some examples where sedimentation phenomena occurred, as revealed by Scanning Electron Microscope (SEM) and Thermal Gravimetric Analysis (TGA). The TGA was carried out using a TGA Q500 by TA Instruments, all measurements were conducted under air flow, with a sample weight of about 10 mg; for each test the heating rate was 10°C/min from 50 to 800°C. Figure 1: SEM and TGA examples of sedimentation occurring on resin with 5% of SepioliteCD1 and 2,5 % of Disperal60. 69 Rivista Italiana di Compositi e Nanotecnolgie – Volume 7, n°1 Aprile 2012 The defined successful dispersion method followed the steps here reported; steps are the same for the preparation of all the nanocomposites. The epoxy resin added of 2.5 or 5% of nanofiller was first stirred mechanically for 30 min with heat up to 60°C and subsequently by sonication mix for 1 hour. Then, the epoxy hardener was added to the system, which was stirred for 10 minutes before degassing under vacuum for 60 minutes. The modified resin systems were then finally poured into the test sample molds and heated up to 125°C for 1 hour for completing the polymerization reaction. 4. Characterization Features like mechanical properties and morphology of injection molded composites, strongly depend on thermo-mechanical processing variables [8]. The control of the morphology in the polymer composites represents the most fundamental and important goal [9-10], since it can significantly influence the properties of materials. Change of the structure on molecular or macroscopic level may improve dramatically mechanical properties, e.g. modulus, stiffness and impact strength [11-12] as well as toughness and flexural modulus. Microscopic observations (SEM) have been done for better understanding of conformity between: i) processing conditions and morphology, ii) mechanical properties and morphology. In order to assess the morphology, the size of the agglomerates and thus, to evaluate the quality of the nanoreinforced blends, Scanning Electron Microscopy (SEM) technique was used. As observed by the SEM images shown in Figures 2 and 3, both Cloisite30B- and BNB90-based nanocomposites evidence a uniform dispersion of the nanofillers within the epoxy matrix, thus validating the dispersion process developed. Same dispersion results were observed for POSS-OC and POSS-POG. Fig.2 SEM of epoxy with Cloisite30B dispersed at 2.5% (left) and 5% (right) Fig.3 SEM of epoxy with BNB90 dispersed at 2.5% (left) and 5% (right) 70 Rivista Italiana di Compositi e Nanotecnolgie – Volume 7, n°1 Aprile 2012 4.1 Rheology characterization The rheological characterization of polymer nanocomposites is mostly devoted to better understand the dynamics of nanoscopically confined polymers [13-14]. Systematic rheological studies of polymer nanocomposites are vital for their process technology, but recent studies on the rheology of nanocomposites reported in the literature have been focused mostly on thermoplastic polymer/layered silicate hybrids [13]. The rheology of thermoset nanocomposite precursors is still less investigated. First of all, we measured the viscosity of nanoparticles dispersions at two different loadings (2.5% and 5%), without the addition of the hardener. These tests are essential for RTM application since the viscosity values of the dispersions, under certain temperature conditions, could preclude their application with RTM technology if they result too high. The viscosity tests have been performed using an ARES plate-and-plate viscometer at different temperatures (i.e. 25, 35 and 45°C). The obtained data are collected in Table 1. Table 1 Viscosity Measurements Resin + Nanofiller 25°C (cps) 35°C (cps) 45°C (cps) Epox (Cycom 823 RTM) (no hardener) 150 (220) 80 (100) 50 (60) Epox + C30B (2.5%) 240 120 70 Epox + C30B (5%) 320 160 90 Epoxy + BNB90 (2.5%) 450 210 110 Epoxy + BNB90 (5%) 550 270 165 Epoxy + POSS-OC (2.5%) 220 120 65 Epoxy + POSS-OC (5%) 270 140 85 Epoxy + POSS (POG) (2.5%) 170 85 50 Epoxy + POSS-POG (5%) 170 85 50 The viscosity curves of the nanofilled systems (just after the dispersion process) reveal that the worst miscibility is shown for graphene (BNB90) and for the system containing 5% of Cloisite. All the systems investigated evidence low viscosity values while increasing the temperature and so they turn out to be suitable for RTM application. As an example, the viscosity values at 25°C vary from 170 (POSS-POG) to 550 cps (5% of BNB90) while the viscosity of the neat epoxy resin is 220 cps (Table 1). On the other hand, the viscosities of the dispersions significantly decrease, ranging between 165 cps for 5% BNB90 to 50 cps POSS-POG, when the tests are performed at higher temperatures (45°C). The increase of viscosity can be attributed to the formation of a so-called ‘house-of-cards’ structure in which edge-to-edge and edge-to-face interactions between dispersed layers form percolation structures (Messersmith and Giannelis [18]). 4.2 DMTA Measurements Another ‘‘nano-effect’’ noted in the literature concerns the change in the Tg of the polymer matrix in the presence of nanosized particles. Both increases and decreases in the Tg have been reported dependent upon the interaction between the matrix and the nano particles. More specifically, if the addition of a particle to an amorphous polymer leads to a change in the Tg, the resultant effect on 71 Rivista Italiana di Compositi e Nanotecnolgie – Volume 7, n°1 Aprile 2012 the composite properties would be considered a ‘‘nano-effect’’ and not predictable employing continuum mechanics relationships unless the Tg changes were properly accounted for or were quite minor. The glass transition of a polymer will be affected by its environment when the chain is within several nanometers of another phase [15]. Tg of the composites can be determined by the tanδ peak temperature, as clearly described in the literature [17]. In this work the Tg of all blends were monitored in a DMA tester in order to verify not only the Tg modifications but also the storage modulus (G') changes. The analysis was performed with a DMA Q800 by TA Instruments, the fixed frequency mode at 1 Hz with amplitude of 15 µm, the temperature range was from 35°C to 200°C, heating rate 3 °C/min. Rectangular DMA specimens measuring 40 x 12 x 3 mm. The DMA uses a single cantilever. In Fig.5a it is easily observed that the presence of 5% Cloisite30B (MMT) lowers the Tg value with respect to the pure epoxy system (Fig.4a) owing probably to both the locking effect of the rigid MMTparticles and the promotion of curing by the nanoparticles. This means that the process time of the MMT-epoxy system for the infiltration stage in liquid composite molding is going to be much shorter than that of the pure epoxy. For the POSS-POG blends (Fig.6a) the maximum peak for each curve falls at slightly the same Tg temperature. The relatively no changes in transition temperature suggests that there is no change in the rigidity of the nanofiller/matrix interface and no change in the mobility of the interfacial region. Opposite results were obtained for the POSS-OC and BNB90 systems. While Tg raised significantly only at high loading (Fig.7a) for the former, the glass transition temperatures for BNB90 nanocomposites increased with increasing the nanofiller loading (Fig.8a). This phenomenon is due to the fact that BNB90s are able to limit the thermally induced segmental motions of the polymer chains in the composites, resulting a higher Tg [16], [17]. The graphs also report the storage modulus versus temperature profiles from DMA measurements at both nanoparticle concentrations. Compared to neat Cycom 823 resin (Fig.4b), the storage modulus of all the nanocomposites increases but significantly only for 2.5 wt% Cloisite30B clay raising from 1.97 GPa for neat Cycom 823 to 2.5 GPa (+27%, Fig.5b). The incorporation of stiffer clay to the resin (having considerably lower stiffness than clay) has clearly contributed to the storage modulus enhancement. On the other hand, the glass transition temperature (Tg) as assessed from the tanδ curves remains almost unaffected with the addition of clay at 2.5%. This probably indicates that clay does not molecularly interact with the matrix. Table 2 summarizes the DMTA results of all tested compounds. (a) (b) Fig.4 Neat Resin 72 Rivista Italiana di Compositi e Nanotecnolgie – Volume 7, n°1 Aprile 2012 (a) (b) Fig.5 Resin with Closite30B (a) (b) Fig.6 Resin with POSS-POG (a) (b) Fig.7 Resin with POSS-OC 73 Rivista Italiana di Compositi e Nanotecnolgie – Volume 7, n°1 Aprile 2012 (a) (b) Fig.8 Resin with BNB90 Table 2 DMTA Test Results Summary Resin + Nanofiller Tg (°C) Modulus @ 50°C Epoxy + C30B 2.5% 135 2508 ± 107 Epoxy + C30B 5% 126 2435 ± 211 Epoxy + POG 2.5% 134 2360 ± 150 Epoxy + POG 5% 132 2224 ± 150 Epoxy + OC 2.5% 135 2343 ± 11 Epoxy + OC 5% 139 2000 ± 39 Epoxy + BNB90 2.5% 144 2180 ± 48 Epoxy + BNB90 5% 140 2224 ± 31 4.3 Flexural Modulus Table 3 collects the mechanical data concerning the flexural behavior of the nanocomposites. A quite significant increase (18%) in the flexural modulus was found when 5% Cloisite 30B was added to the epoxy matrix. Tests have been conducted following the ASTM D790 standard. Table 3 Flexural Modulus Results Blends Epoxy (datasheet) Epoxy (measured) Epoxy + C30B 5% Epoxy + OC 5% Flexural Modulus (GPA) 3.4 3.23 ± 0.11 3.95 ± 0.18 3.03 ± 0.09 5. Conclusions In this study we performed an extensive morphological, rheological and mechanical characterization of the various nanocomposite epoxy systems suitable for RTM. The main focus was to develop a dispersion technique tailored for the low viscosity resin system and to exploit the 74 Rivista Italiana di Compositi e Nanotecnolgie – Volume 7, n°1 Aprile 2012 benefits coming from nanoparticles on the final thermal and mechanical properties of the obtained nanocomposites. Dispersions of Closite30B, POSS-OC, POSS-POG and BNB90 expanded graphite were successfully achieved using the same dispersion process developed. The addition of low loading of Cloisite30B evidenced significant improvements of the thermomechanical properties for the fabricated nanocomposites. This behavior was ascribed to the good dispersion of nano particles within the matrix, as validated through the surface observation by SEM. This phenomenon further revealed the importance of filler dispersion and distribution in affecting the resulted thermal-mechanical properties of the fabricated composites. In general, the nanofillers investigated turned out to have a great potential to influence the characteristic and engineering behavior of the produced nanocomposites. For the aerospace industry, some of these materials could be relatively easy to bring into production process giving more performing composites capable to replace traditional composites or metallic counterparts. The future work will include application of the nano-modified resin with carbon-fibre reinforcement in order to evaluate the effect of the concurrent presence of both reinforcements on the final properties after the application of the RTM technique. Acknowledgements Piemonte Region, Italy (TOP project, P.O.R. F.E.S.R. 2007-2013 of the Piemonte Region – Bando Sistemi Avanzati di Produzione per l’anno 2008) is gratefully acknowledged for having supported the research. References [1] Nalwa H. S.: Polymeric nanostructures and their applications. American Scientific Publishers, Los Angeles (2007). [2] Kornmann X, Lindberg H, Berglund L A (2001) Polymer 42: 4493. [3] Ni Y, Zheng SX, Nie KM (2004) Polymer 45: 5557 [4] Khabashesku VN, Margrave JL, Barrera EV (2005) Diam Relat Mater 14: 859. [5] Barrau S, Demont P, Maraval C, Bernes A, Lacabanne C (2005) Macromol Rapid Commun 26: 390. [6] Ochi M, Matsumura T (2005) J Polym Sci Part B: Polym Phys 43: 1631. [7] Matejka L, Strachota A, Plestil J, Whelan P, Steinhart M, Slouf M (2004) Macromolecules 37: 9449 [8] J.C. Viana, A.M. Cunha, N. Billon, The Tensile Behaviour of an Injection-Molded Propylene-Ethylene, Polymer International 43 (1997) 159-166. [9] L.A. Utracki, Polymer Blends Handbook, Kluwer Academic Publishers, 2002. [10] L.A. Dobrzaski, A. Tomiczek, B. Tomiczek, A. lawska-Waniewska, O. Iesenchuk, Polymer matrix composite materials reinforced by Tb0.3Dy0.7Fe1.9 magnetostrictive particles, Journal of Achievements in Materials and Manufacturing Engineering 37/1 (2009) 16-23. [11] C.E. Powell, G.W. Beall, Physical properties of polymer/clay nanocomposites, Solid State and Materials Science 10 (2006) 73-80. [12] G. Wróbel, J. Kaczmarczyk, J. Stabik, M. Rojek, Numerical models of polymeric composite to simulate fatigue and ageing processes, Journal of Achievements in Materials and Manufacturing Engineering 34/1 (2009) 31-38. [13] R. Krishnamoorti, R.A. Vaia and E.P. Giannelis, Chemistry of Materials, 1996, 8, 8, 1728. [14] R. Krishnamoorti and E.P. Giannelis, Macromolecules, 1997, 30, 14, 4097. [15] Polymer nanotechnology: Nanocomposites D.R. Paul, L.M. Robeson Polymer 49 (2008) 3187–3204 Polymer 49 (2008) 3187–3204 [16] Liao, Y. H. : Processing Technique and Mechanical Properties of Functionalized SWNT-Reinforced Composites. MSc. Thesis. The Florida State University, College of Engineering, 2003. [17] Choi, Y.-K., Gotoh, Y., Sugimoto, K.I., Song, S.-M., Yanagisawa, T., and Endo, M.: Processing and Characterization of Epoxy Nanocomposites Reinforced by Cup-Stacked Carbon Nanotubes. Polymer, 46, 2005, p.11489-11498. [18] Synthesis and Characterization of Layered Silicate-Epoxy Nanocomposites, Chem. Mater., 1994, 6 (10), pp 1719– 1725 DOI: 10.1021/cm00046a026,1994 75 Rivista Italiana di Compositi e Nanotecnolgie – Volume 7, n°1 Aprile 2012 From the ashes of the old Victorian parlour-room: an unconventional natural fibre, or ‘keep the aspidistra flying’ again G. RINALDI (*) , M. SCARSELLA (*), O. HERPIN (**) (*) Dept. of Chemical Engineering Materials Environment- University ‘Sapienza’ of Roma, Italy (**) Chemical Engineer (Erasmus program graduation in Italy) Figure 1- Aspidistra plant Introduction The Aspidistra Elatior, native to the eastern Himalayas, China and Japan, is an old-fashioned toughleathery foliage plant, known as ‘cast iron plant’ in the U.K. or ‘bar-room plant’ in the U.S.A. Aspidistra was the favourite indoor plant of the Victorian era, when the Houses were anything but bright and airy; in fact it tolerates dust, as well heat, cold, wet soil, drought, neglect and dimly lighted places. Temperatures as low as -5°C or as high as +40°C make no injury to its foliage, as low light levels (10 foot candles) do. The dark-green, shiny and corn-like non toxic and extremely long lasting leaves of the aspidistra elatior can grow up to 24 inches long. The plant cannot tolerate only the full sunlight (photobleaching). Its propagation can be executed by the division of its rhizome or by seeds, even if the seed is not readily available (1). The ‘poor’ aspidistra plant has not had a great fame… except George Orwell’s novel ‘Keep the aspidistra flying’, but surely the reason for its renown is that it is deemed almost indestructible, hence the popular name: cast iron plant. Owing to these considerations (strength, rigidity, durability, easy farming practically everywhere), why do not extract its cellulosic fibres and test them in modern eco-friendly composite materials? Yet there are good reasons to look for new plants all over the word, and over the past decades a few workers have been doing so. They have come up with some surprises: plants that yield not only food and fibre but also an amazing variety of commodities with applications in industry (2). The commodities include a long-chain fatty acid useful as lubricant in rolling steel; medium-chain fatty acids for making soaps, detergents, surfactants and lubricants; an oil that can substitute for spermwhale oil in cosmetics and that can serve as feedstock in making hydrocarbon fuels and rubber. On the other hand, the main reasons for seeking new crop varieties are (3): - The genetic pool of existing agricultural crops might become too shallow, leaving the plants vulnerable to disease or environmental shocks The present crops are either very demanding environmentally, meaning they require more water or nutrients than nature provides The present crops sometimes are narrowly ‘adapted’ ecologically: they have limited tolerance to temperature or soil conditions beyond a narrow range 76 Rivista Italiana di Compositi e Nanotecnolgie – Volume 7, n°1 Aprile 2012 - They require high energy inputs in the form of fuel, fertilizers, pesticides, processing and irrigation. So far the search for new crops has turned up four that are within reach of commercialization in the U.S.A.: buffalo gourd, crambe, jojoba and kenaf (2). Apart from food-crops, several other plants that are under study offer exciting possibilities for eventual commercialization and the solution of agricultural, industrial and economic problems. Some years ago the automotive industry started the production of the car underbody coverings by using polypropylene strengthened by flax fibres and actually the results are as good as the current glass-fibre-reinforced counterpart. Clearly, the environmental benefits associated with energy savings in production and the very good thermal recyclability of natural fibres are two excellent reasons for using such materials, while the strength and durability are more or less the same of the glass fibres (3). Apart from flax, cotton and hemp, different ‘exotic’ and ‘old’ plants are now in consideration: sisal, jute, ramie (Bohemeria nivea), curauà, nettle, kenaf and even coconut, pineapple and banana are investigated to see whether fibres are suitable for similar applications (upholstery, panels, shelves). Automotive industry ‘opened the door’ to the use of natural fibres as possible replacement of the glass, and these are now in consideration even for aeronautics… for example, particularly ‘attractive’ is the ramie, owing its fireproofing properties, as use for the interior fittings of the Airbus (4-5). The aim of this scientific paper is to stimulate the interest of the researchers for the discovery of new natural materials suitable for the future eco-friendly composite structures: the experiments with the aspidistra fibres naturally are only a laboratory-scale ‘ballon d’essay’ for the identification of new and fruitful natural materials. EXPERIMENTAL AND RESULTS Extraction-purification of the fibres: different procedures were preliminarily experimented to identify the best method for the treatment of the whole plant, i.e., leaf + stem. a- Physico-chemical treatment: drawn from the procedure in use for the eucalyptus leaves (6). Waxes and fats were extracted in a soxhelet (5 hours, toluene: acetone 50:50); 0,5% ammonium oxalate solution ( 1 hour, boiling) then 0,5% EDTA solution at room temperature (pectic components); emi-cellulosic products eliminated in 5% hot sodium hydroxide solution. Yield in long (>30 cm) fibres: 7% w/w. b- Enzymatic treatment: after crushing, water immersion (5days) or, alternatively, acidified (pH=2) water (4 hours). Final careful scratch (thin blade). Yield 5% w/w and 8% w/w respectively in long fibres. c- Mechanical treatment: crushing of the plant components (leaf + stem), followed by a careful scratching (very thin blade) for the elimination of both the rubbery and green components. Final washing with water. Yield 8 % w/w long fibres. These different and more or less complex procedures gave about the same yield in long fibres, so the choice was addressed at the obtainment of the longest and more white (purified) fibres: a ‘mixed’ and simplified and cheaper method was then adopted: after a preliminary crushing and light scratching, the whole plant was subsequently treated with ammonium oxalate and EDTA solutions, followed by final washing with water. Yield 10% in long fibres. This ‘mixed’ procedure allowed the obtainment of more white and flexible bundles: the fibres were then easily separated one another with a simple hackle (figure 2). 77 Rivista Italiana di Compositi e Nanotecnolgie – Volume 7, n°1 Aprile 2012 Figure 2 - bundle of aspidistra fibres after the ‘mixed’ treatment Properties of the fibres: the length of the white flexible fibres ranged from 30 up to 40 cm; the diameter was 25-28 microns (microscopic calliper measurement); the specific weight (picnometric) was 0,81 g/cm3 , while the same procedure gave the correct value of 1,22 g/cm3 for commercial hemp fibres. Water absorption at room temperature was 35%. Their tensile strength (EN ISO 5079) was measured (pneumatic clamps): the medium value (50 specimens), referring to the textile units, was 38,0 +/- 3,0 cN/Tex (extreme values: 25-42); final strain about 4%. Commercial flax and hemp fibres gave 25-40 and 20-50 cN/Tex respectively (*). The compatibility with poly-propylene polymers was evaluated from the value of the microscopic contact angle attained into an oven on a single fibre after 5 minutes by a melted drop of polypropylene (180°C); the mean value (20 tests) was 28° +/- 2°, i.e., practically the same measured on commercial hemp and flax fibres. Polypropylene matrices: Polypropylene (PP), a thermoplastic polymer, at present is widely employed in the automotive industry, as an alternative to the non-meltable phenolic and epoxy resins. By adding harmless chemicals, good bonding can be obtained between natural fibres and the PP matrix. Normally the production of a ‘component’ (mouldings, upholstery, underbody panelling) involves the rolling or pressing the plastic and fibre (indifferently short or long) mixture into sheets which are then pressed into the final form in a subsequent heating cycle. PP that has been reinforced with natural fibres can be easily recycled. Two types of PP were employed in the research, differing in their molecular structure: the first was an almost amorphous (atactic) polymer, while the second was isotactic. Their main properties are in Table 1. Both the polymers can be considered relatively inexpensive, to be employed with inexpensive natural fibres. ----------------------------------------------------------------------------------------------------------------------Property amorphous PP isotactic PP ----------------------------------------------------------------------------------------------------------------------Specific weight, g/cm3 , 20°C 0,85 0,902 Mw 14.000 12.000 Viscosity, Pascal, 190°C 10,0 6,0 Melt flow index, g/min, 230°C 0,38 0,40 Thermal properties (DSC calorimeter) softening Temp.: -start 150°C -peak 171°C melting of crystallites: 70° C melting point: 168°C Table 1 – Polypropylene characteristics -----------------------------(*) ‘Tex’ is a textile unit, corresponding to the weight (in grams) of 105 m of the fibre. 78 Rivista Italiana di Compositi e Nanotecnolgie – Volume 7, n°1 Aprile 2012 Composites: realized by hot pressing: the fibres were combined with the plastic PP and processed into plates. Preliminarily, polymer sheets (1mm thick, 20x20 cm, variable thickness) were prepared by hot pressing PP pellets at 178-190°C. Sandwiches were then assembled with the aid of a proper frame: - PP sheet/unidirectional layer of fibres/PP sheet PP sheet/unidirectional (0°) layer of fibres/PP sheet/unidirectional (90°) layer of fibres/PP sheet PP sheet/short fibres randomly oriented/PP sheet These sandwiches were finally hot pressed (180-200°C), to obtain the plates (20x20 cm, different thickness). In different tests, the amount of the fibres constituting a single layer was gradually enhanced: in the final plates of composite the total content of natural fibres was gradually increased, starting from about 1% w/w PP up to about 20% w/w PP. In a second series, commercial hemp fibres were employed and similarly processed into plates with both types of PP: hemp fibres were used as ‘reference’ material, being probably they at this moment the most diffused industrial natural product. Strength of the composites: specimens were obtained from the plates of the different composites by careful cutting with hot lancet. Tensile strength tests were carried out according to ASTM D 3039 method (strain rate 3 mm/min); the results (medium values, ten specimens each) are in Tables 2-8. -----------------------------------------------------------------------------% of aspidistra fibres tensile strength +/- (max-min) (w/w atactic PP matrix) MPa 2 -----------------------------------------------------------------------------0 23,8 0,2 1,2 24,0 0,2 2,0 24,6 0,15 3,1 25,0 0,2 4,3 25,2 0,1 5,0 26,0 0,1 6,2 28,2 0,2 7,1 30,7 0,3 8,1 31,0 0,2 9,0 32,0 0,1 10,1 33,5 0,3 11,0 34,1 0,4 12,4 36,0 0,2 14,3 29,4 0,4 15,1 29,0 0,5 -----------------------------------------------------------------------------Table 2 - Tensile strength of unidirectional aspidistra fibres composites (ten specimens); matrix: atactic polypropylene. (Stress //fibres) 79 Rivista Italiana di Compositi e Nanotecnolgie – Volume 7, n°1 Aprile 2012 ---------------------------------------------------------------------------------% of aspidistra fibres tensile strength +/- (max-min) (w/w isotactic PP matrix) MPa 2 ---------------------------------------------------------------------------------0 28,7 0,2 6,2 31,4 0,4 9,7 36,7 0,2 11,7 34,2 0,2 14,1 33,4 0,25 16,4 34,0 0,4 Table 3 - Tensile strength of unidirectional aspidistra fibres composites (ten specimens); matrix: isotactic polypropylene. (Stress //fibres) -----------------------------------------------------------------------------------% of hemp fibres tensile strength +/- (max-min) (w/w atactic PP matrix) MPa 2 -----------------------------------------------------------------------------------0 23,8 0,2 10,0 38,0 0,15 12,5 35.6 0,3 Table 4 - Tensile strength of unidirectional hemp fibres composites (ten specimens); matrix: atactic. (Stress //fibres) --------------------------------------------------------------------------------% of hemp fibres tensile strength +/- (max-min) (w/w isotactic PP matrix) MPa 2 --------------------------------------------------------------------------------0 28,7 0,2 11,0 42,5 0,25 13,0 36,2 0,3 21,0 31,0 0,5 Table 5 – Tensile strength of unidirectional hemp fibres composites (ten specimens); matrix: isotactic polypropylene. (Stress //fibres) ---------------------------------------------------------------------------------% of short aspidistra fibres tensile strength +/- (max-min) (w/w atactic PP matrix) MPa 2 ---------------------------------------------------------------------------------0 23,8 0,2 3,4 24,5 0,15 6,1 27,3 0,2 10,4 22,7 0,3 14,3 21,4 0,4 ----------------------------------------------------------------------------------Table 6 - Tensile strength of randomly oriented short aspidistra fibres composites (ten specimens); matrix: atactic polypropylene 80 Rivista Italiana di Compositi e Nanotecnolgie – Volume 7, n°1 Aprile 2012 ----------------------------------------------------------------------------------% of short hemp fibres tensile strength +/- (max-min) (w/w atactic PP matrix) MPa 2 ----------------------------------------------------------------------------------0 23,8 0,2 2,5 27,0 0,2 5,0 18,3 0,3 10,0 17,4 0,5 ----------------------------------------------------------------------------------Table 7 - Tensile strength of randomly oriented short hemp fibres composites (ten specimens); matrix: atactic polypropylene . -------------------------------------------------------------------------------% of aspidistra fibres double 0°/90° layer tensile strength +/- (max-min) (w/w atactic PP matrix) MPa 0,2 -------------------------------------------------------------------------------0 23,8 0,2 4,9 25,5 0,2 10,1 26,8 0,3 11,0 27,2 0,2 14,8 25,9 0,4 -------------------------------------------------------------------------------Table 8 - Tensile strength of 0°/90° double layer aspidistra fibres composite (ten specimens); matrix atactic polypropylene (stress//0°) DISCUSSION OF THE RESULTS Preliminarily we must take in mind that this ‘experimental report’ constitutes only an example of the imagination a researcher must exert in his job: even the most unexpected source or raw material could and must be of interest, above all in the field of the ‘new’ materials, especially in the ecogreen economy. For instance, some scientists recently (8-9) obtained a variety of cellulose nano-fibres (20-30 nm in diameter) to produce a paper with a yield strength of 214 MPa and able to deform by 10%. A stronger version of these cellulose nano-fibres (400 MPa) was also employed to reinforce polyurethanes. Moreover, cellulose nano-fibres deriving from fruits as bananas and pineapples were positively experimented with reinforcing plastics to produce lighter and stronger materials for use in cars. Starting from an unforeseen ornamental plant like ‘aspidistra elatior’. Some very interesting results are obtained: - Long cellulose fibres can be extracted by means of relative simple and cheap methodology, with a yield of about 10% w/w; 20% w/w of short fibres are obtained as well. The mechanical strength of the long fibres is about the same of the flax and hemp commercial fibres: 38,0 cN/Tex; 25-40 flax; 20-50 hemp respectively. Nevertheless, fibres from aspidistra possess a lower specific weight: o,81 g/cm3 . Fibres from aspidistra can be easily employed into poly-propylenic matrices (both atactic and isotactic) by hot pressing, to obtain composite sheets and plates containing short or long fibres in single or double (0°/90°) layer. 81 Rivista Italiana di Compositi e Nanotecnolgie – Volume 7, n°1 Aprile 2012 - The mechanical (tensile) strength of the resulting composites is as good as those containing about the same percentage of commercial hemp fibres (Tables 2-4, 3-5, 6-7)... but the lower specific weight of the aspidistra fibres is an obvious advantage. - It must point out that the specific weight of the aspidistra fibres is also lower than that of both the experimented polypropylenes (atactic 0,85 g/cm3 – isotactic 0,902 g/cm3 – fibres 0,81 g/cm3, while the specific weight of hemp is higher: 1,22 g/cm3). In few words: a) composites containing aspidistra fibres are lighter than the polymer matrix (but, naturally, more resistant); the opposite happens if the fibres are hemp; b) a composite containing, say 10.000 fibres of aspidistra/mm2 will be lighter than a composite with the same ‘density’ of hemp fibres, with more or less the same strength; moreover the last composite will be heavier respect to the polymer alone. - Nevertheless, the matrices too are important: the same content of long aspidistra fibres (1012% w/w ) increases the tensile strength of the polymer, no matter atactic or isotactic, but the enhancement results greater for the atactic matrix ( Table 2-3) . CONCLUSIONS The final considerations could be the following. The aspidistra fibres could be more advantageous than hemp fibres as reinforcing poly-propylene polymers, both atactic or isotactic. In fact practically the same tensile strength is obtained in composites with both short or long fibres from aspidistra or hemp, but aspidistra fibres are lighter than poly-propylene, so PP composites containing aspidistra fibres are lighter than PP alone and hemp-composite too. Nevertheless much remains to be done to make these ‘funny’ fibres a commercial product: surely aspidistra plants are not now grown in farms! The first step could be a research and development effort encompassing workers in many disciplines: botanists and geneticists, agronomists and chemists, engineers, economists and others. Naturally in addition there is the problem of gaining the interest of organizations that have the imagination and the capital to exploit a strange new product to the fullest extent. Unfortunately such an organization surely wants financial backing through short time; it is therefore likely that similar new ‘plants’ will become commercial only if government and private organization cooperate to develop them... a very difficult event, above all in our country! REFERENCES 1- Maran, M., ‘Landscaping with tropical plants’, Sunset book ed., Menlo Park, CA,U.S.A., 2004, pp. 87-90 2- Hinman, C.W., Scientific American, 255(1)1986, pp. 24-29 3- Daimler-Benz, HIGH TECH REPORT, 2,1995, pp.9-14 4- Eisberg, N., Chemistry and Industry, 9, 2011, pp.10-11 5- Kymalainen,H.R.- Koyvula, M.- Kuisma, R. – Sjoberg, A.M. – Pehkonen, A., Bioresource Technology,94, 2004, pp. 57-63 6- DeNiro,M.J., Earth and Planetary Science Letters, 54(2)1981, pp. 177-185 7- Frisoni,G. – Baiardo, M. – Scandola, M., Biomacromulecules,2,2001, pp. 476-482 8- Daimler-Benz, HIGH TECH REPORT, 6, 1999, pp. 82-85 9- Evans, J., Chemistry and Industry, 16, 2011, pp. 19-21 HIHIHIHIHIHIHIHIHIHI Questo numero è dedicato alla memoria del Prof. Carlo Buongiorno morto nella notte tra il 26 e 27 novembre 2011 all'età di 81 anni Scienziato e Ricercatore è stato maestro e riferimento per generazioni di ingegneri e per molti docenti della Sapienza Padre dello Spazio italiano Carlo Buongiorno è stato uno dei principali protagonisti della storia spaziale italiana e della creazione dell'Agenzia Spaziale Italiana Il Prof. Carlo Buongiorno (a destra) nel corso della visita del Vice Presidente USA Mr. Lyndon Johnson al Centro di Ricerche Spaziali di Roma (Settembre 1962) per la firma dell’Accordo del Progetto San Marco. Si riconoscono nella foto anche il Prof. Luigi Broglio e Gen S.A. A Remondino HIHIHIHIHIHIHIHIHIHI