1
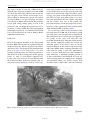
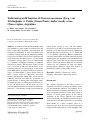
Sitio Argentino de Producción Animal
Author's personal copy
Agroforest Syst
DOI 10.1007/s10457-013-9663-4
Yield and growth features of Panicum maximum (Jacq.) var
Trichoglume cv Petrie (Green Panic) under woody cover,
Chaco region, Argentina
C. Kunst • R. Ledesma • M. Castañares •
M. Cornacchione • H. van Meer • J. Godoy
Received: 16 May 2013 / Accepted: 7 December 2013
Ó Springer Science+Business Media Dordrecht 2013
Abstract Secondary forests and shrub thickets with
low suitability for cattle raising are widespread in the
Chaco region (NW Argentina). Concerns about the
ecological sustainability of these ecosystems favor
vegetation clearing methods for improving standing
forage and accessibility for livestock operations that
retain native tree and shrub species, a system called
‘silvopasture’ locally. These areas are characterized
by a reduction of sunlight availability if compared
with treeless pastures. The objective of this research
was to assess the growth rate and the effect of two
harvesting intervals (15 and 30 days) on the annual
yield (BM) and forage quality of Panicum maximum
(Jacq.) var Trichoglume cv Petrie (Green Panic) in
such a system, using two approaches: successive
harvests and functional, during three growth seasons
(2000–01, 2001–02 and 2002–03). Correlation of
growth features of Green panic with rainfall (mm),
growing degree days (°C, GDD), and soil moisture (%)
at two soil depths (0–15 and 15–30 cm) was also
assessed. BM varied between 3,500 and 11,500 kg dry
matter ha-1. The absolute growth rate presented two
M. Castañares, Private consultant.
C. Kunst (&) R. Ledesma M. Castañares M. Cornacchione H. van Meer J. Godoy
Instituto Nacional de Tecnologı́a Agropecuaria, Estación
Experimental Agropecuaria Santiago del Estero, Jujuy
850, G4200CQR Santiago del Estero, Argentina
e-mail: [email protected]
annual peaks, located in early and late summer,
irrespective of growth season and harvesting interval.
Growth season and harvesting interval significantly
affected the relative growth rate (p [ F = 0.0015 and
p [ F = 0.0002, respectively). BM was significantly
correlated with rainfall and GDD observed between
sampling dates, the magnitude of the coefficients were
higher for the 30-day than for the 15-day harvesting
interval. Correlation between BM and soil moisture
content was not significant for both soil depths.
Resting periods should be longer than 30 days to
maintain the stability of the grazing system.
Keywords Biomass Growth rate Roller
chopping Silvopasture Harvesting interval
Introduction
The original vegetation of the Chaco region of
Argentina was a mosaic of forests, woodlands, savannas and shrublands (Morello and Adamoli 1974).
Timber operations exceeding regeneration rates, livestock overgrazing and misuse of fire have caused an
increase of woody plant species in the current
vegetation of the Chaco (Morello and Adamoli
1974). Concurrently, its suitability for livestock operations has decreased. The conversion of a woodland,
shrub thicket or a dense secondary forest in a
vegetation type more fitted for livestock operations
is approached in the region by ‘roller chopping’. This
123
1 de 15
Sitio Argentino de Producción Animal
Author's personal copy
Agroforest Syst
mechanical treatment crushes the woody undergrowth, creating a park-like structure and enhancing
accessibility of both livestock and personnel. Trees
with diameter at breast height (DBH) larger than
10–15 cm and tall shrubs are left standing, so a roller
chopped paddock is characterized by a reduction of
sunlight availability if compared with treeless pastures. Standing forage and stocking rate are increased
by the sowing of grass instantaneously with the roller
chopping treatment (Kunst et al. 2003). Species of the
genus Panicum are commonly used, being P. maximum (Jacq.) cv trichoglume cv Petrie—locally
referred as ‘Green panic’—one of the species of
choice. Green panic possess the C4 photosynthetic
process, it is a summer perennial and has a high
nutritional quality and yield potential (Moreno et al.
1995). It is indigenous to tropical areas of southern
Africa, where it occurs mainly in the subhabitat under
the trees (Pieterse et al. 1997).
Concerns about the sustainability of the Chaco
ecosystem favor vegetation clearing methods that
retain native tree and shrub species (Provincia de
Santiago del Estero Law 6841 and further regulations
2007), and paddocks reclaimed with the procedure
described above are commonly called a ‘silvopasture’.
In this context, Green panic has a clear advantage over
other grass species because its forage production is not
adversely affected by shade (Tavares de Castro et al.
1999; Smit 2005; Ledesma 2006).
Successful grazing management of the system
described above requires quantitative information
about the ‘forage quantity cycle’ (i.e. annual forage
yield and growth rates) of the key grass species
(Vallentine 2001). Yield, forage quality, the effects of
harvesting frequencies and environmental features on
varieties and species of Panicum have been studied in
several ecosystems (Eriksen and Whitney 1981;
Moreno et al. 1995; Durr and Rangel 2000; Penton
2000; Obispo et al. 2008; Ramirez Reynoso et al.
2009). However, there is a lack of such information for
Green panic growing under a vegetation structure
created by a roller chopping treatment in the Chaco
region. Considering this paucity, the objective of this
research was to determine: (a) total annual aboveground biomass yield, (b) growth rates, and (c) the
effect of harvesting intervals on the relative growth
rate and the aboveground biomass yield of the species
in a roller chopped pasture. Relationships of these
species features with environmental variables such as
rainfall and soil moisture was also explored. The
information gathered was used to develop management recommendations for Green Panic pastures
growing under agroforestry systems in the Chaco
region.
Materials and methods
Study area
It was located in the ‘La Maria’ Experimental Ranch,
Santiago del Estero Experimental Station, Instituto
Nacional de Tecnologı́a Agropecuaria, Santiago del
Estero, Argentina (28°30 S and 64°150 W). The climate
is semiarid subtropical. Winter is cold and dry and
summer is warm and rainy (Boletta 1988). The mean
annual precipitation is 574 mm (Meteorological Station INTA Santiago del Estero Experimental Station,
1990–2008 series, occurring mainly from late October
to early May (Boletta 1988, INTA Meteorological
Station Santiago del Estero Experimental Station,
unpublished report). Soils are Entic Haplustols, the
most frequent suborder in the western Chaco region
(Anrı́quez et al. 2005). Main characteristic of the soil
profile is an organic matter content of 2–3 % and a
high drainage rate due to the dominance of the silt
fraction in its texture (Santiago del Estero Experimental Station, unpublished report). Permanent wilting point (PWP) of the soils of the experimental area is
around 6.7 % (Lorenz, Personal communication).
The experimental material was Green Panic seeded
by hand after the roller chopper treatment in 1996 and
1997 of two 10 ha paddocks located in a highland
ecological site. The original vegetation of the paddocks was a secondary forest with a homogeneous
shrub stratum. After the roller-chopping treatment, the
vegetation structure consisted of an uneven age tree
and brush stand, with a mean distance between trees
around 5–6 m, resulting in a density of 200–300 trees
per hectare. Trees had an average height of 11 m and a
DBH larger than 10 cm. Shrub mean height was
around 3.5 m. The remaining mean total canopy
ground cover of the trees was 75 %, while that of the
shrubs was 35 %, visually estimated. The tree stratum
was dominated by the native hardwood species
Aspidosperma quebracho-blanco Schlecht (quebracho
blanco) and Schinopsis lorentzii Griseb. Engl (quebracho colorado). The first is an evergreen species that
123
2 de 15
Sitio Argentino de Producción Animal
Author's personal copy
Agroforest Syst
may reach a height of 20 m and a DBH of 80 cm;
while the latter may reach a height of 25 m and a DBH
of 1.50 m (Tortorelli 2009). Other tree species present
were Zyzyphus mistol Griseb. and Prosopis nigra.
(Griseb.) Hyeron. Shrub species present were Acacia
furcatispina Burk., Celtis spinosa Spreng. and Capparis atamisquea Kuntze. Mean photon flux under the
woody plant canopy during spring at noon at the
ground, 0.5 and 1 m height aboveground was 21.71,
31 and 28 % of the available flux at the same height in
full sunlight, respectively, as estimated by the LI-COR
bar A-129 and measured at noon in summer (Kunst
unpublished information).
Field work
Data on the temporal dynamics of the aboveground
biomass (BM) of Green panic were gathered using the
method of successive harvests as proposed by Anslow
and Green (1967). Two groups of four permanent fixed
plots of an area of 1 m2 each (total n = 8) were
randomly laid in the center area of the first paddock, at
mid distance from the watering point and the opposite
corner, in order to avoid highly trampled soils.
Locally, plots were located at an equal distance from
the nearby tree/shrub, under their canopies (Fig. 1);
and protected from grazing by cattle by a wire cage,
fixed in the ground by iron stakes. An area of 0.25 m2
located in the center of each plot was harvested using
hand scissors and stored in a paper bag. There was an
average of 12 plants of Green Panic in each 0.25 m2
plot. The rest of the grass plants within a cage were
harvested immediately after the samples were taken
and the residues were left in the ground. The
harvesting frequency of both plot groups was 28 days,
but with a 14 day gap between them, from December
2000 and March 2001 (Castañares 2002).
In a second step of the research, the effect of the
harvesting interval on BM and on the relative growth
rate of the species was assessed in the second paddock.
Harvesting intervals of 15 and 30 days were applied at
two groups of four plots each using the same
procedure described above. These harvesting intervals
were selected empirically, taking into account the
rainstorm pattern of the Chaco: rains are usually
frontal, resulting from the clash of tropical hot fronts
with cold southern winds, occurring somewhat cyclically from late spring to early fall, approximately
every 7–10 days (Ledesma N. personal communication). Therefore, a minimum sampling period of
15 days would increase the likelihood of at least one
storm occurring between sampling dates. Sampling
was performed during two growth seasons, from
November 2001 to April 2002, and from November
0.25 m2 Plot
1 m2 Plot
Fig. 1 Scheme showing the position of a plot in relation to tree and shrub canopies. Wire cage not shown
123
3 de 15
Sitio Argentino de Producción Animal
Author's personal copy
Agroforest Syst
2002 to April 2003; respectively. Plot location was
changed every year using the same sampling procedure as described.
In both stages of the study, the initial sampling date
(day = 0) was selected based on weather forecasts for
the study area and at least 3 days before a rain. In that
sampling date, all plants in a plot were cut and the
residues discarded. Throughout the study, the stubble
height (remaining plant tissue) was set at 10 cm from the
ground, a height commonly used by Chaco cattlemen
(Ledesma 2006, Kunst personal observation).
Plant samples were transported to the lab and oven
dried at 60 °C for 48 h. In all harvested material leaf
and shoot fractions were separated by hand and
weighed. Results were expressed as kg of dry matter
per hectare (kg DM ha-1).
Weather and soil moisture monitoring
Rainfall at the study sites was collected in a micro
raingauges located near the sampling plots. Data were
collected every 2 weeks during the wet season.
Rainfall (mm) and air temperature (°C) collected at
the INTA Meteorological Station located in the Ranch
headquarters (7 km from the experimental area), were
used as a ‘master’ record since observations are taken
every day. Data of air temperature were used to
calculate the growing degree days observed between
sampling dates (GDD), as follows (Gómez de la
Fuente et al. 2007; Smart et al. 2007):
GDD ¼ RððTmax Tmin Þ=2Þ Tbase Þ
ð1Þ
where Tmax is the maximum air temperature (°C), Tmin
is the minimum air temperature (°C) and Tbase is
15 °C. Growth of Green Panic is restricted at air
temperatures lower than 15 °C (Ivory and Whiteman
1978) while optimum air temperature for photosynthesis is 34 °C (Chacon-Moreno et al. 1995).
Soil water content (SM) was assessed by the
gravimetric method in each harvesting date. Three
random samples were taken near the cages at two soil
depths: 0–15 cm (SM15) and 15–30 cm (SM30).
Forage quality analysis
Samples of BM comprising total, leaf and shoot
fractions gathered for the estimation of the growth
curve (2000–01) were hand separated and analyzed for
crude protein and acid detergent fiber, after sample
grinding in a Wiley mill milling and screening through
a 1 mm mesh. Crude protein content was estimated by
the Kjeldahl method. Acid detergent fiber was estimated by the Van Soest method (Castañares 2002).
For the 2000–01 and 2001–02 growth seasons, the
leaf/shoot ratio of each sample was calculated and
averaged for each harvesting periods and sampling
dates, and plotted versus time to assess its behavior.
Mathematical and statistical analysis
Growth features of Green panic were estimated using
two approaches: (a) the harvesting method (Anslow
and Green 1967), and (b) the functional approach
(Hunt 1982). In the first method, the mean standing
BM of Green Panic was calculated for each sampling
date, plot group and growth season. In a second step, a
curve of mean accumulated BM was determined by
summing up the successive BM observed until a
specific date. The magnitude of the rate of BM
between two harvesting dates—an estimation of the
mean absolute growth rate (AGR) of the species—was
estimated by calculating the difference of the mean
accumulated BM between sampling dates tn and tn?1
divided by the interval of time between these dates
expressed in days (Hunt 1982, formula [2]):
AGRhi kg DM ha1 day1
ð2Þ
¼ ðBMtþ1 BMt Þ=ðtnþ1 tn Þ
where BMt?1 is the aboveground biomass harvested at
the sampling date t ? 1; BMt the aboveground
biomass harvested in the sampling date t, and h
harvesting period, 1 and 2 and i = plots 1 to n.
Accumulated BM and AGR were plotted versus time
to assess its annual pattern.
The functional approach was applied by fitting
growth models to the accumulated BM curves classified by growth season and harvesting interval by nonlinear regression (Hunt 1982). For the 2000–01 season
the Richards function (Hunt 1982) presented the
lowest mean square error, and was selected as the
best equation to model the accumulated BM curve
throughout time (formula 3):
h
id
ABM ¼ a 1 þ expðbC daysÞ ;
ð3Þ
where ABM is the accumulated aboveground grass
biomass (kg DM ha-1); a is the coefficient representing the maximum grass productivity (kg DM ha-1); b
123
4 de 15
Sitio Argentino de Producción Animal
Author's personal copy
Agroforest Syst
is the starting value (kg DM ha-1); C = the ‘intrinsic
rate of increase’, representing an average growth rate
per cápita of the dry matter (kg DM ha-1 day-1). C
could be interpreted as an average AGR that ignore
short term fluctuations of the environmental parameters. The coefficient ‘d’ controls whether or not the
function has an inflection, and if so, where it occurs
(Tsoularis and Wallace 2002).
For the 2001–2002 and 2002–2003 seasons and for
each harvesting frequency, a three parameter logistic
growth function presented the lowest mean square
error and was selected to model the dynamics of ABM
throughout time (formula 4, Overman and Scholtz III
2002):
ABM ¼ a
.
1 þ b:expðC daysÞ ;
ð4Þ
with all parameters as above. The parameters of Eqs.
[3, 4] were estimated using the package INFOSTAT
(INFOSTAT 2008), that uses the simplex and/or the
Levenberg–Marquardt methods to estimate equation
coefficients.
The pattern of the absolute growth rate and the
location of the inflection point of the accumulated BM
curves were used to identify the pattern of increase and
decrease of growth rate throughout time and used as an
indication to define periods of grazing and rest of P.
maximum. The inflection point of a curve is the point
when its curvature changes sign, and the growth rate is
maximum (Tsoularis and Wallace 2002). Time to
inflection, and the maximum growth rate observed at
the time of inflection for the Richards and logistic
equations were calculated using formulas provided by
Tsoularis and Wallace (2002).
Differences in the relative growth rate between the
two harvests were tested using a two-way random
ANOVA with ln-transformed BM collected in each
sampling date as dependent variable; and growth
season (classification factor, n = 2, 2001–02 and
2002–03), harvesting interval (treatment, n = 2, 15
and 30 days, respectively); and their interaction as
independent variables, using a repeated measures
approach (Araujo 2003; Ramirez Reynoso et al. 2009).
The model had no intercept. Each plot was considered
a replication for a treatment (n = 4 by harvesting
date). Conceptually, harvesting intervals represent
grazing intensities, while growth seasons represent
different weather environments. The PROC MIXED
procedure of the SAS package (SAS 1998; Littell et al.
1998) was used for calculations. Differences in the
mean relative growth rate among growth seasons and
harvesting frequencies were tested using the
LSMEANS statement (SAS 1998). An a = 0.05 was
used for all statistical analysis.
We used the Kendall’s s, a non parametric correlation coefficient (Conover 1980) to assess the relationships between the time series of the mean
accumulated BM with the time series of SM15,
SM30, and the rainfall amount and GDD observed
between sampling dates for each growth season and
harvesting period. The Kendall coefficient was used
because the relationship among these variables was
expected to be monotonic but not linear (Conover
1980). To assess any delay in plant response the time
series were lagged one sampling date (Khan 1971;
Gibbens 1991). Statistical significance was assumed at
p B 0.05. The PROC CORR procedure of the SAS
package was used for calculations (SAS 1998).
Results
Growth features
In the three growth seasons assessed, the plants of Green
Panic started to grow with 30–40 mm of monthly
accumulated rainfall and a GDD above 150 °C. Growth
slowed and eventually stopped when the GDD between
harvesting dates was less than 100 °C and air temperatures fell under 15 °C, irrespective of the amount of
rainfall fallen. The growth period of the species lasted
from 6 to 7 months; from mid/late spring to early fall
(from October–November to March–April, Figs. 1, 2,
3). Green Panic did not grow during the rest of the year
(fall to late winter, May to early October). Irrespective
of growth season, the growth curve of Green Panic
presented three phases, separated by two peaks of AGR:
the initial phase, which began in October-early December and lasted to late December-mid January; a middle
phase, from mid-January to mid-February; and a final
phase, lasting from late February to late March-early
April (Figs. 2, 3, 4, 5, 6). These two peaks of AGR were
consistently identified despite harvesting intervals: the
first was observed at the end of December–early
January (early summer, an average of 50 days after
the beginning of the sampling) and the second from
early February-late March (late summer—early fall, an
average of 131 days after the beginning). The first AGR
123
5 de 15
Sitio Argentino de Producción Animal
Author's personal copy
Agroforest Syst
Fig. 2 Aboveground
biomass accumulation curve
(BM) and absolute growth
rate (AGR) of P. maximum
cv. Trichoglume cv Petrie
(Green Panic) for the
2000–01 season. ‘La Maria’
Experimental Ranch, INTA
Santiago del Estero,
Argentina. References:
rainfall, AGR and growing
degree days (GDD)
correspond to the time
period between harvesting
dates. ‘BM plot group 1’ and
‘BM plot group 2’ are BM as
estimated by the successive
harvests approach, and ‘BM
curve’ is the BM as
estimated by the functional
approach
Fig. 3 Aboveground
biomass accumulation (BM)
and absolute growth rate
(AGR) for the 15-day
harvesting interval of P.
maximum cv. Trichoglume
cv Petrie (Green Panic), as
estimated by the successive
harvests approach, 2001–02
growth season. ‘La Maria’
Experimental Ranch, INTA
Santiago del Estero,
Argentina. References:
rainfall, AGR and growing
degree days (GDD)
correspond to the period
comprised between
sampling dates
123
6 de 15
Sitio Argentino de Producción Animal
Author's personal copy
Agroforest Syst
Fig. 4 Aboveground
biomass accumulation (BM)
and absolute growth rate
(AGR) for the 30-day
harvesting interval of P.
maximum cv. Trichoglume
cv Petrie (Green Panic), as
estimated by the successive
harvests approach, 2001–02
growth season. ‘La Maria’
Experimental Ranch, INTA
Santiago del Estero,
Argentina. References:
rainfall, AGR and growing
degree days (GDD)
correspond to the period
comprised between
sampling dates
Fig. 5 Aboveground
biomass accumulation (BM)
and absolute growth rate
(AGR) for the 15-day
harvesting interval of P.
maximum cv. Trichoglume
cv Petrie (Green Panic), as
estimated by the successive
harvests approach, 2002–03
growth season. ‘La Maria’
Experimental Ranch, INTA
Santiago del Estero,
Argentina. References:
rainfall, AGR and growing
degree days (GDD)
correspond to the period
comprised between
sampling dates
123
7 de 15
Sitio Argentino de Producción Animal
Author's personal copy
Agroforest Syst
Fig. 6 Aboveground
biomass accumulation (BM)
and absolute growth rate
(AGR) for the 30-day
harvesting interval of P.
maximum cv. Trichoglume
cv Petrie (Green Panic), as
estimated by the successive
harvests approach, 2002–03
growth season. ‘La Maria’
Experimental Ranch, INTA
Santiago del Estero,
Argentina. References:
rainfall, AGR and growing
degree days (GDD)
correspond to the period
comprised between
sampling dates
peak presented a larger magnitude than the second AGR
peak in the three growth seasons studied (Figs. 2, 3, 4, 5,
6). The mean total accumulated BM of Green Panic in
these 6–7 months calculated by the harvesting method
varied between 3,500 and 11,500 kg DM ha-1 (Figs 1,
2, 3, 4, 5).
The logistic and Richards functions fitted well
the accumulated BM data throughout time:
R2 = 0.98 in all cases (Table 2). The asymptote
of the Richards function (coefficient ‘a’) varied
between 3,500 and 12,237 DM. ha-1 (Table 2).
The R2 between the field and the estimated data
was 0.98, although both functions used overestimated BM toward the end of the growth season.
The coefficient C was almost constant in all growth
models (Table 2).The functional approach identified
only one AGR peak as suggested by the inflection
point of the curve, and its location varied according
to the growth season, from 22 to 97 days since
day = 0 (Table 2). In the inflection point, the
magnitude of the calculated maximum growth rate
was of similar magnitude of the first AGR peak in
all growth seasons as calculated by the harvesting
method (Table 2).
Growth season and harvesting interval significantly
affected the relative growth rate (p [ F = 0.0015 and
p [ F = 0.0002, respectively) while the interaction
between harvesting frequency and growth season was
not significant. The mean relative growth rate of the
2001–02 season was higher than the mean relative
growth rate of the 2002–03 season. The 30-day
harvesting period presented a mean relative growth
rate twice as high as the mean relative growth rate of
the 15-day harvesting period, 1,820 versus 500 kg MS
ha-1, respectively (p \ 0.05, Figs. 5, 6). The final
accumulated BM of the 15-days harvesting interval
was 39–42 % less than the 30-day harvesting interval
(Figs. 2, 3, 4, 5, 6).
123
8 de 15
Sitio Argentino de Producción Animal
Author's personal copy
Agroforest Syst
Forage quality
During the 2000–01 season, the leaf/shoot ratio was
*1.6–2.1 from the beginning of the growth until the
end of February, and then the ratio increased up to
seven toward the end of the season (Fig. 8). The other
two seasons presented similar results. The mean
protein content of the leaf and shoot fractions were
14.76 and 7.95 %, respectively. Mean acid detergent
fiber was 69.93 and 76 % for both fractions, respectively. In the 2001–02 season, the leaf:shoot ratio
increased again toward the end of the season in both
harvesting intervals, but the 15-day harvesting interval
showed the largest increase.
Environmental dynamics
In the 2000–01, 2001–02 and 2002–03 growth seasons
the total rainfall amount in the study area was 577, 739.8
and 891.7 mm, respectively. The GDD were 1,492,
1,643 and 1,956 °C for the same seasons, respectively.
The last growth season was unusual: the rainfall showed
two peaks: one at the beginning and another at the end of
the growth season, separated by a period of low rains and
a peak of GDD during January (Figs. 5, 6). During the
first season the soil moisture showed an increasing trend,
and was above the soil wilting point at the end of the
study period (Fig. 7a). On the other hand, soil moisture
presented a decreasing trend in the second and third
seasons (Fig. 7b, c), being the mean soil moisture
content consistently under the potential wilting point
during the third season (Fig. 7c). In all cases, the soil
moisture was higher at the top soil horizon than at the
deeper soil horizon at the beginning of the growth period
and then slowly decreased.
Correlations between growth features
and environmental variables
At the seasonal scale, the higher accumulated BM
were observed in the 2002–01 season and the lowest in
2002–03 season, irrespective of harvesting interval
(Table 2). Although the third growth season presented
the highest total rainfall of the three seasons, the
annual accumulated BM was the smallest of the three,
showing a decrease in both harvesting intervals
(Figs. 4, 5).
At the intra-seasonal scale, the annual time series of
BM was significantly correlated with the time series of
the rainfall and the GDD between sampling dates
(Table 3a). The time series of BM sorted by harvesting
frequencies presented the same significant correlations, but the magnitude of the coefficients were
higher for the 30 day harvesting interval than for the
15-day harvesting interval (Table 3b). Correlations
between the mean BM and the mean SM were not
significant for both soil depths.
Discussion
The average maximum ‘yield’ of Green Panic in this
study ranged from 3,500 to 11,500 kg DM ha-1, for the
lower and higher harvesting interval, respectively
(Table 1). The reduction of the photon flux observed
in this study is similar to those reported in other studies
involving roller chopper treatments, suggesting a conservative vegetation clearing approach (Ledesma 2006,
Kunst et al. 2012). These yields present no practical
difference with those reported for Green Panic growing
in full sunlight in the Chaco region of Argentina, ranging
from 4,600 to 8,000 kg DM ha-1, irrespective of
harvesting interval (Ricci et al. 1997; De León et al.
1995a; De León 1999). The two peaks of growth
observed have been also reported by De León (1999) for
Green Panic growing under full light conditions in the
Chaco region. Ramirez Reynoso et al. (2009) working
with P. maximum ‘Mombaza’ in full light conditions
with 1,000 mm of annual summer rainfall reported
AGR of 66–140 kg DM ha-1 day-1, for cutting intervals of 3 and 7 weeks, respectively. These magnitudes
are within the range observed in this study.
The depression in BM observed between growth
peaks in early-mid summer (January–February) is
attributed to the fact that in the Chaco region, January
presents usually the highest annual air temperatures, as
the GDD pattern indicates (Figs. 2, 3, 4, 5, 6) suggesting
an extreme water demand that Green panic was not able
to withstand. The final decline of the absolute growth
rate at the end of the growth season could be attributed to
lower air temperatures. The lowest Green Panic annual
yield was registered in the 02–03 season, which also
presented the largest rainfall amount. This result could
be attributed to the rather unusual rainfall pattern and the
high evaporative demand of that season, as suggested by
the annual GDD.
The parameters of forage quality gathered in this
study are quite similar to those reported for Green
123
9 de 15
Harvesting
intervals
(days)
1
Jan 3
Dec 17
Dec 28
Dec 12
Jan 1
157.73
99.23
117.75
37.06
55.6
Dec 6
Oct 26
Oct 10
Date
observed
1st AGR peak
Yield
(kg DM ha-1 day-1)
Day 01
Day since harvesting interval was counted
30
2002–03 15
30
2001–02 15
2000–01 28
Growth
season
61
65
57
46
28
Number
of days
since
day 0
519.5
231
254
212
167
Accumulated
rainfall until
first AGR
peak (mm)
30.8
18.63
120.80
73.5
94.83
April 10
Mar 13
Mar 3
Feb 27
Feb 14
Yield
Date
(kg DM ha-1 day-1) observed
2d AGR peak
184
134
133
118
70
Number
of days
since
day 0
879
771
690
668
589
Accumulated
rainfall until
second AGR
peak (mm)
5,800
3,500
11,500
6,700
7,300
Total
Accumulated
BM during
study period
(kg DM ha-1)
Table 1 Accumulated aboveground biomass, absolute growth rates (AGR) of Panicum maximum cv trichoglume cv Petrie (green Panic) under woody cover as estimated by the
successive harvests approach for three growth seasons, 2000–01, 2001–02 and 2002–03. ‘La Maria’ Experimental Ranch, Santiago del Estero Experimental Station, Santiago del
Estero, Argentina
Author's personal copy
Sitio Argentino de Producción Animal
Agroforest Syst
Fig. 7 Dynamics of soil water content (SM, %) for a 2000–01,
b 2002–03 and c 2002–03 growth seasons at two soil depths:
0–15 and 15–30 cm. ‘La Maria’ Experimental Ranch, Santiago
del Estero Experimental Station. Argentina. References: PWP
permanent wilting point
Panic growing under full sunlight in the Chaco by De
León et al. (1995b) and by Obispo et al. (2008) for a
silvopastoral system under medium shade.
In this study the grazing history was represented by
the harvesting interval and by the ‘stubble height’, or
plant tissue left for the plant to recover after the
123
10 de 15
Sitio Argentino de Producción Animal
Author's personal copy
Agroforest Syst
22.5
17-Apr-02
3-Apr-02
14-Mar-02
27-Feb-02
11-Feb-02
21-Jan-02
28-Dec-01
17-Dec-01
15-Nov-01
0
Sa
m
pli
ng
da
te
s
Leaf:shoot ratio
45
5-Nov-01
15
days
30
days
Harvesting
interval
Fig. 8 Leaf:shoot relationship of P. maximum cv. Trichoglume
cv Petrie (Green Panic) under woody plant canopy in a roller
chopper treatment, for two harvesting regimes, 2001–02 season.
La Maria Experimental Ranch, Santiago del Estero Experimental Station. Argentina
harvest. In full sunlight environments it has been
reported a negative association between the magnitude
of the absolute growth rate and a high cutting
frequency; while a positive, increasing trend in the
yield of Panicum species as the harvesting interval
increases (Moreno et al. 1995; Gonzalez et al. 1997,
De León et al. 1995b; Ricci et al. 1997, De León 1999;
Ramirez Reynoso et al. 2009). The compensatory
responses to tissue removal (i.e. the magnitude of
AGR after each cut) in our study seems were not
enough to maintain a high rate of BM accumulation
when the harvesting interval was 15 days. Low
stubble heights, as used in this study, could be also
the cause of the small magnitude of the second AGR
peak. Higher stubble heights (larger than 20 cm) are
associated to higher aboveground biomass yields in
Panicum species (do Canto Weber et al. 2008;
Ramirez Reynoso et al. 2009, Kiss Trocsanyi et al.
2009). The production of tillers is one of the main
phases of vegetative grass growth: if this process is
affected the final productivity will suffer a reduction
since tillering is required to maintain exponential
growth and to produce biomass, i.e. forage (Groeneveld 1998; Carrillo 2003; Santos et al. 2003). Since the
leaf area is reduced, frequent cuttings cause a decrease
in tiller production, thus the ability of a plant to
replenish reserves or produce additional new tillers is
restricted. Plants cut near the ground rely on basal
buds to recover instead of aerial buds located in tillers,
a process that takes some time (Chacon-Moreno et al.
1995). The increase in the leaf:shoot ratio toward the
end of the growth season in Green Panic showed in this
study also suggest a deleterious effect in tillering,
caused most likely by the frequent cutting.
The soil moisture failed as a predictor of BM, as
indicated by the lack of significance of the correlation between its time series. This result has been
reported in other studies of grass yield-soil moisture
relationships (Smart et al. 2007) and could be
attributed to the inherent high drainage of the soils
of the study area, and also to the lack of adjusted
timing between the sampling schedule and the
rainfall occurrence.
Management implications
Although the growth pattern of Green Panic followed
the weather pattern as the native species do, the
maximum expected aboveground production for
Green Panic under woody cover (*shadow) estimated
for a silvopasture created by roller chopping and with
20–30 % of photon flux was quite similar to Green
Panic growing under full sunlight, and greater than the
reported productivity of native ‘open’ grasslands,
estimated as 5,000 kg DM ha-1 of standing crop
(Kunst et al. 2006). Parameters of forage quality were
also very similar. This information suggests that Green
Panic is a good choice to reclaim paddocks in poor
range condition and dominated by woody plants,
without drastically altering the ecosystem, sustaining
the approach of creating an agroforestry system in the
Chaco. Environmental impact is reduced when trees
and shrubs are maintained in a paddock (Jackson and
Ash 1998; Obispo et al. 2008). In fact, soil structure,
fertility, porosity and water storage capacity are
improved under trees and shrubs, a fact reported for
the Chaco region in experiments involving rollerchopping treatments (Anrı́quez et al. 2005; Ledesma
123
11 de 15
Sitio Argentino de Producción Animal
Author's personal copy
Agroforest Syst
Table 2 Growth features of Panicum maximum cv trichoglume cv Petrie (green Panic) under woody cover as estimated
by the functional approach for three growth seasons, 2000–01,
Season
Harvesting
intervals
(days)
Parameters
2000–01
28
a
9205.14
b
-0.73
C
2001–02
15
30
2002–03
15
30
Estimate
2001–02 and 2002–03. ‘La Maria’ Experimental Ranch,
Santiago del Estero Experimental Station, Santiago del Estero,
Argentina
Error
p value
R2
Time to inflection
point since
day = 0 (days)
Max C kg DM
ha-1 day-1
0.98
22
160.96
0.983
69
67.47
0.989
83
116.96
0.98
80
34.29
0.982
97
56.69
0.040
d
3.25
a
6922.42
b
15.68
4.66
0.0083
C
0.04
0.01
0.01
a
12237.06
840.8
0.0001
b
27.86
13.27
0.1037
\0.0001
345.22
C
0.04
a
3503.91
0.01
0.0046
b
11.14
C
0.03
a
5735.21
587.2
0.0103
b
48.22
60.88
0.51
C
0.04
0.01
0.0924
\0.0001
176.88
3.29
0.0117
4.5E-03
0.0002
a maximum aboveground biomass accumulation, BM (kg DM ha-1), b starting coefficient, c intrinsic rate of increase of
aboveground biomass accumulation (kg DM ha-1 day-1)
For other references, see text
2006; Albanesi 2012; Albanesi et al. 2012; Anriquez
et al. 2012) and other ecosystems (Belsky et al. 1993;
Obispo et al. 2008). Also, shade increases livestock
comfort and forage has a better nutritional quality
(Bordon 1988; Belsky et al. 1993; Ledesma 2006;
Treydte et al. 2007; Ludwig et al. 2008; Obispo et al.
2008).
The recurring periods of grazing and resting of a
pasture require quantitative assessment on forage
growth rates and how these growth rates vary
throughout time and the influence on environmental
factors, so both productivity and persistence are
maintained (Gillen and McNew 1987). In semiaridarid areas the forage quality is of lesser importance
than yield, since the rainfall regime is seasonal and
the opportunity to replace grazed organs is directly
related to water availability and proper resting so the
removal of tissue is equilibrated by the growth
processes. The harvesting intervals in this study were
selected empirically, based on the pattern of storms
that bring moisture to the Chaco environment. They
give an insight of the grazing interval needed to
assure the persistence of Green Panic pastures in
roller-chopper paddock, information related to both
economic and ecological sustainability of livestock
operations. In semiarid-arid areas the period of
resting/deferment plays a key role in the sustainability of a pasture throughout time (Reese 1993;
O’Reagain and Ash 2002). The information gathered
in this research suggest that for a roller-chopped
paddock with Green Panic in the Chaco a grazing
system with a resting interval higher than 30 days
and stubble heights higher than 10 cm could be
recommended to get high yield, high water efficiency
and appropriate persistence of the plants throughout
time. Results also indicate that a paddock may be
grazed 2–3 times during the rainfall season, a fact
that should be taken into account when planning
average stocking rates and persistence in time of a
pasture.
123
12 de 15
Sitio Argentino de Producción Animal
Author's personal copy
Agroforest Syst
Table 3 Kendall’s s
correlation coefficient and
its significance between
environmental variables and
accumulated aboveground
biomass harvested in each
sampling date of Panicum
maximum cv trichoglume cv
Petrie (Green Panic): a by
growth season and b by
growth season sorted by
harvesting intervals,
2001–02 and 2002–03
(A)
Growth season
Environmental variables
01–02
Rainfall between sampling dates
BM
s
Growing degree days
0203
0.55
p [ |s|
0.002
s
0.38
p [ |s|
0.03
Rainfall between sampling dates
s
0.62
p [ |s|
0.0034
Growing degree days
s
0.72
p [ |s|
0.0006
(B)
Growth season
Environmental variables
01–02
Rainfall between sampling dates
Growing degree days
02–03
References HI15: 15 day
harvesting interval; HI30:
30 day harvesting interval
Rainfall between sampling dates
Growing degree days
Acknowledgments Research was supported by the Instituto
Nacional de Tecnologı́a Agropecuaria (INTA) through Specific
Research Project ‘Desarrollo de sistemas silvopastoriles’ and
INTA Tucuman – Santiago del Estero Regional Center, Research
and Extension Project ‘Intensificación de la Producción de
Carne Bovina del Noroeste Argentino, 1999–2004’. We would
like to thank Dr Hugh Dove, CSIRO Australia, for its suggestions
that greatly improved this manuscript.
References
Albanesi A. (2012) Suelos en sistemas silvopastoriles de la
región chaqueña. In: Arroquy J, Ledesma R, Roldan
Bernhard S, Gómez A (eds.) Proc 2nd Congreso Nacional
de Sistemas Silvopastoriles, INTA Santiago del Estero,
p 212–220
Albanesi A, Anriquez A, Silberman J, Kunst C, Duffau A,
Dominguez Nuñez J (2012). Fracciones de carbono orgánico del suelo en rolados en el Chaco semiárido. In: Arroquy J, Ledesma R, Roldan Bernhard S, Gómez A (eds.)
Proc o2d Congreso Nacional de Sistemas Silvopastoriles,
INTA Santiago del Estero, p 212–220
Anriquez A, Albanesi A, Silberman J, Kunst C, Suarez R,
Domı́nguez Nuñez J (2012). Densidad aparente y materia
orgánica del suelo en rolados del Chaco Semiárido. In
Arroquy J, Ledesma R, Roldan Bernhard S, Gómez A
(eds.) Proc. 2d Congreso Nacional de Sistemas Silvopastoriles, INTA Santiago del Estero, p 299–304
HI15
HI30
s
0.42
0.73
p [ |s|
0.07
0.04
s
0.38
0.47
p [ |s|
0.10
0.18
s
0.44
0.66
p [ |s|
0.095
0.17
s
0.55
1.00
p [ |s|
0.04
0.04
Anrı́quez A, Albanesi A, Kunst C, Ledesma R López C,
Rodriguez Torresi, Godoy J (2005) Rolado de fachinales y
calidad de suelos en el Chaco occidental, Argentina.
Ciencia del Suelo (Argentina) 23: 145–157
Anslow R, Green J (1967) The seasonal growth of pasture
grasses. J Agric Sci Camb 68:109–122
Araujo A (2003) Analysis of variance of primary data on plant
growth analysis. Pesqui agrop Brasileira (Brasilia) 38:1–10
Belsky A, Mwonga S, Duxbury J (1993) Effects of widely
spaced trees and livestock grazing on understory environments in tropical savannas. Agrofor Syst 24:1–20
Boletta P (1988) Clima. Ch. 1, p. 7–15. In: Desmonte y habilitación
de tierras en la región Chaqueña semiárida. Oficina Regional
de la FAO para America Latina y el Caribe, Santiago
Canto Weber do M, Cabreira Jobim C, Gasparino E, Hoeschl A
(2008) Caracteristicas do pasto e acumulo de forragem em
capim-tanzania submetido a alturas de manejo do pasto.
Pesqui Agrop Brasileira, Brasilia 43:429–435
Carrillo J (2003) Manejo de pasturas. Ediciones INTA, Buenos
Aires
Castañares M (2002) Curvas de crecimiento y calidad forrajera
de Panicum maximum var. Trichoglume cv. Green Panic
bajo cobertura arbórea en un ambiente rolado. Graduate
Thesis, Facultad de Agronomı́a y Agroindustrias, Universidad Nacional de Santiago del Estero, Santiago del
Estero
Chacon-Moreno E, Rada F, Sarmiento G (1995) Intercambio
gaseoso, nitrógeno foliar y optimación en el manejo de
Panicum maximum (tipo común) sometido a diferentes
frecuencias de corte. Turrialba 45:19–26
123
13 de 15
Sitio Argentino de Producción Animal
Author's personal copy
Agroforest Syst
Conover W (1980) Practical nonparametric statistics, 2nd edn.
Wiley, New York
De León M (1999). Las pasturas subtropicales en la región
semiárida central del paı́s. p 15–34. Simposio Internacional
de Forrajeras Subtropicales, Facultad de Agronomı́a y
Zootecnia, Universidad Nacional de Tucumán, Tucumán
De León M, Peuser R, Boetto G, Luna G, Bulaschevich M
(1995a) Efecto del genotipo y la frecuencia de defoliación
sobre la producción de materia seca en gramı́neas megatérmicas cultivadas. Rev Arg de Prod Anim 15:226–228
De León M, Peuser R, Boetto G, Luna G, Bulaschevich M (1995b)
Efecto de la frecuencia de defoliación y del genotipo y sobre
la calidad del rebrote forraje producido en gramı́neas
megatérmicas. Rev Arg de Prod Anim 15:229–231
Durr F, Rangel J (2000) The response of Panicum maximum to a
simulated subcanopy environment. I Soil 9 shade interaction. Trop Grass 34:110–177
Eriksen F, Whitney S (1981) Effects of light intensity on growth
of some tropical forage species. I. Interaction of light
intensity and nitrogen fertilization on six forage grasses.
Agrofor J 73:427–433
Gibbens R (1991) Some effects of precipitation patterns on mesa
dropseed phenology. J Range Manag 44:86–90
Gillen J, McNew R (1987) Seasonal growth rates of tallgrass
prairie after clipping. J Range Manag 40:342–345
Gómez de la Fuente E, Dı́az Solı́s H, Saldı́var Fitzmaurice A,
Briones Encinia F, Vargas Tristán V, Grant W (2007)
Patrón de crecimiento de pasto buffel [Pennisetum ciliare
(Link.) Sin. Cenchrus ciliaris] en Tamaulipas México. Tec
Pec en México 45:1–17
Gonzalez R, Delgado H, Faria Mármol D, Morillo D (1997)
Evaluación de cultivos puros y asociados de Panicum
maximum y Centrosema sp. Interrelacionados con frecuencias de corte. Archivos Latinoamericanos de Producción
Animal, Suplemento 1:63–65
Groeneveld H (1998) Measuring the RGR of individual grass
plants. Ann Bot 82:803–808
Hunt R (1982) Plant growth curves. The functional approach to
plant growth analysis. University Park Press, Baltimore,
p 249
Infostat (2008) InfoStat, versión 2008. Manual del Usuario, 1st
edn. Grupo InfoStat Universidad Nacional de Córdoba,
Facultad de Ciencias Agrarias, Córdoba
Ivory D, Whiteman P (1978) Effect of temperature on growth of
five subtropical grasses. I. Effect of day and night temperature on growth and morphological development. Aus J
Plant Phys 5:131–148
Jackson J, Ash J (1998) Tree-grass relationships in open eucalypt woodlands of northeastern Australia: influence of trees
on pasture productivity, forage quality and species distribution. Agro Syst 40:159–176
Khan ACh (1971) Rainfall pattern and monthly forage yields in
the Thai ranges of Pakistan. J Range Manag 24:66–70
Kiss Trocsanyi, Fieldsend A, Wolf D (2009) Yield and canopy
characteristics of switchgrass (Panicum virgatum) as
influenced by cutting management. Biomass Bioenergy
33:442–448
Kunst C, Ledesma R, Basan M, Angella G, Prieto D, Godoy J
(2003) Rolado de fachinales e infiltración de agua en el
suelo en el Chaco occidental argentino. Rev Inv Agrop
32:105–122
Kunst C, Monti E, Perez H, Godoy J (2006) Assessment of the
rangelands of southwestern Santiago del Estero, for grazing management and research. J Environ Manag 80:248–
265
Kunst C, Ledesma R, Bravo S, Albanesi A, Anriquez A, van
Meer H, Godoy J (2012) Disrupting woody steady states in
the Chaco region (Argentina): responses to combined disturbance treatments. Ecol Eng 42:42–53
Ledesma R (2006) Desarrollo de sistemas ganaderos: una alternativa de manejo en ecosistemas degradados del Chaco
semiárido. Masters Thesis, Universidad Nacional de Santiago del Estero, Santiago del Estero, p 134
Littell R, Henry P, Ammerman C (1998) Statistical analysis of
repeated measures data using SAS procedures. J Anim Sci
76:1216–1231
Ludwig F, De Kroon H, Prins H (2008) Impacts of savanna trees
on forage quality for a large African herbivore. Oecologia
155:487–496
Morello J, Adamoli J (1974) Las grandes unidades de vegetación y ambiente del Chaco argentino. Segunda parte:
vegetación y ambiente de la provincia del Chaco. INTA,
Serie fitogeográfica No 13, Buenos Aires, 130 pp
Moreno X, Salazar A, Villasmil J, Urdaneta M (1995). Comportamiento fisiológico del pasto guinea (Panicum maximum Jacq.) sometido a diferentes frecuencias y alturas de
corte. I. Distribución de biomasa y análisis del crecimiento.
Revista de la Facultad de Agronomı́a, Universidad del
Zulia, 12, Maracaibo, pp 313–323
Obispo N, Espinoza Y, Gil J, Ovalles F, Rodriguez M (2008)
Efecto del sombreado sobre la producción y calidad del
pasto guinea (Panicum maximum) en un sistema silvopastoril. Zootecnia Tropical 26:285–288
O’Reagain P, Ash A (2002) Principles of sustainable grazing
management for the northern savannas. In: 12th Biennial
Conference, The Australian Rangeland Society, 2–5 September, 2002, Kalgoorlie, Western Australia. Consulted
September 2013 in http://era.deedi.qld.gov.au/185/
Overman A, Scholtz R III (2002) Mathematical models of crop
growth and yield. CRC Press, Boca Raton
Penton G (2000) Tolerancia del Panicum maximum cv Likoni a
la sombra en condiciones controladas. Nota Técnica. Pastos y Forrajes (Cuba) 24:305
Pieterse P, Rethman N, Van Bosch J (1997) Production, water
use efficiency and quality of four cultivars of Panicum
maximum at different levels of nitrogen fertilization. Trop
Grass 31:117–123
Ramirez Reynoso O, Hernandez Garay A, Carneiro Da Silva S,
Perez Perez J, Enriquez Quiroz J, Quero Carrillo A, Herrera
Haro G, Cervantes Nuñez A (2009) Acumulación de forraje, crecimiento y caracterı́sticas del pasto Mombaza
(Panicum maximum Jacq.) cosechado a diferentes intervalos de corte. Téc Pec en México 47:203–213
Reese P (1993) Overlooked and neglected principles of grazing
management. Proceedings the range beef cow symposium
XIII. University of Nebraska, Lincoln. Consulted in September 2013 digitalcommons.unl.edu/rangebeefcowsymp/
226
Ricci H, Guzman L, Perez P, Juarez V, Diaz A (1997) Producción de materia seca de siete gramı́neas tropicales bajo
tres frecuencias de corte. CIAT, Colombia: Pasturas
Tropicales 19:45–49
123
14 de 15
Sitio Argentino de Producción Animal
Author's personal copy
Agroforest Syst
Santos Menezes P, Alvares Balsalobre A, Corsi M (2003)
Morphogenetic characteristics and management of Tanzania grass. Pesqui agrop brasileira, Brasilia 38:991–997
SAS (1998) Release, vol 6.12. SAS Institute, Cary
Smart A, Dunn B, Johnson P, Xu L, Gates R (2007) Using
weather data to explain herbage yield on three Great Plains
communities. Range Ecol Manag 60:146–153
Smit G (2005) Tree thinning as an option to increase herbaceous
yield of an encroached semi-arid savanna in South Africa.
BioMed Central, BMC Ecology 5:1–15
Tavares de Castro C, Garcia R, Mesquita Carvalho M, Couto L
(1999) Producao forageira de gramineas cultivadas sob
luminosidade reduzida. Rev bras zoot 28:919–927
Tortorelli L (2009) Maderas y bosques argentinos, 2a edición,
Orientación Grafica Editora
Treydte A, Heitkonig T, Prins H, Ludwig F (2007) Trees
improve grass quality for herbivores in African savannas.
Perspect Plant Ecol Evol Syst 8:197–205
Tsoularis A, Wallace J (2002) Analysis of logistic growth
models. Math Bios 179:21–55
Vallentine J (2001) Grazing management. Academic Press, San
Diego, p 579
123
15 de 15