1
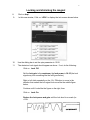
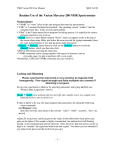
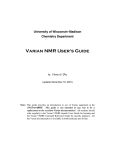
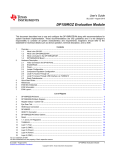
1
Operating Instructions for 1D Spectra
Mercury 200 NMR Spectrometer
May 11, 2011
Remember:
(1) Your NMR tube should contain enough sample to reach a depth of at least 4 cm.
(2) A clear solution with no floating particles is required to get a good shimming.
(3) On the 200 MHz instrument always spin the sample.
Setting up the software
1.
Login to the computer.
2.
Click on the icon to start the VNMR software.
3.
To eject the previous sample enter e.
4.
Place your sample in the spinner, place it on top of the magnet and enter i.
5.
IMPORTANT:
Enter ss (This retrieves the standard shims).
6.
Click on Main Menu of the VNMR software.
Click on Setup
then
click on H1, CDCl3
OR
then
then
7.
Enter su .
click on Nucleus, solvent
specify the nucleus (H1 or P31)
specify the solvent
2
Locking and shimming the magnet
8.
9.
Click on Acqi
In this new window, Click on LOCK to display the lock screen shown below.
10.
Use the sliding bar to set the spin parameter to 15-20.
11.
The deuterium lock signal should appear as above. If not, do the following:
Click on Lock: Off
Set the lock gain to the maximum, the lock power to 30-35 (the lock
signal may look something like the left figure below),
Right or left click repeatedly on the -16+ Z0 button to move in the
direction that makes the lock signal look more like the middle figure
below,
Continue until it looks like the figure on the right, then
Click on Lock: On.
Reduce the lock power and gain until the lock level is on scale (i.e.
<100).
3
----------------------------------------------------------------------------------------------------------------Notes:
•
Before you start shimming -
Make sure the lock phase is set correctly. The correct lock phase setting is
shown on a note attached to the monitor. The lock phase normally does not
need adjusting but sometimes people set it incorrectly.
•
The lock power should not be set so high that it causes saturation (large
fluctuations of the lock level). The lock power is set correctly if, when you turn
down the lock power, the lock level goes down and stays down and does not
rebound higher).
[N.B. the solvents acetone, acetonitrile and methanol need quite low values of lock
power (10 or less) or saturation will result. Increase the lock gain to compensate.]
----------------------------------------------------------------------------------------------------------------
Click on SHIM to get the shim screen
12.
Change Z1C to maximize the lock level. Do this by clicking on the Z1C
–1+
button to cause the lock signal to increase. The object is to get the “current
lock level” as high as possible. A coloured bar graph is also provided – try to
get it as far to the right as possible.
13.
Change Z2C to maximize the lock level. Do this by clicking on the Z2C
button to cause the lock signal to increase. Find a new maximum.
Æ If the lock level goes over 100, decrease the lock gain.
14.
Repeat steps 12 and 13 until the best (maximum) lock signal is found.
15.
Close the acqi window
16.
Enter ga (this will start the data acquisition).
–1+
4
Data Processing
17.
When the spectrum appears, enter aph dscale.
18.
To expand the display horizontally: click with the left mouse button in the
spectrum where you want the left edge of your plot to be and then click with
the right mouse button where you want the right edge to be, then click on
Expand in the menu.
Alternatively, you could enter, say, sp=0p wp=10p (sp designates the right
edge of the display and wp designates the width of the display).
To expand the display vertically: place the mouse directly over a peak, press
and hold down the middle mouse button and raise the peak to the desired
height.
The command vsadj will always make the highest peak in the display to be on
scale.
19.
Optional: To create a text comment for plots enter text(‘whatever text you
want’) .
20.
To integrate:
Enter ds
Enter cz
Click on Part integral then Click on resets
Using the left mouse button, starting at the left end of the spectrum,
Click to the left and right of each peak you want to integrate. Enter ds
when complete.
Enter isadj , (this adjusts the integral scale so that all are on-scale).
Enter dc . (If integrals are still not flat enter bc ).
To normalize, place the cursor on an integral, click on Set Int and enter
the value for the integral.
To plot, enter pl pscale ppa pir page
5
21.
To peak pick:
Enter ds
Click on Th
Adjust the threshold.
If desired, enter dpf to see the chemical shifts on the display.
If too many peaks are listed, enter ds , click on Th, then use the left
mouse button to move the threshold higher and enter dpf .
To plot spectra with peaks listed, enter pl pscale ppa ppf page .
To get a line listing on a separate piece of paper enter pll page .
To save your data:
Enter svf . Then supply the filename.
To retrieve data:
Click on Main Menu
Click on File.
Click on the filename
Click on Load.
Enter wft.
The method for acquiring and processing 31P spectra is the same as above except
for the setup command (step 6). See next page.
Eject your sample, put one of the NMR tubes from the rack in the spinner and insert it
properly into the magnet.
When finished with the spectrometer do the following:
Enter exit .
Click on Exit at the bottom of the screen. Then Click on OK in the new window.
6
Useful commands
Acquisition commands
ga - starts acquisition
aa – stops acquisition
wft – performs Fourier transform
Display commands
jexpx – join experiment x (x=1-999 avoid 5). If an error occurs use cexp(x) command below.
cexp(#) – creates experiment area number #
time - display the time an experiment will take
ds - display the spectrum
s1 – save display parameters (can use s1 through s9)
r1 – recall display parameters previously saved with s1 (can use r1 through r9)
dg – display group (displays parameters)
dg1 – display second (processing, plot... parameters)
dps – display pulse sequence
da – display array
dssh – display stack horizontally
full – uses full screen; needed after dssh and other commands
nl – first set cursor close to peak, then finds nearest line
File commands
svf (enter) then supply the filename – to save file with associated data, phasing, etc. or svf(‘filename’)
mf(3,4) – copy fid from exp3 to exp4
7
Processing commands
lb=1 – gives exponential broadening of 1 hertz with wft or ga
wft – weighted (depending on parameters set) FT
aph – good automatic phase to at least start phasing
cz – zero all integral resets (use menu button reset and mouse for resets)
bc – baseline correction with default spline fit; depends on integral resets
Plotting commands
pl – plot spectrum as displayed
pir – plot integral values
pap – plot all parameters
ppa – plot only a few parameters
pscale – plot scale
page – eject page from printer