1
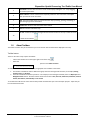
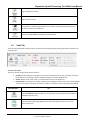
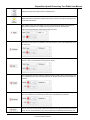
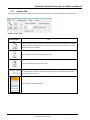
Disposition Spatial Processing Tool Public User Manual Apr 10, 2014 Disposition Spatial Processing Tool Public User Manual Revision History Version Date Author/Organization Description 0.1 2013-11-02 Pauline Peterson Draft 0.2 2014-02-27 Alex Crosland Update screen shots Apr 10, 2014 Disposition Spatial Processing Tool User Manual © 2014 Government of Alberta Page 2 of 33 Disposition Spatial Processing Tool Public User Manual DISCLAIMER In this disclaimer provision: “Crown” means Her Majesty the Queen in right of the Province of Alberta; “Minister” means the Minister responsible of the Alberta Sustainable Resource Development; “Their employees” means and includes each, any and every officer, employee, servant and agent of either or both of the Crown and the Minister and without limiting the generality of the foregoing, and includes employees of the Crown and the Minister employed in Alberta Sustainable Resource Development. “DSPT” means the Disposition Spatial Processing Tool and all programs, hardware, documentation, functions and services forming a part thereof or associate therewith. The Crown, the Minister and their employees and the contractors and technical advisors of the aforesaid: (a) Make no warranty or representation, whether expressed or implied, to any person with respect to this material or documentation of DSPT or as to the service, performance, quality, merchantability or fitness of any part of the aforesaid for any purpose; and (b) Shall not be liable for any action, damages or claims, whether occasioned by negligence or otherwise, that any person, user, Subscriber or any employees of the aforesaid may hereafter have, allege or become entitled to (including but not limited to any claim of third-party contribution of indemnity, any economic or moral loss, or direct, immediate, special, indirect or consequential damages which do, may, or are alleged to arise as a result of: (i) The use of this material or documentation or DSPT or any service connection therewith; or (ii) Any error or omissions in data or any loss or partial loss of data or incomplete retrieval of information, even if any or all of the Crown, the Minister or their employees were advised of the possibility of such risk, action, claims or damages, including damages sustained or actions brought by third parties and claims made against the Subscriber by third parties. The entire risk of loss relating to or associated with the quality and performance of DSPT and any product and results thereof shall be assumed by the Subscriber and by any other user of DSPT. Apr 10, 2014 Disposition Spatial Processing Tool User Manual © 2014 Government of Alberta Page 3 of 33 Disposition Spatial Processing Tool Public User Manual Table of Contents 1. GENERAL INFORMATION ..................................................................................................................... 6 1.1 2. 3. System Overview ........................................................................................................................ 6 GETTING STARTED ......................................................................................................................... 7 2.1 Logging On ................................................................................................................................... 7 2.2 Terms of Use ............................................................................................................................... 7 2.3 Exit System .................................................................................................................................. 7 USING the SYSTEM (ONline) ................................................................................................................ 8 3.1 The Main Screen ......................................................................................................................... 8 3.2 About Toolbars............................................................................................................................ 9 3.3 Getting Around Tab .................................................................................................................. 10 3.4 Tasks Tab ................................................................................................................................... 11 3.5 Analysis Tab............................................................................................................................... 15 3.6 The Information Pane ............................................................................................................... 16 The Results List .................................................................................................................................... 16 Map Layers/Layer List .......................................................................................................................... 17 3.6.1 3.6.2 3.7 I Want to Menu ......................................................................................................................... 18 3.8 Use the Pan and Zoom Tools .................................................................................................... 19 Pan Tool ............................................................................................................................................... 19 Zoom Tools .......................................................................................................................................... 19 Zoom In and Out .................................................................................................................................. 19 Full Extent Tool .................................................................................................................................... 20 Initial, Previous, and Next Extent Tools ............................................................................................... 20 Map Scale Box and Scale Bar ............................................................................................................... 20 How Scale Works ................................................................................................................................. 20 3.8.1 3.8.2 3.8.3 3.8.4 3.8.5 3.8.6 3.8.7 3.9 Use Layers ................................................................................................................................. 21 3.10 Add Markup .............................................................................................................................. 22 3.10.1 To add markup to the map: ............................................................................................................. 23 3.11 About GO TO ATS ...................................................................................................................... 25 3.12 Use the Identify Tools ............................................................................................................... 25 3.12.1 3.13 To identify features by drawing on the map: .................................................................................. 26 Share a Map .............................................................................................................................. 27 3.13.1 To share a map by sending a URL: ................................................................................................. 28 3.14 Export a Map ............................................................................................................................. 28 3.15 Print a Map................................................................................................................................ 30 3.16 The Context Menu .................................................................................................................... 31 Apr 10, 2014 Disposition Spatial Processing Tool User Manual © 2014 Government of Alberta Page 4 of 33 Disposition Spatial Processing Tool Public User Manual 3.17 About Projects........................................................................................................................... 32 3.17.1 3.17.2 3.17.3 3.17.4 Apr 10, 2014 Where are Projects saved? ............................................................................................................. 32 Save and Open Projects .................................................................................................................. 32 To save a project to your computer: ................................................................................................ 33 To open a project saved to your computer: ..................................................................................... 33 Disposition Spatial Processing Tool User Manual © 2014 Government of Alberta Page 5 of 33 Disposition Spatial Processing Tool Public User Manual 1. GENERAL INFORMATION 1.1 System Overview The Disposition Spatial Processing Tool (DSPT) is a web application to provide the general public a view of surface activities on Public Land. Typically this data was obtained from hand drawn Township mylars. The department has retired the township mylar maps and implemented a new digital information version of maps. Disposition Spatial Processing Tool (DSPT) The official launch of DSPT is October 31, 2013 to view the Provisional Layer, Digital Integrated Dispositions (DIDs) and other background data layers by the public. No login is required. How does it work? It all begins with the plan submitted to the Plan Confirmation Service (PCS). All plans processed in PCS are validated based on the existing plan standards. For CAD files PCS creates a shape file for processing by Electronic Disposition System (EDS). When an application or amendment or a plan package submission is made in EDS, the shape file is loaded into the Provisional Layer real-time. In DSPT that layer is shown on the top of the layers list and all the activity extents are shown blue on the map. The Provisional Layer is the surface activity extent before the graphic get integrated into the Digital Integrated Dispositions (DIDs). DSPT displays both the provisional layer and DIDs to provide a complete view of active surface activities on Public Lands. The spatial layers will also be used by the Lands Disposition Branch for conducting the Technical Review of Submissions The public will be able to navigate to an area of interest and create, view and print PDF maps. An activity can be located by selecting the ATS Search button and entering one of the lands where the activity is located. You may have to zoom out to see the whole activity. The official launch of DSPT is October 31, 2013 and we welcome your feedback at [email protected]. Help Desk support hours are between 8:15 am to 4:30 pm Monday to Friday. The application may not be available during normal maintenance windows: Daily: 4:00-4:05 am Sundays: 9pm to 4:05am Apr 10, 2014 Disposition Spatial Processing Tool User Manual © 2014 Government of Alberta Page 6 of 33 Disposition Spatial Processing Tool Public User Manual 2. GETTING STARTED 2.1 Logging On There is no logging in required with DSPT. Launch your internet browser and launch DSPT. Go to DSPT When you launch the applications you are asked to read the Terms Of Use and check the box that you understood what you read. 2.2 Terms of Use While every effort has been made to ensure that the information accessible from this site is complete, accurate, and current, the Government of Alberta, their agents and employees are not liable for any loss or damage arising directly or indirectly from the possession, publication, or use of, or reliance on, that information. This information is provided "as is" without expressed or implied warranty. All base feature data accessible from this site are owned by the Government of Alberta and protected by copyright law. No base feature data can be reproduced or distributed without the prior written permission of the Government of Alberta. "Base Data" are provided by the Spatial Data Warehouse Ltd. Other data are provided by the ministry of Environment and Sustainable Resource Development (ESRD). This mapping website is maintained by the provincial government. Please click on the continue button to consent to the content of this page and proceed to the site. I have read and understand this Terms of Use agreement. My use of this site is acknowledgment of my agreement to be bound by these terms and conditions. 2.3 Exit System Close down your browser to end your session with DSPT Apr 10, 2014 Disposition Spatial Processing Tool User Manual © 2014 Government of Alberta Page 7 of 33 Disposition Spatial Processing Tool Public User Manual 3. USING THE SYSTEM (ONLINE) 3.1 The Main Screen When you open the Viewer, you see the screen below. The navigation elements the toolbar, the information panel, the I Want To menu and the overview map are visible. Navigation features in the main screen of the Viewer Number Screen Element 1 Viewer title bar: Displays the title of the application. 2 Toolbar: The toolbar contains numerous tools that are grouped into tabs by function. 3 Toolbar tabs: The toolbar consists of tabs that categorize the tools into high-level groups: Getting Around, Tasks, and Analysis. 4 Information Panel: This panel lists information different kinds of information when you interact with the map. For example, it displays Map Layers where you can select different layers to hide or show on the. Apr 10, 2014 Disposition Spatial Processing Tool User Manual © 2014 Government of Alberta Page 8 of 33 Disposition Spatial Processing Tool Public User Manual 5 Zoom Slider: Use this slider to zoom in or out on the map by clicking the + or - or by dragging the marker up and down. 6 I want to Menu: A menu of shortcuts to frequently-used tools. This menu tries to anticipate what you will want to do most often. 7 Map: The map window where you interact with the map by zooming, panning, annotating, or right-clicking to get more information. 8 Toolbar Icon: Shows or hides the toolbar when clicked. 9 Scale: The current scale of the map. Lat: Lon: Provide to latitude and longitude of the mouse location on the map. Select the arrow 10 to show the coordinates 3.2 About Toolbars The toolbar contains many of the tools that you use to interact with the information displayed in the map. Toolbar button There are two other ways to open the toolbar: - Click on the Toolbar icon on the upper-right corner of the map Select the option on the I Want To menu. To make it easier to find a particular tool, they are grouped on the toolbar at two levels: 1. 2. The toolbar is divided into tabs or ribbons that group the tools into high-level functions, for example, Getting Around, Tasks, and Analysis. Each tab is divided into sections by function. For example, on the Getting Around tab, there is a Map Layers and Navigation Tools section. The latter section contains the functions Pan, Zoom In, Zoom Out, Full Extent, Previous Extent, Next Extent, Point Identify and Go to ATS. To the left of the tabs are two icons that are always visible and that allow you to save and open projects - maps that you have annotated and saved. Apr 10, 2014 Disposition Spatial Processing Tool User Manual © 2014 Government of Alberta Page 9 of 33 Disposition Spatial Processing Tool Public User Manual ICONS TABS SECTION 3.3 Getting Around Tab The Getting Around tab of the toolbar contains tools to facilitate navigation. Most of the tools are activated when you click them. Getting Around tab of the toolbar The tools in this tab are grouped into these sections: Map Layers: Show Layers for displaying the Layer List Navigation Tools: tools for panning, zooming, Identifying information and jumping to specific extents Use this tool... To... Displays all the Operational Layers in the Information Panel Pan (move) the map in any direction. To pan the map, click on it and drag in any direction. Use the Pan tool to return to panning when you have used other tools. Zoom in when you click on the map. Zoom out when you click on the map. Show the full extent of the current map. Apr 10, 2014 Disposition Spatial Processing Tool User Manual © 2014 Government of Alberta Page 10 of 33 Disposition Spatial Processing Tool Public User Manual Jump to the previous extent. Jump to the next extent. Identify data at a particular point anywhere on the map. All the features beneath the pont you click are listed on the Results List Zooms to a specified Alberta Township or Quarter Section 3.4 Tasks Tab The Tasks tab of the toolbar contains tools for a variety of tasks including printing, viewing the results of searches, and annotating the. Tasks tab of the toolbar The tools in this tab are grouped into these sections: Printing: Provide settings for printing the current map, including format (e.g. PDF), resolution, and scale. Export the current map image, with any additional markup, to common image formats Results: Display recent search results, or selected search results in the Results List. Drawing Tools: Provide tools for creating, formatting, and editing annotations to the map, including shapes and text. Some tools in this section are active only when an annotation on the map exists and is selected. Use this tool... To... Open the Print Map dialog box where you can select the Layout, Output Format, Resolution, and Scale to print the map. Open the Export a Map Image dialog box and select the image format that you want to export the map into. Apr 10, 2014 Disposition Spatial Processing Tool User Manual © 2014 Government of Alberta Page 11 of 33 Disposition Spatial Processing Tool Public User Manual Display the results of the latest search in the Results List. Display features that have been selected from search results or the map by clicking the star icon beside each feature. Draw a point on the map. The shape, size, color and transparency of the point can be set using tools that appear on the toolbar when you select one of the drawing tools. These tools change based on which drawing tool you select. Draw freely on the map in any direction. The style, thickness, color, and transparency of the line can be set. Draw a straight line or click to change the line and draw in a new direction. The style, thickness, color, and transparency of the line can be set. Draw a polygon on the map, clicking to change direction. Double-click to stop drawing. You can set the thickness, color, and transparency of the border and the color and transparency of the fill. Draw a rectangle on the map. Click and drag across the map. You can set the thickness, color, and transparency of the border and the color and transparency of the fill. Draw an arrow on the map. Drag in different directions to change the shape and size of the arrow. You can set the thickness, color, and transparency of the border and the color and Apr 10, 2014 Disposition Spatial Processing Tool User Manual © 2014 Government of Alberta Page 12 of 33 Disposition Spatial Processing Tool Public User Manual transparency of the fill. Draw a circle on the map. Drag into the center or outwards to change the size of the circle. You can set the thickness, color, and transparency of the border and the color and transparency of the fill. Draw an ellipse on the map. Drag in different directions to change the shape and size of the ellipse. You can set the thickness, color, and transparency of the border and the color and transparency of the fill. Draw a triangle on the map. Drag in different directions to change the shape, size and direction of the triangle. You can set the thickness, color, and transparency of the border and the color and transparency of the fill. Add text to the map. Click on the map and type the text. You can change the font, size, color, transparency and angle of the text. You can add multiple lines of text and select layer and field information to add to the label. Undo the most recent edits to a drawing. Redo the most recent changes to a drawing. Edit the points of a drawing on the map. When you click on the drawing you want to edit, the points activate and you can then drag any of the points in any direction to change the shape of your drawing. You can also rotate the drawing by clicking and dragging the square above the marquee in the middle of the graphic. Apr 10, 2014 Disposition Spatial Processing Tool User Manual © 2014 Government of Alberta Page 13 of 33 Disposition Spatial Processing Tool Public User Manual Clear all the drawings on the map at the same time. Remove drawings from the map one at a time by clicking on each one. Apr 10, 2014 Disposition Spatial Processing Tool User Manual © 2014 Government of Alberta Page 14 of 33 Disposition Spatial Processing Tool Public User Manual 3.5 Analysis Tab The Analysis tab of the toolbar contains tools to help you find information as well as manipulate, and analyze data. Analysis tab of the toolbar Use this tool... To... Select a coordinate system and then enter known coordinates to find a feature. You choose whether to add the coordinate to the map as a callout. You can also choose to pan to that coordinate when you click OK. Place a callout on the map for every point you click. Clear any coordinates currently on the map. Find the coordinates by clicking anywhere on the map and reading the result in this box. If you click the Plot Coordinates tool and then click the map, the coordinates for each place you click appear on the map. Select a different Coordinate System. Apr 10, 2014 Disposition Spatial Processing Tool User Manual © 2014 Government of Alberta Page 15 of 33 Disposition Spatial Processing Tool Public User Manual 3.6 The Information Pane The information pane is a multi-use panel that displays many kinds of data. When you do a search or use the Identify tools, the results of the search or selection display in the information pane and it is then referred to as the Results List. When you activate map layers, the panel is referred to as the Map Layers list or the Layer List. To resize the information pane, hover over the divider until your cursor changes to a double arrow and then drag left or right. Cursor changes to a double arrow Each tool that uses the information panel has an icon. As you work with a map and use different tools, their icons remain in the toolbar at the bottom of the pane so that you can quickly return to that tool by clicking its icon. Information panel with multiple kinds of data displayed 3.6.1 The Results List One of the main functions of the information panel is to display search results, or list selected features when you use an Identify tool. When you use these tools, any results are listed in the information panel and the title bar changes to Results. In this mode, the panel is referred as the Results List. Apr 10, 2014 Disposition Spatial Processing Tool User Manual © 2014 Government of Alberta Page 16 of 33 Disposition Spatial Processing Tool Public User Manual 3.6.2 Map Layers/Layer List Another important list that appears in the information panel is Map Layers, which is sometimes referred to as the Layer List. Map Layers open when you click the arrow beside the I Want To menu, or the Show Layers tool on the Maps & Data Sources tab of the toolbar. Show Layers Tool Because maps often have many layers, the layers in Map Layers are organized into groups that you can collapse and expand. When you first open the Map Layer, some groups may be open while others are closed. Similarly, some layers may be visible on the map while others are not. Beside each layer or layer group, there is a checkbox that is used to turn a layer on or off . Beside layer group, there is a Plus icon or Minus icon that you use to expand or collapse the layers inside the group. Expanding and collapsing groups does not change which layers are visible on the map; it simply helps you stay organized. The transparency slider beside some layers makes it possible to make that layer transparent so that you can see other layers through them. Layers listed in groups At the bottom of the Map Layer, is the Show Layers/Show Legend button that makes it possible to quickly toggle between the layer view and the map Legend. Legend displayed in the Map Layer Apr 10, 2014 Disposition Spatial Processing Tool User Manual © 2014 Government of Alberta Page 17 of 33 Disposition Spatial Processing Tool Public User Manual 3.7 I Want to Menu When the map first opens, this menu is an orange button on the map . When you click the down arrow, the I Want To menu displays a list of tools that are used often. Essentially, this menu is a shortcut to the tasks that you are likely to want to do more often than others. The I Want To menu may look different in the map you are using if some of the tools have been added or deleted from the menu. I Want To menu - open Apr 10, 2014 Disposition Spatial Processing Tool User Manual © 2014 Government of Alberta Page 18 of 33 Disposition Spatial Processing Tool Public User Manual 3.8 Use the Pan and Zoom Tools The ability to pan and zoom in and out of the map is a key feature of web maps, so it is not surprising that there are many different ways to do this on the map. Pan, zoom, scale, and bookmark tools make it possible to move quickly to specific areas of a map 3.8.1 Pan Tool You can use the Pan tool to drag the map in any direction, or use the arrow keys on the keyboard to move in increments up, down, or sideways. 3.8.2 Zoom Tools Zoom Slider You can use the zoom slider in several ways: Click the Plus + or Minus - to zoom in or out on the map. Drag the slider up and down to zoom in and out. Click on the increment lines to move to a particular extent. 3.8.3 Zoom In and Out The easiest way to zoom in or out on the map is to use the scroll wheel of your mouse. To zoom in, click on the map, and then scroll the wheel away from you. To zoom out, click on the map, and then scroll the mouse wheel towards you. When you click the Zoom In or Out tools, and then click the map it zooms to the next increment in the scale and centers the map wherever you clicked on the map. You can use the Zoom tools more precisely by clicking the tool and dragging a box on the map. When you let go of the mouse, the map has zoomed to the area you defined by the box, whether you are zooming in or out. When you use a box to zoom, the map zooms precisely to the extent of the box you draw and centers on the box area. So if you want to enlarge the map by a large amount, draw a very small box right over the area of interest. Apr 10, 2014 Disposition Spatial Processing Tool User Manual © 2014 Government of Alberta Page 19 of 33 Disposition Spatial Processing Tool Public User Manual To reverse the zoom direction, hold down the Ctrl key and draw another square. The map zooms in the opposite direction from the zoom tool you have selected. 3.8.4 Full Extent Tool The Full Extent tool is a quick and easy way to zoom out as far as possible on any particular map. 3.8.5 Initial, Previous, and Next Extent Tools These tools take you to the Initial extent that the map was set when you opened it, or to the Previous extent you were on, or the Next extent. 3.8.6 Map Scale Box and Scale Bar Another method of zooming uses the Map Scale box. The Map Scale box shows the current map scale but it is a drop-down box and you can use the long list of other scales to zoom in or out of the map to a particular scale. You can also type in a particular scale and then press Enter to jump directly to a particular scale. The Scale Bar shows the estimated scale of the map at any giving extent. The Map Scale box and Scale Bar are for navigation only, and may not be perfectly accurate. Without information about the size of your monitor or device, it is impossible to accurately provide a ratio scale. Any scale error is more pronounced if you have a large monitor or a projector with a very low resolution, or if you have a small monitor at a very high resolution. A 17" monitor running at a resolution of 800x600 or 1024x768 represents the scale more accurately. Some maps have limits on the scales at which you can view the data, and some layers and map labels may only appear at certain scales. If the layer you need is unavailable at your current map scale, zoom in until the layer becomes available. 3.8.7 How Scale Works When you zoom in, the scale of the map gets larger. A large-scale map covers a smaller land area than a small scale map. A map that is zoomed in to a small town is large scale, whereas a map of Canada is small scale. The reason is that scale is a ratio. In other words, 1:10 means that one unit on the map represents ten units in the real world. In this case - 1:10 - the map is one-tenth the size of the real world. Because it is a ratio, it doesn't matter if the units are centimeters, miles, or any other units. If you have a 1:100 000 map, the map is 1/100 000 the size of the actual place and 1/100 000 is a much smaller fraction (or ratio, or scale) than 1/10. A larger scale equals greater detail. Apr 10, 2014 Disposition Spatial Processing Tool User Manual © 2014 Government of Alberta Page 20 of 33 Disposition Spatial Processing Tool Public User Manual 3.9 Use Layers Layers contain all the data in a web map, so knowing how layers function is essential. Map Layers in the information panel To change the visibility of layers on the map: 1. To turn a layer on or off , click the checkbox in front of that layer in the Map Layers. Layers with text that is pale gray are not visible at the current scale. 2. To zoom directly to where a layer is visible, click that layer in the list, and then click Zoom To Visible Scale. Click Zoom To Visible Scale in the Layer Actions menu 3. To zoom to an extent that is just large enough to include all of the layer's features, click the layer to open the Layer Actions menu, and then click Zoom to Extent. This is different from the Zoom to Full Extent tool in the Getting Around tab of the toolbar, which zooms out as far as possible. 4. To make a layer transparent, drag the transparency slider to the left. The Charlotte county border layer changed to 82% transparency Apr 10, 2014 Disposition Spatial Processing Tool User Manual © 2014 Government of Alberta Page 21 of 33 Disposition Spatial Processing Tool Public User Manual 5. To quickly filter the list of layers to show only the one you want to see, start to type the name into the Filter box. The Map Layers list updates as you type to show only the layers that match your filter word. Use the Filter box to list only layers you want to see Filtering the layers in the Map Layers panel does not affect the visibility of the layers on the map, but it does make it easier to find a particular layer or reduce the number of layers if you are working with a long list of layers. 3.10 Add Markup One advantage of web maps is that you can add bookmarks, measurements, shapes, and text to mark important features. When you add markup, it does not affect the original map. You can save a map with markup as a project and open it later or share it with others using a URL. You can also print the map or export it as an image and email it. Different shapes and markup on the a map Apr 10, 2014 Disposition Spatial Processing Tool User Manual © 2014 Government of Alberta Page 22 of 33 Disposition Spatial Processing Tool Public User Manual 3.10.1 To add markup to the map: 1. Click the Tasks tab of the toolbar to find the Drawing tools. Drawing tools on the Tasks tab of the toolbar 2. To add a drawing to the map, do any of the following: Click Point, and then click any point on the map. When you select the Point tool, you activate the Style, Size and Color tools. You can use these tools to change the style of your point to a circle, cross, diamond, square, or triangle shape. You can also change the size of your point and the color. Tools to change the appearance of a point Click Freehand, and then draw in any direction on the map. When you select the Freehand tool, you activate tools that allow you to change the style of the line to dashes or dots, as well as the thickness and color of the line. Tools to change the appearance of a freehand line Click Line, and then drag across the map to draw a line. To continue the line but change direction, click and then drag in the new direction. To end the line, double-click. You can change the style of the line using the same set of tools as the Freehand tool; Style, Thickness, and Color. Click Polygon, and then drag across the map to start a polygon. To change direction, click and then drag in a new direction. Shading appears to indicate that the polygon is filling in the space of the area made by your drawing. Double-click to end the polygon. You do not have to complete the shape, as long as the shading covers the area, you can double-click and the application completes the shape for you. When you click the Polygon tool, you can change the border color, the fill color and the thickness of the border line. Tools to change the appearance of a polygon Apr 10, 2014 Disposition Spatial Processing Tool User Manual © 2014 Government of Alberta Page 23 of 33 Disposition Spatial Processing Tool Public User Manual Click Rectangle, and then click one corner of the rectangle you want to draw. Drag away from the corner and a shaded rectangle forms under your cursor. When you click the Rectangle tool, you activate tools that can change the border color, the fill color, and the thickness of the border line. Click Arrow, and then drag across the map to. An arrow forms under your cursor. To change the shape and size of the arrow, drag it up, down or sideways. When you click the Arrow tool, you activate tools that can change the border color, the fill color, and the thickness of the border line. Click Circle, and then drag away from that point to draw a circle. The circle draws from the center out, so the further you drag your cursor, the bigger the circle gets. When you click the Circle tool, you activate tools that can change the border color, the fill color, and the thickness of the border line. Click Ellipse, and then drag across the map to draw an ellipse. The ellipse draws from the corner of the shape, so you can change the shape by moving the cursor up and down or sideways. When you click the Ellipse tool, you activate tools that can change the border color, the fill color, and the thickness of the border line. Click Triangle, and drag across the map to draw a triangle. The triangle draws from once corner of the triangle, so you can change the shape by moving the cursor up and down or sideways. When you click the Triangle tool, you activate tools that can change the border color, the fill color, and the thickness of the border line. Click Text, and then click on the map where you want the text to begin. As you cannot move the text after you have typed it, be sure to select the exact spot where you want the text to be on the map. Type the text you want to add to the map. When you click on the Text tool, you activate tools that can change the font family, the font size, color, and angle of the text. When you click the Text tool and then click a point on the map, the tool identifies features at that point. You can then use the Text tool to add this feature information to a label on the map. Tools to change the appearance of text Apr 10, 2014 Disposition Spatial Processing Tool User Manual © 2014 Government of Alberta Page 24 of 33 Disposition Spatial Processing Tool Public User Manual 3.11 About GO TO ATS The Go To ATS search allows you to search for ATS land location on the map. If you are looking for one section or township enter section township range and select meridian than select the search button. If you are looking to search an area say over a couple of townships enter the upper and lower land locations to form a box around the locations you want to search. The results of the search appear on the map panel. The box is highlighted yellow to identify the selected area Select 3.12 for the Task tab to view information of the results of the search. Use the Identify Tools The Identify Tools are really another way to search for information in the layers of the map. Instead of typing a word and clicking search, you define an area on the map by drawing a shape. The application then finds all the information about the layers and features in that area and lists them in the Results List. On the Getting Around tab of the toolbar, there is one Apr 10, 2014 Disposition Spatial Processing Tool User Manual © 2014 Government of Alberta Page 25 of 33 Disposition Spatial Processing Tool Public User Manual identify tool - the Point Identify tool. You can exclude layers from the Identify process and also add an additional buffered area around the area you define. When you use an Identify Tool, it searches multiple layer at the same time: If a layer is off (not visible), that layer's information is not included in the Identify process. If the layer is not in visible at the current scale (text is gray), that layer's information is not included in the Identify process. The results of the identify process are displayed in the Results List in the same way that Search results are displayed. As the application finds features, it begins displaying the results in the Results List immediately. The results are grouped by layer. 3.12.1 1. 2. To identify features by drawing on the map: To ensure that the layers you want to search are included in the identify process, click Show Layers on the Map and Data Sources tab of the toolbar. If any of the layers you want to include in the search are in gray text, click on that layer and then click Zoom To Visible Scale. Identify tools on the Analysis tab of the toolbar Apr 10, 2014 Disposition Spatial Processing Tool User Manual © 2014 Government of Alberta Page 26 of 33 Disposition Spatial Processing Tool Public User Manual 3. To define an area to identify, do any of the following: Click Point Identify, and then click any point on the map. Any features found at that point on the map are included in the identify process. The results are displayed in the Information Panel Hover over a result to show in a highlight yellow on the map 3.13 Share a Map The easiest way to share a map with others is to send the URL of the map you are working with so that they can open the same map in their browser. When you send a URL, the other person can also interact with the map and see all the layers and features that you can see. When you share a map, the following data is visible: The current map extent. The current visible layers. The State of the toolbar (open/closed). The state of the information panel (open/closed). The state of the overview map (open/closed). Apr 10, 2014 Disposition Spatial Processing Tool User Manual © 2014 Government of Alberta Page 27 of 33 Disposition Spatial Processing Tool Public User Manual 3.13.1 To share a map by sending a URL: 1. 2. 3. 4. Click the I Want To menu and select Share current map . The Share Current Map dialog box opens with the URL to the current map highlighted. The Share Current Map dialog box Click Copy to Clipboard or press Ctrl+C on the keyboard. Open the application you want to paste the URL into, for example, email. Press Ctrl+V on your keyboard or use the Paste button in the application to paste the URL into the email. You can now send the URL as part of the email message. 3.14 Export a Map You can export the map as an image file in a variety of image formats, including PNG, BMP, JPEG, and TIFF. When you export a map, any markup that you have added are flattened onto the image and exported too. To export a map image: 1. Do one of the following: In the Tasks tab of the toolbar, click Export Map. Right-click on the map image and from the context menu, select Export a Map Image. The Export a Map Image dialog box opens. 2. 3. From the Select Image Format drop-down list, select the image format you want to use. Select Include Georeference Data if you want to position the map image on a map when imported to other GIS applications. Click Create Image. If you selected Include Georeference Data, the following confirmation message displays: Export a Map Image dialog box 4. Apr 10, 2014 Disposition Spatial Processing Tool User Manual © 2014 Government of Alberta Page 28 of 33 Disposition Spatial Processing Tool Public User Manual If you did not select the Include Georeference Data, the following confirmation message displays: 5. Do one of the following: Click Download and when the Save As dialog opens, navigate to where you want to save the zip file, and click Save. Click View Image to open the image in your browser. The map image opens. The map image is taken at the extent your map was at the time you exported it. If your map contained markup, it is included in the image. 6. Do any of the following: Copy the image and paste it into an email. Copy the URL. Print the image by right-clicking on the title bar or using the File menu. Apr 10, 2014 Disposition Spatial Processing Tool User Manual © 2014 Government of Alberta Page 29 of 33 Disposition Spatial Processing Tool Public User Manual 3.15 Print a Map When you print a map, you have several options that make it possible to set up precisely how your map should be printed, including the layout, format, resolution, and scale. To print a map: 1. Do one of the following: On the Tasks tab of the toolbar, click Print Map. In the I Want To menu, click Create a Printable Map. The Create a Printable Map dialog opens. Options for printing the map in the Create a Printable Map dialog box 2. Select from the following options: Select Layout: Options include Portrait or Landscape. Output Format: Pdf format. Resolution: 96 DPI. Map Scale: Options include the Current Extent, the Current Scale, or several specific numeric options. Grid: None Add Map Title: add text that will become your map title. 3. Click Create File. When your print file is ready, a confirmation message displays. "Your file is ready" confirmation message Apr 10, 2014 Disposition Spatial Processing Tool User Manual © 2014 Government of Alberta Page 30 of 33 Disposition Spatial Processing Tool Public User Manual 4. Click Open File. Depending on your choice of file format, the file opens in your PDF Reader or in your Browser window. 5. Do one of the following: In Adobe Reader, click the Print icon, and then click OK. Select cancel to return to the Map in DSPT PDF print file open in Adobe Reader 6. 3.16 The Context Menu The context menu opens when you right-click on the map. The options you see in the context menu may change depending on the map you are using or where on the screen you click. Context menu options The default options in the context menu include: Center Map Here: Centers the current view of the map at the point that you right-clicked. What's Here: Lists all the features at the point on the map that you clicked. Draw a Point: Draws a point where you clicked. Add Some Text: Opens a text box at the place you right-clicked so that you can type in the text you want to add. Export a Map Image: Opens the Export a Map Image dialog box for you to choose the format that you want to use when you export the map. Apr 10, 2014 Disposition Spatial Processing Tool User Manual © 2014 Government of Alberta Page 31 of 33 Disposition Spatial Processing Tool Public User Manual Open Google Street View Here: Opens the Google Street View image of the point on the map where you right-clicked. Google Street View opened at the point on the map that was clicked 3.17 About Projects Another advantage to web maps is that you can add bookmarks, measurements, shapes, or text to a map in order to mark important features or make notes. You may also have added layers to a particular map and want to use it again. In order for you to be able to keep these additions, you can save map projects and open them later, either to continue working on them or to share it by sending its URL to others. Alternatively, you can export a map and email the map. When you save a map project, these are the aspects of the map that are saved: The zoom setting, which is also referred to as the map extent. The layer settings, including which layers are on or off, including transparency settings. Any measurements or markup added to the map. Any data added to the map such as CSV files or Shapefiles that are in a layer. The layout of the Map when you saved, for example, if the toolbar was open or closed. The current layer theme if one was selected. 3.17.1 Where are Projects saved? Up until version 1.6, Projects were automatically saved to the server in a special folder named Projects and given a URL. The URL makes it possible for others to share the map by pasting the URL into their browser. From version 1.7 onwards, you can also save a project as a file and select where you want to save it on your computer or network. 3.17.2 Save and Open Projects If you have added measurements, markup, or layers to a map, you can save a map as a project, and then share it with others or continue to work on it later. You can save a project to the server or as file to your computer. When you save a project to the server, the application creates a URL that you can send to others. When they paste the URL into a browser, it opens your project and they can see your map. Once you have saved a project, you open it again by clicking Open Project (on the server) or Open Project File (on your computer). Apr 10, 2014 Disposition Spatial Processing Tool User Manual © 2014 Government of Alberta Page 32 of 33 Disposition Spatial Processing Tool Public User Manual 3.17.3 To save a project to your computer: 1. 2. 3. 4. 5. Click the arrow beside the Save Project icon in the top left corner of the toolbar. The Save As dialog box opens so that you can navigate to the folder on your computer where you want to save the file. Click Save. The Save Project dialog box opens. Save Project dialog box In the Save Project dialog, enter the following: Project Name: Type a descriptive name for the project. Created By: The name of the person who created the project. Description (optional): Any additional information to identify the project. Thumbnail: View a small image of the project that identifies the project. Click OK to save the project as a file. 3.17.4 To open a project saved to your computer: 3.17.4.1 To open a project file saved to your computer: 1. On the toolbar, click the Open Project drop-down arrow. 2. 3. Click Open Project File. A Windows navigation dialog opens so that you can locate the project file on your computer. Select the project and click Open. Apr 10, 2014 Disposition Spatial Processing Tool User Manual © 2014 Government of Alberta Page 33 of 33