1
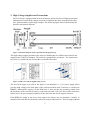
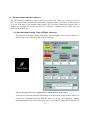
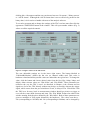
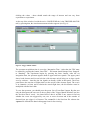
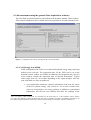
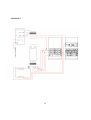
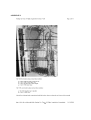
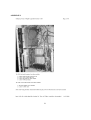
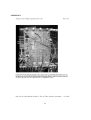
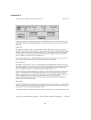
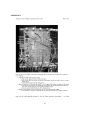
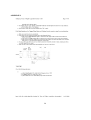
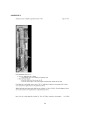
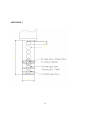
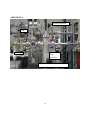
TIME OF FLIGHT
Contents
1.
Introduction............................................................................................................................. 3
2.
About the vacuum and the connection to the beamline .......................................................... 3
2.1 Venting the TOF-chamber ................................................................................................ 3
2.2 Connecting the chamber to the beamline.......................................................................... 3
2.3 Pumping down the chamber.............................................................................................. 4
2.4 Complications due to the use of a window ....................................................................... 4
2.5 Typical vacuum conditions and few warnings.................................................................. 4
3.
High Voltage Supplies and Connections ................................................................................ 5
4.
Signals and Signal Connections.............................................................................................. 6
4.1 Signals up to the Timing devices ...................................................................................... 6
4.2 Timing electronics ............................................................................................................ 7
5.
Operation................................................................................................................................. 8
5.1 Ramping up the high voltages........................................................................................... 8
5.2 Ramping down the high voltages.................................................................................... 10
5.3 The ladder and its effects on background counts............................................................ 10
6.
Measurements and the software............................................................................................ 11
6.1 Measurements using ‘Time of Flight’ software.............................................................. 11
6.2 Measurements using the general ‘Data Acquisition’ software ....................................... 14
References..................................................................................................................................... 17
APPENDICES ............................................................................................................................. 18
2
Introduction
The Wiley-McLaren type [1] of TOF is the one used at CSRF in Madison – there is an old
manual but due to many changes, it is not up-to-date anymore. The old manual is located at
the VLS-PGM beamline (red folder: CSRF Time-of-flight Manual).
The following chapters describe the vacuum, high voltages, signal connections and provide
the background information needed for operating (and trouble shooting) the instrument.
1. About the vacuum and the connection to the beamline
If the setup is not connected to the beamline, it is under vacuum (with pumps on) somewhere
adjacent to the beamline. Vacuum is required because MCPs used both in ion and electron
detectors tend to get damaged in poor vacuum and especially in atmosphere.
2.1 Venting the TOF-chamber
Make sure that all the high voltages are turned off (see Ch. 3 for details or ask beamline
scientists). Stop the turbo pump from Varian controller. The rough pump is connected to
the same circuit so it will stop automatically. Vent the chamber with nitrogen, if possible.
2.2 Connecting the chamber to the beamline
Performing gas phase experiments, like those with the TOF, the experimental station
must be isolated from the beamline by a window. At the moment, there are two
possibilities: to use a butterfly valve with exchangeable windows (Al, C, Si) or to use a
CF35 manual gate valve which can be equipped with an aluminum window. The window
size in the butterfly valve is 10mm in diameter whereas the gate valve window is
somewhat larger: 16mm in diameter.
The butterfly valve is installed to the CF35 Tee of the TOF chamber (the tee piece houses
also the cold cathode gauge) so that the cone-shaped adaptor is pointing towards the
beamline. After that, a 150 mm edge welded bellow is used to connect the chamber to the
beamline. The gate valve is also installed to the Tee and proper distance to the source
point is achieved by using 125mm nipple and 90mm bellow (see e.g. Appendix 4).
3
2.3 Pumping down the chamber
After the vacuum connection is ready and the power cable of the turbo pump controller is
plugged, the turbo pump can simply be started by pressing the START button of the
controller. If there are no leaks, the chamber should reach 10-6 Torr pressure range in
about half an hour. The base pressure after pumping 24h should be in low 10-8 Torr
range.
2.4 Complications due to the use of a window
When the window valve is closed, the volume between the last beamline valve and the
window will not be pumped at all. Therefore it is recommendable to close also the valve
upstream of the last valve (the second last vale is labelled as VVR.4-I21-02) – this can be
done by using the PGM Beamline Panel running in any of the beamline control
computers (note that the Photon Shutter PSH3 must be closed!). After the above
mentioned valve is closed, the window valve can be closed and the last beamline valve
opened. After the sample gas is introduced (be sure that none of the high voltages are on
in this stage!) into the chamber and the pressure is stabilized, also the second last valve
can be opened. This valve should always be closed before changing anything in the gas
line or gas flow during the experiments!
2.5 Typical vacuum conditions and few warnings
The cold cathode gauge of the TOF chamber must be connected to one of the beamline’s
readout units (the same applies to the thermocouple gauge). In the controller/readout unit,
the upper threshold for allowing to open the beamline valve is set to 3⋅10-6 Torr.
Typically the sample gas pressure is between 5⋅10-7-1⋅10-6 Torr and due to the window
the pressure in the differential pumping section is in the 10-10 Torr range – if that pressure
is found to be proportional to the TOF chamber pressure, the window is damaged and
must be replaced.
NB!
•
The detectors need good vacuum to operate without damage; do not turn
on the high voltages for the detectors if the pressure in the chamber is
higher than 5×10⁻⁶Torr!
•
Be sure that the second last valve of the beamline (the one which can be
controlled from PGM Beamline Panel, VVR.4-I21-02) is CLOSED before
doing any changes to the gas inlet system!
4
2. High Voltage Supplies and Connections
The TOF setup is equipped with an electron detector and an ion time-of-flight spectrometer.
Both detectors require high voltage to operate, in addition, the other components like drift
tube, grids and lenses require high voltages. The following figure shows schematically the
detectors and related elements:
Figure 1. Schematic diagram of the experimental TOF apparatus [2].
The high voltage supplies needed for the setup are installed into two NIM crates located in the
support frame of the TOF chamber. The crates are equipped like seen below – the actual crates
are, however, installed in top of each other, not beside each other:
Figure 2. NIM crates and the supplies (blue arrows)
The unit in the upper crate (left in the figure) is an adjustable 0…5 kV power supply which
provides high voltage to the back plate of the ion detector MCP stack. Therefore it is marked as
BBMCP. Although this supply is in the NIM crate, it does not take the operating voltage from
the backbone of the crate but it must be connected to normal 110V jack. Rest of the electronics
in this crate is for processing the signals from the detectors and can be neglected for now.
Each BERTAN supply in the lower crate (right in the figure) has two channels, A and B, as
marked in the front and also in the back where the output connectors are. The first supply (Bertan
5
362, 0…2kV) provides voltages for the electron and ion side meshes right beside the source
region – they are called First Electron Mesh (FEM; channel A) and First Ion Mesh (FIM; channel
B), respectively. The second supply (Bertan 365, 0…5kV) is connected to the Drift Tube (DT;
channel A) of the TOF spectrometer and to the grid before the MCP detector (MCPG, channel
B). The third supply (Bertan 362/5, 0…2kV and 0…5kV) provides high voltages to the grids
before the electron detector (G2, G3; channel A) and to the front plate of the ion MCP detector
(FFMCP; channel B). The last supply gives the high voltage needed for the (de)focusing lens
(LENS).
There is no supply for the electron side MCP in the NIM crate. The high voltage is taken from
one of the HV-outputs of the beamline’s HV supply. It can be controlled from the PGM Control
Panel window running in the beamline control computer.
The HV cables are usually left connected (except for the electron side high voltage, which is
disconnected from the beamline’s supply when moving the chamber) but they also marked with
white labels – that should be enough to make the connections as shown in Appendix 1.
3. Signals and Signal Connections
4.1 Signals up to the Timing devices
The big ‘LeCroy’ ion PAD (preamplifier discriminator) unit, which includes also the HV
divider chain for the ion detector, is used to amplify and shape both the electron signal
and the ion signal. The box is powered from the 9 pin D-plug that locates in the NIM
crate (use the panel with only one plug!). Ion signal is internally decoupled from the
anode and only the output is provided (marked as ‘ion out’: there are two equal BNC
outputs). Electron signal (‘Signal’ connector from the electron side HV divider box) must
be fed into LeCroy box (e-in) and taken out (e-out) for further processing. Both of these
outputs provide fast negative pulses (rise time < 5ns). The signals from the outputs are
shown below:
Figure 3. Signals from e-out (left) and I-out (right) connections in LeCroy box. Horizontal
division is 10ns whereas the vertical one is 100mV.
6
The preamplified signals are then fed into a constant fraction discriminator (CFD;
Tennelec TC454) found in the upper NIM crate. This CFD unit has four independent
‘channels’, which all have three (identical) outputs. The uppermost CFD is usually
reserved for electron signal and the second one for ion signal. One of the outputs (the
outputs are NIM level pulses: about 50ns wide and -1.2V deep) in both of them must be
connected to the timing electronics which locate in the half sized rack beside the TOF
setup. It is quite convenient to connect one of the outputs in both channels to the
oscilloscope – by that one can read the frequencies of the pulses and also see that the
pulses look fine. There are also two ratemeters in the NIM crate but they require TTL
level input signal. Therefore the third outputs must be connected to a pulse level adapter
that reads in NIM pulses and gives out TTL pulses (LeCroy 688AL). The output can be
connected to the ratemeter ‘POS IN’ in the front panel of the unit. The ratemeter signals
are useful for finding out the frequency of the electron and ion signals if there is no
oscilloscope. In addition, the output of the ratemeter (at the back) can be connected into
one of the Keithley Picoammeters of the beamline – this must be done through a 1kΩ
resistor. These Keithleys can be read using the Data Acquisition software of the
beamline.
4.2 Timing electronics
The timing electronics is described in CLS-wiki pages [3] and that material is also
attached to this manual as Appendix 2. All the timing electronics is in the half sized rack
beside the TOF setup. Shortly, the measurement of the ion time-of-flight is based on
effectively using the electron signal as a start, or time zero, and measuring the ion arrival
time relative to that – all this is performed by CAEN V1290N time to digital converter
(TDC) which is installed to the VME crate in the half rack (there are two crates: NIM
crate at the top and VME rack below).
In this case, however, it is not adequate to use only the TDC with electron as a start and
ion as a stop. First of all, the TDC board trigger input works only in 25ns resolution,
which would limit the TOF resolution (typically some 1ns resolution is required from the
electronics). Secondly, the frequency from the electron signal is higher than that of the
ion signal. That means that even if the TDC was triggered, there would be no ion to
measure. To overcome these limitations, additional components are required.
The electron and ion signals are first fed into a Fan-in Fan-out unit (CAEN N454, NIM
crate) – it is simply used to multiply the signal so that it can be used in all the required
devices. The uppermost quarter is reserved for electrons and the second quarter to ion
signals. One of the electron outputs is connected directly to the TDC unit (channel 12)
and also one of the ion outputs is connected there (channel 0). To resolve the limitations
mentioned above, the electron signal must be first of all delayed and then led to pre7
coincidence circuit; to match with this delay, the ion signal must be stretched also before
feeding it to the pre-coincidence circuit. The pre-coincidence circuit (CAEN N485) gives
an output only if there is an ion and an electron within a defined time window. This
output is used to trigger the TDC. By this, the TDC is working only if it really has
something to measure – this saves some time and prevents the case where we would be
limited by the time spent in measuring the gratuitous events.
In practise all this is achieved by taking one of the electron outputs and connecting it into
the START of the lower delay circuit in CAEN N938 Dual Timer unit (NIM crate). The
delayed output is taken from END MARKER connection and led into the uppermost IN
of the CAEN N485 Three Fold Logic Unit. One of the ion outputs is led into the START
of the upper delay circuit in CAEN N938 Dual Timer unit. The stretched signal is taken
out from the corresponding OUT jack and connected into the second uppermost IN of the
CAEN N485. The output (OUT) of this logic unit is connected into the TRIGGER jack of
CAEN V1290N TDC (note that the other trigger input must be terminated with a 50Ω
resistor).
The required delay and stretch values vary from experiment to experiment but the present
values are following: Delay for electron signal is 9.8µs (corresponding potentiometer
reading is 6.94) and the ion signal is stretched by 9.88µs (corresponding potentiometer
reading is 7.06).
4. Operation
The high voltages used in the TOF are high enough to damage the equipment if not turned on in
proper order. In most elements, the only risk is sparking and subsequent shower of electrons to
the detectors but the MCPs can suffer serious damage if the voltage over pair of them exceeds
2.4 kV. The procedure below describes how to ramp up the voltages safely. NB! Do not change
anything in the gas inlet system if the high voltages are on or beamline open– the mistake in
the opening/closing direction of the valve may damage your detectors (they should never be
on if pressure is higher than 5×10⁻⁶Torr) and compromise the UHV environment of the
beamline!!
5.1 Ramping up the high voltages
The voltages below are not the only possible ones but are just chosen as an example. In
general, the voltages of various elements can be calculated relative to the desired field in
the interaction region, practically relative to FIM (or FEM) as shown on the right hand
side of the chosen voltages. The final adjustment of the voltages should be made by
optimizing the signal (intensity, line shape and width of atomic peak).
8
UFFMCP
UBBMCP
UMCPG
UDT
ULENS
UFIM
UFEM
UG2,G3
Ue-side MCP
-3360V
-1260V
-3230V
-3360V
-1760V
-400V
+400V
-100V
+2540V
8.4×FIM (=DT)
8.4×FIM +2100 (=DT+2100)
8.4×FIM+130 (=DT+130)
8.4×FIM
4.4×FIM
FIM
-FIM
-100
+2540
Power up both NIM bins (upper one is needed to power the LeCroy preamp box) to begin
ramping up the voltages. Turn on the scope. It is much recommended to use a multimeter
to read the analog outputs from the power supplies (only Bertan 362, 365 and 362/365
supplies has such outputs in the front): connect the grounding probe (black) of the
multimeter to the GND plug of the lower NIM crate and the signal probe (red) of the
multimeter to the analog reference output of the HV supply; the output is located in the
middle of the front panel of the supply. Left most output (black) is for channel A and
rightmost one (yellow) is for channel B. The analog output’s 1mV corresponds to a Volt
of the HV output (i.e. if multimeter shows 1.260V the actual HV is 1260V).
Start by ramping up the voltages of the ion detector. If the chamber has been vented
recently, increase the voltage in step 5 with care (small steps and wait after the increase;
typically wait one minute after an increase of 100V). The procedure is following:
1. Power on FFMCP supply, Power on BBMCP supply
2. Ramp up FFMCP to -600V slowly1 and after that BBMCP up to -500V (the latter is
achieved by rotating the rough adjustment knob one step)
3. Increase FFMCP to -1200V1 and after that BBMCP up to -1000V (use the rough
adjustment knob again)
4. Increase FFMCP to -1600V1 and BBMCP to -1260V (to achieve this, leave the rough
adjustment knob to 1000V setting and use the fine adjustment knob to get reading 260
to the potentiometer)
5. Increase FFMCP to full -3360V slowly1, you should see some signals in the scope
already at around -3000V
1
If the ramp is done for the first time after the chamber was vented, ramp-up speed should be low, about 5V/sec
9
Although the detectors are designed to stand high voltage differences, the rest of the
elements are not – therefore it is better to raise voltages in stages to avoid very large
voltage differences between adjacent elements. For example instead of ramping up the
MCPG directly to -3200V, ramp it up to -1000V and then ramp up the DT also to -1000V
and then continue with MCPG and DT until desired voltages are achieved.
6. MCPG up to -3200V
7. Drift tube (DT) up to -3360V
8. Lens up to -1760V
9. FIM up to -400V
10. FIM up to 400V
11. G2, G3 up to -100V
Finally turn on the HV for electron detector from PGM control (2540V). The control
window shows the actual value of the high voltage provided – it takes some time to ramp
up to the operation voltage – again, use scope to see that everything is fine (i.e. no huge
signals of high frequency noise).
Ion TOFs have typically very good transmission (so does the electron detector because it
sees the sample point directly); therefore it is better to have quite small slits in the
beamline before letting light into the interaction region when the HVs are on. Start with
10/10µm entrance/exit slit and open/close those if needed – with typical working
pressure, this setting should provide signal rates of about 1 kHz even at low energies.
Avoid very high signal rates as they reduce the lifetime of the MCP plates.
5.2 Ramping down the high voltages
When the experiments are done or there is other need to ramp down the voltages (for
example change the sample gas or decrease/increase the pressure), do it in the opposite
order to one shown above.
5.3 The ladder and its effects on background counts
The gas is introduced to the interaction region but it extends quickly to the whole
chamber. Therefore ions are produces in the chamber at a distance of almost 1m. The
ions created can see the extractor and repeller meshes and both electrons and ions are
accelerated towards the interaction region. By introducing an aperture (see Appendix 3)
the distance where ion are produced and see the interaction region is reduced.
10
6. Measurements and the software
The TDC board is connected to epics system used at the CLS. There are two ways to use the
TDC: to record a TOF spectrum (this can be done using the software developed for this purpose)
or to use TOF data as just another input channel for User Data Acquisition software (this is
suitable, for example, for measuring TOFs as a function of photon energy). Both ways are
described in detail below.
6.1 Measurements using ‘Time of Flight’ software
The software is started by double clicking the ‘Time of Flight’ icon (see Fig. 4 below) in
the desktop of any of the beam line control computers.
Figure 4. Desktop icon for Time of Flight software and the following main window.
At this point, the most important information is in the bottom of the window where one
chooses the destination directory and the name for saving the experiment. Another
important button is the one in the upper part of the window stating ASCII Stream. By
11
clicking this, a list appears and the user can choose between ‘No stream’, ‘Binary stream’
or ‘ASCII stream’. Although the ASCII format data is not as effectively packed as the
binary data, it is far easier to handle with most of the analysis software.
To record a spectrum and to change the settings of the TDC card one must first click the
uppermost CONFIGURE button in the window. This will open another window (Fig. 5)
where are all the required controls.
Figure 5. Configure window of the TDC board.
The user adjustable settings are in the lower right corner. The button labelled as
‘UnPairedResolution” defines the bin size (or channel width) used. This value is
hardware related and all the possible values are indeed the ones given here. To change the
value, click the button and choose desired value from the list (25ps, 100ps, 200ps, and
800ps). Other relevant values are ‘Win Offset’ and ‘Win Width’. These parameters are
related to the way the TDC is used. As described in Chapter 4, the electron and ion
signals are fed to the TDC directly without any delays or stretches whereas the trigger
signal, which comes from the pre-coincidence circuit, is delayed. The ‘Win Offset’ tells
the TDC how far away back its measurement window should go relative to trigger to
cover all the events (both electrons and ions). The ‘Win Width’ defines the width of the
window starting from the place defined by the ‘Win Offset’. Both of these parameters are
given as multiples of 25ns (again, dictated by the hardware). The values seen above, 410 (corresponding to 10250ns) and 360 (corresponding to 9000ns) can be changed by
12
clicking the values – those should match the range of interest and can vary from
experiment to experiment.
At the top of the window, beside the active CONFIGURE tab, is the TRIGGER MATCH
tab, by pressing that, the actual measurement window appears (see Fig. 6):
Figure 6. Trigger Match window.
The spectrum acquisition time is set as the ‘Integration Time’. After that, the TDC must
be started by pressing the button ‘Start TDC’ – the button should change from ‘Stopped’
to ‘Running’. The experiment begins by pressing the Start –button. After the set
integration time, the spectrum appears both to upper and lower panels. The upper panel
shows both electron and ion arrival time with electron arrival being set as time equals
zero by software – therefore the ion signals are hardly visible in that panel. The lower
panel shows the ion time of flight relative to the arrival of the electron signal. The x-axis
is in channels (or bins) and to obtain the actual flight time, the bin number must be
multiplied with the bin width.
To save the spectrum, you should press the green ‘Save Event Data’ button. By that, not
only the histogram (the one seen in lower panel of the Trigger Match Window) but also
the list-form data is saved – the latter kind of data is needed if one wants to find out
whether the event was triggered by one, two or more electrons and if the number of
detected ions per trigger is of interest. The .event file is the list-form file whereas the
.spectra file includes the data in histogram form for fast viewing.
13
6.2 Measurements using the general ‘Data Acquisition’ software
The User Data Acquisition software is described in the beamline manual. There are three
TOF related configuration files available and each experiment is described shortly below:
Figure 7. Configuration file choices including the three TOF related files.
6.2.1. ToF_Energy_Scan_USERS
In this configuration, the TOFs are recorded at the photon energy range (and step)
defined in the scan tab. The acquisition time for the TOFs can be set in the
beamline control window (see PGM User Manual): the integration time (‘dwell’)
in the window controls the acquisition time of selected instruments2. Typical
values range from 10…60 seconds depending on the signal strength. After the
scan is finished, two files are produced:
•
spectrum.dat files contain the ‘normal’ information of the scan: the values
of the PVs, photon energy, ring current etc. are saved in column form,
each row corresponds to one energy position. In addition to conventional
information, this file has extra columns that show the readings of the
2
Users can choose which instruments are controlled by the dwell time set in the beamline control window
(tmax=300s). The default is scaler & Keithleys but also TOF (V1290TDC) and XEOL (USB4000 spectrometer) can
be included using the Beamline Dwell Time –shortcut at the desktop (use Configure –button to add devices).
14
scalers. They are used to record the number of electrons and ions directly
(well, in theory, the practise is not so straight forward…see below) from
the detectors and they provide the total electron and total ion spectra in
addition to those obtained with Keithley Picoammeters.
•
spectrum_spectra.dat files contain the TOFs recorded at each photon
energy of the scan. The format is simple: every row corresponds to a TOF
spectrum i.e. the rows are of the type:
bin1_of_TOF1, bin2_of_TOF1,…, last_bin_of_TOF1…and same for e-TOF
bin1_of_TOF2, bin2_of_TOF2,…, last_bin_of_TOF2…and same for e-TOF
…
These files are quite big but the format is clear and easy to read in. Usually
the electron part is omitted completely i.e. only first half in each row is
read in. At the moment, it is not possible to study electron-ion-ion
correlation as function of the photon energy because individual list files
are not saved in this mode.
The scalers…as told before, the ratemeters representing the electron and ion
signals are connected to Keithley Picoammeters through 1kΩ resistor. The output
of the Keithleys is connected to the beamline data acquisition electronics and
therefore we can have information about the signal levels both in electron and ion
channels. There are, however, some complications related to this setup: The
ratemeter must be in proper scale to give reasonable output. Secondly, the
ratemeter is a bit slow in reacting to the changes; therefore it might generate
artefacts in fast scans. To overcome these difficulties, the electron and ion signals
are connected to the scaler unit located in one of the full size racks of the
beamline. The signals can be taken from the FAN-IN-FAN-OUT unit in the
timing half rack. The electron and ion signals are taken from one of the available
outputs to the input of the NIM-TTL-NIM level adapter situated in the same NIM
crate. The TTL level signal is connected to a LEMO Tee piece with a 50Ω
terminator in one end. The remaining connector of the Tee is then connected to
the input of the scaler. Currently, the electrons are connected in channel 1 and
ions (with similar Tee piece) to channel 4. Similarly to the TDC card, the data
acquisition time for the scalers must be set separately to, e.g., 5 seconds (double
clicking the ‘scalers’ icon in the desktop).
15
6.2.2. Energy_Scan_ToF_asGasCell
When the TOF is installed into the beamline, it can be used e.g. for resolution
tests by putting for example Argon in and studying its absorption structures by
recording the total electron and ion yields through Keithleys. This is quite useful
mode but one should pay attention to the settings of the ratemeters. This mode
requires only that the ratemeters are connected to the Keithleys through 1kΩ
resistor boxes.
6.2.3. Energy_Scan_ToF_asGasCell with scaler
This is an extended version of the previous configuration; this requires that the
scalers are connected as described above; this is probably the most suitable
configuration if TOF is to be used to define the resolution of the beamline. Note
that the dwell time for the scalers is limited internally to 215 seconds – after that
time, the scaler simply stops and direct comparison between the TDC counts and
the scaler counts is not possible anymore. The dwell time for the Keithley signal
is also limited (by the software) to 20s. The latter instrument is measuring just
current, which means that only the statistical error is affected by shorter-thanintended dwell times whereas the scaler signals (actual counts) might look strange
in comparison to other values.
The Beamline Control Panel’s dwell time setting is limited to 20s by default. This
can be changed to 200s by giving following command in the terminal window:
setLongDwells.sh "long"
To change back to default, one can give a command:
setLongDwells.sh
16
References
[1] W.C. Wiley and I.H. McLaren, Rev. Sci. Instr. 26, 1150 (1955).
[2] A.C.O. Guerra, J.B. Maciel, C.C. Turci, R.C. Bilodeau, and A.P. Hitchcock, Can. J.
Chem. 82, 1052 (2004).
[3] http://wiki.clsi.ca/index.php/Setting_Up_Time_of_Flight_Acquisition_System
17
APPENDIX 1
18
APPENDIX 2
19
APPENDIX 2
20
APPENDIX 2
21
APPENDIX 2
22
APPENDIX 2
23
APPENDIX 2
24
APPENDIX 2
25
APPENDIX 2
26
APPENDIX 2
27
APPENDIX 2
28
APPENDIX 2
29
APPENDIX 2
30
APPENDIX 3
31
APPENDIX 4
Ladder translation
TOF
e-detector
Gatevalve
with
Al window
Last valve of the VLS-PGM beamline
32