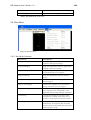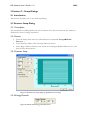
1
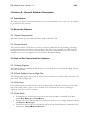
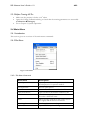
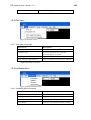
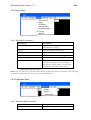
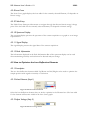
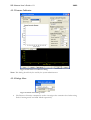
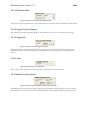
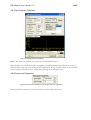
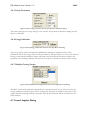
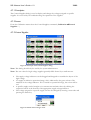
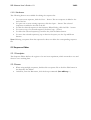
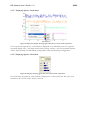
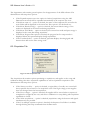
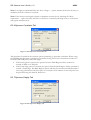
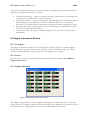
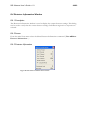
SES Software User's Guide v 1.9
1/62
SES Software User's Guide
1 Overview
1.1 Introduction
The SES software is a Windows-based application that manages most of the user interaction with
the SCIENTA spectrometer. The SES software controls the analyser, and provides a plug-in
interface for auxiliary equipment. This guide describes how to use the SES software, version
1.2.6.
1.2 Table of Contents
SES Software User's Guide.........................................................................................................................1
1 Overview................................................................................................................................................1
1.1 Introduction...................................................................................................................................1
1.2 Table of Contents .........................................................................................................................1
2 Section A – General Software Description ......................................................................................3
2.1 Introduction...................................................................................................................................3
2.2 About the Software.......................................................................................................................3
2.3 How to Get Started with the Software ......................................................................................3
2.4 Main Menu.....................................................................................................................................4
3 Section C – Setup Dialogs.................................................................................................................10
3.1 Introduction.................................................................................................................................10
3.2 Detector Setup Dialog................................................................................................................10
3.3 Global and Local Detector Settings .........................................................................................13
3.4 Signal Setup Dialog.....................................................................................................................13
3.5 File Options Dialog ....................................................................................................................14
3.6 User Interfaces Dialog ...............................................................................................................16
3.7 Excitation Energies Dialog........................................................................................................17
4 Section D – Calibration Dialogs.......................................................................................................20
4.1 Introduction.................................................................................................................................20
4.2 Voltage Calibration Dialog ........................................................................................................20
4.3 How to Optimize the Lens Deflection Elements..................................................................25
4.4 How to Edit Lens Tables...........................................................................................................26
4.5 Detector Calibration Dialog ......................................................................................................27
4.6 Control Supplies Dialog.............................................................................................................30
5 Section E – Run Dialogs ...................................................................................................................35
5.1 Introduction.................................................................................................................................35
5.2 Sequence List Editor ..................................................................................................................35
5.3 Sequence Editor ..........................................................................................................................36
5.4 Region Editor ..............................................................................................................................39
5.5 Run Modes...................................................................................................................................42
6 Section F – Operations during Acquisition ....................................................................................44
6.1 Introduction.................................................................................................................................44
6.2 Operating the Spectrum Display ..............................................................................................44
6.3 The Sequence Tree .....................................................................................................................50
6.4 The Status Bar .............................................................................................................................51
7 Section G – Installations Dialogs.....................................................................................................52
SES Software User's Guide v 1.9
2/62
7.1 Introduction.................................................................................................................................52
7.2 Instrument Installation Dialog..................................................................................................52
7.3 Supply Installation Dialog..........................................................................................................53
7.4 Element Installation Dialog.......................................................................................................54
7.5 Lens Mode Installation Dialog..................................................................................................56
8 Section H – SES Options and Information Dialogs.....................................................................58
8.1 Introduction.................................................................................................................................58
8.2 SES Options Dialog ...................................................................................................................58
8.3 Supply Information Window ....................................................................................................61
8.4 Detector Information Window.................................................................................................62
SES Software User's Guide v 1.9
3/62
2 Section A – General Software Description
2.1 Introduction
This section describes the system requirements, the recommended access control set-up and how
to get started in the software.
2.2 About the Software
2.2.1 System Requirements
The SES software operates under Windows 2000 or Windows XP.
2.2.2 Access Control
The software enables a strict access control to sensitive calibration data by enabling a Privilege
Level mechanism for individual voltage elements. The three levels available are: Administrator,
Privileged User and User. The level is determined from the current Windows account, and the
element access level is configured from the Element Installation dialog.
2.3 How to Get Started with the Software
2.3.1 Starting Program
The SES program is started by double-clicking on its icon. A click sound from the High Voltage
should be noticeable.
2.3.2 Check Cables for Low or High Pass
The SES program begins with a pop-up window that reminds you to check cable connections for
either Low Pass or High Pass.
2.3.3 Prior Runs
If the SES program has inadvertently shut down during prior acquisition and there is still usable
data in the work folder, a query to save the data to an experiment file before continuing is
displayed. Click Yes or No to continue.
2.3.4 Start Guide
•
•
•
Experiments are defined and started from the Setup and Run commands in the Run
menu (Run Setup and Run Run)
Energy calibration and lens deflection calibration is done in the Voltage Calibration dialog
(Calibration Voltages).
Global detector settings are defined through the Setup Global Detector command in the
Setup menu (Setup Global Detector).
SES Software User's Guide v 1.9
4/62
2.3.5 Before Turning HV On
•
•
•
Make sure the pressure is below 1⋅10-5 mbar.
Open the Voltage Calibration dialog to check that the running parameters are reasonable
(Calibration Voltages).
Go to Chapter 3, System Operation.
2.4 Main Menu
2.4.1 Introduction
This section gives an overview of the main menu commands.
2.4.2 File Menu
Figure 1. File Menu
2.4.2.1 File Menu Commands
Menu Item
Description
Open Spectrum...
Open a previously saved spectrum, which is
then displayed in a separate window.
Save an open spectra
Create a new instrument calibration file
Open a different instrument calibration file
Save the currently open instrument calibration
file under a different name
Abort ongoing acquisition and send a reset to
the supply and the detector hardware
Set all supplies to zero voltage
Open the SES Options dialog
Save Spectrum...
New Instrument
Open Instrument...
Save Instrument As...
Reset
Zero Supplies
Options...
SES Software User's Guide v 1.9
Exit
5/62
Close the SES program
Table 1. The File menu items.
2.4.3 View Menu
Figure 2. The View menu.
2.4.3.1 View Menu Commands
Menu Item
Description
Error List
Sequence Tree
Show the error listing
Show the sequence tree when the
spectrum display is shown
Open the Supply Information winow
Open the Detector Information window
Show Supply Information...
Show Detector Information...
Table 2. The View menu items.
2.4.4 Installation Menu
Figure 3. The Installation menu
2.4.4.1 Installation Menu Commands
Menu Item
Instrument...
Supplies...
Description
Open the Instrument Installation dialog
Open the Installation dialog
Elements...
Lens Modes...
Open the Element Installation dialog
Open the Lens Mode Installation dialog
Table 3. The Installation menu items.
SES Software User's Guide v 1.9
6/62
2.4.5 Setup Menu
Figure 4. The Setup menu.
2.4.5.1 Setup Menu Commands
Menu Item
Description
Global Detector...
Open the Detector Setup dialog for
global detector settings.
Open the Signals Setup dialog.
Signals...
File Options...
User Interfaces...
Excitation Energies...
Low Pass, High Pass
Open the File Options dialog.
Open the User Interfaces dialog.
Open the Excitation Energies dialog.
Select a set of elements depending on
instrument for high or low pass ranges.
This group of menu items is customized
from the Element Installation dialog.
Table 4. The Setup menu items.
Note: The user only has to use the Global Detector and File Options commands. The remaining
commands should only be used by the system administrator.
2.4.6 Calibration Menu
Figure 5. The Calibration menu.
2.4.6.1 Calibration Menu Commands
Menu Item
Description
Voltages...
Open the Voltage Calibration dialog.
SES Software User's Guide v 1.9
7/62
Detector...
Open the Detector Calibration dialog.
Control Supplies...
Open the Control Supplies dialog.
Table 5. The Calibration menu items.
2.4.7 Run Menu
Figure 6. The Run menu.
2.4.7.1 Run Menu Commands
Menu Item
Run
Description
Starts an acquisition with the current
sequence and region settings.
Stop after Region
Stops the acquisition after the region has
finished each of its sweeps.
Stops the acquisition after the sequence
has finished each of its regions.
Stops the acquisition after the current
sweep.
Stop after Sequence
Stop after Sweep
Number of Sweeps...
Jump to next Region
Jump to next Sequence
Cancel Stop
Force Stop
Control the number of sweeps for the
current region.
Finishes the acquisition of the current
sweep, and starts the next region.
Finishes the current region, and starts the
next sequence. This command is only
applicable when using multiple sequences
Cancels the current stop request. This
command is available only after one of
the above stop requests has been issued.
Forces the current acquisition to stop
immediately. Incomplete data from the
current sweep is discarded, but data from
earlier sweeps is kept.
SES Software User's Guide v 1.9
Setup...
8/62
When using multiple sequences, opens
the Sequence List Editor for acquisition
setup. Otherwise, opens the Sequence
Editor.
Table 6. The Run menu items.
Note: If the Autosave option is checked in the File Options dialog, all stop commands will save
acquired data.
Note: If the Zero voltages option is checked in the Acquisition tab of the SES Options dialog,
Force Stop works effectively as an emergency button, resetting all supplies to zero. This is
important when working with experiments which might damage the detector.
2.4.7.2 Controlling the Number of Sweeps
Figure 7. The Number of Sweeps dialog.
It is possible to adjust the number of sweeps of the current region during acquisition. To do this,
select Run/Number of Sweeps... which opens the Number of Sweeps dialog that allows the total
number of sweeps to be changed for the region being acquired, and for subsequent regions.
2.4.8 Help Menu
Figure 8. The Help menu.
2.4.8.1 Help Menu Commands
Menu Item
Description
SES Software User's Guide v 1.9
About SES...
Table 7. The Help menu items.
9/62
Opens the About SES information
window.
SES Software User's Guide v 1.9
10/62
3 Section C – Setup Dialogs
3.1 Introduction
This section describes how to use the Setup dialogs.
3.2 Detector Setup Dialog
3.2.1 Description
The Setup Detector dialog defines the active window of the detector and how this window is
divided into slices for image acquisition.
3.2.2 Access
•
•
•
From the Setup menu select the Global Detector command. (Setup Global
Detector…)
In the Sequence Editor, click the Setup Detector button.
In the Region Editor’s Detector tab, check the Use Region Defined Detector box, and
then click the Setup button.
3.2.3 Detector Setup
Figure 9. The Detector Setup dialog for global detector settings
3.2.4 Energy Channels
Figure 10. Detail of the Energy Channels frame
SES Software User's Guide v 1.9
11/62
Energy Channels define the channel range in the energy direction of the detector.
Reducing the energy range to the central part of the detector mainly improves angular resolution.
Note: The channels can be changed either by the spin edit boxes, or by the range markers in the
detector window.
3.2.5 Y Channels
Figure 11. Detail of the Y Channels frame.
Y Channels define the channel range in the angular or spatial direction of the detector.
When only one slice is used, there are no restrictions on how to select the range of Y Channels.
Note: The channels can be changed either by the spin edit boxes, or by the range markers in the
detector window.
3.2.6 Slices
Figure 12. Detail of the Slices frame.
Slices define the number of partitions of equal height into which Y Channels should be divided.
Unless the detector system has only Energy Channels, the Y Channels can be divided into a
number of Slices. When only one slice is used, data is summed over all Y Channels and presented
as a one dimensional spectrum in the energy dispersion direction. When more than one slice is
used, data is instead presented either as:
•
•
•
a one dimensional spectrum summed over all Y Channels as above,
several one dimensional spectra for each slice respectively, or
an image representation of the two dimensional spectrum.
Note: When choosing a value for Slices other than one, there are enforced restrictions on the
range of Y Channels. The number of Y Channels must be an even multiple of the slices, and this
is handled automatically by the Detector Setup dialog. The spin edits and the range markers for Y
Channels behave differently in this context.
3.2.7 Detector Modes
Detector Mode defines whether the detector system should use Pulse Counting or ADC mode.
The detector systems based on the VG Scienta 7059 processor cards and newer detector systems
based on FireWire cameras have two detector modes; ADC and Pulse Counting mode. Older
detector systems may have either Pulse Counting mode, or no modes.
SES Software User's Guide v 1.9
12/62
3.2.8 ADC Mode
Figure 13. Detail of the Detector Mode frame for ADC mode.
In ADC mode, which is the most commonly used mode, each camera pixel is counted as an
event and added to the total intensity during a measurement. Noise reduction is performed
before making the accumulation. Since one event often occupies more than one pixel, the
Multiple Counting Factor is of importance.
Note: For FireWire cameras, the ADC Mask value is not used.
3.2.9 Pulse Counting Mode
Figure 14. Detail of the Detector Mode frame for Pulse Counting mode.
Pulse Counting is only useful for very low intensities. The idea behind it is to replace an event
containing several pixels distributed in a spot-like shape with a single pixel with intensity one.
One such spot is considered to represent one electron hitting the MCP. If two such events occur
close enough to make their two areas merge into one spot, the pulse counting algorithm will not
be able to distinguish between them, and report only one pulse. It is therefore only viable when
you are fairly certain that no events ever merge in the image, i.e. only when doing low intensity
measurements.
Note: For FireWire cameras, the Discriminator Level value is not used.
3.2.10 Show Detector Image
Figure 15. Detail of the Detector Image frame.
Checking Show Detector Image displays a real time image of the detector. Controls for selecting
acquisition parameters then become visible.
SES Software User's Guide v 1.9
13/62
The acquisition parameters used for displaying the detector image are similar to those in Voltage
Calibration. The full range of Energy Channels are used, and as many of the Y Channels as the
choice of Slices allows, starting from one. Selecting Show Countrate will open a window
monitoring the current countrate.
Note: The Slices parameter in the Detector Image frame pertains to the acquisition of the
detector image in this window only, and is not related to the parameter in the Slices frame.
3.2.11 Detector Range Markers
The detector area used for acquisitions can be defined by dragging the range markers in the
detector window.
3.3 Global and Local Detector Settings
3.3.1 Global Detector Settings
The detector settings are referred to as global when accessed from
•
•
the setup Global Detector command in the Setup menu, or
th setup command in the Run menu and then in the Sequence Editor clicking the Setup
Detector button.
Global detector settings are used for all spectrum acquisitions that do not have individual or local
detector settings. In addition, they are also used as a base for all dialogs in which data acquisition
occurs.
Note: If the user does not have write permission to the RunVar.dat file, he will not be able to
save changes made to the global detector settings.
3.3.2 Local Detector Settings
The detector settings are referred to as local when accessed from the Region Editor by checking
the Use Region Defined Detector box and then clicking the corresponding Setup button.
3.4 Signal Setup Dialog
3.4.1 Description
The Setup Detector dialog defines the active window of the detector and how this window is
divided into slices for image acquisition.
3.4.2 Access
From the Setup menu select the Signals command. (Setup Signals…)
SES Software User's Guide v 1.9
14/62
3.4.3 Signal Setup
Figure 16. The Signal Setup dialog.
3.4.4 Input Signals
The Input Signals frame lists the input channels defined in the I/O interface library.
Input signals can be disabled individually by clicking the check boxes next to the corresponding
signal name.
3.4.5 Output Signals
The Output Signals frame lists the input channels defined in the I/O interface library.
Output signals can be disabled individually by clicking the check boxes next to the corresponding
signal name.
3.5 File Options Dialog
3.5.1 Description
The File Options dialog is used for specifying available experiment file libraries and for defining
parameters such as experiment file-type, save directory and file naming method.
SES Software User's Guide v 1.9
15/62
3.5.2 Access
•
•
From the Setup menu select the File Options command.
(Setup File Options…)
In the Sequence Editor click the File Options button.
Note: When using multiple sequences and accessing the File Options dialog from the Setup
menu, the file options for the first sequence in the list are displayed.
3.5.3 File Options
Figure 17. The File Options dialog.
3.5.4 Interface Libraries
The File Interface Libraries box lists available experiment file libraries and their respective
formats. Experiment file libraries can be added and deleted with the Add and Delete buttons
respectively.
3.5.5 File Type
The File Type box defines the file type used for saving experiment files. By default, three file
types are available:
• Igor Packed Experiment Files (.pxt)
• Igor Binary Wave (.ibw)
• text file format (.txt)
SES Software User's Guide v 1.9
16/62
3.5.6 Save Directory
The Save Directory box defines the base directory and where to save experiment files.
•
•
If the Sort by Sample or Sort by User box is checked, experiment files will be saved in
subdirectories to the base directory based on the information in the Sample and User
boxes in the Sequence Editor.
If the Autosave box is checked, experiment data will be saved after each time that the
sequence has completed an execution. Experiment data will then also be saved when the
sequence is stopped by the user.
3.5.7 File Naming Method
File Naming Method defines whether experiment file names should be constructed from the date
and time of the acquisition, or from an incremental number. The file names generated from date
and time have the format base-mmddhhnn.ext while the file names generated from an
incremental number have the format base-xxx.ext.
3.5.8 Spectrum Naming Format
The Spectrum Naming Format box defines how the spectra are named in the experiment files.
There are three format parameters:
•
•
•
%R represents the region name
%F represents the experiment file name
%N represents the incremental number or date and time of the experiment file name
Example: ‘%R_%N’ would name the spectrum ‘Region1_001’ for a region with name ‘Region1’
and incremental number ‘001’.
3.6 User Interfaces Dialog
3.6.1 Description
The User Interfaces dialog is used to load and unload plugins or user interface libraries for
auxiliary equipment, such as sample manipulator, monochromator, flood gun and ion gun.
Loaded plugins are listed in the Loaded User Interfaces frame.
3.6.2 Access
From the Setup menu select the User Interfaces command. (Setup User Interfaces…)
SES Software User's Guide v 1.9
17/62
3.6.3 User Interfaces
Figure 18. The User Interfaces dialog
Note: This dialog should only be used by the system administrator.
3.6.4 Add, Delete and Setup Buttons
•
•
•
New plugins can be loaded by clicking the Add button and browse for the desired plugin.
A plugin can be unloaded by selecting it in the list and clicking the Delete button.
If the selected plugin has a setup dialog, it can be opened by clicking the Setup button.
3.7 Excitation Energies Dialog
3.7.1 Description
The Excitation Energies dialog is used to define excitation energies, specify default excitation
energy and to change the current excitation energy.
3.7.2 Access
From the Setup menu select the Excitation Energies command. (Setup Excitation
Energies…)
SES Software User's Guide v 1.9
18/62
3.7.3 Excitation Energies
Figure 19. The Excitation Energies dialog.
Note: This dialog should only be used by the system administrator.
3.7.4 Excitation Energy File
The file where the defined excitation energies are stored is specified in the Excitation Energy File
frame. A different file can be loaded by clicking the Browse button and browse for the desired
file.
3.7.5 Energy List
•
•
•
•
New excitation energies can be defined by clicking the Add button.
The selected excitation energy can be renamed or deleted by clicking the Rename or
Delete buttons respectively.
Excitation energies can be moved further up or down the list by clicking the Move Up or
Move Down buttons.
The actual energy for the selected excitation energy can be changed in the Excitation
Energy field.
SES Software User's Guide v 1.9
19/62
3.7.6 Default Excitation Energy
The Default Excitation Energy frame specifies which excitation energy to use when creating new
regions. The default excitation energy can be changed either by selecting a predefined energy
from the drop-down list or by entering a new value.
3.7.7 Current Excitation Energy
The Current Excitation Energy frame specifies the excitation energy currently assigned to the
instrument. The current excitation energy can be changed by either selecting one of the
predefined excitation energies from the drop-down list or by entering a new value and clicking
the Set button.
Note: If a monochromator plugin is loaded, the Current Excitation Energy frame will display the
current photon energy of the monochromator. When the current excitation energy is changed,
the new value is assigned to the monochromator.
SES Software User's Guide v 1.9
20/62
4 Section D – Calibration Dialogs
4.1 Introduction
This section describes how to use Calibration dialogs.
4.2 Voltage Calibration Dialog
4.2.1 Description
The Voltage Calibration dialog is mainly used for optimizing intensities by changing the Pass
Energy and the lens deflection elements, calibrating the Energy Offset to compensate for drift,
and general troubleshooting.
4.2.2 Access
From the Calibration menu select the Voltages command. (Calibration Voltages…)
SES Software User's Guide v 1.9
21/62
4.2.3 Voltage Calibration
Figure 20. The Voltage Calibration dialog.
4.2.4 Voltage Calibration Menus
The menu bar in the Voltage Calibration dialog includes File, View, Display Mode and Edit
menus.
4.2.4.1 File Menu
Figure 21. The File menu.
The File menu is used for importing and exporting lens tables, and for exiting the Voltage
Calibration dialog.
SES Software User's Guide v 1.9
22/62
Note: The user only has to use the Exit command in this menu. The remaining commands
should only be used by the system administrator.
4.2.4.2 View Menu
Figure 22. The View menu.
The first four commands of the View menu open number display windows corresponding to data
in the Peak Information bar.
The Energy Range... menu button opens a dialog that shows the available energy ranges for each
lens mode and pass energy.
The External Image command opens a window displaying an image representation of the
spectrum. This command is available for Angular/Spatial and Spectrum Image display modes.
Selecting Show Supply Information will open the supply dialog.
Figure 23. The FWHM number display window.
The Position, Height, FWHM and Area windows can be resized for viewing at a distance when
performing optimization away from the computer.
4.2.4.3 Display Mode Menu
Figure 24. The Display mode menu.
The first four commands of the Display Mode menu represent different display modes. The last
two commands decide how to present and accumulate data.
Energy Distribution Curve
corresponds to a one-slice acquisition, presented as kinetic or binding energy vs. counts or count
rate in the Spectrum Display.
SES Software User's Guide v 1.9
23/62
Angular/Spatial
corresponds to an acquisition using the maximum number of slices available for current selection
of Y Channels in the global detector settings. The data is summed over all Energy Channels, and
then presented as Y channel vs. counts or count rate in the Spectrum Display.
Spectrum Image
corresponds to an acquisition using the maximum number of slices available for the current
selection of Y Channels in the global detector settings. The data can be presented either as an
image, or as kinetic or binding energy vs. counts or count rate for each slice individually, or
summed over all slices.
Note: The Spectrum Image item will have a submenu only if the detector system has a setting for
Data Bytes.
Signals
If this command is checked, signal data will be displayed instead of spectrum data. If the Allow
acquisition of both Signals and Detector option has been enabled in the SES Options dialog,
both signal and spectrum data will be displayed simultaneously.
Note: Signals are only available if an I/O interface library has been defined in the Instrument
Installation dialog.
Intensity as [counts/s]
If this command is checked, the intensity of the acquired data will be displayed as count rate,
rather than as counts.
Add Intensity until Restarted
If this command is checked, the intensity of subsequent acquisitions are added until either the
Restart button is clicked, or changes made to the acquisition parameters forces the acquisition to
restart.
4.2.4.4 Edit Menu
Figure 25. The Edit menu.
The Lens Table item opens the Edit Lens Tables dialog for the currently selected Lens Mode and
Pass Energy.
Note: The user should not change the values in the Edit Lens Tables dialog except for the lens
deflection elements.
SES Software User's Guide v 1.9
24/62
4.2.5 Instrument Parameters
Figure 26. The Instrument Parameters frame.
The Instrument Parameters frame specifies the setup of the continuous acquisition, as well as the
current element selection. When the Voltage Calibration dialog is opened, it immediately starts a
continuous fixed mode acquisition using default parameters. For the detector, it uses the full
range of Energy Channels. It uses a Slices setting dependent on Display Mode and for the
remaining parameters it uses values from the global detector settings.
Note: If the user does not have write permission to Instrument.dat, changes can not be made to
element voltages, including the lens deflection elements. Likewise, if the user does not have writepermission to RunVar.dat, changes can not be made to Energy Offset.
4.2.6 Voltages
Figure 27. The Voltages frame.
The Voltages frame specifies the current kinetic or binding energy and displays the voltage of the
selected element.
4.2.7 Offsets
Figure 28. The Offsets frame.
The Offsets frame specifies the Energy Offset of the analyser, and the pass energy offset for the
currently selected pass energy. The Ep Offset parameter is calibrated and should not be changed.
The Energy Offset parameter can be used to compensate for energy drift in the experiment
setup, and it can also be used for defining the work function. The Calibrate buttons perform
automatic calibrations for the corresponding energies. When clicking on a Calibrate button, SES
attempts to locate the highest peak shown on the image and shift it to the Kinetic Energy
specified in the Voltages frame (see above).
SES Software User's Guide v 1.9
25/62
4.2.8 Lens Curve
The Lens Curve graph displays the lens table for the currently selected Element, if it depends on
kinetic energy.
4.2.9 Table Entry
The Table Entry frame provides means to navigate through the discrete kinetic energy/voltage
pairs of the lens table for the currently selected element, if it depends on kinetic energy.
4.2.10 Spectrum Display
The spectrum display presents the spectrum of the current acquisition as a graph or as an image
representation.
4.2.11 Signal Display
The signal display presents the signal data of the current acquisition.
4.2.12 Peak Information
The information displayed in the Peak Information Bar of the spectrum display can be used
when maximizing intensity and resolution for desired analyser settings.
4.3 How to Optimize the Lens Deflection Elements
4.3.1 Description
The two lens deflection elements called Up/Down and Left/Right can be used to optimize the
sample position with regard to intensity or resolution.
4.3.2 Select Element (Step 1)
Figure 29. Element selection detail.
Select the lens deflection element that you wish to optimize in the Element box. The lens table
for the element will become visible in the Lens Curve graph.
4.3.3 Adjust Voltage (Step 2)
Figure 30. Element voltage detail.
SES Software User's Guide v 1.9
26/62
Next, use the Element Voltage box to adjust the voltage for the lens deflection element while
watching the Peak Information bar.
Note: Changing settings related to the acquisition will force it to restart, and the Element Voltage
for the lens deflection element will revert back to its initial value. Refer to the How to Edit the
Lens Tables for instructions on how to save the new lens deflection voltages in the Lens Table.
4.3.4 Optimize (Step 3)
When optimizing for intensity, watch for an increase in peak height or spectrum area; when
optimizing for energy resolution, watch for a decrease in peak FWHM, while maintaining good
peak height.
Note: Instrument operation is best when the lens deflection elements are at 0 V. It is better to
optimize the intensity by changing experiment geometry.
4.3.5 Peak Information
Figure 31. Detail of the Peak Information bar showing important parameters when
optimizing intensity and resolution.
4.4 How to Edit Lens Tables
4.4.1 Description
When optimal voltages for a lens deflection element have been found, the lens table needs to be
changed to reflect this. This can be carried out either by using the Table Entry frame or the Edit
Lens Tables dialog.
Note: Users should never change the lens tables for elements other than the Up/Down and
Left/Right lens deflection elements.
4.4.2 Using Table Energy
Figure 32. Detail of the navigation buttons in the Table Entry frame.
•
•
To change the element voltage of a lens table point, navigate to it using the navigation
buttons, and enter the desired value in the Element Voltage box.
To delete a point, navigate to it and click the Delete button.
SES Software User's Guide v 1.9
•
27/62
To insert a new point at the current kinetic energy, enter the desired value in Element
Voltage and click the Insert button.
4.4.3 Using Edit Lens Table
Figure 33. Detail of the Edit Lens Tables dialog showing the lens table for the Up lens
deflection element.
Open the Edit Lens Tables dialog from the Edit menu. To change element voltage for a point,
edit the cell in the Voltage column for the corresponding kinetic energy. To delete a point, select
a cell in the Ek or Voltage column and press the Delete key. To insert a new point, select an
empty cell in the Ek column, enter the desired kinetic energy for the point, press the Enter key
and then edit the element voltage.
Note: When using the Edit Lens Table a lens table must contain at least two points.
4.4.4 Saving Lens Table Changes
After a lens table has been edited, changes should be saved by clicking the Ok button and
confirming the changes.
4.5 Detector Calibration Dialog
4.5.1 Description
The Detector Calibration dialog is used to calibrate the basic energy and angular or spatial scales
of the detector. It is also used to calibrate an energy correction curve compensating for nonlinearities in the energy direction of the detector.
4.5.2 Access
From the Calibration menu select the Detector command. (Calibration Detector…)
SES Software User's Guide v 1.9
28/62
4.5.3 Detector Calibration
Figure 34. The Detector Calibration dialog.
Note: This dialog should only be used by the system administrator.
4.5.4 Dialogs Menu
Figure 35. Detail of the Dialogs menu.
•
The Detector Linearity command is used to investigate the saturation level when using
Pulse Counting mode and ADC Mode respectively.
SES Software User's Guide v 1.9
29/62
4.5.5 Calibration Mode
Figure 36. Detail of the Calibration Mode frame.
The basic acquisition parameters of the instrument are specified in the Calibration Mode frame.
4.5.6 Energy Correction Diagram
The Energy Correction Diagram displays the calibration curve for the current pass energy.
4.5.7 Energy Scale
Figure 37. Detail of the Energy Scale frame.
The Energy Scale frame specifies the basic energy scale of the detector. Basic energy scale
calibration can be started by clicking the Optimize button and stopped by clicking the Stop
button.
4.5.8 Y-scale
Figure 38. Detail of the Y-scale frame.
The Y-scale frame specifies the basic angular or spatial scale of the detector.
4.5.9 Multiple Counting Factors
Figure 39. Detail of the Multiple Counting Factors frame.
The Multiple Counting Factors frame specifies the multiple counting factor(s) for the current
pass energy. Pulse Counting-mode and ADC Mode have individual multiple counting factors.
SES Software User's Guide v 1.9
30/62
4.5.10 Calibration Parameters
Figure 40. Detail of the Calibration Parameters frame.
The Calibration Parameters frame specifies the instrument settings for the continuous
acquisition, the basic energy scale calibration and calibration of the energy correction curve.
•
•
•
•
The Kinetic and Binding buttons specify whether to use kinetic or binding energy for the
energy scale.
The Kinetic Energy box specifies the centre energy of the acquisitions. The Width field
specifies the width of the energy window used for the sweeps when calibrating energy
correction curves.
The Swept Time box specifies the step time used for the sweeps when calibrating energy
correction curves.
The Fixed Time box specifies the acquisition time for the continuous acquisition and for
the basic energy scale calibration.
4.5.11 Energy Correction Curve
•
•
The energy correction curve for the current pass energy can be cleared by clicking the
Clear button.
A new energy correction curve can be calibrated for the current pass energy by clicking
the Calibrate button.
4.6 The Spin Detector Calibration Dialog
4.6.1 Description
The Spin Detector Calibration dialog is used to calibrate the spin channel energies.
4.6.2 Access
Note: This dialog will only show up if there is an External I/O module installed and that module
has also been configured as Spin Detector (see 7.2).
From the Calibration menu select the Spin Detector command. (Calibration Spin
Detector…)
SES Software User's Guide v 1.9
31/62
4.6.3 Spin Detector Calibration
Figure 41. The Spin Detector Dialog
Note: This dialog should only be used by the system administrator.
The Spin Detector Calibration dialog is capable of handling multiple spin detectors, shown in
different tabs at the top of the dialog. When opening the dialog, a measurement is automatically
started, and can subsequently be restarted by clicking on the Restart button.
4.6.4 Instrument Parameters
Figure 42. Instrument Parameters for the spin detector calibration.
Basic acquisition parameters of the instrument are specified in this frame.
SES Software User's Guide v 1.9
32/62
4.6.5 Sweep Parameters
Figure 43. The sweep parameters for the spin detector calibration dialog .
This frame manages the sweep settings to be used for sweep mode acquisitions during the spin
detector calibration.
4.6.6 Energy Calibration
Figure 44. The Energy Calibration frame for the Spin Detector Dialog.
The energy offset can be automatically calibrated by clicking the Calibrate button. This
calibration will set the energy offset for all spin channels. The procedure is to first set the Kinetic
Energy in the Sweep Parameters frame, whereupon the desired peak should be visible in the
spectrum view. Clicking Calibrate will then move the peak to match the correct kinetic energy.
4.6.7 Multiple Counting Factors
Figure 45. The Multiple Counting Factors frame for the Spin Detector Dialog.
The MCF values are determined individually for each spin channel. To get the best result, the
energy calibration should be done before starting this. The peak should be at the center of the
graph, and when clicking Calibrate, the peaks from all spin channels will be normalized to the
same intensity.
4.7 Control Supplies Dialog
SES Software User's Guide v 1.9
33/62
4.7.1 Description
The Control Supplies dialog is used to display and change the voltages assigned to specific
supplies. It is used solely for troubleshooting the operation of the supplies.
4.7.2 Access
From the Calibration menu select the Control Supplies command. (Calibration Control
Supplies…)
4.7.3 Control Supplies
Figure 46. Example of the Control Supplies dialog.
Note: This dialog should only be used by the system administrator.
Note: The zero value for high voltage supplies generally differ from 0 by a small amount.
•
•
•
•
The supply voltage indicators can be dragged and dropped to resemble the layout of the
high voltage.
If a supply is within its operational range, this is indicated by the green colour of the
numbers in the voltage indicator. If it is outside its operational range, the colour will be
red.
A specific supply can be brought to its extreme max and min values by clicking the
respective button at the bottom of the appropriate supply voltage indicator.
The voltage assigned to a specific supply can also be changed by entering a new value and
pressing the Enter key.
Figure 47. Detail of the Voltages manu.
SES Software User's Guide v 1.9
•
•
34/62
The Zero All command in the Voltages menu sets all supplies to their zero values.
The Send Repeatedly command in the Voltages menu forces the assigned voltages to be
sent to the supplies repeatedly with a 100 ms delay.
SES Software User's Guide v 1.9
35/62
5 Section E – Run Dialogs
5.1 Introduction
This section describes how to use the Sequence and Region Editors, explains the Run Modes and
how to compensate for energy drifts during data acquisition.
5.2 Sequence List Editor
5.2.1 Desciption
The Sequence List Editor defines sequences to be run in an experiment batch. Each sequence in
the sequence list uses individual settings.
5.2.2 Access
From the Run menu select the Setup command. (Run Setup...)
Note: The Sequence List Editor is only available if the Use Multiple Sequences option in the SES
Options dialog is checked.
5.2.3 Sequence List Editor
Figure 48. The Sequence List Editor.
5.2.3.1 Sequence List
The sequence list displays the sequences available for execution:
•
•
The right column displays the file names of added sequences.
The left column displays the number of enabled regions in the corresponding sequence.
SES Software User's Guide v 1.9
36/62
5.2.3.2 Edit Buttons
The following buttons are available for editing the sequence list:
•
•
•
•
•
•
To create a new sequence, click the New… button. The new sequence is added to the
end of the list.
To open one or more existing sequences, click the Open… button. The selected
sequences are added to the end of the list.
To edit the selected sequence in the Sequence Editor Dialog, click the Edit… button.
To create a copy of a selected sequence, click the Copy… button.
To delete the selected sequence(s) from the list, click the Delete button.
To move the selected sequence(s) up or down in the queue, use the Up and Down
buttons.
Note: Deleting a sequence from the sequence list does not delete the corresponding sequence
file.
5.3 Sequence Editor
5.3.1 Description
The Sequence Editor defines the regions to be run in an experiment, which run mode to use and
where to save resulting data.
5.3.2 Access
•
•
When using multiple sequences, double-click a sequence file or click the Edit button in
the Sequence List Editor.
Otherwise, from the Run menu, click the Setup command. (Run Setup…)
SES Software User's Guide v 1.9
37/62
5.3.3 Sequence Editor
Figure 49. The Sequence Editor.
5.3.3.1 Title Bar
The title bar displays the file name of the active sequence.
5.3.3.2 Menu
Figure 50. Detail of the File menu.
The File menu provides commands to open, save and create new sequences. It also provides
commands to create new regions.
Figure 51. Detail of the Edit menu.
The Edit menu provides commands to copy, cut, paste and delete regions.
SES Software User's Guide v 1.9
38/62
5.3.3.3 Acquisition Region
The regions marked as active will be executed sequentially when an experiment is started.
•
•
To activate a region, click the centre of the cell of the first column so that it turns green
and the -symbol appears.
To deactivate a region, click the cell so that it turns red and the -symbol appears.
Shaded columns are read only, and can be used to move regions up and down in the table. The
second column of the region table defines the type of acquisition for the corresponding region:
•
•
•
•
D – acquisition using detector
r – acquisition using local detector settings
S – acquisition using signals
U – user interface region
Note: The Total Time column displays the estimated time to complete one acquisition of the
region. This includes the number of repetitions defined in the region in the calculation, but not
analyser delays.
5.3.3.4 Experiment Information
The Info frame allows for miscellaneous experiment information to be entered including the base
file name for saving experiment data.
5.3.3.5 Run Mode
The Run Mode frame defines how the software should perform the acquisitions and save the
data.
5.3.3.6 Buttons
•
•
To edit the global detector settings, click the Setup Detector button.
To edit the file options for this sequence, click the File Options button.
5.3.4 Saving Experiments
•
•
•
•
With the exception of the File Name box, all information entered in the Info frame will
be saved with the experiment. The text in the File Name box will be used as a base file
name for the saved experiments.
If the Sort by User option is used, experiments will be saved in a subdirectory named as
User.
If the Sort by Sample option is used, experiments will be saved in a subdirectory named
as Sample.
If both Sort by User and Sort by Sample options are used, experiments will be saved in
subdirectories of the form \User\Sample.
5.3.5 Region Management
The File and Edit menus contain commands for for adding, editing copying and deleting regions.
In addition, several shortcuts exist to speed up region management.
SES Software User's Guide v 1.9
•
•
•
•
39/62
Create a new acquisition region (CTRL+R), through the Region command in the New
submenu of the File menu, or click the New button.
Copy (CTRL+C), cut (CTRL+X), paste (CTRL+V) or delete (DEL) a region, select
the corresponding row in the region table and click the appropriate command in the Edit
menu or press, or click the corresponding button in the Region group.
To edit a region, double click the corresponding row in the region table to bring up the
Region Editor, or edit the cells in the region table directly.
To move a region, click and hold on any of the read-only columns of the region table
with the mouse, or hold the CTRL key and use the Up and Down keys.
5.4 Region Editor
5.4.1 Description
The Region Editor is used to define acquisition regions. The most basic settings for a region are
lens mode, pass energy and energy range. In addition to this, there are more advanced settings,
such as using a region specific detector setting and run mode.
5.4.2 Access
In the Sequence Editor, double click a row in the region table.
SES Software User's Guide v 1.9
40/62
5.4.3 Region Editor
Figure 52. The Region Editor.
Note: Changes made to a region in the Region Editor will be saved when the Sequence Editor is
closed or the Save Sequence or Save Sequence As commands are used.
5.4.3.1 Name
This text box provides a means to rename the currently selected region, as well as changing which
region in the current sequence to edit.
5.4.3.2 Lens Mode
The Lens Mode box lists the lens modes available for the instrument.
5.4.3.3 Pass Energy
The Pass Energy box lists the pass energies available for the selected lens mode. Choosing a
higher pass energy results in higher intensity and a wider energy range, at the expense of energy
resolution.
5.4.3.4 Run Mode
The Run Mode frame defines how the software should perform the acquisitions and save the
data. Note that this is different from the run mode defined in the Sequence Editor.
5.4.3.5 Acquisition Mode
The Acquisition Mode frame defines whether the region should be measured using fixed mode or
swept mode. In fixed mode, the energy is kept fixed for the duration of the acquisition, so that a
SES Software User's Guide v 1.9
41/62
snapshot of the selected detector area is produced. The energy range is restricted by the energy
width of the detector, which is typically about 10% of the pass energy. In swept mode, the energy
is incremented by the energy step, starting with the low energy. Each step in energy corresponds
to one point of the spectrum, and each step in energy is also integrated over the selected area of
the detector.
5.4.3.6 Energy Mode
The Energy Mode frame defines whether binding energy or kinetic energy should be used for
defining the low and high energies and for the energy scale of the spectrum.
5.4.3.7 Energy
The Energy frame defines the energy range of the region. It provides means of changing the
energy range either by low and high energy, or by centre energy and energy width. The values in
the Energy frame are either in binding energy or kinetic energy, depending on the selected
Energy Mode. If fixed acquisition mode is selected in Acquisition Mode, only the centre energy
can be changed.
5.4.3.8 Step
Figure 53. Detail of the Step frame.
The Step frame defines the step time and step size of the region.
•
•
•
•
For detectors that have a fixed frame rate, such as CCD and FireWire cameras, both the
Frames and the Time boxes can be used to select the desired step time. The step time
defines the amount of time the detector should spend acquiring data for each energy step.
For detectors with a fixed frame rate, the value in the Time box is always adjusted to
define a whole number of frames.
For swept mode acquisitions, the energy step defines the distance in energy between each
point of the spectrum. The energy step in conjunction with the energy range defines the
number of steps, and thus the number of spectrum points, of a swept mode acquisition.
The Step frame displays frame rate for detectors with a fixed frame rate, minimum step
time and minimum energy step for the selected pass energy. It also displays the total
number of steps and estimated total time for one acquisition of the region.
5.4.3.9 Detector
The Detector frame defines the detector settings for the region.
•
•
The Configuration combo box determines if acquisition should be made through the
detector and/or the Signals I/O.
If the Use Region Defined Detector box is unchecked, the region will use the global
detector settings.
SES Software User's Guide v 1.9
•
42/62
If the Use Region Defined Detector box is checked, it will use local detector settings
specific to the region. The local detector settings can be changed by clicking the Setup
button.
5.4.3.10 Excitaion
Figure 54. Detail of the Excitation Energy frame.
The Excitation energy frame defines the excitation energy or photon energy for the region.
•
•
•
An excitation energy can be entered either by selecting one of the predefined energies, or
by typing a new value in the excitation energy box.
The predefined excitation energies and the default excitation energy for new regions can
be modified in the Excitation Energies dialog. This dialog is accessed from the main
Setup menu by selecting the Excitation Energies command.
If a monochromator plugin is being used, the monochromator can be moved to the
selected excitation energy by checking the Move Monochromator box. To use the current
photon energy of the monochromator as the excitation energy for the region, click the
Get Energy button.
5.5 Run Modes
5.5.1 Description
A run mode is a set of rules that defines how the SES should perform acquisitions and how it
should save the data resulting from these acquisitions.
5.5.2 Access
Run modes are selected and configured in the Run Mode frames of the Sequence Editor and the
Region Editor for the sequence and regions respectively.
5.5.3 Run Mode
Figure 55. Detail of the Run Mode frame.
SES comes with two built in run modes; Normal and Add Dimension. Each of these run modes
can be selected and configured for the whole sequence and for each region individually.
SES Software User's Guide v 1.9
•
•
•
•
•
43/62
In the Normal run mode, consecutive acquisitions are summed together to yield higher
intensity and a better signal to noise ratio.
In the Add Dimension run mode, each consecutive acquisition is stored separately to
form an extra dimension in the experiment file. If both the sequence and a region make
use of the Add Dimension run mode, the result will be two extra dimensions in the
experiment file.
By selecting the Number of iterations option, the number of consecutive executions of
the sequence or the region can be specified.
By selecting the Repeat until stopped option the execution of the sequence or the region
can be repeated indefinitely.
If Confirm after each iteration is checked, a confirmation to continue will be displayed
after each successful execution of the sequence or the region.
SES Software User's Guide v 1.9
44/62
6 Section F – Operations during Acquisition
6.1 Introduction
This section describes the operations and information during data acquisition.
6.2 Operating the Spectrum Display
6.2.1 Description
The Spectrum Display is used to display acquired spectra, and can be configured to display data
in several ways. During acquisition, it scales automatically to the acquired data, and it also has
zooming capabilities and can display basic peak information.
6.2.2 Spectrum Display
Figure 56. Displaying the first slice of a multiple slice spectrum.
The Spectrum Display context menu is opened by right clicking in the spectrum area, and has the
following menu items:
•
•
The Show Coordinates menu item specifies whether the information about the
coordinates of the mouse pointer’s current position should be displayed.
The Integrate Slices menu item is only available with multiple slice spectra. If Integrate
Slices is checked, the spectrum data for all slices will be summed and displayed as a single
slice spectrum.
SES Software User's Guide v 1.9
•
•
•
•
•
45/62
The Show Spectrum Image menu item is only available with multiple slice spectra. If
Show Spectrum Image is checked, the spectrum data will be displayed as an image
representation of the spectrum.
The Use Range Markers menu item specifies whether only data within the area of the
range markers should be displayed.
The Show Peak Information menu item specifies whether basic peak information should
be displayed at the bottom of the spectrum display.
The C1s menu item is named after the region that is being displayed, and is only visible if
the spectrum has as a graph. Its sub menu specifies whether the graph should be drawn
using lines or points as well as the colour of the graph. The sub menu also allows more
detailed modification of the curve by opening a Customize dialog.
The Colour Scheme item specifies what colours to use for the background of the
spectrum display, as well as for the axes and the text. When selecting a colour scheme, the
colour of the graph will be reset to the default value for that colour scheme.
Note: The Integrate Slices and Show Spectrum Image commands are mutually exclusive. By
checking either one of them, the other will automatically be unchecked. If either one of them is
checked the Slice box will not be visible.
6.2.3 Customize Curve Dialog
Figure 57. The Customize Curve dialog.
The Customize Curve dialog lets the user modify how the spectra will be displayed. By selecting
the Draw Line and/or Draw Point checkboxes, the curve can be visible in different forms and
colors.
•
•
The curve can be drawn with Solid, Dash, Dot, Dash-Dot and Dash-Dot-Dot shapes,
and the color can be selected by clicking on the color square next to the selection box.
The individual points can be shown as Points, Squares, Diamonds, Circles or Crosses.
The size of the points is also adjustable through the Size text box. The Size and Fill
attributes are not applicable for Point shapes, which only draw individual pixels. As for
the Draw Line option, Draw Point also allows for customization of the color.
SES Software User's Guide v 1.9
46/62
6.2.4 Displaying Spectra as Images
Figure 58. Image representation of a multiple slice spectrum.
When displaying the spectrum image, the Scale Factor box will be visible. The scale factor
specifies how the body of the spectrum data should be scaled with respect to the maximum.
•
•
Decreasing the Scale Factor yields more detail in the low intensity areas of the spectrum,
such as noise.
Increasing the Scale Factor yields more detail in the high intensity areas of the spectrum.
If the Show Coordinates item is checked, in addition to the position of the mouse pointer, the
intensity of that position will also be displayed.
Note: When a large detector area with many slices is selected, this might result in a decreased
sweep speed due to computer performance, but data is still collected correctly. For optimal
performance, do not display the spectrum in image mode when acquiring swept spectra.
6.2.5 Displaying Signals
Signals are treated as detectors with no dimension. For fixed mode acquisitions the signal data
will consist of one value for each channel, whereas for swept mode acquisitions there will be one
curve for each channel.
SES Software User's Guide v 1.9
47/62
6.2.5.1 Displaying Signals in Swept Mode
Figure 59. Spectrum display showing signal data from a swept mode acquisition.
For swept mode acquisitions, each channel is displayed as an individual curve in a separate
spectrum display. The x-axis represents Kinetic Energy and the y-axis the measured channel
values. Each channel has individually configurable colour and drawing configurations.
6.2.5.2 Displaying Signals in Fixed Mode
Figure 60. Display showing signal data from a fixed mode acquisition.
For fixed mode acquisitions, each channel is displayed as a value and a bar. The sum of all
channels is also shown in the Total Count box.
SES Software User's Guide v 1.9
48/62
6.2.6 Displaying Signals and Spectrum Simultaneously
Figure 61. Signal and spectrum data from a swept mode acquisition.
For swept mode acquisitions, signal and spectrum data are displayed in separate spectrum
displays. If the Correlate scales for signals and detector option is checked in the SES Options
dialog, the energy scales for the signal and spectrum data are correlated.
Figure 62. Signal and spectrum data from a fixed mode acquisition.
For fixed mode acquisitions, spectrum data is displayed in a spectrum display and signal data in a
signal display.
6.2.7 Spectrum Normalization
Figure 63. Spectrum plot menu as shown when using both detector and signals.
SES Software User's Guide v 1.9
49/62
When both detector and signals are acquired simultaneously in swept mode, options for
normalizing the spectrum to the acquired signals are added to the plot menu.
It is also possible to view the signals in the same plot as the spectrum.
6.2.8 Range Markers and Peak Information
6.2.8.1 Range Markers and Peak Display
Figure 64. Range markers and peak information detail.
6.2.8.2 Range Markers
The range markers are used to specify which energy range of the spectrum should be displayed
and used for calculation of peak information. If a spectrum contains multiple peaks, peak
information pertaining only to the highest peak is displayed.
Information about another peak can be gained by moving the range markers to include only that
peak. By moving the range markers to include a certain region of interest, the area is calculated
using data within the range markers only.
6.2.8.3 Peak Information
The Peak Information bar displays information pertaining to the highest peak in the spectrum.
•
•
•
•
Position describes the energy position of the highest point.
Height describes the intensity of the highest point.
FWHM describes the full width at half maximum of the peak.
Area describes the total intensity over the whole spectrum.
SES Software User's Guide v 1.9
50/62
6.2.9 Background Removal
Figure 65. The menu for background removal of the displayed spectrum.
The spectrum display can be modified through background removal of the acquired spectrum.
This is done through right-clicking on the spectrum display and selecting which background
shape to use. Available shapes are None, Linear or Shirley. This visualization is only applied to
the current display, and will not be stored in the result file.
6.3 The Sequence Tree
6.3.1 Description
The sequence tree keeps track of produced spectra during and after acquisition.
6.3.2 The Sequence Tree During Acquisition
Figure 66. Sequence tree during acquisition.
During acquisition the tree contains a list of all regions enabled for the acquisition, and displays
icons whose colours specify the status of the region.
•
•
•
If the icon is red, the region is currently being executed.
If the icon is white, region has not yet been executed or there is no data to save.
If the icon is green, the region has successfully been acquired and data has been saved.
SES Software User's Guide v 1.9
51/62
6.3.3 The Sequence Tree After Acquisition
Figure 67. Sequence tree after acquisition.
After acquisition the spectra of the individual regions can be displayed by selecting the region in
the sequence tree. If the Add Dimension run mode is used, the individual spectra of the region
can be displayed by selecting the relevant iteration count.
6.4 The Status Bar
6.4.1 Description
The Status Bar of the main window displays information pertaining to the current acquisition.
Depending on which options are checked in the Appearance tab of the Options dialog, the
appearance of the status bar will be different.
6.4.2 Status Bar
Figure 68. Detail of the Status bar displaying information for a regionusing the Add
Dimension run mode with three iterations.
The information shown in the status bar, from left:
•
•
•
•
•
•
The current and total number of additive iterations of the region.
The name of the experiment file in which spectrum data is saved. If the Autosave option
in the File Options dialog is unchecked, the text “No Autosave.” will be displayed.
The name of the temporary file where the acquired data is saved as long as the spectrum
is shown in the Spectrum Display plot.
The Lens Mode and Pass Energy of the acquisition.
The current Kinetic Energy of the analyser during acquisition.
The estimated remaining time of the acquisition.
SES Software User's Guide v 1.9
52/62
7 Section G – Installations Dialogs
7.1 Introduction
This section describes the installation dialogs that are used for the initial setup of a new system.
7.2 Instrument Installation Dialog
7.2.1 Description
The Instrument Installation dialog is used to change basic settings of the instrument, such as
which detector and supply libraries to use.
7.2.2 Access
From the Installation menu select the Instrument command. (Installation Instrument...)
7.2.3 Instrument Installation
Figure 69. The Instrument Installation dialog.
Note: This dialog should only be used by the system administrator.
•
The Model and Serial Number fields specify the model and serial number of the
instrument.
SES Software User's Guide v 1.9
•
•
•
•
•
53/62
The AV Delay specifies the delay used when the voltage of a high voltage supply is
changed. The Region Delay specifies the delay used between the regions in a sequence.
The Detector Interface frame specifies which detector library to use for data acquisition.
To change library, click the Browse button and to change library settings, click the Setup
button.
The Supply Interface frame specifies which supply library to use to control the HV
supplies. To change library, click the Browse button and to change library settings, click
the Setup button.
The I/O Interface frame specifies which I/O library to use for external I/O
communication. To change library, click the Browse button and to change library settings,
click the Setup button.
The Configure as Spin Detector check-box enables the External I/O interface to be used
specifically for spin detectors.
Note: Shipped with SES come dummy libraries for each interface. They are named
Detector_Dummy.dll, Supply_Dummy.dll and ExternalIO_NIDAQ_Dummy.dll respectively.
7.2.4 Configuring the I/O Interface as Spin Detector
When the Configure as Spin Detector check-box has been selected, the Setup Detector... button
is enabled, which will let you add and configure multiple spin detectors.
Figure 70. The External Detector Installation for spin detector setup.
Each added tab represents one spin detector, and each spin detector can be configured with
different channels (Input Signals). Once a channel has been selected for one tab, that channel is
disabled for the other tabs.
7.3 Supply Installation Dialog
7.3.1 Description
The Supply Installation dialog is used to add and remove supplies, and to change their settings
and calibration parameters.
SES Software User's Guide v 1.9
54/62
7.3.2 Access
From the Installation menu select the Supplies command. (Installation Supplies…)
7.3.3 Supply Installation
Figure 71. The Supply Installation dialog.
Note: This dialog should only be used only by the system administrator.
•
•
•
•
•
The supply list displays the supplies for the instrument. By selecting one specific supply,
its calibration parameters and settings can be edited.
New supplies can be added by selecting the proper type and clicking the Add button. By
clicking the Delete button, the selected supply is deleted. The calibration curve for a DAC
can be viewed by selecting it in the supply list, and clicking the Calibrate button.
The DAC Calibration frame specifies which DAC calibration-file is used. A new DAC
calibration-file can be selected using the Browse button, and loaded using the Load
button.
Settings for all supplies and the calibration parameters for high voltage supplies can be
exported and imported using the Import and Export commands from the File menu
respectively. (File Export, File Import)
The Ramp Step and Ramp Delay settings are set to allow individual supply voltages to
ramp up to the desired voltage with a delay (given in ms) between each step (given in V).
7.4 Element Installation Dialog
SES Software User's Guide v 1.9
55/62
7.4.1 Description
The Element Installation dialog is used to add and remove element sets, add and remove
elements in the element sets, link supplies to elements and link elements to each other.
7.4.2 Access
From the Installation menu select the Elements command. (Installation Elements…)
7.4.3 Element Installation
Figure 72. The Element Installation dialog.
Note: This dialog should only be used only by the system administrator.
•
•
•
•
The tabs specify the different element sets available to the instrument.
The Fix Elements frame defines elements which are neither dependent on pass energy
nor kinetic energy.
The Pass Elements frame defines elements which are dependent on pass energy, but not
kinetic energy.
The Kinetic Elements frame defines elements which are dependent on both pass energy
and kinetic energy.
SES Software User's Guide v 1.9
•
56/62
Acceleration Element frame defines the acceleration element.
7.4.4 Modifying Elements and Element Sets
Elements in all the different frames described above can be:
• Added by clicking the Add button.
• Deleted or renamed by clicking the Delete or Rename buttons.
• Linked to an element further up in the list by clicking the Link button.
• The supplies linked to an element can be changed by clicking the Supplies button.
• The association for an element can be changed using the Assosiations drop-down list.
Available values are Analyzer Element, Detector Element or External I/O Element.
• The security level for an element can be changed using the Security Level drop-down list.
Available values are Administrator, Privileged User and User, where Administrator is the
highest level.
• Element sets can be added, deleted or renamed by clicking the corresponding buttons in
the Element Sets frame.
Note: Associations are important when using an instrument which has both signals and a
detector, and where elements associated with each input interface should be turned off when that
interface is not used.
7.5 Lens Mode Installation Dialog
7.5.1 Description
The Lens Mode dialog is used to add and remove lens modes and to add and remove pass
energies.
7.5.2 Access
From the Installation menu select the Lens Modes command. (Installation Lens Modes...)
SES Software User's Guide v 1.9
57/62
7.5.3 Lens Mode Installation
Figure 73. The Lens Mode Installation dialog.
Note: This dialog should only be used by the system administrator.
Note: For the first lens mode, all pass energies must be activated.
•
•
•
•
Lens modes can be added by clicking the Add button in the Lens Mode frame. The
selected lens mode can be deleted or renamed by clicking the Delete or Rename button
respectively in the Lens Mode frame.
The Y-Scale Unit field specifies the dimensional unit used for the angular or spatial
dimension.
The check list in the Pass Energies frame specifies the available pass energies for the
selected lens mode. Pass energies can be added by clicking the Add button and the
selected pass energy can be deleted by clicking the Delete button. For specific lens
modes, a pass energy can be activated or deactivated by checking the appropriate entry in
the check list.
The Magnification/Dispersion field specifies the dispersion for angular lens modes and
the magnification for spatial lens modes for the selected pass energy. The Offset field
specifies the angular or spatial scale offset for angular and spatial lens modes respectively
for the selected pass energy.
SES Software User's Guide v 1.9
58/62
8 Section H – SES Options and Information Dialogs
8.1 Introduction
This section describes how to customize the software appearance and information.
8.2 SES Options Dialog
8.2.1 Description
The SES Options dialog is used to define general aspects of appearance and behaviour of the
SES software. An important option in the Acquisition tab is the choice to zero all supplies after a
completed acquisition. This is useful when working with experiments which might damage the
detector.
8.2.2 Access
From the File menu select the Options command. (File Options…)
8.2.3 Messages Tab
Figure 74. The Message tab.
Note: The Messages tab should only be used by the system administrator.
8.2.4 Appearance Tab
Figure 75. The Appearance tab.
SES Software User's Guide v 1.9
59/62
The Appearance tab contains general options for the appearance of the SES software. The
administrator will setup these options.
•
•
•
•
•
•
If the Expand sequence tree view option is checked, acquisitions using the Add
Dimension run mode will be expanded automatically in the sequence tree view.
If the Show name of… option is checked, the name of the temporary file stored in the
work folder will be displayed in the status bar. This option is for advanced use.
If the Show Kinetic Energy… option is checked, the current kinetic energy of the
analyzer is displayed in the status bar during acquisition.
If the Show Lens Mode… option is checked, the current lens mode and pass energy is
displayed in the status bar during acquisition.
If the Show Progress Bar option is checked, the progress bar for swept modes is
displayed below the spectrum display during acquisitions.
If the Correlate Scales… option is checked, spectrum displays showing signal and
detector data will use the same energy scale.
8.2.5 Acquisition Tab
Figure 76. The Acquisition tab.
The Acquisition tab contains options pertaining to acquisitions, and applies to the setup and
calibration dialogs that have acquisition capabilities as well as experiment acquisitions. The
administrator will setup these options.
•
•
•
•
If the Always use delay … option is checked, a region delay of usually one second will
always precede the execution of an acquisition even if the high voltage power supplies
have not changed since the last acquisition.
If the Zero voltages… option is checked, all supplies will be zeroed when a sequence is
completed or stopped by the user, and when a calibration or setup dialog with acquisition
capabilities is closed.
If the Allow acquisitions… option is checked, acquisitions using the detector and signals
simultaneously are possible.
If the Use multiple sequences option is checked, the Sequence List Editor is available
through clicking the Setup command from the Run menu.
SES Software User's Guide v 1.9
60/62
Note: It is highly recommended that the Zero voltages… option remains checked at all times, to
minimize the risks of detector overload.
Note: If the detector and signals operate on disparate intensity levels, checking the Allow
acquisitions… option increases the risk for a detector overload by allowing users to use detector
and signals simultaneously.
8.2.6 Spectrum Correlation Tab
Figure 77. The Spectrum Correlation tab.
The Spectrum Correlation tab contains options pertaining to spectrum correlation. When using
the Drift Region Spectrum, correlation is performed using Fast Fourier Transform routines for
both XPS and UPS peaks, and Fermi edges.
• If the Peak option is selected, the spectra from the Drift Region will be assumed to
contain an XPS or a UPS peak.
• If the Fermi edge option is selected, the spectra from the Drift Region will be assumed to
contain a Fermi edge. The Drift Region spectra will then be smoothed and differentiated
once using a Savitzky-Golay filter prior to correlation. The number of smooth points can
be specified using the Smooth Points box.
8.2.7 Spectrum Display Tab
Figure 78. The Spectrum Display tab.
SES Software User's Guide v 1.9
61/62
The Spectrum Display tab contains options pertaining to displaying spectra and in particular to
displaying of image representations of spectra.
•
•
•
•
If the Spectrum Image… option is checked, the image representation of a multiple slice
acquisition will be displayed in an external window.
If the Delay drawing… option is checked, the spectrum display in the SES main window
delays displaying of an acquisition until data is available. This allows a completed
spectrum to be viewed while the subsequent acquisition performs its preparation steps.
The Image Scale Factor frame pertains to the external image in the SES main window
and in the Voltage Calibration dialog.
If the Update on the fly option is checked, changes to the scale factor will take effect
immediately.
8.3 Supply Information Window
8.3.1 Description
The Supply Information window is used to display the voltages assigned to specific supplies
during instrument operation. This window is mainly used for troubleshooting (e.g. to check
whether certain instrument settings brings any of the supplies out of range).
8.3.2 Access
From the main View menu select the Show Supply Information command. (View Show
Supply Information…)
8.3.3 Supply Information
Figure 79. The Supply Information window.
The supply voltage indicators can be dragged and dropped to resemble the layout of the high
voltage cabinet. If a supply is within its operational range, this is indicated by the green colour of
the numbers in the voltage indicator. If not, this is indicated by the red colour.
SES Software User's Guide v 1.9
62/62
8.4 Detector Information Window
8.4.1 Description
The Detector Information window is used to display the current detector settings. This dialog
can be used to verify that the correct detector settings for different regions in a sequence are
selected.
8.4.2 Access
From the main View menu select the Show Detector Information command. (View Show
Detector Information…)
8.4.3 Detector Information
Figure 80. The Detector Information window.