1
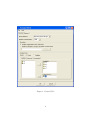
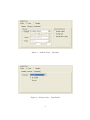
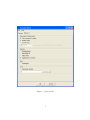
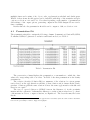
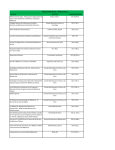
LEIDEN PSYCHOLOGICAL REPORTS
PSYCHOMETRICS AND RESEARCH METHODOLOGY
PRM 04-01
PermuCLUSTER 1.0 User’s Guide
Alexander Spaans
Willem van der Kloot
DEPARTMENT OF PSYCHOLOGY
UNIVERSITY OF LEIDEN
THE NETHERLANDS
PermuCLUSTER 1.0 User’s Guide
Alexander Spaans
Willem van der Kloot
Faculteit Sociale Wetenschappen
Studierichting Psychologie
Universiteit Leiden
Postbus 9555, 2300 RB Leiden
Nederland
c 2004 Leiden University, Leiden, The Netherlands.
Copyright LICENSE AGREEMENT
This Limited Use Software License Agreement is a legal agreement between you (the end-user), and Leiden University for the use of
PermuCLUSTER (Software). By using this software or storing this program on a computer hard drive (or other media), you are agreeing to
be bound by the terms of this Agreement.
License
This license allows you to install and use the Software on a single computer; OR install and store the Software on a storage device, such as
a network server, used only to run or install the Software on your other computers over an internal network. You are allowed to make one
copy of the Software in machine-readable form solely for backup purposes. You must reproduce on any such copy all copyright notices and
any other proprietary legends on the original copy of the Software.
Restrictions
You may not decompile, reverse engineer, disassemble, or otherwise reduce the Software to a human-perceivable form. You may not rent,
lease or sublicense the Software. You may not modify the Software or create derivative works based upon the Software. Other than as set
forth above (license), you may not make or distribute copies of the Software, or electronically transfer the Software from one computer to
another or over a network. Any such unauthorized use shall result in immediate and automatic termination of this license and may result
in criminal and/or civil prosecution.
Ownership
The foregoing license gives you limited rights to use the Software. Leiden University retains all right, title and interest, including all
copyrights, in and to the Software and all copies thereof. All rights not specifically granted in this Agreement, including Federal and
International Copyrights, are reserved by Leiden University.
Use of produced and derived data
You may use data produced with (or derived from) running PermuCLUSTER in publications, presentations etcetera, provided you clearly
refer to the use of ’PermuCLUSTER’.
DISCLAIMER
This software ”PermuCLUSTER” is provided ”AS IS”, without any warranty, express or implied, for fitness for any particular
purpose, merchantability or non-infringement of rights of third parties. Whilst effort has been made, to ensure that this
software ”PermuCLUSTER” is accurate in all respects, no responsibility can be accepted for any loss, damage, injury or
any other occurrence relative to the use of this software. By using the software, the user accepts the entire risk arising out
of the use or performance of this software and documentation.
Contents
1 Introduction
2
2 Getting Started
2.1 Starting the program . . . . . . . . . . . . . . . . . . . . . . . . . . . . . .
2.2 System Requirements . . . . . . . . . . . . . . . . . . . . . . . . . . . . . .
2
2
2
3 Program Input
3.1 General Tab . . . . . . . . . . . .
3.1.1 Proximities . . . . . . . . .
3.1.2 Analyze Data . . . . . . . .
3.2 Options Tab . . . . . . . . . . . .
3.2.1 Permutation Randomization
3.2.2 Statistics . . . . . . . . . .
3.2.3 Plots . . . . . . . . . . . .
3.2.4 Save . . . . . . . . . . . . .
.
.
.
.
.
.
.
.
3
3
3
3
5
5
8
8
8
.
.
.
.
.
.
8
9
10
10
11
11
11
4 Program Output
4.1 Permutation Fit . . . . . . . .
4.2 Solution . . . . . . . . . . . . .
4.2.1 Fit . . . . . . . . . . . .
4.2.2 Object Order . . . . . .
4.2.3 Agglomeration Schedule
4.2.4 Dendrogram . . . . . .
.
.
.
.
.
.
.
.
.
.
.
.
.
.
.
.
.
.
.
.
.
. .
. .
. .
.
.
.
.
.
.
.
.
.
.
.
.
.
.
.
.
.
.
.
.
.
.
.
.
.
.
.
.
.
.
.
.
.
.
.
.
.
.
.
.
.
.
.
.
.
.
.
.
.
.
.
.
.
.
.
.
.
.
.
.
.
.
.
.
.
.
.
.
.
.
.
.
.
.
.
.
.
.
.
.
.
.
.
.
.
.
.
.
.
.
.
.
.
.
.
.
.
.
.
.
.
.
.
.
.
.
.
.
.
.
.
.
.
.
.
.
.
.
.
.
.
.
.
.
.
.
.
.
.
.
.
.
.
.
.
.
.
.
.
.
.
.
.
.
.
.
.
.
.
.
.
.
.
.
.
.
.
.
.
.
.
.
.
.
.
.
.
.
.
.
.
.
.
.
.
.
.
.
.
.
.
.
.
.
.
.
.
.
.
.
.
.
.
.
.
.
.
.
.
.
.
.
.
.
.
.
.
.
.
.
.
.
.
.
.
.
.
.
.
.
.
.
.
.
.
.
.
.
.
.
.
.
.
.
.
.
.
.
.
.
.
.
.
.
.
.
.
.
.
.
.
.
.
.
.
.
.
.
.
.
.
.
.
.
.
.
.
.
.
.
.
.
.
.
.
.
.
.
5 Frequently Asked Questions (FAQ)
5.1 How do I perform a cluster analysis using raw data? . . . . . . . . . . . .
5.2 How do I perform a cluster analysis using a proximity matrix? . . . . . .
5.3 How do I perform an SPSS CLUSTER equivalent analysis? . . . . . . . .
5.4 How do I inspect a solution (permutation) listed in the Permutation Fit
table that is not an optimal solution (permutation)? . . . . . . . . . . . .
5.5 How do I replicate an earlier performed analysis? . . . . . . . . . . . . . .
12
12
13
13
References
16
15
15
1
Introduction
Hierarchical cluster analysis as implemented in most of the well known statistical computer
programs neglects the phenomenon of input order instability. That is, cluster solutions may
differ when the rows and colums of the proximity matrix are permuted. This phenomenon
is not widely known and is caused by ties that are present in the initial (dis)similarity
matrix or arise during the process of clustering (Backeljau et al., 1996; Van der Kloot,
Bouwmeester, & Heiser, 2003). To tackle this phenomenon, PermuCLUSTER has been
developed. PermuCLUSTER repeats the analysis a large number of times by permuting
the rows and columns of the proximity matrix. In order to compare the solutions and find
the optimal solution, a goodness-of-fit measure is used. The number of times the matrix
should be permuted is variable and is user defined. PermuCLUSTER is an SPSS add-in
and offers all but the same functionality as CLUSTER in SPSS. The main exception is
that PermuCLUSTER cannot be run using the SPSS syntax command language. After
installation, PermuCLUSTER is accessible from the Analyze > Classify Menu in SPSS.
Generated output will be displayed in the SPSS Output Viewer.
2
Getting Started
2.1
Starting the program
After a typical installation, PermuCLUSTER can be started in two ways, i.e. from the
Windows Start Menu and from the Analyze > Classify Menu in SPSS. Note that PermuCLUSTER will only start up when an instance of SPSS is already running.
If PermuCLUSTER is not accessible from the Analyze > Classify Menu after installation, it can be added manually (registered) by running Add PermuCLUSTER To SPSS
Analyze Menu from the Start > Program Files > PermuCLUSTER Menu. This registration tool will add PermuCLUSTER for the current user and the default user (Windows
NT, Windows 2000 and Windows XP) on the system. After registration, restart SPSS to
see effect. As an alternative, PermuCLUSTER can be registered to SPSS as an add-in by
making use of the Menu Editor in SPSS, accessible from the Utilities Menu.
To unregister PermuCLUSTER, run Remove PermuCLUSTER From SPSS Analyze
Menu from the Start > Program Files > PermuCLUSTER Menu. This unregistration
tool will remove PermuCLUSTER for the current user and the default user on the system.
After unregistration, restart SPSS to see effect. Alternatively, it can be unregistered with
help of the Menu Editor in SPSS.
2.2
System Requirements
PermuCLUSTER will run on computer systems that meet the following minimum hardware
and software requirements:
• Windows 98, Windows ME, Windows NT 4.0, Windows 2000, or Windows XP.
2
• Pentium or Pentium-class processor.
• 16MB or more of random-access memory.
• Graphics adapter with 800 x 600 resolution (SVGA) or higher.
• SPSS 11.0 or higher.
3
Program Input
The input for PermuCLUSTER can be specified at the general and options tab (see Figure
1). The general tab contains the mandatory settings and the options tab the more optional
ones. After the settings have been specified the analysis can be started by clicking the OK
button.
3.1
General Tab
In PermuCLUSTER the same clustering methods are implemented as in SPSS (Anderberg,
1973). These are: between-groups linkage (between average), within-groups linkage (within
average), nearest neighbor (single linkage), furthest neighbor (complete linkage), centroid
clustering, median clustering and Ward’s method.
The Number of Permutations indicates how many sequential runs (repeated analyses)
should be performed (see Figure 1). In each run, the rows and colums of the original
proximity matrix will be permuted randomly. The first permutation can be the identity
permutation, see also Section 3.2.1.
If the first permutation is chosen to be the identity permutation, the outcome of the
first run will be equivalent to the outcome of a CLUSTER analysis in SPSS.
3.1.1
Proximities
The input data can be a raw data set as well as a proximity data set. If a raw data set is
specified then the set is converted by PermuCLUSTER to proximities using PROXIMITIES
in SPSS. The location of a proximity data set can be specified with help of the browse
button. Such a proximity data set should be in the SPSS SAV format (i.e. created with
PROXIMITIES or DISTANCES).
If a raw data set is taken as the input data, also the Analyze Data section should
specified, as described in the next section.
3.1.2
Analyze Data
With PermuCLUSTER cases as well as variables can be clustered. See Figure 2 and the
next three sections for the Variables, Measure and Standardize settings.
3
Figure 1: General Tab
4
3.1.2.1 Variables The leftmost listbox will contain the numeric and text variables
as specified in the SPSS Data View. Variables to be clustered (or for which cases are to
be clustered) must be placed in the Variable(s) listbox at the right. If cases are to be
clustered, also a label variable can be specified. It must be placed in the Label Cases by
listbox, see Figure 2.
Figure 2: Analyze Data : Variables
3.1.2.2 Measure PermuCLUSTER supports all interval, counts and binary measures
which can also be analyzed by SPSS Hierarchical Cluster Analysis (see Figure 3). These
measures can also be transformed. See SPSS documention (SPSS Inc., 2001) for an elaboration on the different measures and transformation.
3.1.2.3 Standardize PermuCLUSTER supports all standardization methods that can
also be found in SPSS (see Figure 4). Consult the SPSS documentation for more information.
3.2
Options Tab
In PermuCLUSTER options can be set regarding the input and output of an analysis, see
Figure 5 and the next four sections for more information.
3.2.1
Permutation Randomization
Options regarding permutation randomization can be set here. With first permutation
is identity one can indicate whether or not the the original proximity matrix should be
5
Figure 3: Analyze Data : Meausure
Figure 4: Analyze Data : Standardize
6
Figure 5: Options Tab
7
permuted randomly at the first run. The matrix will not be permuted at the first run if
the first permutation is the identity. In that case, the first run will analyze the data in
their original order, which will produce the same solotion as an analysis by SPSS. With
random and custom seed one can indicate whether or not the seed to initialize the random
generator should be randomly chosen (based on the current time) or will be custom (based
on input). The random generator is used to generate the random permutations for each run
in an analysis. Enabling the custom seed option may be useful in an attempt to replicate
an earlier performed analysis, see also Section 4.1 and 5.5.
3.2.2
Statistics
The following output related options can be set here: proximity matrix, permutation fit,
object order and agglomeration schedule.
With proximity matrix one can indicate whether or not the proximity matrix will be
displayed in the SPSS Output Viewer. This option is only available when analysing a raw
data set.
The option permutation fit indicates whether or not a table will be displayed in the SPSS
Output Viewer containing for each permutation (run) the solution identifier (Solution ID),
squared sum of differences (SSDif), normalized squared sum of differences (Normalized
SSDif), cophenetic correlation coefficient (Cophenetic Correlation) and random seed.
The option object order indicates whether or not an overview will be displayed in the
SPSS Output Viewer of the order in the permuted proximity matrix of the objects to be
clustered for each optimal solution.
The option Agglomeration schedule indicates whether or not the agglomeration schedule
will be displayed in the SPSS Output Viewer.
3.2.3
Plots
The the option dendrogram indicates whether or not a dendrogram will be displayed in the
SPSS Output Viewer for each found optimal solution.
3.2.4
Save
The option Permutation fit table indicates whether or not to save the permutation fit table
to disk. The table will be written in the SPSS SAV format and will contain the following
columns: permu (permutation), sid (solution id), ssdif (sum of squared differences), nssdif (normalized sum of squared differences), cophcorr (cophenetic correlation coefficient),
randseed (random seed).
4
Program Output
The output that PermuCLUSTER generates will appear in the SPSS Output Viewer. By
default, there will be output for Fit and Solution. The solution related output may appear
8
multiple times and consists of fit, object order, agglomeration schedule and dendrogram.
Which of these items should appear can be indicated with help of the statistics and plot
options, see Section 3.2.2 and 3.2.3. Note that depending on the number of permutations
and settings of the ouput options, generating output in the SPSS Output Viewer can be
time consuming.
Besides this also the permutation fit table can be output to disk, see Section 3.2.4.
4.1
Permutation Fit
The permutation fit table contains the following columns: Permutation, Solution ID, SSDif,
Normalized SSDif, Cophenetic Correlation and Random Seed, see Table 1.
Table 1: Permutation Fit
The permutation column displays the permutation or run number to which the other
values in corresponding table row relate. In Table 1 the first permutation is the idenity
permutation.
The solution identifier (Solution ID) is a summary of the solution for a given permutation based on the agglomeration schedule of that solution and is cluster method independent. Solutions with the same solution id have the same agglomeration schedule and
therefore are equal 1 .
The sum of squared differences (SSDif) between the distances dij in the proximity
matrix and the cophenetic or ultrametric distances cij in the solution is used as a goodnessof-fit measure in order to compare solutions, see Equation 1. The lower the sum, the better
the fit.
1
In theory it is possible that two different agglomeration schedules yield the same solution identifier,
however the probability for this to happen is negligible.
9
SSDIF =
XX
i
(dij − cij )2
(1)
j>i
The normalized sum of squared differences (Normalized SSDif) is the normalized version
of SSDif. Normalization was done by dividing SSDif by the sum of the squared distances in
the proximity matrix, see Equation 2. Note that the Normalized SSDif is not constrained
to be less or equal to 1.
P P
SSDIF N =
i
j>i
(dij − cij )2
2
j>i dij
P P
i
(2)
The cophenetic correlation coefficient (Cophenetic Correlation) is the product moment
correlation between the distances in the proximity matrix and the cophenetic or ultrametric
distances in the solution.
The random seed (Random Seed) describes the state of the random generator which
generated the permutation. Feeding a permutation’s random seed back into the random
generator will reproduce the permutation. This is useful when performing experiments,
see also Section 3.2.1.
4.2
Solution
In case of only one optimal solution this item will be listed only once. In case of multiple
optimal solutions this item will be listed for each of the optimal solutions.
4.2.1
Fit
The fit table contains the Solution ID, SSDif, Normalized SSDif, Cophenetic Correlation
and Random Seed for the optimal solution, see Table 2. This is an exact copy of the
corresponding row in the permutation fit table, see Section 4.1.
Table 2: Fit
10
4.2.2
Object Order
The object order table contains the order of the objects to be clustered in the original
proximity matrix after they have been permuted, see Table 3.
Table 3: Object Order
4.2.3
Agglomeration Schedule
The agglomeration schedule lists which clusters are combined at each stage in the clustering
process, together with other useful information e.g. fusion coefficients (merge value), see
Table 4.
Table 4: Agglomeration Schedule
4.2.4
Dendrogram
The dendrogram gives a visual presentation of the agglomeration schedule, see Figure 6.
Note that the coefficients are translated into values between 1 and 25.
11
Figure 6: Dendrogram
5
Frequently Asked Questions (FAQ)
5.1
How do I perform a cluster analysis using raw data?
1. Start SPSS.
2. Load the raw data set into the SPSS Data View.
3. Start PermuCLUSTER from the Analyze > Classify menu.
4. On the General Tab:
(a) Specify the Cluster Method which should be used.
(b) Specify the Number of Permutations which should be performed.
(c) Select Analyze original data in SPSS Data View.
(d) In the Analyze data section:
i. On the Variables Tab:
A. Specify if cases or variables should be clustered.
B. Specify the variables you want to analyze by moving them to the Variable(s) listbox.
C. Optional: If cases are to be clustered, specify the label variable in the
Label Cases by listbox.
ii. On the Measure Tab:
A. Specify the distance measure to be used.
B. Optional: Specify one or more transformations.
iii. On the Standardize Tab:
A. Specify the standardization method to be used.
12
B. Specify if standardization should be performed on cases or variables.
5. On the Options Tab:
(a) Further finetune the analysis and outcome by setting options, see Section 3.2
for a description of all available options.
6. Click the OK button to start the analysis.
5.2
How do I perform a cluster analysis using a proximity matrix?
1. Start SPSS.
2. Start PermuCLUSTER from the Analyze > Classify menu.
3. On the General Tab:
(a) Specify the Cluster Method which should be used.
(b) Specify the Number of Permutations which should be performed.
(c) Select Read and analyze a with SPSS Proximities created matrix.
(d) Specify the location of the proximity matrix with help of the browse button.
Note: The proximity matrix should be in the SPSS SAV format (i.e. created
with PROXIMITIES or Distances).
4. On the Options Tab:
(a) Further finetune the analysis and outcome by setting options, see Section 3.2
for a description of all available options.
5. Click the OK button to start the analysis.
5.3
How do I perform an SPSS CLUSTER equivalent analysis?
In case of analyzing raw data:
1. Start SPSS.
2. Load the raw data set into the SPSS Data View.
3. Start PermuCLUSTER from the Analyze > Classify menu.
4. On the General Tab:
(a) Specify the Cluster Method which should be used.
(b) Set the Number of Permutations to 1.
13
(c) Select Analyze original data in SPSS Data View.
(d) In the Analyze data section:
i. On the Variables Tab:
A. Specify if cases or variables should be clustered.
B. Specify the variables you want to analyze by moving them to the Variable(s) listbox.
C. Optional: If cases are to be clustered, specify the label variable in the
Label Cases by listbox.
ii. On the Measure Tab:
A. Specify the distance measure to be used.
B. Optional: Specify one or more transformations.
iii. On the Standardize Tab:
A. Specify the standardization method to be used.
B. Specify if standardization should be performed on cases or variables.
5. On the Options Tab:
(a) Enable option First permutation is identity in section Permutation Randomization.
(b) Further finetune the analysis and outcome by setting options, see Section 3.2
for a description of all available options.
6. Click the OK button to start the analysis.
In case of analyzing a proximity matrix:
1. Start SPSS.
2. Start PermuCLUSTER from the Analyze > Classify menu.
3. On the General Tab:
(a) Specify the Cluster Method which should be used.
(b) Set the Number of Permutations to 1.
(c) Select Read and analyze a with SPSS Proximities created matrix.
(d) Specify the location of the proximity matrix with help of the browse button.
Note: The proximity matrix should be in the SPSS SAV format (i.e. created
with PROXIMITIES or Distances).
4. On the Options Tab:
(a) Enable option First permutation is identity in section Permutation Randomization.
14
(b) Further finetune the analysis and outcome by setting options, see Section 3.2
for a description of all available options.
5. Click the OK button to start the analysis.
5.4
How do I inspect a solution (permutation) listed in the Permutation Fit table that is not an optimal solution (permutation)?
1. Select in the Permutation Fit table in the SPSS Output View the Random Seed value
for the permutation/solution you want to inspect and copy it to the clipboard.
2. Go to the SPSS Data View.
3. Start PermuCLUSTER from the Analyze > Classify menu.
4. On the General Tab:
(a) Set the Number of Permutations to 1.
(b) Make sure that the other settings are exactly the same as in the analysis to
which the Permutation Fit table in step 1 belongs.
5. On the Options Tab:
(a) In section Permutation Randomization:
i. Disable option First permutation is identity.
ii. Enable option Custom Seed and paste the Random Seed you copied to the
clipboard.
(b) Further finetune the analysis and outcome by setting options, see Section 3.2
for a description of all available options.
6. Click the OK button to start the analysis.
5.5
How do I replicate an earlier performed analysis?
1. Select in the Permutation Fit table in the SPSS Output View the first listed Random
Seed value and copy it to the clipboard. If the first permutation is the identity
permutation, this will be the random seed of the second permutation. If the first
permutation is not the identity, this will be the random seed of the first permutation.
2. Go to the SPSS Data View.
3. Start PermuCLUSTER from the Analyze > Classify menu.
4. On the General Tab:
15
(a) Make sure that the settings are exactly the same as in the analysis to which the
Permutation Fit table in step 1 belongs.
5. On the Options Tab:
(a) Make sure that the settings are exactly the same as in the analysis to which the
Permutation Fit table in step 1 belongs.
(b) Enable option Custom Seed and paste the Random Seed you copied to the clipboard.
6. Click the OK button to start the analysis.
References
Anderberg, M. (1973). Cluster analysis for applications. New York: Academic Press.
Backeljau, T., De Bruyn, L., De Wolf, H., Jordaens, K., Van Dongen, S., & Winnepenninckx, B. (1996). Multiple UPGMA and neighbour joining trees and the performance
of some computer packages. Molecular Biology and Evolution, 13, 309-313.
SPSS Inc. (2001). SPSS base 11.0: User’s guide. Chicago, Ill.: SPSS Inc.
Van der Kloot, W., Bouwmeester, S., & Heiser, W. (2003). Cluster instability as a result
of data input order. In H. Yanai, A. Okada, K. Shigemasu, Y. Kano, & J. Meulman
(Eds.), New developments in psychometrics: Proceedings of the international meeting
of the psychometric society IMPS2001 (p. 569-576). Tokyo: Springer.
16