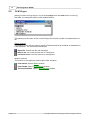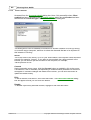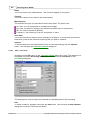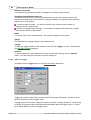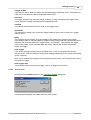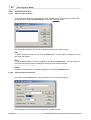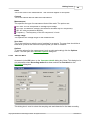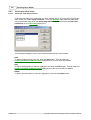
1
PicoLog
Data logger software
User guide
Copyright 2005 Pico Technology Limited. All rights reserved.
PLW044-1.5
I
PicoLog User Guide
Table of Contents
1 Introduction
.............................................................................................3
...................................................................................................3
1 Online help
2 Overview ...................................................................................................3
3 Recording...................................................................................................3
...................................................................................................4
4 Types of measurement
...................................................................................................5
5 Legal information
...................................................................................................6
6 Safety warning
.............................................................................................7
2 PicoLog components
...................................................................................................7
1 Introduction
...................................................................................................8
2 PLW Recorder
...................................................................................................9
3 PLW Player
...................................................................................................10
4 PLW Graph
...................................................................................................11
5 PLW XY Graph
...................................................................................................12
6 Spreadsheet
7 Notes
3 How to...
...................................................................................................14
.............................................................................................15
1 Add new...................................................................................................15
measurements
...................................................................................................15
2 Select which measurements to display
...................................................................................................15
3 Start a new
run
...................................................................................................16
4 Repeat an
existing run
...................................................................................................16
5 Start recording
...................................................................................................17
6 Display data
...................................................................................................17
7 Print data
...................................................................................................18
8 Export data
to a spreadsheet
9 Export a ...................................................................................................18
graph to a word processor
...................................................................................................18
10 Enable date and time scaling on a graph
...................................................................................................19
11 Transfer
data over an IP network
...................................................................................................20
12 Run multiple
recorders
4 Menu bar
.............................................................................................21
1 File
...................................................................................................21
2 Settings ...................................................................................................22
3 View
...................................................................................................23
4 Help
...................................................................................................24
...................................................................................................24
5 Keyboard
shortcuts
5 Dialog boxes .............................................................................................25
...................................................................................................25
1 General dialog
boxes
...................................................................................................47
2 Hardware configuration
PLW044-1.5
Copyright 2005 Pico Technology Limited. All rights reserved.
Contents
II
.............................................................................................101
6 Equipment overview
...................................................................................................101
1 ADC-10/12/40/42
...................................................................................................101
2 ADC-11/22
3 ADC-16...................................................................................................101
...................................................................................................102
4 ADC-100/101
...................................................................................................102
5 ADC-200
...................................................................................................102
6 PicoScope
2000 Series
...................................................................................................103
7 PicoScope
3000 Series
8 Demo ...................................................................................................103
9 DrDAQ ...................................................................................................104
10 RH-02...................................................................................................104
...................................................................................................104
11 HumidiProbe
...................................................................................................105
12 USB TC-08
13 Serial ...................................................................................................105
TC-08
14 TH-03...................................................................................................105
...................................................................................................105
15 IP sockets
16 Signal...................................................................................................106
conditioners
.............................................................................................107
7 Technical information
...................................................................................................107
1 .ini preferences
file
...................................................................................................108
2 .plw data
file
...................................................................................................108
3 .pls settings
file
4 Scaling ...................................................................................................109
file
...................................................................................................110
5 Signal conditioner
file
...................................................................................................110
6 Command
line options
7 Multiple...................................................................................................111
program instances
8 DDE
...................................................................................................111
...................................................................................................112
9 Equation
notation
...................................................................................................113
10 Glossary
Index
......................................................................................................115
Copyright 2005 Pico Technology Limited. All rights reserved.
PLW044-1.5
PicoLog User Guide
3
1
Introduction
1.1
Online help
All the dialog boxes and windows in PicoLog have some associated help information. To
receive help in the context of a dialog box, click the Help button on the dialog box. To
receive help in the context of a window, click . For a step-by-step introduction to the
software, select Guided tour from the Help menu. Alternatively, with the help file open,
do one of the following:
Click on the Contents tab and choose a chapter for browsing
Click on the Index tab and search on a keyword
Move on to the next topic by clicking the >> button
1.2
Overview
PicoLog is a data acquisition tool that collects, records, displays and analyses
measurement data. It has the following capabilities:
Supports any Pico Converter
Will collect blocks of data at high speed from a single converter
Will collect data at low speed over long periods from multiple converters
Allows you to adjust Alarm settings for measurements you want to take
Enables you to apply Parameter scaling, using equations or tables
Includes built-in scaling for any Pico Signal Conditioner
Allows you to Edit calculated parameter
Can analyse other files during data collection
Displays data during slow collection and after collection
Graphical display, if you activate the PLW XY Graph window or PLW Graph window,
and spreadsheet display if you activate the PLW Spreadsheet window
Will transfer data to other applications via clipboard, file or DDE
Will transfer data between computers using IP sockets
1.3
Recording
The recording mode and repeat functions are selected using the Recording dialog box.
PicoLog can record in the following ways:
Real time continuous
This offers continuous recording over long periods. The data can be displayed in
graphical or spreadsheet format during data collection. The fastest sampling rate in
realtime mode depends on the speed of the computer and the operating system (it is of
the order of a few milliseconds).
Streaming (single converter only)
This mode records data continuously over long periods, but allows more accurate
timing than real time continuous mode. Only the PicoScope 2000 series and 3000
series converters support streaming mode.
PLW044-1.5
Copyright 2005 Pico Technology Limited. All rights reserved.
Introduction
4
In streaming mode, the converter transfers data in blocks and the program updates the
display only at the end of each block. This means that the display does not update as
smoothly as in real time continuous mode. When the sampling rate is very slow, the
time between screen updates can be several seconds.
Fast block (single converter only)
This is used to collect a relatively short block of data at high speed. It is not possible to
display data during block mode recording. In block mode, it is possible to start
recording on a trigger event. If the 'repeat immediately' option is selected, it is possible
to write a run file for each occurrence of the trigger event.
There are several options to specify what should happen at the end of a run when the
specified maximum number of samples have been collected. The options are as follows:
Stop
Repeat immediately
Scroll
Repeat after delay
Note: When PicoLog is installed with DrDAQ, the recording mode is fixed at Real time
continuous, and the repeat functions are not available.
1.4
Types of measurement
PicoLog can log up to 100 different types of measurement at the same time. These
measurements can be made up of a variety of readings:
Single readings, normally in volts, measured by a converter
Multiple values obtained by analysing a set of converter measurements, for example,
AC voltage or frequency
Calculated values derived from one or more converter measurements, for example,
power calculated from amperes x volts
Values obtained from a set of readings take some time to measure, so they can only be
used in Real time continuous mode, when the sample time is greater than
QuickSampleMs.
Measurements are added by first selecting a converter, then specifying what the channels
on the converter are to be used for. Different converters have different settings, so the
dialog boxes to set up a measurement are different for each converter. The fast
converters have three different dialog boxes: one for real time mode, one for block mode
and one for streaming mode.
The following options apply to all converters:
Parameter options: range, unit and decimal place preferences
Alarm settings
Signal Conditioner options
Parameter scaling: scaling for other types of sensor, using table lookup or equations
Copyright 2005 Pico Technology Limited. All rights reserved.
PLW044-1.5
PicoLog User Guide
5
1.5
Legal information
The material contained in this release is licensed, not sold. Pico Technology Limited
grants a licence to the person who installs this software, subject to the conditions listed
below.
Access
The licensee agrees to allow access to this software only to persons who have been
informed of these conditions and agree to abide by them.
Usage
The software in this release is for use only with Pico products or with data collected using
Pico products.
Copyright
Pico Technology Limited claims the copyright of, and retains the rights to, all material
(software, documents etc) contained in this release. You may copy and distribute the
entire release in its original state, but must not copy individual items within the release
other than for backup purposes.
Liability
Pico Technology and its agents shall not be liable for any loss, damage or injury,
howsoever caused, related to the use of Pico Technology equipment or software, unless
excluded by statute.
Fitness for purpose
No two applications are the same: Pico Technology cannot guarantee that its equipment
or software is suitable for a given application. It is your responsibility, therefore, to ensure
that the product is suitable for your application.
Mission-critical applications
This software is intended for use on a computer that may be running other software
products. For this reason, one of the conditions of the licence is that it excludes usage in
mission-critical applications, for example life-support systems.
Viruses
This software was continuously monitored for viruses during production, but you are
responsible for virus-checking the software once it is installed.
Support
If you are dissatisfied with the performance of this software, please contact our technical
support staff, who will try to fix the problem within a reasonable time scale. If you are still
dissatisfied, please return the product and software to your supplier within 28 days of
purchase for a full refund.
Upgrades
We provide upgrades, free of charge, from our web site at www.picotech.com. We
reserve the right to charge for updates or replacements sent out on physical media.
Trademarks
Windows is a registered trademark of Microsoft Corporation. Pico Technology Limited and
PicoLog are internationally registered trade marks.
PLW044-1.5
Copyright 2005 Pico Technology Limited. All rights reserved.
Introduction
1.6
6
Safety warning
On all ADCs except the ADC-101, the ground input of the ADC is connected directly to
the ground of your computer in order to minimise electrical interference.
Do not connect the ground input of the ADC to anything which may be at some voltage
other than ground, as you may risk damage to the ADC and your computer. Furthermore,
if you connect the ADC ground to something which is live, your computer chassis may
become live.
If in doubt, check by connecting a channel input to the doubtful ground point, and check
that there is no significant AC or DC voltage.
Copyright 2005 Pico Technology Limited. All rights reserved.
PLW044-1.5
PicoLog User Guide
7
2
PicoLog components
2.1
Introduction
PicoLog is made up of a number of separate components but you need only activate the
components that you wish to use. As a result, the screen is not cluttered with data that
you are not using and the computer can easily be used for other applications whilst you
are recording.
The application components that are available are as follows:
PLW Recorder
Enables you to start and stop recording and to specify recording files, the measurements
currently being taken and the alarm state.
PLW Player
Enables you to scroll quickly and easily through stored files to compare results on
successive runs.
PLW Graph
Shows the readings for single or multiple measurements over a period of time.
PLW XY Graph
Shows the readings of one measurement against another, on the same graph.
Spreadsheet
Shows detailed or summary information in a format which can be copied to a clipboard.
Notes
Enables you to enter information for a particular run.
When you start PicoLog in recorder mode, the computer displays the recorder application.
The player application and display windows can be selected from the Window menu.
When you start PicoLog in player mode, the computer displays the player application. The
recorder application and display windows can be selected from the Window menu.
PLW044-1.5
Copyright 2005 Pico Technology Limited. All rights reserved.
PicoLog components
2.2
8
PLW Recorder
When you start PicoLog using the Recorder icon, the computer displays the monitor
window, which looks like this:
At the top is a menu bar containing the File, Settings, View and Help menus. Below the
menu bar are two sets of controls, the Recorder controls and the Window controls.
Recorder controls
- New file. Specify a new file to record to.
- Re-record. Rewind the current file so that it can be re-recorded.
- Start recording.
- Pause/resume.
- Stop recording.
- Help. Access the help information for the recorder window (this page).
Window controls
The second group of buttons, on the right, is used to open other windows:
- View Notes. Open a Notes window.
- View Graph. Open a PLW Graph window.
- View spreadsheet. Open a Spreadsheet window.
Range indicators
The lower pane of the window contains a line of information for each selected
measurement. At the beginning of each line is an indicator lamp that signals the current
status of the readings taken by PicoLog:
- The measurement value is within range
- The measurement value is currently out of range, but has not been out of range long
enough to trigger an alarm
- The measurement value is in an alarm state. To cancel the alarm, use the mouse to
click on the lamp
- The measurement value is in an alarm state, but the alarm has been cancelled
Next to each lamp is the name of the measurement and its current value. If you click on a
measurement name, the computer will display the details of the measurement.
Copyright 2005 Pico Technology Limited. All rights reserved.
PLW044-1.5
PicoLog User Guide
9
2.3
PLW Player
When you start PicoLog Player, or you select Player from the View menu of PicoLog
Recorder, the computer opens a new window like this:
This shows you the name of the current Player File and the number of samples taken so
far.
Player controls
The buttons on the left are used to specify a filename and to go forwards or backwards in
a file sequence. The controls are as follows:
- Open file. Load a new file into the player.
- Back a file. Go to the previous file in a sequence.
- Forwards a file. Go to the next file in a sequence.
Window controls
The buttons on the right are used to open other windows:
- View Notes. Open a Notes window.
- View Graph. Open a PLW Graph window.
- View spreadsheet. Open a Spreadsheet window.
PLW044-1.5
Copyright 2005 Pico Technology Limited. All rights reserved.
PicoLog components
2.4
10
PLW Graph
From the View menu of PicoLog Recorder or Player, select Graph.
Note that there are several graph options that affect the way that the graph is displayed
and the format of the axis scales.
The group of horizontal buttons in the top right corner of the screen selects what time
interval is displayed:
- Scroll left. Move a whole display left.
- Scroll quarter left. Move a quarter display left.
- Expand horizontal axis. Magnify the middle half of the display to fill the whole
width.
- Shrink horizontal axis. Shrink the current display to half size, so that more is
displayed before and after.
- Scroll quarter right. Move a quarter display right.
- Scroll right. Move a whole display right.
The upper group of vertical buttons controls the vertical range displayed. If there is more
than one graph frame, the buttons control the frame with the thicker border. To switch to a
different frame, point inside the new frame with the cursor and click the left mouse button.
- Scroll up. Move a whole display up.
- Expand vertical axis. Magnify the middle half of the display to fill the whole height.
- Shrink vertical axis. Shrink the current display height to half size, so that more is
displayed above and below.
- Scroll down. Move a whole display down.
Note that if you use these controls to change the time or vertical range, auto-scaling for
that axis is turned off automatically. Use the options to turn auto-scaling back on again
(see button below).
Copyright 2005 Pico Technology Limited. All rights reserved.
PLW044-1.5
PicoLog User Guide
11
The remaining vertical controls are:
- Copy to clipboard. Copy the graph to the clipboard.
- Print view. Print the graph.
- New file. Write graph to file in .bmp, .jpg, or .wmf format.
- Select channels. Select the measurements to display on the graph.
- View options. Specify the options for the graph.
- Help. Access the help info for the graph window (this page).
If you move the mouse cursor onto the graph part of the screen, the computer will display
the measurement value and time at the current cursor position. If you click the left mouse
button, the graph will zoom in, centred on the mouse cursor. If you click the right mouse
button, the graph will zoom out, centred on the mouse cursor.
2.5
PLW XY Graph
From the View menu of PicoLog Recorder or Player, select XY Graph.
There are several buttons in the top right corner of the screen. The top row of buttons
controls the horizontal range displayed:
- Scroll quarter left. Move a quarter display left.
- Expand horizontal axis. Magnify the middle half of the display to fill the whole
width.
- Shrink horizontal axis. Shrink the current display to half size, so that more is
displayed.
- Scroll quarter right. Move a quarter display right
PLW044-1.5
Copyright 2005 Pico Technology Limited. All rights reserved.
PicoLog components
12
The upper group of buttons in the column on the right controls the vertical range
displayed:
- Scroll up. Move a whole display up.
- Expand vertical axis. Magnify the middle half of the display to fill the whole height.
- Shrink vertical axis. Shrink the current display height to half size, so that more is
displayed above and below.
- Scroll down. Move a whole display down.
Note that if you use these controls to change the horizontal or vertical range, auto-scaling
for that axis is turned off automatically. Use the options to turn auto-scaling back on again
(see buttons below).
The remaining vertical controls are:
- Copy to clipboard. Copy the graph to the clipboard.
- Print view. Print the graph.
- Select channels. Select the measurements to display on the XY graph (only two).
- View options. Specify the options for the graph.
- Help. Access the help info for the graph window (this page).
If you move the mouse cursor onto the graph part of the screen, the computer will display
the measurement values at the current cursor position.
2.6
Spreadsheet
From the View menu of PicoLog Recorder or Player, select Spreadsheet.
There is one line for each reading. The first column shows the time in seconds, while the
remaining columns show the selected measurements.
Copyright 2005 Pico Technology Limited. All rights reserved.
PLW044-1.5
PicoLog User Guide
13
The following options buttons are available:
- Select channels. Select the measurements to display.
- View options. Spreadsheet options specify whether to display individual readings,
or first reading, average, minimum and maximum for a period.
If you select a range of readings, you can use the following buttons:
- Write to disk. Write the readings to a print file (.prn) or a text file (.txt) - Both are tab
separated value files.
- Copy to clipboard. Write the readings to the clipboard.
- Print view. Print the graph.
You can select a range in one of three ways:
If all of the readings that you want to select are on the screen:
Point the mouse at the first reading
Press and hold down the left mouse button
Drag the mouse to the last reading (the selected readings will be highlighted as you
go) and
Release the left mouse button.
If the readings are a long way apart:
Point the mouse at first reading
Click the left mouse button (this will highlight the first reading)
Scroll down to the last reading
Point at the last reading and
Press the shift key and click the left mouse button.
If you wish to select all of the readings for one day:
Point the mouse at any reading during the required day
Click the left mouse button (this will highlight the reading) and
Click on the 'select day' icon:
PLW044-1.5
Copyright 2005 Pico Technology Limited. All rights reserved.
PicoLog components
2.7
14
Notes
From the View menu of PicoLog Recorder or Player, select Notes.
This window enables you to enter information for a particular run. This is useful if you
carry out a number of similar runs. The report title can be the same for every run, but the
notes contain information specific to each run.
If you have a Notes window open when you use the player to browse through several
runs, the notes for each run will be displayed. The notes also appear on printed reports.
Copyright 2005 Pico Technology Limited. All rights reserved.
PLW044-1.5
PicoLog User Guide
15
3
How to...
3.1
Add new measurements
If you are using a Pico signal conditioner, see Signal Conditioners.
If you are using some other sensor:
1. Select the converter in the normal way
2. At the measurement list dialog box, select Add (for the ADC-16, for example, this
would be the ADC16 Channels dialog box)
3. Enter the details for the measurement
4. Click the Options button
5. Click the Scaling button
6. Enter the scaling details (see Parameter scaling dialog box for details).
3.2
Select which measurements to display
When you first open a graph or spreadsheet window, the computer displays only the first
measurement. To select a different measurement or to add further measurements:
1. Click on the Select channels button: . The computer will display the
Select parameters dialog box, with a list of all of the
measurements and which ones are in use
2. Click on each measurement that you wish to be active
3. Click the OK button
3.3
Start a new run
To start a new run from scratch, select New settings from the File menu. PicoLog will
take you through the steps necessary to define what you want to collect:
Recording method (real time continuous, streaming or fast block) - not applicable on
DrDAQ
Sampling Rate, including sampling interval and maximum number of samples
Converter details
Measurement setup. If you are using the ADC-11, for example, the computer will
display the Edit AD11 Measurement dialog box
Once you have entered these details, check that the monitor window in PLW Recorder is
displaying the measurements that you wish to record, and that the correct values are
showing.
1. If you are in PicoLog Player, from the View menu, select Recorder, otherwise go
straight to step 2
2. The PLW Recorder window has buttons like a tape recorder, to start, stop, rewind etc.
3. Click on the New file button:
4. Type in the name of the file to which you wish to record
5. Click OK (the filename will appear in the recorder window)
6. Click on the Start recording button:
The sample number will increase every sample interval
PLW044-1.5
Copyright 2005 Pico Technology Limited. All rights reserved.
How to...
3.4
16
Repeat an existing run
If you have just recorded a run, and you wish to retain the data, yet start a new run:
1.
2.
3.
4.
Click on the New file button: . Note: Do not attempt to save your data directly to a
floppy disk. The computer will display the next sequence-numbered file name.
If you do not wish to use the default filename, type in a different name.
Click OK
Click on the Start recording button:
If you have just recorded a run, and you wish to discard the data and start a new run:
1.
2.
Click on the Re-record button:
Click on the Start recording button:
If you wish to repeat a run that you did some time previously:
1.
2.
3.
4.
3.5
From the File menu, select Open.
Select the file that you wish to repeat.
From the View menu, select Recorder. This displays the recorder window.
Proceed according to the retain or discard options described above.
Start recording
This is what you have to do to save the settings for the type of run that you wish to start:
1.
2.
3.
4.
5.
Define the type of run that you wish to carry out
Select Save as... from the File menu
Type in a filename for these settings
Change the file type to .pls
Click OK
Note: Do not attempt to save your data directly to a floppy disk.
Under Windows 95 or higher:
1.
2.
3.
4.
5.
6.
7.
8.
Click the Start button
Select Settings
Select Taskbar and Start Menu
Click Start Menu
Click Add
Type in c:\PICO\plw32.exe -r fred.pls (or whatever your settings file is called)
and click OK
Select the startup folder (programs in the startup folder are run automatically when
Windows starts) and click OK
Click the Finish button
Copyright 2005 Pico Technology Limited. All rights reserved.
PLW044-1.5
PicoLog User Guide
17
3.6
Display data
To display the data in graphical or spreadsheet format, you should first Start a new run.
You can then display the data by clicking on the appropriate button in the recorder
window:
- View Notes. Opens a Notes window.
- View Graph. Opens a Graph window.
- View spreadsheet. Opens a Spreadsheet window.
Alternatively, select the window type from the View menu.
3.7
Print data
To print a graph:
1.
2.
3.
Open a graph window
Alter the settings to display the data that you wish to print
Click on the Print view button:
To print a spreadsheet:
1.
2.
3.
4.
5.
6.
7.
PLW044-1.5
Open a spreadsheet window
Alter the settings to display the measurements that you wish to print
Point at the first reading that you wish to print
Click the left mouse button to highlight the reading
Point at the last reading that you wish to print
Hold down the shift key and click the left mouse button to highlight the whole block
Click on the Print view button:
Copyright 2005 Pico Technology Limited. All rights reserved.
How to...
3.8
18
Export data to a spreadsheet
To export data to a spreadsheet:
1.
2.
3.
4.
5.
6.
Open a PicoLog spreadsheet window
Alter the settings to display the measurements that you wish to export
Point at the first reading that you wish to print
Click the left mouse button (this reading will be highlighted)
Point at the last reading that you wish to print
Hold down the shift key and click the left mouse button (the whole block will be
highlighted)
7. Click on the Copy to clipboard button:
8. Move to the spreadsheet program
9. Point at the top left of the area you wish to fill and
10. Select Paste from the Edit menu.
Alternatively, you can click on the New file button, , then write the data to a text file.
You can then import the text file into a spreadsheet.
Note: Do not attempt to save your data directly to a floppy disk.
If you wish to have the readings in the spreadsheet updated continuously with the current
readings, you can use DDE.
3.9
Export a graph to a word processor
To export a graph to a word processor:
1.
2.
3.
4.
5.
6.
Open a graph window.
Alter the settings to display the graph that you wish to export.
Click on the Copy to clipboard button:
.
Move to the word processor program.
Point at the place to insert the picture.
Select Paste from the Edit menu.
Note: Do not attempt to save your data directly to a floppy disk.
Alternatively, you can click on the New file button: , then write the data to a .wmf file.
You can then import the graphics file into the word processor.
3.10
Enable date and time scaling on a graph
The time axis of a graph normally shows the time (in the selected sample interval units)
since the start of the run. Whilst this is convenient for short runs, it is not ideal when
collecting data over longer periods.
1. Click on the View options button:
2. Change the time format to Date/Time
Other axis scale formats can be selected in the same way - see the Graph options
dialog box for more details.
Copyright 2005 Pico Technology Limited. All rights reserved.
PLW044-1.5
PicoLog User Guide
19
3.11
Transfer data over an IP network
The PicoLog IP socket facility is used to take measurements on one or more computers,
and record the data on another computer.
The measurements are taken by PicoLog on the Server. Another computer, the Client,
requests the data via an IP network.
On the server:
1.
2.
3.
4.
Click Start
Select Run...
Type in winipcfg.exe
Note the server name
On the client:
1.
2.
3.
4.
Open a DOS box
Type in ping followed by the server name
The computer will display the time taken to send a message to the server and receive
a response
Check that it is working and note the time
On the server:
1.
2.
3.
4.
5.
6.
Start up PicoLog
From the File menu, select Preferences
Select IP Sockets
Check the Enable Server box
Click OK
Set up PicoLog to measure the channels that you require
On the client:
1.
2.
3.
4.
5.
6.
7.
8.
9.
10.
11.
12.
13.
14.
15.
16.
17.
18.
19.
20.
PLW044-1.5
Start PicoLog
From the File menu, select Preferences
Select IP Sockets
Check the Enable Client box
Exit and restart PicoLog
Select New Settings
Enter recording details and click OK
Enter the sampling details and click OK
Select Socket in the converter type combo box
Click OK
Type in the server name, eg fred
Note: Server names are case sensitive! Fred is not the same as fred
Click Connect
The computer should now display the channels from the server
Click on one of the channels
If you want to change the name, type in the local name
Click OK
The channel you selected is marked with an X
Repeat for each of the channels
Click OK
The monitor window should now display the readings from the server
Copyright 2005 Pico Technology Limited. All rights reserved.
How to...
3.12
20
Run multiple recorders
There are two limitations to using the multiple converters mode in PicoLog:
Data is collected at the same rate for each device
A single trigger will start the recording for all converters
If you need to overcome these limitations, two separate instances of PicoLog Recorder
can be loaded. If you have tried this previously, you will have noticed that simply
attempting to load PicoLog Recorder from the Start menu twice will load PicoLog Player.
You will need to create settings files for the configuration of each converter or each set of
converters (use multiple converters mode):
1. Attach one (or the first set) of the converters to the PC
2. Start PicoLog, select New Settings from the File menu, then follow the sequence of
dialogs to setup your Converter(s)
3. Select Save as... from the File menu, and from the drop down box, select .pls (settings
file), then save
4. Disconnect the first converter and attach the second (or the second set) , then repeat
the steps above.
Once you have a settings file for each converter or set of converters, you will need to start
PicoLog Recorder from the command line.
1. From the Windows Start menu, select Run...
2. Type C:\PICO\plw32.exe C:\PICO\mysettings1.pls (where C:\PICO\ is
your installation directory, and mysettings1.pls is your first settings file) and
3. Repeat the steps above for each of your settings files (eg - mysettings2.pls, etc).
Note: None of the converters should be running in fast block mode or streaming mode
(this will take precedence, and inhibit other converters from recording during this period).
Copyright 2005 Pico Technology Limited. All rights reserved.
PLW044-1.5
PicoLog User Guide
21
4
Menu bar
4.1
File
To access this menu, from the menu bar of PicoLog Recorder, select File.
The file menu appears on the menu bar at the top of the monitor window in
PLW Recorder.
New settings
This menu option erases the current settings and then takes you, step by step, through
the process of setting up PicoLog to collect some data.
New data
This menu option enables you to open a new file to record your data. If you save the file
as a setup file, only the settings are stored. If you save it as a data file, both the settings
and data are stored. You can also save the file as a text file only.
Open
This menu option closes all active windows and then opens a data or setup file.
If you open a data file, the settings and data are copied from the file, and the data is
displayed. If you open a setup file, only the settings are recovered: no data is displayed
until you start PicoLog running.
Save as...
This menu option asks for a filename and then writes the data to that file.
If you save the file as a setup file, only the settings are stored. If you save it as a data file,
both the settings and data are stored. You can also save the file as a text file only.
Delete File
This menu option enables you to delete a file. Select the file and then click OK to delete it.
PLW044-1.5
Copyright 2005 Pico Technology Limited. All rights reserved.
Menu bar
22
Preferences
This group of menu options enables you to customise PicoLog for Windows:
Language - enables you to select the language that PicoLog will use.
Colours - enables you to select the colours that PicoLog will use.
Sound - enables you to select the sounds for certain events.
Temperature - enables you to select the units for temperature
measurements.
IP Sockets - activates the IP network facility, allowing you to transfer
data between two computers running PicoLog.
Converter - used to specify what converter is to be used.
Recorder - used to specify whether the Re-record and Pause buttons
are displayed in the Recorder window.
Exit
This menu option exits from the program.
Note: Do not attempt to save your data directly to a floppy disk.
4.2
Settings
To access this menu, from the menu bar of PicoLog Recorder, select Settings.
The settings menu appears on the menu bar at the top of the monitor window in
PLW Recorder.
Recording
This menu option enables you to choose the recording method for your measurements.
Sampling...
This menu option enables you to specify the sampling rate and the action at the end of a
run.
Input channels...
This menu option enables you to specify the converter and port that will take the
measurements.
Calculated parameters
This menu option enables you to enter details for measurements which are calculated
from one or more other measurements. This can be done either during data collection or
after the data has been collected.
Monitor
This menu option enables you to select the measurements that you wish to display in the
monitor window. To select a measurement, highlight it and then click OK.
Copyright 2005 Pico Technology Limited. All rights reserved.
PLW044-1.5
PicoLog User Guide
23
4.3
View
To access this menu, from the menu bar of PicoLog Recorder or Player, select View.
Player
This menu option creates a new Player window.
Notes
This menu option creates a new Notes window.
Spreadsheet
This menu option creates a new Spreadsheet window.
Graph
This menu option creates a new Graph window.
XY Graph
This menu option creates a new XY Graph window.
PLW044-1.5
Copyright 2005 Pico Technology Limited. All rights reserved.
Menu bar
4.4
24
Help
To access this menu, from the menu bar of PicoLog Recorder, select Help.
The Help menu appears on the menu bar at the top of the monitor window in
PLW Recorder.
Index
This menu option takes you to the index of the PicoLog help file.
Contents
This menu option takes you to the contents page of the PicoLog help file.
Using help
This option explains how to use the PicoLog help file.
This view
This option explains the operation of the monitor window in PLW Recoder.
Guided tour
This menu option shows you the main features of the program. A converter need not be
connected.
About...
This menu option gives the version and serial number of this instance of Picolog.
4.5
Keyboard shortcuts
You can control some of PicoLog's functions using the following keys on the keyboard:
Key
Alt-P
Alt-N
Alt-S
Alt-G
Alt-X
F1
Function
open Player View
open Notes View
open Spreadsheet View
open Graph View
open XY Graph View
view Help index
Copyright 2005 Pico Technology Limited. All rights reserved.
PLW044-1.5
PicoLog User Guide
25
5
Dialog boxes
5.1
General dialog boxes
5.1.1
Recording
To access this dialog box, open the Settings menu of PicoLog Recorder and select
Recording.
This dialog box is used to specify which recording method will be used.
Note: this dialog box is not displayed if you installed PicoLog for use with DrDAQ.
The options for Recording method are as follows:
Real time continuous
In real time continuous mode you can record the data at the same time as displaying it
in graphical or spreadsheet form. The maximum sampling rate is one per millisecond.
With this method, you can use multiple converters.
Streaming
In streaming mode you can record the data at the same time as displaying it in
graphical or spreadsheet form. The sampling rate is controlled by the converter. This
method is limited to a single converter.
Fast block
In fast block mode, data is collected at high speed but cannot be displayed until after it
is collected. The sampling rate is controlled by the converter. This method is limited to
a single converter.
Use multiple converters
Check this box if you wish to use more than one converter. This option is not available for
fast block or streaming recording.
Action at end of run
This defines what happens when all the samples have been collected. Choose one of the
following options:
Stop
Means stop collecting
Repeat immediately
Means start a new run immediately after completing the current run
PLW044-1.5
Copyright 2005 Pico Technology Limited. All rights reserved.
Dialog boxes
26
Repeat after delay
Means start a new run after the restart delay has elapsed. This could be used to collect
a one-minute block of data once per hour
Scroll
Means that new samples will be recorded and the oldest samples will discarded. This is
useful if you only wish to have a record of the most recent samples
When you select a repeat option, the computer automatically increments a sequence
number at the end of the filename.
Restart delay
When in 'repeat after delay' mode, this is the time interval from the start of one run to the
start of the next run.
5.1.2
Sampling Rate
To access this dialog box, open the Settings menu of PicoLog Recorder and select
Sampling...
This dialog box sets the sampling rate and defines the action to take at the end of a run.
Sampling interval
To set the interval between samples, type a number in the box and select the required
units. The interval must be a whole number so, for example, 30 seconds must be
specified rather than 0.5 minutes.
Note: When you have set sampling intervals of less than a second, displaying a graph
whilst data recording is possible, but may interfere with recording.
Maximum number of samples
To set the maximum number of samples to be collected during a run, enter the maximum
in this box. The maximum can be up to a million samples. During real-time data collection,
the sampling can be stopped at any time, so you can enter a large number and then stop
the run early.
Readings per sample
Normally PicoLog takes as many readings as possible during each sample period, then
saves the average of the readings. If you need an instantaneous measurement, (for
example, if you wish to calculate standard deviations), change this option to Single.
Copyright 2005 Pico Technology Limited. All rights reserved.
PLW044-1.5
PicoLog User Guide
27
5.1.3
Print
To access this dialog box click
when one of the display windows is open.
Printer:
At the top is a combo box with the name of the default printer. You can select a different
printer if you wish.
Setup
Use the Setup button to open a dialog box with setup information specific to the selected
printer.
Once all the details are correct, click OK to start printing.
5.1.4
Confirm File delete
If you want to delete a PicoLog file you have saved on your hard disk, open the File menu
of PicoLog Recorder and select Delete File. A window appears showing you the list of
files in the active directory.
Double-click on the name of the file you want deleted. The following dialog box appears.
If you are certain you want to go ahead with deletion, click the OK button.
PLW044-1.5
Copyright 2005 Pico Technology Limited. All rights reserved.
Dialog boxes
5.1.5
28
Signal Conditioner
To access this dialog box, click the Conditioner button on the Parameter options dialog
box.
This dialog box provides support for the Pico range of signal conditioners. A signal
conditioner provides excitation and/or power for a sensor and then amplifies the output
from the sensor.
When you use this dialog box to specify a signal conditioner and sensor, the computer
automatically converts the input voltage into the appropriate units for this sensor.
Signal conditioner calculations are done before normal scaling, so it is possible to make
further adjustments to the scale using the Parameter scaling dialog box. This can be
used to do the following things:
Make small corrections after calibrating a sensor
Convert from metric to imperial units
Convert from amps to kilowatts
Conditioner
This is where you select what type of signal conditioner you will be using.
For the ADC-16, the computer automatically detects the signal conditioner type but for
other converters, it is necessary to manually select the signal conditioner.
Sensor
Once you have selected a conditioner, the sensor dialog box contains a list of sensors
that are suitable for use with the specified conditioner. Select the sensor that you wish to
use.
Information about sensors is stored in a set of Pico Signal Conditioner (.PSC) files. You
can also create your own .PSC files to add other sensors
Copyright 2005 Pico Technology Limited. All rights reserved.
PLW044-1.5
PicoLog User Guide
29
5.1.6
Converter-related
5.1.6.1
Converter details
To access this dialog box, select Input channels... from the Settings menu.
This dialog box is used to specify the details for a converter. Note that it is NOT displayed
if you set the Converter preferences to automatically select a particular converter.
Converter type
This lists the types of converter that can be used with the program. Please note that not
all the converters will be available if an incompatible mode has been selected from the
Recording dialog box.
Port
Select the port to which the converter is connected if the attached Pico product uses one
of the following connection methods:
Parallel port
Serial port
USB-parallel port adapter (these are allocated in the order in which units are connected
to the PC)
USB Devices
When a product that supports USB natively is selected from the Converter type list, the
Port field will be greyed out and a list of USB devices of the selected type that are
currently attached to the PC will be displayed.
When attempting to edit the settings of a currently opened unit, then the unit that you are
editing will appear highlighted at the bottom of the list. If unhighlighted units appear at the
top of this list, these represent other available devices of this type attached to the PC.
You can freely switch between these available units, however, the settings of the unit you
are editing will not be saved.
Note: Enumerating USB devices can take some time, especially if a number of USB
devices are attached to the PC. Picolog may appear to lock up during this period, but this
is normal.
PLW044-1.5
Copyright 2005 Pico Technology Limited. All rights reserved.
Dialog boxes
30
Refresh
After you have selected a converter from the Converter type drop-down list, click this
button to scan for new USB devices.
Status
This informs you of the status of any converters you have attached to your computer. To
ensure that your hardware is setup correctly, see the section on hardware setup.
OK
When you click the OK button, the computer will open a measurement dialog box for the
selected converter. (If you are using a Picoscope 3000 series oscilloscope, for example,
the computer will open the PicoScope3000 Measurements dialog box). A double leftclick with the mouse on the desired USB device will also have the same effect.
5.1.6.2
Converters
To access this dialog box, click the OK button on the Converter details dialog box. Note:
If the Use multiple converters box is ticked on the Recording dialog box, selecting
Input channels... from the Settings menu will take you directly to the Converters dialog
box.
This dialog box is used to build up a list of converters to use. In the pane on the left will
be a list of the converters that are currently active.
Add...
To add another converter to the list, click the Add... button. This will open the
Converter details dialog box so you can enter the type and port for the new converter.
Edit...
To edit the details for an existing converter, highlight the entry for it and click the Edit...
button. This will open the Converter details dialog box.
Delete
To remove a converter from the list, highlight the converter and click the Delete button.
Parameters...
To specify the measurements to be measured for a converter, highlight the converter and
click the Parameters... button.
Copyright 2005 Pico Technology Limited. All rights reserved.
PLW044-1.5
PicoLog User Guide
31
5.1.6.3
Converter preferences
To access this dialog box, open the Preferences sub-menu in the File menu and select
Converter.
So that the computer does not ask each time you define new settings, you can specify in
advance which converter to use. The options available are as follows:
Ask during configuration
Ask for the converter every time you enter new settings
Use converter specified during install
Use the converter specified when PicoLog was installed
Use converter specified here...
Use the converter specified in this dialog box
When you select the last option, the computer enables the converter and port fields on
the dialog box.
PLW044-1.5
Copyright 2005 Pico Technology Limited. All rights reserved.
Dialog boxes
5.1.7
IP socket-related
5.1.7.1
IP Socket options
32
To access this dialog box, open the Preferences sub-menu in the File menu and select
IP Sockets.
This dialog box is used to specify the details required to establish a link between
computers via an IP network.
One computer is referred to as the server. This is the computer supplying data. The other
computer is referred to as the client. This is the computer receiving data. It displays the
measurements as if they are being collected locally. A server can support any number of
clients, and a client can get data from up to 10 servers.
Server enabled
When this option is selected, PicoLog will start responding to requests for data from any
PicoLog clients that contact it.
Client enabled
This sets this computer to act as a client. When it is checked, the socket device appears
in the Select Device dialog box.
Server socket
This specifies what IP socket the server will use. It is not normally necessary to change it,
unless the socket is already in use by another application. If you change it, you must do
so on the server and on all clients.
Response timeout
This only has an effect on the client. It controls how long the client will wait for a response
from the server. You can use the PING command to find out how long a round trip
normally takes.
Minimise network traffic
If this box is not checked, the client will continuously request data from the server. This is
OK over a local network, but could cause a dial-up bridge between two subnets to stay
active all the time. If you check this box, the client only asks for data once per sample
period. With a sample period of an hour, the client will only contact the server once per
hour.
Copyright 2005 Pico Technology Limited. All rights reserved.
PLW044-1.5
PicoLog User Guide
33
5.1.7.2
Socket channels
Accessed from the Converter details dialog box. Note: Only accessible when Client
enabled has been checked on the IP Socket options dialog box and Socket has been
selected as the Converter type in the Converter details dialog box.
This dialog box is used to establish a connection to another instance of PicoLog running
on a remote server computer, and then to select the channels that are to be imported to
this instance of PicoLog.
Server
This is the name of the server. If it is on your local network, the computer name should be
enough (for example, "carnot"). If you want to communicate via a large network or the
internet, you will need to put the full name of the computer, for example,
"carnot.picotech.co.uk."
Connect
Having entered a server name, click the Connect button to establish a link to the server.
If successful, a list of channels (corresponding to measurements) available on the server
will appear. If someone changes the details on the server, you can click this button to
update the details locally.
Edit...
To edit a channel, first select it, then click this button. The Edit socket channel dialog
box will appear so that you can enter the details.
Disable
To disable a previously selected channel, highlight it and click this button.
PLW044-1.5
Copyright 2005 Pico Technology Limited. All rights reserved.
Dialog boxes
5.1.7.3
34
Edit socket channel
To access this dialog box, click the Edit... button on the Socket channels dialog box.
This dialog box is used to enter the details for a channel.
Name on
server
This is the name of the channel on the remote server computer. It cannot be changed
from the local computer.
Local name
This is the name of the channel as it will appear locally.
Options...
To set the Parameter options, click the Options... button.
5.1.7.4
Device status
To access this dialog box, click the Status button on the Converter details dialog box.
This dialog box displays the details about the IP socket connection to the server.
Copyright 2005 Pico Technology Limited. All rights reserved.
PLW044-1.5
PicoLog User Guide
35
5.1.8
Parameter-related
5.1.8.1
Parameter options
To access this dialog box, click the Options... button on the measurement dialog box for
the converter. If you are using an ADC-16, for example, the measurement dialog box for
the converter would be the Edit ADC16 Channel dialog box.
This dialog box is used to set up measurement definitions.
Use Parameter Formatting
By default, the measurement or channel that has been setup will use its own default
values for formatting. If you want to use your own scaling, click the Scaling button. It is
recommended that you tick the Use Parameter Formatting check-box and enter your
own values in the fields described below.
Units
The units you enter here will appear on spreadsheets and graphs.
Number display
This defines the format of the information for spreadsheet entries and graph scales. For
example, with a field width of 6 and 2 decimal places, a number will appear in the format
ddd.dd. The field width must be between 1 and 8, and the number of decimal places
must be less than the field width.
Scaling for graphs
This defines the maximum and minimum values to be used for graphical displays.
Note: Any scrolling in the PLW Graph window is based on these numbers, and limited by
them. Once you have saved your data, these cannot be changed, so ensure that these
limits extend up to or beyond the maximum data values you expect to capture.
Conditioner
The Conditioner button is used when a signal conditioner is connected to a channel. It
opens the Signal Conditioner dialog box, which enables you to select the type of
conditioner and sensor that is connected to an ADC channel. Once selected, the
computer scales the input into the appropriate units for the sensor.
PLW044-1.5
Copyright 2005 Pico Technology Limited. All rights reserved.
Dialog boxes
36
Scaling
The Scaling button opens the Parameter scaling dialog box, which can be used for the
following two purposes:
Converting an input voltage into some other units
Applying minor scaling corrections to values that have already been scaled for a
particular signal conditioner and sensor
PicoLog is supplied with an extensive library of scaling information for sensors from a
variety of manufacturers.
Alarm
The Alarm button opens the Alarm settings dialog box for this measurement definition.
5.1.8.2
Parameter scaling
To access this dialog box, click the Scaling button on the Parameter options dialog box.
This dialog box is used to specify how to convert a measurement value into some other
unit, for example from volts to temperature. It is invoked when you click the Scaling button
on the Parameter options dialog box.
Scaling Method
There are three scaling methods: None, Table lookup, and Equation. You can also read in
a lookup table or an equation from a file.
Table lookup
This is useful for a set of input readings corresponding to different values of the
measurement to be scaled. You can put two or more pairs of values in the box below. For
example, to convert a 0 to 2.5V input to minus 40 to 100C, enter the following details in
the box:
0
2.5
-40
100
Two pairs is sufficient if there is a linear relationship between the raw and scaled values.
For non-linear relationships, the required number of pairs depends on the maximum
acceptable interpolation error. If you wish to enter more than half a dozen pairs of values,
it is better to enter the table into a file, and then use file scaling (see below).
Copyright 2005 Pico Technology Limited. All rights reserved.
PLW044-1.5
PicoLog User Guide
37
Equation
This can be used when it is possible to calculate the relationship between the input
reading and the measurement value. The raw measurement values is represented by x.
For example, to convert a temperature from Fahrenheit to Celsius, the equation would be:
(x-32)* 5 / 9
For more information on equations, see equation scaling.
File
When you specify that you wish to use a file for scaling, this button is enabled. When you
click this button, the computer opens up a dialog box to select a scaling file.
Scaling from file
If you wish to scale the inputs from a number of identical measurements using the same
method, or if you wish to set up a large lookup table. See Scale file format for more
information on the format.
5.1.8.3
Alarm settings
To access this dialog box, click the Alarm button on the Parameter options dialog box.
This dialog box defines the alarm settings for each measurement. It is invoked when you
click the Alarm button on the Parameter options dialog box.
Enable alarm
If you wish to set alarm limits for this measurement, check this box.
Lower and upper threshold
If the measurement goes out of this range, the alarm will sound.
Holdoff
If the measurement value occasionally goes out of range for short periods, you can
prevent this causing an alarm by setting a holdoff period. The alarm will then sound only if
the measurement stays out of range for longer than the holdoff period.
PLW044-1.5
Copyright 2005 Pico Technology Limited. All rights reserved.
Dialog boxes
5.1.8.4
38
Select parameters
In the context of the monitor window in PLW Recorder, you access this dialog box by
selecting Monitor from the Settings menu.
On the PLW Graph, PLW XY Graph, and Spreadsheet windows, click
measurement selection button.
. This is the
The selected measurements are highlighted. To select or de-select a measurement,
simply point and click.
This dialog box is used to select the measurements which will be displayed in a window.
Group
At the bottom is the group combo-box. You can use this to save and restore a number of
named groups of measurements.
To save the current measurement selection as a group, type in the group name and click
Save.
To select a saved group, open the combo box and double-click on the requested group.
To modify an existing group, make the changes to the measurement selection then type
in the group name and click Save.
To remove an existing group, de-select all measurements, type in the group name and
click Save.
Copyright 2005 Pico Technology Limited. All rights reserved.
PLW044-1.5
PicoLog User Guide
39
5.1.8.5
Calculated parameters
To access this dialog box, select Calculated parameters from the Settings menu.
This dialog box is used to add or edit calculated parameters. Calculated parameters are
readings that need some action performed on them before they can be presented as
measurements. For instance, thermocouple voltage readings cannot be turned into
temperature measurements without the aid of a scaling table.
Unlike raw measurements, with calculated measurements, it is possible to change their
details once a run is completed.
On the left is a list of calculated measurements and on the right are some buttons which
enable you to add, edit or delete calculated measurements.
Add
To add a new calculated measurement, click the Add... button. This will open the
Edit calculated parameter dialog box.
Edit
To edit the details for a calculated measurement, first highlight it and then click the Edit...
button. This will open the Edit calculated parameter dialog box so that you can enter the
details.
Delete
To remove a calculated measurement, first highlight it, then click the Delete button.
PLW044-1.5
Copyright 2005 Pico Technology Limited. All rights reserved.
Dialog boxes
5.1.8.6
40
Edit calculated parameter
To access this dialog box, click on the Add... or Edit... button on the
Calculated parameters dialog box.
This dialog box enables you to edit the details for a calculated measurement. A calculated
measurement is calculated from up to five other measurements, using an equation.
Fields A to E
These fields enable you to select up to five measurements (raw or calculated) which are
to be used in a calculated measurement. If you require less than five input
measurements, unused measurements should be left blank.
Equation
Here you enter the equation that explains how to calculate this measurement from the
input measurements. The input measurements are represented by A,B,C,D and E. For
example, to calculate the power output from a boiler, the input measurements might be
A = inlet temperature
B = outlet temperature
C = flow rate
and the equation would be
(A-B) * C * 4120
See the Equation Notation topic for more information.
Options
Set the options (units, range etc) for this measurement from Parameter options.
Copyright 2005 Pico Technology Limited. All rights reserved.
PLW044-1.5
PicoLog User Guide
41
5.1.9
Window-related
5.1.9.1
Graph options
To access this dialog box, click
in the PLW Graph window.
This dialog box is used to set the options for the Graph window.
Title
This is the title of the graph that will appear on the graphical reports.
Format
This specifies how traces are to be divided between graphs. The choices are:
Automatic - the traces are allocated by the computer, putting traces with the same
units on the same graph.
Separate graphs - each measurement is displayed on a separate graph.
All traces on same graph - each measurement is displayed on the same graph
Time axis scale
This allows you to choose how the time axis is scaled:
Automatic - the scaling is set by the computer.
Maximum - the time axis is set to the maximum sampling time
Scroll - the display is scrolled across the screen
Manual - the scale can be changed by clicking on the scroll left/right tool buttons on the
Graph window.
The time axis scale is automatically set to Manual if you click any of the time scrolling
buttons
Time Format
This allows you to choose the format for the time axis:
Numeric - the time in the selected sampling time units since the start of the run
Time since start - the time in hours and minutes since the start of the run
Time of day - the real time
Date/time - the real time including the date
PLW044-1.5
Copyright 2005 Pico Technology Limited. All rights reserved.
Dialog boxes
42
Vertical axis scale
This allows you to choose how the vertical axis is scaled:
Automatic - the scaling is set by the computer.
Maximum - the axis is set to the maximum
Manual - the scale can be changed by clicking on the vertical scrolling buttons on the
Graph window.
The Vertical axis scale is automatically set to Manual if you click any of the vertical
scrolling buttons
Display every xxx samples
If you are displaying a graph while collecting data, this controls how frequently the graph
is updated. It has no effect after you have finished recording, or when using the player.
When collecting less than a thousand samples, leave it set to 1. When collecting a large
number of points, it may take some time to update the graph, so updating every time a
new reading is taken would be a waste off effort.
Display Markers
When this box is checked and there is more than one trace on the graph, the computer
displays markers (triangles, circles etc) on the traces to help identify the traces.
Auto save on exit
When this box is checked, all graph window settings are saved automatically when you
close the graph window.
Copyright 2005 Pico Technology Limited. All rights reserved.
PLW044-1.5
PicoLog User Guide
43
5.1.9.2
XY options
To access this dialog box, click
in the PLW XY Graph window.
Title
This is the title of the graph that will appear on graphical reports.
Horizontal/Vertical axis scale
This allows you to choose how the axes are scaled:
Automatic - the scaling is set by the computer.
Maximum - the axis is set to the maximum
Manual - the scale can be changed by clicking on the scroll buttons on the XY Graph
window.
The axis scale is automatically set to Manual if you click any of the scroll buttons.
Auto save on exit
When this box is checked, all XY graph window settings are saved automatically when
you close the XY graph window.
PLW044-1.5
Copyright 2005 Pico Technology Limited. All rights reserved.
Dialog boxes
5.1.9.3
44
Spreadsheet options
To access this dialog box, click
in the Spreadsheet window.
Auto save on exit
When this box is checked, all event window settings are saved automatically when you
close the event window.
Auto scroll
When auto scroll is enabled whilst sampling is in progress, the windowed range is
updated automatically to keep the latest reading visible.
Time Format
This allows you to choose the format for the time:
Numeric - the time in the selected sampling time units since the start of the run
Time since start - the time in hours, minutes and seconds since the start of the run
Time of day - each sample is labelled with the time it was taken
Date/time - each sample is labelled with the date and time it was taken
Show individual/aggregated readings
When show individual readings is checked, the spreadsheet window shows each
individual reading.
When it is cleared, the computer displays results which are aggregates (1st
reading/average/maximum/minimum) of the readings for the time interval specified below.
The controls in the Show aggregated readings box are then enabled. If you select more
than one control, the computer displays the corresponding number of columns for each
sensor in the spreadsheet, and adds a heading (1st reading/average/maximum/minimum)
to each column.
Time interval per row
This specifies the time interval between each of the rows on the spreadsheet. If, for
example, the sampling interval was set for every minute, and you set the time interval per
row to 60, each row will be the (1st reading / average / maximum / minimum) of 60
readings.
Copyright 2005 Pico Technology Limited. All rights reserved.
PLW044-1.5
PicoLog User Guide
45
5.1.10 Preferences
5.1.10.1 Language
To access this dialog box, select Language from the Preferences sub menu in the File
menu.
This is used to select the language that PicoLog will use.
5.1.10.2 Colours
To access this dialog box, select Colours from the Preferences sub-menu in the File
menu.
This is used to specify the colours for the background, text and traces for the graph and
spreadsheet windows. To change a colour, click on the colour button to open the colour
selection dialog box.
Background
This is the colour for the background on graphs, and for non-selected readings on the
spreadsheet.
Frame
This is the colour of the frame round graphs.
Grid
This is the colour for the grid on the graphs.
Text
This is the colour for text.
PLW044-1.5
Copyright 2005 Pico Technology Limited. All rights reserved.
Dialog boxes
46
Selection
This is the colour for the selected readings on the spreadsheet.
Traces
A graph can display up to ten traces: the ten buttons along the bottom of the dialog box
are the colours for each trace.
5.1.10.3 Sounds
To access this dialog box, select Sound from the Preferences sub-menu in the File
menu.
For some events, PicoLog can make a sound when an event occurs. This dialog box
allows you to enable the sounds for each type of event.
Beep on each new reading
This option is useful if there is a problem and you need to keep a close check on it. If you
select a graph or spreadsheet window, the computer beeps each time a new reading is
added to the graph or spreadsheet.
Beep when lamp is clicked
When there is an alarm set, the lamp on the monitor window turns red. You can click on
the lamp to cancel the alarm. When this box is checked, the computer beeps to confirm it
has accepted your request to cancel the alarm.
Beep continuously on alarm
When this box is checked, the computer produces a continuous tone while an alarm is
active.
5.1.10.4 Temperatures
To access this dialog box, select Temperature from the Preferences sub-menu in the
File menu.
This is used to specify the units for temperature measurements. The options are
Fahrenheit or Celsius (Centigrade).
Copyright 2005 Pico Technology Limited. All rights reserved.
PLW044-1.5
PicoLog User Guide
47
5.1.10.5 Recorder preferences
To access this dialog box, select Recorder from the Preferences sub-menu in the File
menu.
Some buttons can be disabled to prevent the accidental erasure of data.
Display the re-record button
Chooses whether
is visible in the PLW Recorder window.
Display the pause button
Chooses whether
is visible in the PLW Recorder window.
5.2
Hardware configuration
5.2.1
ADC-10/12/40/42
5.2.1.1
ADC-10/12/40/42 Measurements
To access this dialog box, assuming you have already set up PicoLog with an ADC-10,
ADC-12, ADC-40 or ADC-42 as your converter, select Input channels... from the
Settings menu. Note: This dialog box is accessible only when Recording method has
been selected as Real time continuous on the Recording dialog box.
This dialog box is used to build up a list of measurements to measure for a converter. On
the left is the current list of measurements and on the right are buttons to update the list.
Add
To add a measurement to the list, click the Add button. This will open a dialog box to
enter details of the new measurement.
PLW044-1.5
Copyright 2005 Pico Technology Limited. All rights reserved.
Dialog boxes
48
Edit
To edit a measurement in the list, highlight it and click the Edit button. This will open the
ADC10/12/40/42 Measurement dialog box so that you can edit the details.
Delete
To delete a measurement in the list, highlight it and click the Delete button.
5.2.1.2
ADC-10/12/40/42 Measurement
Accessed via the Edit button on the ADC10/12/40/42 Measurements dialog box.
This dialog box is used to enter the details for a measurement.
Name
This is the name of the measurement. This name will appear on all reports.
Measurement
This specifies the type of measurement that will be made. The options are:
DC volts - the DC component or average input voltage.
AC volts - the RMS AC voltage (note that this excludes any DC component).
dB - AC volts converted to decibels.
Frequency - the frequency of the AC component, in hertz.
Scan time
This is the total time to take the set of readings for a sample. The scan time should be at
least three cycles at the minimum frequency that you wish to measure.
Options
To set the options for the measurement (such as units and scaling) click the Options
button. This will open the Parameter options dialog box.
Copyright 2005 Pico Technology Limited. All rights reserved.
PLW044-1.5
PicoLog User Guide
49
5.2.1.3
ADC-10/12/40/42 block
Accessed via the OK button on the Converter details dialog box. Note: This dialog box is
accessible only when Recording method has been selected as Fast block on the
Recording dialog box.
This dialog box only applies to the block method of recording. It is used to select the total
time and the number of samples that will be used to take measurements.
Name
This is the name of the measurement. This name will appear on all reports.
Total time
This is the preferred time over which you want to collect the data.
Number of samples
This specifies the preferred number of samples to be taken during a block.
Sampling approximation
The ADC unit and the PC both have performance limits and will rarely be able to give
exactly the settings that are requested. PicoLog will attempt to negotiate similar settings
based on two user options:
Total time stays constant
The time will remain very similar and the number of samples will be compromised
Number of samples stays constant
The number of samples will remain very similar and the time will be compromised
When the OK button is clicked, the following dialog box will appear to check whether the
negotiated settings are acceptable (based on the dialog box settings above):
PLW044-1.5
Copyright 2005 Pico Technology Limited. All rights reserved.
Dialog boxes
50
(Results will vary on different PCs and in different situations)
Trigger
To enter the trigger details for the measurement click the Trigger button. This will open
the ADC10/12/40/42 Trigger dialog box.
Options
To set the options for the measurement (such as units and scaling) click the Options
button. This will open the Parameter options dialog box.
5.2.1.4
ADC-10/12/40/42 Trigger
Accessed via the Trigger... button on the ADC10/12/40/42 block dialog box.
Triggering is used to select the moment at which PicoLog collects data - usually at some
fixed time before or after a trigger event.
A trigger event occurs when a specified channel crosses a voltage threshold - either rising
or falling. PicoLog can start collecting data immediately after the trigger event, or a fixed
time interval before or after the trigger event.
Trigger enable
If you wish to collect data only when the specified trigger conditions occur, check this box.
If the box is not checked, data is displayed continuously.
Direction
The trigger direction can be either rising or falling. If rising is selected, the trigger event
occurs when the voltage rises across the trigger threshold.
Channel
This selects which channel is to be used as the trigger input.
Threshold
This shows the voltage (in mV) that the trigger channel must cross in order for a trigger
event to occur.
Copyright 2005 Pico Technology Limited. All rights reserved.
PLW044-1.5
PicoLog User Guide
51
Delay
This controls the time delay, as a percentage of the sweep time, between the trigger
event and the start of collecting data. A negative delay means that the computer will show
data that was recorded before the trigger event - for example, -50% places the trigger
event in the middle of the collected data and -100% means that all data is collected
before the trigger.
Auto trigger
If you wish PicoLog to trigger after a specified time - even if no trigger event occurs check this box. This will prevent PicoLog from waiting indefinitely for the event and locking
up the computer.
Note: If you disable auto-trigger and the computer does lock up, you can press the F9 key
to simulate a trigger.
Auto trigger after
The time after which PicoLog will trigger, even if no trigger event occurs.
5.2.1.5
Device status
Accessed via the Status button on the Converter details dialog box.
This dialog box displays the details about the ADC status.
PLW044-1.5
Copyright 2005 Pico Technology Limited. All rights reserved.
Dialog boxes
5.2.2
ADC-11/22
5.2.2.1
ADC-11/22 measurements
52
To access this dialog box, assuming you have already set up PicoLog with an ADC-11 or
ADC-22 as your converter, select Input channels... from the Settings menu. Note: This
dialog box is accessible only when Recording method has been selected as Real time
continuous on the Recording dialog box.
This dialog box is used to build up a list of measurements to measure for a converter. On
the left is the current list of measurements and on the right are buttons to update the list.
Add
To add a measurement to the list, click the Add button. This will open a dialog box to
enter details of the new measurement.
Edit
To edit a measurement in the list, highlight it and click the Edit button. This will open the
Edit ADC11/22 Measurement dialog box so that you can edit the details.
Delete
To delete a measurement in the list, highlight it and click the Delete button.
5.2.2.2
Edit ADC-11/22 Measurement
Accessed via the Edit button on the ADC11/22 measurements dialog box.
This dialog box is used to enter the details for a measurement.
Copyright 2005 Pico Technology Limited. All rights reserved.
PLW044-1.5
PicoLog User Guide
53
Name
This is the name of the measurement. This name will appear on all reports.
Channel
This is the channel to be used for the measurement.
Measurement
This specifies the type of measurement that will be made. The options are:
DC volts - the DC component or average input voltage.
AC volts - the RMS AC voltage (note that this excludes any DC component).
dB - AC volts converted to decibels.
Frequency - the frequency of the AC component, in hertz.
Scan time
This is the total time to take the set of readings for a sample. The scan time should be at
least three cycles at the minimum frequency that you wish to measure.
Options
To set the options for the measurement (such as units and scaling) click the Options
button. This will open the Parameter options dialog box.
5.2.2.3
ADC-11/22 block
Accessed via the OK button on the Converter details dialog box. Note: This dialog box is
accessible only when Recording method has been selected as Fast block on the
Recording dialog box.
This dialog box is used to select the channels and sampling rate for fast recording.
Edit
To select a channel, highlight it and click the Edit button. This will open the Edit Channel
dialog box so that you can enter the details.
PLW044-1.5
Copyright 2005 Pico Technology Limited. All rights reserved.
Dialog boxes
54
Number of samples
This specifies the preferred number of samples to be taken during a block.
Total time
This is the preferred time over which you want to collect the specified number of samples.
Sampling approximation
The ADC unit and the PC both have performance limits and will rarely be able to give
exactly the settings that are requested. PicoLog will attempt to negotiate similar settings
based on two user options:
Total time stays constant - the time will remain very similar and the number of samples
will be compromised
Number of samples stays constant - the number of samples will remain very similar
and the time will be compromised
When the OK button is clicked, the following dialog box will appear to check whether the
negotiated settings are acceptable (the dialog box below does not represent the actual
settings for this ADC):
(Results will vary on different PCs and in different situations)
Disable
To disable a measurement in the list, highlight it and click the Disable button.
Trigger
To enter the trigger details for a measurement, highlight it and click the Trigger button.
This will open the ADC11/22 Trigger dialog box.
Copyright 2005 Pico Technology Limited. All rights reserved.
PLW044-1.5
PicoLog User Guide
55
5.2.2.4
ADC-11/22 Trigger
Accessed via the Trigger button on the ADC11/22 block dialog box.
Triggering is used to select the moment at which PicoLog starts collects data - usually at
some fixed time before or after a trigger event.
A trigger event occurs when the specified channel crosses a voltage threshold - either
rising or falling. PicoLog can start collecting data immediately after the trigger event, or a
fixed time interval before or after the trigger event.
Trigger enable
If you wish to collect data only when the specified trigger conditions occur, check this box.
If the box is not checked, data is displayed continuously.
Direction
The trigger direction can be either rising or falling. If rising is selected, the trigger event
occurs when the voltage rises across the trigger threshold.
Channel
This selects which channel is to be used as the trigger input.
Threshold
This shows the voltage (in mV) that the trigger channel must cross in order for a trigger
event to occur.
Delay
This controls the time delay, as a percentage of the sweep time, between the trigger
event and the start of collecting data. A negative delay means that the computer will show
data that was recorded before the trigger event - for example, -50% places the trigger
event in the middle of the collected data and -100% means that all data is collected
before the trigger.
Auto trigger
If you wish PicoLog to trigger after a specified time - even if no trigger event occurs check this box. This will prevent PicoLog from waiting indefinitely for the event and locking
up the computer.
Note: If you disable auto-trigger and the computer does lock up, you can click the F9 key
to simulate a trigger.
PLW044-1.5
Copyright 2005 Pico Technology Limited. All rights reserved.
Dialog boxes
56
Auto trigger after
The time after which PicoLog will trigger, even if no trigger event occurs.
5.2.2.5
Device status
Accessed via the Status button on the Converter details dialog box.
This dialog box displays the details about the ADC connection to the server.
Copyright 2005 Pico Technology Limited. All rights reserved.
PLW044-1.5
PicoLog User Guide
57
5.2.3
ADC-16
5.2.3.1
ADC-16 Channels
To access this dialog box, assuming you have already set up PicoLog with an ADC-16 as
your converter, select Input channels... from the Settings menu.
This dialog box is used to select the channels that will be used to take measurements.
Note that, when using a CM001 signal conditioner adapter, only the first four channels are
available. The remaining four channels are used for conditioner type detection.
Edit
To select a channel, highlight it and click the Edit button. This will open the
Edit ADC16 Channel dialog box so that you can enter the details.
Disable
To disable a previously selected channel, highlight it and click the Disable button.
5.2.3.2
Edit ADC-16 Channel
Accessed via the Edit button on the ADC16 Channels dialog box.
This dialog box is used to enter the details for a channel.
PLW044-1.5
Copyright 2005 Pico Technology Limited. All rights reserved.
Dialog boxes
58
Name
This is the name of the channel. This name will appear on all reports.
Resolution/conversion time
The resolution can be 13 to 16 bits. Values are signed so, for example, 16 bits will give
values in the range - 65 535 to + 65 535.
The time taken for each measurement increases in proportion to the resolution: 16 bits
gives the highest precision results but takes the longest time per reading.
Differential input
If you wish to measure the voltage difference between adjacent channels, check this box.
This mode applies to channels 1, 3, 5, and 7. For example, if differential input is enabled
for channel 1, the computer will measure the voltage difference between channel 1 and
channel 2.
Filter enable
If you wish to use a filter to reduce the effects of electrical noise, check this box.
Filter factor
Each time a reading is taken, the filtered value is updated using the equation:
new value = old value + (reading - old value)/(filter factor)
Filtered values are more stable but the readings will respond relatively slowly to a step
change in voltage. The higher the factor, the stronger the filtering effect will be.
Options
To set the options for a parameter, click the Options button.
Conditioner
If the ADC-16 driver detects that a signal conditioner module is fitted, this dialog box will
display the name of the signal conditioner. Use Options | Conditioner to specify the type
of sensor that you intend to connect to the signal conditioner.
5.2.3.3
Device status
Accessed via the Status button on the Converter details dialog box.
This dialog box displays the details about the ADC status.
Copyright 2005 Pico Technology Limited. All rights reserved.
PLW044-1.5
PicoLog User Guide
59
5.2.4
ADC-100/101
5.2.4.1
ADC-100/101 measurements
To access this dialog box, assuming you have already set up PicoLog with an ADC-100
or ADC-101 as your converter, select Input channels... from the Settings menu.
This dialog box displays a list of the measurements that you wish to take.
Add
To add a measurement to the list, click the Add button. This will open a dialog box so you
can enter the details.
Edit
To edit a measurement in the list, highlight it and click the Edit button. This will open the
Edit ADC100/101 measurement dialog box so that you can edit the details.
Delete
To delete a measurement in the list, highlight it and click the Delete button.
5.2.4.2
Edit ADC-100/101 measurement
Accessed via the Edit button on the ADC100/101 measurements dialog box.
This dialog box is used to enter the details for a measurement.
PLW044-1.5
Copyright 2005 Pico Technology Limited. All rights reserved.
Dialog boxes
60
Name
This is the name of the measurement. This name will appear on all reports.
Channel
This is the channel that will take the measurement.
Measurement
This specifies the type of measurement that will be made. The options are:
DC volts - the DC component or average input voltage.
AC volts - the RMS AC voltage (note that this excludes any DC component).
dB - AC volts converted to decibels.
Frequency - the frequency of the AC component, in hertz.
Voltage range
This specifies the voltage range for the measurement.
Scan time
This is the total time to take the set of readings for a sample. The scan time should be at
least three cycles at the minimum frequency that you wish to measure.
Options
To set the options for the measurement (such as units and scaling) click the Options
button. This will open the Parameter options dialog box.
5.2.4.3
ADC-100 Block
Accessed via the OK button on the Converter details dialog box. Note: This dialog box is
accessible only when Recording method has been selected as Fast block on the
Recording dialog box.
This dialog box only applies to the block method of recording. It is used to select the
channels that will be used to take measurements.
Total time
This is the preferred time over which you want to collect the data.
Copyright 2005 Pico Technology Limited. All rights reserved.
PLW044-1.5
PicoLog User Guide
61
Number of samples
This specifies the preferred number of samples to be taken during a block.
Sampling approximation based on
The ADC unit and the PC both have performance limits and will rarely be able to give
exactly the settings that are requested. PicoLog will attempt to negotiate similar settings
based on two user options:
Total time stays constant - The time will remain very similar and the number of
samples will be compromised
Number of samples stays constant - The number of samples will remain very similar
and the time will be compromised
Name
This is the name of the measurement. This name will appear on all reports.
Range
This specifies the voltage range for the measurement.
Trigger...
To enter the trigger details for the measurement click the Trigger... button. This will open
the ADC100 Trigger dialog box.
Options
To set the options for the measurement (such as units and scaling) click the Options
button. This will open the Parameter options dialog box.
5.2.4.4
ADC-100 Trigger
Accessed via the Trigger button on the ADC100 Block dialog box.
Triggering is used to select the moment at which PicoLog collects data - usually at some
fixed time before or after a trigger event.
A trigger event occurs when a specified channel crosses a voltage threshold - either rising
or falling. PicoLog can start collecting data immediately after the trigger event, or a fixed
time interval before or after the trigger event.
PLW044-1.5
Copyright 2005 Pico Technology Limited. All rights reserved.
Dialog boxes
62
Trigger enable
If you wish to collect data only when the specified trigger conditions occur, check this box.
If the box is not checked, data is displayed continuously.
Direction
The trigger direction can be either rising or falling. If rising is selected, the trigger event
occurs when the voltage rises across the trigger threshold.
Channel
This selects which channel is to be used as the trigger input.
Threshold
This shows the voltage (in mV) that the trigger channel must cross in order for a trigger
event to occur.
Delay
This controls the time delay, as a percentage of the sweep time, between the trigger
event and the start of collecting data. A negative delay means that the computer will show
data that was recorded before the trigger event - for example, -50% places the trigger
event in the middle of the collected data and -100% means that all data is collected
before the trigger.
Auto trigger
If you wish PicoLog to trigger after a specified time - even if no trigger event occurs check this box. This will prevent PicoLog from waiting indefinitely for the event and locking
up the computer.
Note: If you disable auto-trigger and the computer does lock up, you can press the F9 key
to simulate a trigger.
Auto trigger after
The time after which PicoLog will trigger, even if no trigger event occurs.
5.2.4.5
Device status
Accessed via the Status button on the Converter details dialog box.
This dialog box displays the details about the ADC status.
Copyright 2005 Pico Technology Limited. All rights reserved.
PLW044-1.5
PicoLog User Guide
63
5.2.5
ADC-200/212/216
5.2.5.1
ADC-200 measurements
To access this dialog box, assuming you have already set up PicoLog with an ADC-200
series converter, select Input channels... from the Settings menu.
This dialog box displays a list of the measurements that you wish to take.
Add
To add a measurement to the list, click the Add button. This will open a dialog box so you
can enter the details.
Edit
To edit a measurement in the list, highlight it and click the Edit button. This will open the
Edit ADC200 measurement dialog box so that you can edit the details.
Delete
To delete a measurement in the list, highlight it and click the Delete button.
5.2.5.2
Edit ADC-200 measurement
Accessed via the Edit button on the ADC200 measurements dialog box.
This dialog box is used to enter the details for a measurement.
PLW044-1.5
Copyright 2005 Pico Technology Limited. All rights reserved.
Dialog boxes
64
Name
This is the name of the measurement. This name will appear on all reports.
Channel
This is the channel that will take the measurement.
Measurement
This specifies the type of measurement that will be made. The options are:
DC volts - the DC component or average input voltage.
AC volts - the RMS AC voltage (note that this excludes any DC component).
dB - AC volts converted to decibels.
Frequency - The frequency of the AC component, in hertz.
Voltage range
This specifies the voltage range for the measurement.
Scan time
This is the total time to take the set of readings for a sample. The scan time should be at
least three cycles at the minimum frequency that you wish to measure.
Options
To set the options for the measurement (such as units and scaling) click the Options
button. This will open the Parameter options dialog box.
5.2.5.3
ADC-200 Block
Accessed via the OK button on the Converter details dialog box. Note: This dialog box is
only accessible when Recording method has been selected as Fast block on the
Recording dialog box.
This dialog box is used to select the sampling rate and channels for fast data recording.
Copyright 2005 Pico Technology Limited. All rights reserved.
PLW044-1.5
PicoLog User Guide
65
Timebase
This is a list of the sample rates built into the ADC-200 series unit. Select one of the
entries from this list.
Oversample
This is the number of individual readings to be used for each sample. If you select four,
for example, each sample will be made up of four readings and the time per sample will
be four times the timebase.
Number of samples
This specifies the number of samples to be taken during a block.
Total time
This is the time required to take the specified number of samples
Name
This is the name of the measurement. This name will appear on all reports.
Range
This specifies the voltage range for the measurement. Set to 'off' if the channel is not
required.
AC/DC
This specifies whether the input is to be AC or DC coupled.
Trigger
To enter the trigger details for the measurement click the Trigger button. This will open
the ADC200 Trigger dialog box.
Options
To set the options for the measurement (such as units and scaling) click the Options
button. This will open the Parameter options dialog box.
5.2.5.4
ADC-200 Trigger
Accessed via the Trigger button on the ADC200 Block dialog box.
Triggering is used to select the moment at which PicoLog collects data - usually at some
fixed time before or after a trigger event.
A trigger event occurs when a specified channel crosses a voltage threshold - either rising
PLW044-1.5
Copyright 2005 Pico Technology Limited. All rights reserved.
Dialog boxes
66
or falling. PicoLog can start collecting data immediately after the trigger event, or a fixed
time interval before or after the trigger event.
Trigger enable
If you wish to collect data only when the specified trigger conditions occur, check this box.
If the box is not checked, data is displayed continuously.
Direction
The trigger direction can be either rising or falling. If rising is selected, the trigger event
occurs when the voltage rises across the trigger threshold.
Channel
This selects which channel is to be used as the trigger input.
Threshold
This shows the voltage (in mV) that the trigger channel must cross in order for a trigger
event to occur.
Delay
This controls the time delay, as a percentage of the sweep time, between the trigger
event and the start of collecting data. A negative delay means that the computer will show
data that was recorded before the trigger event - for example, -50% places the trigger
event in the middle of the collected data and -100% means that all data is collected
before the trigger.
Auto trigger
If you wish PicoLog to trigger after a specified time - even if no trigger event occurs check this box. This will prevent PicoLog from waiting indefinitely for the event and locking
up the computer.
Auto trigger after
The time after which PicoLog will trigger, even if no trigger event occurs.
5.2.5.5
Device status
Accessed via the Status button on the Converter details dialog box.
This dialog box displays the details about the ADC status.
Copyright 2005 Pico Technology Limited. All rights reserved.
PLW044-1.5
PicoLog User Guide
67
5.2.6
PicoScope 2000 Series
5.2.6.1
PicoScope 2000 Measurements
To access this dialog box, assuming you have already set up PicoLog with a PicoScope
2000 series unit, select Input channels... from the Settings menu and click OK. Note:
This is accessible only when the Recording method has been selected as Real time
continuous on the Recording dialog box.
This dialog box displays a list of the measurements that you wish to take.
Add
To add a measurement to the list, click the Add button. This will open the
PicoScope2000 Edit Measurement dialog box so you can enter the details.
Edit
To edit a measurement in the list, highlight it and click the Edit button. This will open the
PicoScope2000 Edit Measurement dialog box so that you can edit the details.
Delete
To delete a measurement in the list, highlight it and click the Delete button.
PLW044-1.5
Copyright 2005 Pico Technology Limited. All rights reserved.
Dialog boxes
5.2.6.2
68
PicoScope 2000 Edit Measurement
Accessed via the Edit button on the PicoScope2000 Measurements dialog box.
This dialog box is used to enter the details for a measurement.
Name
This is the name of the measurement. This name will appear on all reports.
Channel
This is the channel that will take the measurement.
Measurement
This specifies the type of measurement that will be made. The options are:
DC volts - the DC component or average input voltage.
AC volts - the RMS AC voltage (note that this excludes any DC component).
dB - AC volts converted to decibels.
Frequency - the frequency of the AC component, in hertz.
Voltage range
This specifies the voltage range for the measurement.
Scan time
This is the total time to take the set of readings for a sample. The frequency range
available at the selected scan time is displayed below this field ... the frequency range will
set the default maximum / minimum limits of the PLW Graph window when the
Measurement: 'Frequency' is selected.
Options
To set the options for the measurement (such as units and scaling) click the Options
button. This will open the Parameter options dialog box.
Copyright 2005 Pico Technology Limited. All rights reserved.
PLW044-1.5
PicoLog User Guide
69
5.2.6.3
PicoScope 2000 Block Mode
Accessed via the OK button on the Converter details dialog box. Note: This dialog box
is accessible only when Recording method has been selected as Fast block on the
Recording dialog box.
This dialog box is used to select the sampling rate and channels for fast data recording.
Timebase
This is a list of the sample rates built into the Picoscope 2000 unit. Select one of the
entries from this list.
Note: Available timebases vary depending on the variant of the PicoScope 2000 that you own,
and other settings, such as the number of channels that are active.
Number of samples
This specifies the number of samples to be taken during a block.
Oversample (0...256):
This is the number of individual readings to be used for each sample. The oversample
factor is limited by other settings such as the 'Timebase' and the 'Number of samples'.
The effect of oversampling is to increase the requested number of samples by the
oversample factor, then average them per sample to give an effective resolution increase.
The effective resolution increase (in bits) is calculated as below:
(Resolution Increase) = log10 (Oversample Factor) / log10 (2)
Total run time
This is the time required to take the specified number of samples.
PLW044-1.5
Copyright 2005 Pico Technology Limited. All rights reserved.
Dialog boxes
70
Range
This specifies the voltage range for the measurement. Set to 'Off' if the channel is not
required.
The 'Auto' option causes the scope to spend a maximum of 2 seconds per channel
capturing data before it chooses a suitable voltage range this will delay the start of a data
capture, and the range will stay fixed once the data capture has begun. An 'Auto-ranging'
dialog box will be displayed to warn you when this is happening.
Name
This is the name of the measurement. This name will appear on all reports.
AC/DC
This specifies whether the input is to be AC or DC coupled.
Trigger...
To enter the trigger details for the measurement click the Trigger... button. This will open
the PicoScope2000 Trigger dialog box.
Options...
To set the options for the measurement (such as units and scaling) click the Options...
button. This will open the Parameter options dialog box.
5.2.6.4
PicoScope 2000 Streaming
Accessed via the OK button on the Converter details dialog box. Note: This dialog box
is accessible only when Recording method has been selected as Streaming on the
Recording dialog box.
This dialog box is used to select the sampling rate and channels for streaming data
recording.
Number of samples
This specifies the number of samples to be taken during the recording.
Copyright 2005 Pico Technology Limited. All rights reserved.
PLW044-1.5
PicoLog User Guide
71
Sample interval
This is the time between successive samples.
Range
This specifies the voltage range for the measurement. Set to 'Off' if the channel is not
required.
The 'Auto' option simply sets the voltage range to its largest value and leave it there for
the duration of the recording.
Name
This is the name of the measurement. This name will appear on all reports.
AC/DC
This specifies whether the input is to be AC or DC coupled.
Options...
To set the options for the measurement (such as units and scaling) click the Options...
button. This will open the Parameter options dialog box.
5.2.6.5
PicoScope 2000 Trigger
Accessed via the Trigger... button on the PicoScope2000 Block-Mode dialog box.
Triggering is used to select the moment at which PicoLog starts collecting data - usually
at some fixed time before or after a trigger event.
A trigger event occurs when a specified channel crosses a voltage threshold - either rising
or falling. PicoLog can start collecting data immediately after the trigger event, or a fixed
time interval before or after the trigger event.
Channel
This selects which channel is to be used as the trigger input. Select 'None' if a trigger is
not required.
Note: PicoLog will allow you to trigger on a channel that is not capturing data. However, the
channel will need to be activated, and therefore other settings may be affected ... such as
the available timebases. If you need to trigger on an inactive channel, we recommend that
you use the External Trigger Input.
Direction
The trigger direction can be either rising or falling. If rising is selected, the trigger event
PLW044-1.5
Copyright 2005 Pico Technology Limited. All rights reserved.
Dialog boxes
72
occurs when the voltage rises across the trigger threshold.
Threshold
This shows the voltage (in millivolts) that the trigger channel must cross in order for a
trigger event to occur.
Delay
This controls the time delay, as a percentage of the sweep time, between the trigger
event and the start of collecting data. A negative delay means that the computer will show
data that was recorded before the trigger event; for example, -50% places the trigger
event in the middle of the collected data and -100% means that all data is collected
before the trigger.
Note: When a negative delay is selected, the unit will need to buffer enough data before the
trigger point. This will stop the unit triggering until it has collected the minimum number of
data points.
Auto trigger
If you wish PicoLog to trigger after a specified time - even if no trigger event occurs check the Auto trigger box.
Auto trigger after
The time after which PicoLog will trigger automatically, even if no trigger event occurs
(only used if the Auto-trigger is enabled).
5.2.6.6
Device status
Accessed via the Status button on the Converter details dialog box.
This dialog box displays the details about the ADC status.
Copyright 2005 Pico Technology Limited. All rights reserved.
PLW044-1.5
PicoLog User Guide
73
5.2.7
PicoScope 3000 Series
5.2.7.1
PicoScope 3000 Measurements
To access this dialog box, assuming you have already set up PicoLog with a PicoScope
3000 series unit, select Input channels... from the Settings menu and click OK. Note:
This is accessible only when the Recording method has been selected as Real time
continuous on the Recording dialog box.
This dialog box displays a list of the measurements that you wish to take.
Add
To add a measurement to the list, click the Add button. This will open the
PicoScope3000 Edit Measurement dialog box so you can enter the details.
Edit
To edit a measurement in the list, highlight it and click the Edit button. This will open the
PicoScope3000 Edit Measurement dialog box so that you can edit the details.
Delete
To delete a measurement in the list, highlight it and click the Delete button.
PLW044-1.5
Copyright 2005 Pico Technology Limited. All rights reserved.
Dialog boxes
5.2.7.2
74
PicoScope 3000 Edit Measurement
Accessed via the Edit button on the PicoScope3000 Measurements dialog box.
This dialog box is used to enter the details for a measurement.
Name
This is the name of the measurement. This name will appear on all reports.
Channel
This is the channel that will take the measurement.
Measurement
This specifies the type of measurement that will be made. The options are:
DC volts - the DC component or average input voltage.
AC volts - the RMS AC voltage (note that this excludes any DC component).
dB - AC volts converted to decibels.
Frequency - the frequency of the AC component, in hertz.
Voltage range
This specifies the voltage range for the measurement.
Scan time
This is the total time to take the set of readings for a sample. The frequency range
available at the selected scan time is displayed below this field ... the frequency range will
set the default maximum / minimum limits of the PLW Graph window when the
Measurement: 'Frequency' is selected.
Options
To set the options for the measurement (such as units and scaling) click the Options
button. This will open the Parameter options dialog box.
Copyright 2005 Pico Technology Limited. All rights reserved.
PLW044-1.5
PicoLog User Guide
75
5.2.7.3
PicoScope 3000 Block Mode
Accessed via the OK button on the Converter details dialog box. Note: This dialog box
is accessible only when Recording method has been selected as Fast block on the
Recording dialog box.
This dialog box is used to select the sampling rate and channels for fast data recording.
Timebase
This is a list of the sample rates built into the Picoscope 3000 unit. Select one of the
entries from this list.
Note: Available timebases vary depending on the variant of the PicoScope 3000 that you own,
and other settings, such as the number of channels that are active.
Number of samples
This specifies the number of samples to be taken during a block.
Oversample (0...256):
This is the number of individual readings to be used for each sample. The oversample
factor is limited by other settings such as the 'Timebase' and the 'Number of samples'.
The effect of oversampling is to increase the requested number of samples by the
oversample factor, then average them per sample to give an effective resolution increase.
The effective resolution increase (in bits) is calculated as below:
(Resolution Increase) = log10 (Oversample Factor) / log10 (2)
Total run time
This is the time required to take the specified number of samples.
Range
This specifies the voltage range for the measurement. Set to 'Off' if the channel is not
PLW044-1.5
Copyright 2005 Pico Technology Limited. All rights reserved.
Dialog boxes
76
required.
The 'Auto' option causes the scope to spend a maximum of 2 seconds per channel
capturing data before it chooses a suitable voltage range this will delay the start of a data
capture, and the range will stay fixed once the data capture has begun. An 'Auto-ranging'
dialog box will be displayed to warn you when this is happening.
Name
This is the name of the measurement. This name will appear on all reports.
AC/DC
This specifies whether the input is to be AC or DC coupled.
Trigger...
To enter the trigger details for the measurement click the Trigger... button. This will open
the PicoScope3000 Trigger dialog box.
Options...
To set the options for the measurement (such as units and scaling) click the Options...
button. This will open the Parameter options dialog box.
5.2.7.4
PicoScope 3000 Streaming
Accessed via the OK button on the Converter details dialog box. Note: This dialog box
is accessible only when Recording method has been selected as Streaming on the
Recording dialog box.
This dialog box is used to select the sampling rate and channels for streaming data
recording.
Number of samples
This specifies the number of samples to be taken during the whole recording.
Sample interval
This is the time between successive samples.
Copyright 2005 Pico Technology Limited. All rights reserved.
PLW044-1.5
PicoLog User Guide
77
Range
This specifies the voltage range for the measurement. Set to 'Off' if the channel is not
required.
The 'Auto' option simply sets the voltage range to its widest setting, and leaves it there for
the duration of the recording.
Name
This is the name of the measurement. This name will appear on all reports.
AC/DC
This specifies whether the input is to be AC or DC coupled.
Options...
To set the options for the measurement (such as units and scaling) click the Options...
button. This will open the Parameter options dialog box.
5.2.7.5
PicoScope 3000 Trigger
Accessed via the Trigger... button on the PicoScope3000 Block-Mode dialog box.
Triggering is used to select the moment at which PicoLog starts collecting data - usually
at some fixed time before or after a trigger event.
A trigger event occurs when a specified channel crosses a voltage threshold - either rising
or falling. PicoLog can start collecting data immediately after the trigger event, or a fixed
time interval before or after the trigger event.
Channel
This selects which channel is to be used as the trigger input. Select 'None' if a trigger is
not required.
Note: PicoLog will allow you to trigger on a channel that is not capturing data. However, the
channel will need to be activated, and therefore other settings may be affected ... such as
the available timebases. If you need to trigger on an inactive channel, we recommend that
you use the External Trigger Input.
Direction
The trigger direction can be either rising or falling. If rising is selected, the trigger event
occurs when the voltage rises across the trigger threshold.
PLW044-1.5
Copyright 2005 Pico Technology Limited. All rights reserved.
Dialog boxes
78
Threshold
This shows the voltage (in millivolts) that the trigger channel must cross in order for a
trigger event to occur.
Delay
This controls the time delay, as a percentage of the sweep time, between the trigger
event and the start of collecting data. A negative delay means that the computer will show
data that was recorded before the trigger event; for example, -50% places the trigger
event in the middle of the collected data and -100% means that all data is collected
before the trigger.
Note: When a negative delay is selected, the unit will need to buffer enough data before the
trigger point. This will stop the unit triggering until it has collected the minimum number of
data points.
Auto trigger
If you wish PicoLog to trigger after a specified time - even if no trigger event occurs check this box.
Auto trigger after
The time after which PicoLog will trigger automatically, even if no trigger event occurs
(only used if the Auto-trigger is enabled).
5.2.7.6
Device status
Accessed via the Status button on the Converter details dialog box.
This dialog box displays the details about the ADC status.
Copyright 2005 Pico Technology Limited. All rights reserved.
PLW044-1.5
PicoLog User Guide
79
5.2.8
Demo
5.2.8.1
Demo measurements
To access this dialog box, assuming you have opened the demo version of PicoLog,
select Input channels... from the Settings menu.
This dialog box displays a list of the measurements that you wish to take.
Add
To add a measurement to the list, click the Add button. This will open the
Edit demo measurement dialog box so you can enter the details.
Edit
To edit a measurement in the list, highlight it and click the Edit button. This will open the
Edit demo measurement dialog box so that you can edit the details.
Delete
To delete a measurement in the list, highlight it and click the Delete button.
5.2.8.2
Edit demo measurement
Accessed via the Edit button on the Demo measurements dialog box.
This dialog box is used to enter the details for a measurement.
PLW044-1.5
Copyright 2005 Pico Technology Limited. All rights reserved.
Dialog boxes
80
Name
This is the name of the measurement. This name will appear on all reports.
Channel
This is the channel that will take the measurement.
Measurement
This specifies the type of measurement that will be made. The options are:
DC volts - the DC component or average input voltage.
AC volts - the RMS AC voltage (note that this excludes any DC component).
dB - AC volts converted to decibels.
Frequency - the frequency of the AC component, in hertz.
Voltage range
This specifies the voltage range for the measurement.
Scan time
This is the total time to take the set of readings for a sample. The scan time should be at
least three cycles at the minimum frequency that you wish to measure.
Options
To set the options for the measurement (such as units and scaling) click the Options
button. This will open the Parameter options dialog box.
5.2.8.3
Demo block
Accessed via the OK button on the Converter details dialog box. Note: This dialog box is
only accessible when Recording method has been selected as Fast block on the
Recording dialog box.
This dialog box only applies to the block method of recording. It is used to select the
channels that will be used to take measurements.
Time per sample
The timing is set in the unit itself, so the time per sample is guaranteed. Choose from the
given list.
Copyright 2005 Pico Technology Limited. All rights reserved.
PLW044-1.5
PicoLog User Guide
81
Total time
This is the time over which you want to collect the data. If this is not long enough, more
time will automatically be taken.
Number of samples
This specifies the number of samples to be taken during a block.
Name
This is the name of the measurement. This name will appear on all reports.
Range
This specifies the voltage range for the measurement.
Trigger
To enter the trigger details for the measurement click the Trigger... button. This will open
the DrDAQ Trigger dialog box.
Options
To set the options for the measurement (such as units and scaling) click the Options...
button. This will open the Parameter options dialog box.
5.2.8.4
Demo streaming
Accessed via the OK button on the Converter details dialog box. Note: This dialog box is
only accessible when Recording method has been selected as Fast block on the
Recording dialog box.
This dialog box only applies to the block method of recording. It is used to select the
channels that will be used to take measurements.
Number of samples
This specifies the number of samples to be taken during the whole recording.
Sample interval
The time between successive samples.
Range
This specifies the voltage range for the measurement.
PLW044-1.5
Copyright 2005 Pico Technology Limited. All rights reserved.
Dialog boxes
82
Name
This is the name of the measurement. This name will appear on all reports.
Options
To set the options for the measurement (such as units and scaling) click the Options...
button. This will open the Parameter options dialog box.
5.2.8.5
Demo trigger
Accessed via the Trigger button on the Demo block dialog box.
Triggering is used to select the moment at which PicoLog collects data - usually at some
fixed time before or after a trigger event.
A trigger event occurs when a specified channel crosses a voltage threshold - either rising
or falling. PicoLog can start collecting data immediately after the trigger event, or a fixed
time interval before or after the trigger event.
Trigger enable
If you wish to collect data only when the specified trigger conditions occur, check the
Trigger Enable box. If the box is not checked, data is displayed continuously.
Direction
The trigger direction can be either rising or falling. If rising is selected, the trigger event
occurs when the voltage rises across the trigger threshold.
Channel
This selects which channel is to be used as the trigger input.
Threshold
This shows the voltage (in mV) that the trigger channel must cross in order for a trigger
event to occur.
Delay
This controls the time delay, as a percentage of the sweep time, between the trigger
event and the start of collecting data. A negative delay means that the computer will show
data that was recorded before the trigger event - for example, -50% places the trigger
event in the middle of the collected data and -100% means that all data is collected
before the trigger.
Copyright 2005 Pico Technology Limited. All rights reserved.
PLW044-1.5
PicoLog User Guide
83
Auto trigger
If you wish PicoLog to trigger after a specified time - even if no trigger event occurs check this box. This will prevent PicoLog from waiting indefinitely for the event and locking
up the computer.
Auto trigger after
The time after which PicoLog will trigger if no trigger event occurs.
5.2.8.6
Device status
Accessed via the Status button on the Converter details dialog box.
This dialog box displays the details about the ADC status.
PLW044-1.5
Copyright 2005 Pico Technology Limited. All rights reserved.
Dialog boxes
5.2.9
DrDAQ
5.2.9.1
DrDAQ measurements
84
To access this dialog box, assuming you have already set up PicoLog with a DrDAQ unit,
select Input channels... from the Settings menu.
This dialog box is used to build up a list of measurements to measure for a converter. On
the left is the current list of measurements and on the right are buttons to update the list.
Add
To add a measurement to the list, click the Add... button. This will open the a dialog box
to enter details of the new measurement.
Edit
To edit a measurement in the list, highlight it and click the Edit... button. This will open the
Edit DrDAQ Measurement dialog box so that you can edit the details.
Delete
To delete a measurement in the list, highlight it and click the Delete button.
At the bottom are controls to determine when the digital output and the LED are to be
turned on. The options are:
Always on - the output is always on
On when recording - the output is on whilst PicoLog is recording
Off during alarm - the output is turned on when no alarm condition is present
On during alarm - the output is turned on when an alarm condition is present
Copyright 2005 Pico Technology Limited. All rights reserved.
PLW044-1.5
85
PicoLog User Guide
5.2.9.2
Edit DrDAQ Measurement
Accessed via the Edit button on the DrDAQ measurements dialog box.
This dialog box is used to enter the details for a measurement.
Name
This is the name of the measurement. This name will appear on all reports.
Channel
This is the channel to be used for the measurement.
Scaling
For some sensors, more than one scaling is available. If so, this option is used to select
the scaling that you wish to use.
Measurement
This specifies the type of measurement that will be made. The options are:
DC signal - the DC component or average input signal.
AC signal - the RMS AC signal (note that this excludes any DC component).
Frequency - the frequency of the AC component, in hertz.
Note: AC signal and Frequency are not available for slowly changing channels
Scan time
PicoLog takes a set of readings at high speed and then uses these readings to calculate
the selected measurement (DC signal, AC signal or Frequency). The scan time is the total
time to take the set of readings for this measurement.
When making DC signal measurements, a longer scan time will reduce the effects of
noise. Note, however, that the sum of the scan times for all channels must not exceed the
sampling interval used for recording.
When making AC signal or Frequency measurements, the scan time should be at least
three cycles at the minimum frequency that you wish to measure. For example, if you
wish to measure a 50 Hz AC signal, one cycle is 20 ms, and three cycles are 60 ms.
Options
To set the options for the measurement (such as units and scaling) click the Options...
button. This will open the Parameter options dialog box.
PLW044-1.5
Copyright 2005 Pico Technology Limited. All rights reserved.
Dialog boxes
5.2.9.3
86
DrDAQ block
Accessed via the OK button on the Converter details dialog box. Note: This dialog box is
accessible only when Recording method has been selected as Fast block on the
Recording dialog box.
This dialog box is used to select the channels and sampling rate for fast recording.
Edit
To select a channel, highlight it and click the Edit... button. This will open the edit channel
dialog box so that you can enter the details.
Number of samples
This specifies the preferred number of samples to be taken during a block.
Total time
This is the preferred time over which you want to collect the specified number of samples.
Sampling approximation
The ADC unit and the PC both have performance limits and will rarely be able to give
exactly the settings that are requested. PicoLog will attempt to negotiate similar settings
based on two user options:
Total time stays constant - The time will remain very similar and the number of
samples will be adjusted
Number of samples stays constant - The number of samples will remain very similar
and the time will be adjusted
Copyright 2005 Pico Technology Limited. All rights reserved.
PLW044-1.5
PicoLog User Guide
87
When the OK button is clicked, the following dialog box will appear to check whether the
negotiated settings are acceptable (The dialog box below does not represent the actual
settings for this ADC):
(Results will vary on different PCs and in different situations)
Disable
To disable a measurement in the list, highlight it and click the Disable button.
Trigger
To enter the trigger details for a measurement, highlight it and click the Trigger button.
This will open the DrDAQ Trigger dialog box.
5.2.9.4
DrDAQ Trigger
Accessed via the Trigger button on the DrDAQ block dialog box.
Triggering is used to select the moment at which PicoLog starts collects data - usually at
some fixed time before or after a trigger event.
A trigger event occurs when the specified channel crosses a voltage threshold - either
rising or falling. PicoLog can start collecting data immediately after the trigger event, or a
fixed time interval before or after the trigger event.
Trigger enable
If you wish to collect data only when the specified trigger conditions occur, check this box.
If the box is not checked, data is displayed continuously.
PLW044-1.5
Copyright 2005 Pico Technology Limited. All rights reserved.
Dialog boxes
88
Direction
The trigger direction can be either rising or falling. If rising is selected, the trigger event
occurs when the voltage rises across the trigger threshold.
Channel
This selects which channel is to be used as the trigger input.
Threshold
This shows the voltage (in channel units) that the trigger channel must cross in order for a
trigger event to occur.
Delay
This controls the time delay, as a percentage of the sweep time, between the trigger
event and the start of collecting data. A negative delay means that the computer will show
data that was recorded before the trigger event - for example, -50% places the trigger
event in the middle of the collected data and -100% means that all data is collected
before the trigger.
Auto trigger
If you wish PicoLog to trigger after a specified time - even if no trigger event occurs check this box. This will prevent PicoLog from waiting indefinitely for the event and locking
up the computer.
Note: If you disable auto-trigger and the computer does lock up, you can press the F9 key
to simulate a trigger.
Auto trigger after
The time after which PicoLog will trigger, even if no trigger event occurs.
5.2.9.5
Device status
Accessed via the Status button on the Converter details dialog box.
This dialog box displays the details about the ADC status.
Copyright 2005 Pico Technology Limited. All rights reserved.
PLW044-1.5
PicoLog User Guide
89
5.2.10 RH-02
5.2.10.1 RH-02 Channels
To access this dialog box, assuming you have already set up PicoLog with an RH-02 unit,
select Input channels... from the Settings menu.
This dialog box is used to select the channels that will be used to take measurements.
Edit
To select a channel, first highlight it, then click the Edit... button. This will open the
Edit RH02 Channel dialog box so that you can enter the details.
Disable
To disable a previously selected channel, highlight it and then click the Disable button.
5.2.10.2 Edit RH-02 Channel
Accessed via the Edit button on the RH02 Channels dialog box.
This dialog box is used to enter the details for a channel.
Name
This is the name of the channel. This name will appear on all reports.
Filter enable
If you want to use a filter to reduce the effects of electrical noise, check this box.
Options
To set the options for a parameter, click the Options... button.
PLW044-1.5
Copyright 2005 Pico Technology Limited. All rights reserved.
Dialog boxes
90
5.2.10.3 Device status
Accessed via the Status button on the Converter details dialog box.
This dialog box displays the details about the ADC status.
Copyright 2005 Pico Technology Limited. All rights reserved.
PLW044-1.5
PicoLog User Guide
91
5.2.11 HumidiProbe
5.2.11.1 HumidiProbe Channels
You should have previously set up PicoLog with a HumidiProbe unit. To access this
dialog box, select Input channels... from the Settings menu.
This dialog box is used to select the channels that will be used to take measurements.
Edit
To select a channel, first highlight it, then click the Edit... button. This will open the
Edit HumidiProbe Channel dialog box so that you can enter the details.
Disable
To disable a previously selected channel, highlight it and then click the Disable button.
5.2.11.2 Edit HumidiProbe Channel
Accessed via the Edit button on the HumidiProbe Channels dialog box.
This dialog box is used to enter the details for a channel.
Name
This is the name of the channel. This name will appear on all reports.
Filter enable
If you want to use a filter to reduce the effects of electrical noise, check this box.
Options
To set the options for a parameter, click the Options... button.
PLW044-1.5
Copyright 2005 Pico Technology Limited. All rights reserved.
Dialog boxes
92
5.2.11.3 Device status
Accessed via the Status button on the Converter details dialog box.
This dialog box displays the details about the HumidiProbe's status.
Copyright 2005 Pico Technology Limited. All rights reserved.
PLW044-1.5
PicoLog User Guide
93
5.2.12 USB TC-08
5.2.12.1 USB TC-08 Channels
To access this dialog box, assuming you have already set up PicoLog with a USB TC-08
unit, select Input channels... from the Settings menu.
This dialog box is used to select the channels that will be used to take measurements.
Edit
To select a channel, first highlight it, then click the Edit... button (or double left-click with
the mouse). This will open the Edit TC08 Channel dialog box so that you can setup the
channel.
Disable
To disable a previously selected channel, highlight it in the list window and click the
Disable button.
Mains Frequency
The USB TC-08 can filter out the noise associated with mains. Select the option
corresponding to the frequency of mains in your country.
5.2.12.2 Edit USB TC-08 Channel
Accessed via the Edit button on the TC08 Channels dialog box.
This dialog box is used to enter the details for a channel.
PLW044-1.5
Copyright 2005 Pico Technology Limited. All rights reserved.
Dialog boxes
94
Name
This is the name of the channel. This name will appear on all reports.
Thermocouple
This is the thermocouple type connected to the channel. There are eight valid
thermocouple types: B, E, J, K, R, S, T, and N.
There is also a ±78.125 millivolt range.
Filter enable
If you want to use a filter to reduce the effects of electrical noise, check this box.
Filter factor
A median filter is applied when 'filter factor' number of samples have been collected,
returning the middle value. Filtered values are more stable, but respond more slowly to
real changes in temperature. The higher the factor, the stronger the filtering effect will be.
Options
To set the options for a parameter, click the Options... button.
5.2.12.3 Device status
Accessed via the Status button on the Converter details dialog box.
This dialog box displays the details about the ADC status. The calibration date will help
you keep track of when the unit should be returned to Pico for annual recalibration
(optional).
Copyright 2005 Pico Technology Limited. All rights reserved.
PLW044-1.5
PicoLog User Guide
95
5.2.13 Serial TC-08
5.2.13.1 TC-08 Channels
To access this dialog box, assuming you have already set up PicoLog with a TC-08 unit,
select Input channels... from the Settings menu.
This dialog box is used to select the channels that will be used to take measurements.
Edit
To select a channel, first highlight it, then click the Edit... button (or double left-click with
the mouse). This will open the Edit TC08 Channel dialog box so that you can setup the
channel.
Disable
To disable a previously selected channel, highlight it in the list window and click the
Disable button.
Resolution
The Serial TC-08 can run at a range of resolutions, and will run faster at lower
resolutions.
5.2.13.2 Edit TC-08 Channel
Accessed via the Edit button on the TC08 Channels dialog box.
This dialog box is used to enter the details for a channel.
PLW044-1.5
Copyright 2005 Pico Technology Limited. All rights reserved.
Dialog boxes
96
Name
This is the name of the channel. This name will appear on all reports.
Thermocouple
This is the thermocouple type connected to the channel. There are eight valid
thermocouple types: B, E, J, K, R, S, T, and N.
There is also a ±60 millivolt range.
Filter enable
If you want to use a filter to reduce the effects of electrical noise, check this box.
Filter factor
A median filter is applied when 'filter factor' number of samples have been collected,
returning the middle value. Filtered values are more stable, but respond more slowly to
real changes in temperature. The higher the factor, the stronger the filtering effect will be.
Options
To set the options for a parameter, click this button.
5.2.13.3 Device status
Accessed via the Status button on the Converter details dialog box.
This dialog box displays the details about the ADC status.
Copyright 2005 Pico Technology Limited. All rights reserved.
PLW044-1.5
PicoLog User Guide
97
5.2.14 TH-03
5.2.14.1 TH-03 Channels
To access this dialog box, assuming you have already set up PicoLog with a TH-03 unit,
select Input channels... from the Settings menu.
This dialog box is used to select the channels that will be used to take measurements.
Edit
To select a channel, first highlight it, then click the Edit... button. This will open the
Edit TH03 Channel dialog box so that you can enter the details.
Disable
To disable a previously selected channel, highlight it and then click the Disable button.
5.2.14.2 Edit TH-03 Channel
Accessed via the Edit button on the TH03 Channels dialog box.
This dialog box is used to enter the details for a channel.
Name
This is the name of the channel. This name will appear on all reports.
PLW044-1.5
Copyright 2005 Pico Technology Limited. All rights reserved.
Dialog boxes
98
Sensor type
This is the sensor connected to the channel. There are seven choices:
EL015 (Low temp) is a thermistor sensor suitable for measuring temperatures in the
range -30 to 70°C.
EL029 Doorswitch is a magnetic sensor, which senses if a door is open or closed.
EL031 Light is a sensor suitable for measuring light intensity.
EL039 (Low Temp) is a thermistor sensor suitable for measuring temperatures in the
range -40 to 30°C.
Medium temp is a thermistor sensor suitable for measuring temperatures in the range
0 to 70°C.
High temp is a thermistor sensor suitable for measuring temperatures in the range 0 to
300°C.
Unicam (OEM)
Filter enable
If you want to use a filter to reduce the effects of electrical noise, check this box.
Filter factor
Each time a reading is taken, the filtered value is updated using the equation:
new value = old value + (reading - old value) / (filter factor)
Filtered values are more stable, but respond more slowly to real changes in temperature.
The higher the factor, the stronger the filtering effect will be.
Options
To set the options for a parameter, click the Options... button.
5.2.14.3 Device status
Accessed via the Status button on the Converter details dialog box.
This dialog box displays the details about the ADC status.
Copyright 2005 Pico Technology Limited. All rights reserved.
PLW044-1.5
PicoLog User Guide
99
5.2.15 PT104
5.2.15.1 Pt104 channels
To access this dialog box, assuming you have already set up PicoLog with a PT104 unit,
select Input channels... from the Settings menu.
This dialog box is used to select the channels that will be used to take measurements.
Edit
To select a channel, first highlight it, then click the Edit... button. This will open the
Edit PT104 Channel dialog box so that you can enter the details.
Disable
To disable a previously selected channel, highlight it and then click the Disable button.
Mains Frequency
Select the mains frequency according to your location.
PLW044-1.5
Copyright 2005 Pico Technology Limited. All rights reserved.
Dialog boxes
100
5.2.15.2 Edit PT104 Channel
Accessed via the Edit button on the Pt104 channels dialog box.
This dialog box is used to enter the details for a channel.
Name
This is the name of the channel. This name will appear on all reports.
Data type / Circuit
Select the appropriate settings for the sensor you are using.
Filter enable
If you want to use a filter to reduce the effects of electrical noise, check this box.
Options
To set the options for a parameter, click the Options... button.
5.2.15.3 Device status
Accessed via the Status button on the Converter details dialog box.
This dialog box displays the details about the ADC status.
Copyright 2005 Pico Technology Limited. All rights reserved.
PLW044-1.5
PicoLog User Guide
101
6
Equipment overview
PicoLog takes measurements using one or more converters. These devices connect to
the serial or parallel port on your computer and convert electrical signals into
measurements.
PicoLog can work with up to ten converters at the same time in real time recording mode
but can only work with one converter in fast block mode.
6.1
ADC-10/12/40/42
These units plug into the parallel port and provide a single analogue input. The following
table shows their differences:
Converter
Resolution
Range
ADC-10
8 bits
0 to 5 V
ADC-12
12 bits
0 to 5 V
ADC-40
8 bits
-5 to +5 V
ADC-42
12 bits
-5 to +5 V
Both realtime and block modes are supported.
You can connect these units to signal conditioners using a CM001 signal conditioner
adapter.
You can connect up to three units to the same computer.
6.2
ADC-11/22
The ADC-11 and ADC-22 are 10-bit converters with an input range of 0 to 2.5 V. The
ADC-11 has 11 input channels and the ADC-22 has 22 channels.
There is no provision for connection to signal conditioners as these devices are unipolar.
It would be possible to use these devices with signal conditioners that do not produce
negative voltages.
Both realtime and block modes are supported.
You can connect up to three units to the same computer.
6.3
ADC-16
The ADC-16 is high resolution converter that offers eight analogue input channels.
You can use the CM002 signal conditioner adapter to connect up to four signal
conditioner modules.
The conversion time for the ADC-16 is over a second, so block mode is not supported.
You can connect up to nine ADC-16 units to the same computer.
PLW044-1.5
Copyright 2005 Pico Technology Limited. All rights reserved.
Equipment overview
6.4
102
ADC-100/101
The ADC-100 and ADC-101 are two-channel high-speed devices with programmable
input voltage ranges. The ADC-101 has higher voltage ranges and differential inputs.
Both realtime and block modes are supported.
You can connect these units to signal conditioners using a CM001 signal conditioner
adapter.
You can connect up to three units to the same computer.
6.5
ADC-200
The ADC-200/212/216 devices have two inputs and programmable voltage input ranges.
All devices collect samples at precise time intervals to an internal buffer.
Both realtime and block modes are supported.
You can connect these units to signal conditioners using a CM001 signal conditioner
adapter.
You can connect up to three units to the same computer.
6.6
PicoScope 2000 Series
The PicoScope 2000 Series PC Oscilloscopes have two or more input channels with a
number of selectable voltage input ranges. All devices use the USB 2.0 interface at High
Speed and also support operation with USB 1.1 ports and hubs.
The devices operate in any of the following modes:
Real time continuous mode
The unit collects data at medium speed and transmits to the PC one sample at a time.
This mode results in the fastest screen updates but is limited in speed to several
milliseconds between samples.
Block mode
The unit collects data at high speed to an internal buffer, then downloads to the PC in
one operation. This mode allows the fastest sampling rates but cannot collect data
continuously.
Streaming mode
The unit collects and downloads data continuously with a guaranteed sampling interval.
For fastest sampling, use block mode.
You can connect up to four units to the same PC.
Copyright 2005 Pico Technology Limited. All rights reserved.
PLW044-1.5
PicoLog User Guide
103
6.7
PicoScope 3000 Series
The PicoScope 3000 Series PC Oscilloscopes have two or more input channels with a
number of selectable voltage input ranges. All devices use the USB 2.0 interface at High
Speed and also support operation with USB 1.1 ports and hubs.
The devices operate in any of the following modes:
Real time continuous mode
The unit collects data at medium speed and transmits to the PC one sample at a time.
This mode results in the fastest screen updates but is limited in speed to several
milliseconds between samples.
Block mode
The unit collects data at high speed to an internal buffer, then downloads to the PC in
one operation. This mode allows the fastest sampling rates but cannot collect data
continuously.
Streaming mode
The unit collects and downloads data continuously with a guaranteed sampling interval.
For fastest sampling, use block mode.
You can connect up to four units to the same PC.
6.8
Demo
You can use the demo device to evaluate the functions available in PicoLog before you
buy a Pico product. The device produces two channels of simulated data.
PLW044-1.5
Copyright 2005 Pico Technology Limited. All rights reserved.
Equipment overview
6.9
104
DrDAQ
DrDAQ is a medium-speed analog-to-digital converter with nine channels. The channels
are as follows:
Channel
Connector
Range
Sound waveform
built in
+/-100
Sound level
built in
55 to 100 dBA
Voltage
Screw terminal
0 to 5 V
Resistance
Screw terminal
pH
BNC
0 to 1 MW
0 to 14
Light
Built in
0 to 100
Temperature
Built in
0°C to 70°C
External 1
FCC68 4-pin
automatic
External 2
FCC68 4-pin
automatic
The external sensor inputs automatically detect the type of sensor and scale the input
accordingly.
DrDAQ has two outputs: a digital output and an LED. These outputs can be turned on
permanently, only during recording or only when an alarm condition exists.
Note: DrDAQ can capture 15k samples per second, but we recommend using PicoScope
for sample rates of 1 millisecond or faster. DrDAQ is intended for educational use, and to
simplify usage, block mode is disabled if PicoLog is installed for DrDAQ.
6.10
RH-02
The RH-02 connects to the serial port on your computer and measures temperature and
humidity. Even if only humidity is required, both types of measurement must be taken.
You can connect up to nine RH-02 units to the same computer.
The conversion time for the RH-02 is over a second, so block mode is not supported.
6.11
HumidiProbe
The HumidiProbe connects to the USB port on your computer and measures temperature
and humidity. Even if only humidity is required, both types of measurement are always
taken.
You can connect up to four HumidiProbe units to the same PC.
The conversion time for the HumidiProbe is two seconds, so block mode is not
supported.
Copyright 2005 Pico Technology Limited. All rights reserved.
PLW044-1.5
PicoLog User Guide
105
6.12
USB TC-08
The USB TC-08 works with thermocouples of any standard type, and you can also use
any combination of channels to measure a voltage range of ±70 mV. The thermocouples
are cold-junction compensated (the cold junction temperature can be monitored as an
extra channel in PicoLog).
The USB TC-08 is compatible with USB 1.1 and supports streaming with a guaranteed
sampling interval of 40 milliseconds per active channel + 40 milliseconds cold junction (for
example, for 3 active channels, the minimum interval is 160 milliseconds).
(PicoLog does not currently support streaming operation)
You can connect up to ten converters to PicoLog simultaneously. These can all be
USB TC-08s for a maximum of 80 thermocouple channels.
6.13
Serial TC-08
The Serial TC-08 works with thermocouples of any standard type, and can also be used
to measure voltages up to 60 mV. The conversion time for the TC-08 is over a second, so
block mode is not supported.
Each TC-08 unit provides eight inputs.
You can connect up to nine TC-08 units to the same computer.
6.14
TH-03
The TH-03 is designed to measure temperatures. It can also be used to provide a
qualitative measure of light level and to monitor a switch (e.g. a door switch). The
conversion time for the TH-03 is over a second, so block mode is not available.
Each TH-03 unit provides three inputs.
You can connect up to nine TH-03 units to the same computer.
6.15
IP sockets
PicoLog has built-in support for transferring data over an IP network.
One computer supplies the data and is referred to as the server. The other computer
(referred to as the client) receives data from the server and displays the measurements
as if they were collected locally. A server can support any number of clients and a client
can get data from up to 10 servers.
A client needs two pieces of information to talk to a server: the name of the server and a
socket number (normally 1050). The server does not need to know anything about the
client.
The link uses the UDP/IP protocol. This is very efficient but does not guarantee that every
message will get through. On large networks, a lost message would result in a delayed
data update on the client.
See the Transfer data over an IP network section for detailed instructions on setting up a
link.
PLW044-1.5
Copyright 2005 Pico Technology Limited. All rights reserved.
Equipment overview
6.16
106
Signal conditioners
The Pico range of signal conditioners provide a quick and easy way of connecting
sensors to Pico Converters. PicoLog has built-in scaling to use the signal conditioners
with a wide range of sensors. To enable signal conditioner scaling for a measurement:
1. On the measurement dialog box, click the Options button
2. Click the Conditioners button
3. Select the signal conditioner type (the sensors dialog box will be updated to show the
selection of sensors that work with this signal conditioner)
4. Select the sensor type
For more information about signal conditioners, and about the . PSC files that contain
details about them, please consult the signal conditioner help file.
Copyright 2005 Pico Technology Limited. All rights reserved.
PLW044-1.5
PicoLog User Guide
107
7
Technical information
7.1
.ini preferences file
The preference file, plw.ini, contains two sections: [General] and [Preferences].
These sections contain the following items:
[General]
DataPath
Alternate path for data files
UserName
Text to display in the footer for printed reports
Language
Language code (see Language dialog box)
Serial
Serial number for PicoLog
VersionWarning
Version warning state (tells to check web for update)
[Preferences]
Colour0 - (0 to 16)
Colour of a graph component in COLORREF format (see Colours dialog box)
CustomColour0 - (0 to 15)
Custom colors used by the standard windows colour selection dialog box in
COLORREF format (see Colours dialog box)
BeepOnReading
BeepOnLamp
BeepOnAlarm
Sound options (see Sounds dialog box)
Fahrenheit
See Temperatures dialog box (Yes = Fahrenheit, No = Celsius)
QuickSampleMs
Minimum sample interval for which AC/frequency measurement is possible (default is
1000 ms). Warning: reducing this will significantly slow down the sampling speed of
some ADC units by preventing the Quick sample mode from being active at sampling
intervals up to 1000 ms.
AllowStandby
By default, PicoLog prevents a PC from automatically going to the power-saving
Standby mode. If AllowStandby=Yes then PicoLog will not interfere with power
saving operations.
DemoMode
Use to override the installation setting for whether or not PicoLog is in Demo mode.
However, the product drivers will need to be reinstalled if PicoLog was installed in
Demo mode (Yes = Demo, No = Normal).
Note: Do not attempt to save your data directly to a floppy disk.
PLW044-1.5
Copyright 2005 Pico Technology Limited. All rights reserved.
Technical information
7.2
108
.plw data file
The .plw file has a fixed-length header, followed by a data record for each sample. It is
terminated by a copy of the .pls file that was used to record it.
The first two-byte field of the header contains the length, in bytes, of the header. The
remaining fields are as follows:
UNS16: header_bytes; - the length, in bytes, of this header
char: signature [40]; "PicoLog for Windows"
UNS32: version;
UNS32: no_of_parameters; no of parameters recorded
UNS16: parameters [50];
UNS32: sample_no; same as no_of_samples, unless wraparound occurred
UNS32: no_of_samples; number of samples recorded so far
UNS32: max_samples;
UNS32: interval; sample interval
UNS16: interval_units; 0=femtoseconds, 4=milliseconds, 5=seconds, 6=minutes,
7=hours
UNS32: trigger_sample;
UNS16: triggered;
UNS32: first_sample;
UNS32: sample_bytes; length of each sample record
UNS32: settings_bytes; length of settings text after samples (copy of .pls file)
UNS32: start_date;
UNS32: start_time;
INT32: minimum_time;
INT32: maximum_time;
char: notes [1000];
INT32: current_time;
UNS8: spare [78];
Note: Do not attempt to save your data directly to a floppy disk.
7.3
.pls settings file
PicoLog uses recorder.pls to hold information about the current recording session. A
separate file, player.pls, holds information about the current player session.
The user can use the Save as... option in the File menu to save the current settings in a
named .pls file. These details can later be loaded to carry out a new test with the same
settings.
The recorder.pls file is also written to the end of each .plw data file and is
automatically reloaded when an old .plw file is loaded.
Copyright 2005 Pico Technology Limited. All rights reserved.
PLW044-1.5
PicoLog User Guide
109
All settings files are in windows .ini format and could be edited using a text editor,
although this is not recommended. The file contains the following sections:
[Sampling]
This section contains details of recording and sampling.
[General]
Numbers of parameters, converters, etc
[Converter 1]
Generic converter details - type and port
[Unit 1]
Type-specific converter details
[Unit 1 Measure 1]
Details about a measurement from converter 1
[Parameter 1]
Information on the monitor window
[Recorder]
Information on the recorder window
[Graph1]
Information on the graph window
[XYGraph1]
Information on the XY graph window
[Spread1]
Information on the spreadsheet window
[File]
Current filename
Note: Do not attempt to save your data directly to a floppy disk.
7.4
Scaling file
This file is a text file containing information in the following format:
The first few lines define a number of keyword parameters. These lines are in the same
format as a Windows .ini file, with a keyword, an equals sign and then a value, for
example:
Units=°C
One of the keyword parameters is the scaling method and must always be included. The
remaining parameters are optional. The keywords for the optional parameters are listed
below.
After the optional parameters, the actual scaling information appears in the same format
as it is entered in the scaling dialog box.
The scaling method can be specified either in English or in the currently selected
language. If the scaling method is specified in English, it will be understood regardless of
what language is selected.
For a lookup table with just two pairs, the file would look like this:
Notes=LM35CZ Temperature sensor
Type=Table
Units=°C
-0.02
-20
0.1
100
PLW044-1.5
Copyright 2005 Pico Technology Limited. All rights reserved.
Technical information
110
For an equation, the file would look like this:
Notes=Temperature in Fahrenheit from LM35CZ
Type=Equation
32 + x *0.005555
The optional parameters are:
Notes
You can include one or more lines of notes to explain what this scaling file is to be
used for. The first few lines of the scaling file are displayed when the file is loaded, so
the notes give the user an indication that they have loaded the correct scaling file.
Units
The unit text to be shown on graphs, spreadsheets etc
Width
The field width when the parameter appears in spreadsheeets
Places
The number of decimal places to display
MinValue
The minimum value for graphs
MaxValue
The maximum value for graphs
Some of the optional parameters will automatically set the fields on the 'Parameter
options' dialog box, for example the units, range etc. See the Parameter options dialog
box for more information on these parameters
7.5
Signal conditioner file
PicoLog and other Pico software products are provided with a set of .psc files that
contain scaling information on a wide range of sensors. The Signal Conditioner dialog
box offers a choice of the sensors in these files.
Users can add their own scaling information by creating additional .psc files. These will
be used automatically. It may, however, be easier to use the standard Parameter scaling
facilities of PicoLog.
See the Signal Conditioner help file for more information about these files.
7.6
Command line options
The following command line options can be specified when you start PicoLog:
-p
-r
xxxx.pls
Start PicoLog in Player mode
Restart recording
Load the settings from xxxx.pls
Copyright 2005 Pico Technology Limited. All rights reserved.
PLW044-1.5
PicoLog User Guide
111
7.7
Multiple program instances
You can have more than one copy of PicoLog running at once. This means that you can
use one copy to examine old data files whilst another copy is collecting a new data file.
You can have more than one 'player' open to examine old files, but only one recorder is
allowed.
To start PicoLog as a recorder, click the Recorder icon in the Pico Technology program
group.
To start PicoLog as a player, you can either click the Player icon in the Pico Technology
program group or, if you already have a recorder running, select the Player window from
the View menu.
See also the -p option for the startup command.
7.8
DDE
Stands for Dynamic Data Exchange. This is a convenient method of transferring the
current set of readings to other applications. Data is updated continuously, about once
per second.
Data items are identified by three keywords: Application, Topic and Item. The
keywords accepted by PicoLog are:
Application
Topic
Item
PLW
Current
Name - parameter name
Value - the current value
Units - the units
Alarm - the alarm status
Each DDE request returns a list of values for each parameter.
To read the current values into Excel, type the following command into a spreadsheet cell:
=PLW|Current!Value
To read the current values into Quattro Pro, type in the following command into a cell:
@DDELINK([PLW|Current]Value)
Most application programming languages (C, Delphi, Visual Basic) provide tools to make
DDE requests from other applications.
PLW044-1.5
Copyright 2005 Pico Technology Limited. All rights reserved.
Technical information
7.9
112
Equation notation
An equation can contain the following items:
Input parameters
These are represented by X for a measured parameter and A, B C D E for a calculated
parameter.
Numbers
These should be in fixed point decimal notation, such as 12.34. Exponential notation,
such as 1.234E1, is not supported.
Mathematical operators
See below
Mathematical functions
See below
Spaces
Operators
The operators follow the normal rules of operator precedence (BODMAS, for "Brackets,
Division, Multiplication, Addition, Subtraction"). If you wish to force a particular order of
evaluation, use brackets.
Notation
Description
Usage
()
brackets
(x - 5) * 6
-
unary minus
-x
-
binary minus
x-5
+
plus
x+5
*
times
x*5
/
divide
x/5
Functions
Name
Description
Usage
Example
exp
e^x
exp (x)
exp (3) = 20.085
log10
log10
log10 (x)
log10(100) = 2
ln
loge
ln (x)
ln(20.085) = 3
power
power
x power 5
2 power 3 = 8
mod
modulo (remainder)
x mod 5
10 mod 2 = 1
sqrt
square root
sqrt (x)
sqrt(2) = 1.414
Copyright 2005 Pico Technology Limited. All rights reserved.
PLW044-1.5
PicoLog User Guide
113
7.10
Glossary
.bmp
Bitmap file format, used for uncompressed images. The bitmap format is a very widely
supported generic image format. The files are not usually compressed, and are therefore
very large, but the image quality is very high.
.jpg
JPEG file format, used for compressed images. JPEG stands for Joint Photographic
Expert Group and is the image format most widely supported across all platforms.
.pls
PicoLog settings file. This holds data about the setup of the current recording session, but
does not hold data collected from the converter.
.plw
PicoLog data file. This file holds the data collected from the converter, and ends with a
copy of the .pls PicoLog settings file.
.prn
The print file exported from the spreadsheet window is formatted with 'tab-separated
values'. The data fields are separated by tabs and each record is separated with a
carriage return, as in the following example:
Time (s)
Sound Level (dBA)
0
55.5
1
55.4
2
56.2
.scl
Pico scaling file. It contains data about a specific type of sensor. Some files such as
PT100.scl, are installed with the application and can be loaded from the
Parameter scaling dialog box whilst the 'Use scaling from file' option is selected. The data
can be used to calibrate the sensor, or to scale it to a particular measurement unit.
.wmf
Windows Metafile. PicoLog uses this vector-based format because it produces scalable
images and has a small file size.
ADC
Analog to Digital Converter. Pico ADCs range from the single-channel ADC-10 to the 100
MS/s ADC-200. ADCs sample analog signals and convert them to digital data for storage
and processing.
Client
The client computer requests and receives information from a server. Therefore when
setting up an IP Network arrangement, the server is attached to the converter and passes
data to the client, which then receives and records it.
COLORREF
'C' language typedef of unsigned long used by windows. For more information, search
http://msdn.microsoft.com/library/.
PLW044-1.5
Copyright 2005 Pico Technology Limited. All rights reserved.
Technical information
114
Converter
See ADC.
IP socket
Internet Protocol socket. An IP socket simply defines the data transfer protocol and the
socket via which the server and client communicate. The default socket number is 1050.
Note: An IP socket is not a physical port.
Port
A physical connector, usually on the back of the computer, to which Pico converters are
attached.
USB - Units that support USB natively do not have port numbers
Parallel - LPT1, LPT2, etc. (sometimes known as a printer port)
Serial - COM1, COM2, etc.
Parallel Port USB adapter - USB-PP1, USB-PP2, etc.
Server
Receives data requests from the client and returns data as a response. When you set up
an IP Network, therefore, the server is attached to the converter and passes data to the
client, which then receives and records it.
USB 1.1
Universal Serial Bus (Full Speed). It can support data transfer rates up to 12 Mbits per
second. USB 1.1 was superseded by USB 2.0.
USB 2.0
Universal Serial Bus (High Speed). It can support data transfer rates up to 480 Mbits per
second and is the successor to USB 1.1.
Copyright 2005 Pico Technology Limited. All rights reserved.
PLW044-1.5
115
PicoLog User Guide
Index
.
.ini files
.pls files
.plw files
.prn files
.txt files
.wmf files
107, 108
108
108
12
12
18
A
ADC 6
ADC-10/12/40/42 101
Adding measurements 47
Defining a block 49
Editing measurements 48
Status check 51
Trigger setup 50
ADC-100/101 102
Adding measurements 59
Defining a block 60
Editing measurements 59
Status check 62
Trigger setup 61
ADC-11/22 101
Adding measurements 52
Defining a block 53
Editing measurements 52
Status check 56
Trigger setup 55
ADC-16 101
Editing channels 57
Selecting channels 57
Status check 58
ADC-200 102
Adding measurements 63
Defining a block 64
Editing measurements 63
Status check 66
Trigger setup 65
Adding a calculated parameter 39
Adding a converter 30
Adding new measurements 15
Alarm 37
Assigning a channel name 34
PLW044-1.5
B
Buttons 9
Back a file 9
Copy to clipboard 18
Forwards a file 9
Help 8
New file 8, 16, 18
Open file 9
Pause/resume 8
Print view 17
Re-record 8, 16
Select channels 15
Start recording 8, 16
Stop recording 8
View Graph 17
View Notes 17
View options 18
View spreadsheet 17
C
Client 19, 105
Clipboard 10, 11, 12
Command line 110
Connecting to a server 33
Converters 3
ADC-10/12/40/42 101
ADC-100/101 102
ADC-11/22 101
ADC-16 101
ADC-200 102
Demo 103
DrDAQ 104
HumidiProbe 104
PicoScope 2000 102
PicoScope 3000 103
RH-02 104
TC-08 105
TH-03 105
USB TC-08 105
D
Data file 108
DDE 111
Deleting a converter 30
Demo converter 103
Adding measurements
Defining a block 80
79
Copyright 2005 Pico Technology Limited. All rights reserved.
Index
Demo converter 103
Editing measurements 79
Status check 83
Streaming mode 81
Trigger setup 82
Dialog boxes 37
Alarm settings 37
Calculated parameters 39
Colours 45
Confirm File delete 27
Converter details 29
Converter preferences 31
Converters 30
Device status 34
Edit calculated parameters 40
Edit socket channel 34
Graph options 41
IP Socket options 32
Language 45
Parameter options 35
Parameter scaling 36
Print 27
Recording 25
Sampling Rate 26
Select parameters 38
Signal Conditioner 28
Socket channels 33
Sounds 46, 47
Spreadsheet options 44
Temperatures 46
XY options 43
Displaying data 17
DrDAQ 104
Adding measurements 84
Defining a block 86
Editing measurements 85
Status check 88
Trigger setup 87
E
Editing a calculated parameter 40
Editing a converter 30
Editing socket channels 33
Enabling a client 32
Enabling a server 32
Enabling an alarm 37
Enabling data and time scaling on a graph
18
Entering scaling details 15
Equation notation 112
Equipment 101
116
Excel 111
Exporting a graph to a word processor
Exporting data to a spreadsheet 18
18
F
Facilities 3
File menu 21
Delete File 21
Exit 21
New data 21
New settings 21
Open 21
Preferences 21
Save as... 21
File types 107, 108
.ini 107, 108
.pls 108
.plw 108
.prn 12
.txt 12
.wmf 18
G
Graph controls
10
H
Help menu 24
About... 24
Contents 24
Guided tour 24
Index 24
This view 24
Using help 24
HumidiProbe 104
Editing channels 91
Selecting channels 91
Status check 92
I
Introduction 3
IP network 19, 105
IP socket connection 34
IP sockets 19, 105
IP/UDP protocol 105
Copyright 2005 Pico Technology Limited. All rights reserved.
PLW044-1.5
117
PicoLog User Guide
K
Keyboard shortcuts
24
L
Legal information
5
M
Mathematical notation 112
Measurement types 4
Calculated values 4
Multiple values 4
Single readings 4
Measurements 4
Menu bar 21
Menus 21
File 21
Help 24
View 23
Menus. Settings 22
Monitor window 8
Multiple programs 111
Multiple recorders 20
N
Networking 19
Notes window 7, 14
O
Online help 3
Contents tab 3
Index tab 3
Oscilloscopes 102
PicoScope 2000 series units
PicoScope 3000 series units
Overview 3
102
103
P
PicoLog components 7, 8, 9, 10, 11, 12, 14
Monitor window 8
Notes window 7, 14
PLW Graph window 7, 10
PLW Player window 7, 9
PLW044-1.5
PLW Recorder window 7, 8
PLW XY Graph window 7, 11
Spreadsheet window 7, 12
PicoScope 2000 series 102
Adding measurements 67
Defining a block 69
Editing measurements 68
Status check 72
Streaming 70
Trigger setup 71
PicoScope 3000 series 103
Adding measurements 73
Defining a block 75
Editing measurements 74
Status check 78
Streaming 76
Trigger setup 77
Player controls 9
PLW Graph window 7, 10
Buttons 10
Horizontal controls 10
Vertical controls 10
PLW Player window 7, 9
Buttons 9
Controls 9
PLW Recorder window 7, 8
Buttons 8
Controls 8
Range indicators 8
PLW XY Graph window 7, 11
Buttons 11
Horizontal controls 11
Vertical controls 11
Preferences file 107
Preferences menu 21, 45
Colours 21, 45
Converter 21
IP Sockets 21
Language 21, 45
Recorder 21
Sound 21, 46, 47
Temperature 21, 46
Printing 17, 27
PT104 100
Editing channels 100
Selecting channels 99
Status check 100
Q
Quattro Pro
111
Copyright 2005 Pico Technology Limited. All rights reserved.
Index
R
Recorder controls 8
Recording 3
Fast block mode 3, 15, 25
Real time continuous mode 3, 15, 25
Repeating a run 16
RH-02 104
Editing channels 89
Selecting channels 89
Status check 90
Running multiple recorders 20
Runs 14, 15
TH-03 105
Editing channels 97
Selecting channels 97
Status check 98
Transferring data over an IP network
Types of window 17
19
U
UDP/IP protocol 105
USB TC-08 105
Editing channels 93
Selecting channels 93
Status check 94
S
V
Safety 6
Sampling interval 26
Sampling rate 26
Scaling 15, 35, 36, 109
Selecting measurements 38
Selecting measurements to display
Selecting the converter type 29
Server 19, 105
Settings 15
Converter details 15
Recording method 15
Settings file 108
Settings menu 22
Calculated parameters 22
Input channels... 22
Monitor 22
Recording 22
Sampling... 22
Setttings 15
Sampling rate 15
Signal conditioner file 110
Signal conditioners 106
Simultaneous recording 20
Spreadsheet window 7, 12
Starting a new run 15
Starting a recording 16
View menu 23
Graph 23
Notes 23
Player 23
Spreadsheet 23
XY Graph 23
15
118
X
XY Graph controls
11
T
TC-08 105
Editing channels 95
Selecting channels 95
Status check 96
Technical information 107
Copyright 2005 Pico Technology Limited. All rights reserved.
PLW044-1.5
Pico Technology Ltd
The Mill House
Cambridge Street
St Neots PE19 1QB
United Kingdom
Tel: +44 (0) 1480 396 395
Fax: +44 (0) 1480 396 296
Web: www.picotech.com
PLW044-1.5 2.8.05