1
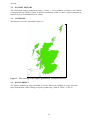
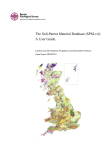
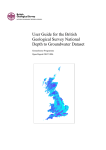
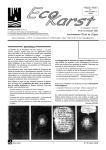
User Guide: Aquifer Productivity (Scotland) GIS datasets, Version 2 Open Report OR/11/065 BRITISH GEOLOGICAL SURVEY OPEN REPORT OR/11/065 User Guide: Aquifer Productivity (Scotland) GIS datasets, Version 2 B Ó Dochartaigh, D D Doce, H K Rutter and A M MacDonald The National Grid and other Ordnance Survey data are used with the permission of the Controller of Her Majesty’s Stationery Office. Licence No: 100017897/2011. Keywords Aquifer productivity, Scotland, GIS. Front cover Aquifer productivity (Scotland) maps Bibliographical reference Ó DOCHARTAIGH B É, DOCE D D, RUTTER H K AND MACDONALD A M. 2011. User Guide: Aquifer Productivity (Scotland) GIS datasets, Version 2. British Geological Survey Open Report, OR/11/065. 17pp. Copyright in materials derived from the British Geological Survey’s work is owned by the Natural Environment Research Council (NERC) and/or the authority that commissioned the work. You may not copy or adapt this publication without first obtaining permission. Contact the BGS Intellectual Property Rights Section, British Geological Survey, Keyworth, e-mail [email protected]. You may quote extracts of a reasonable length without prior permission, provided a full acknowledgement is given of the source of the extract. Maps and diagrams in this book use topography based on Ordnance Survey mapping. © NERC 2011. All rights reserved Keyworth, Nottingham British Geological Survey 2011 BRITISH GEOLOGICAL SURVEY The full range of our publications is available from BGS shops at Nottingham, Edinburgh, London and Cardiff (Welsh publications only) see contact details below or shop online at www.geologyshop.com The London Information Office also maintains a reference collection of BGS publications, including maps, for consultation. We publish an annual catalogue of our maps and other publications; this catalogue is available online or from any of the BGS shops. The British Geological Survey carries out the geological survey of Great Britain and Northern Ireland (the latter as an agency service for the government of Northern Ireland), and of the surrounding continental shelf, as well as basic research projects. It also undertakes programmes of technical aid in geology in developing countries. The British Geological Survey is a component body of the Natural Environment Research Council. British Geological Survey offices BGS Central Enquiries Desk Tel 0115 936 3143 email [email protected] Fax 0115 936 3276 Kingsley Dunham Centre, Keyworth, Nottingham NG12 5GG Tel 0115 936 3241 Fax 0115 936 3488 email [email protected] Murchison House, West Mains Road, Edinburgh EH9 3LA Tel 0131 667 1000 email [email protected] Fax 0131 668 2683 Natural History Museum, Cromwell Road, London SW7 5BD Tel 020 7589 4090 Fax 020 7584 8270 Tel 020 7942 5344/45 email [email protected] Columbus House, Greenmeadow Springs, Tongwynlais, Cardiff CF15 7NE Tel 029 2052 1962 Fax 029 2052 1963 Maclean Building, Crowmarsh Gifford, Wallingford OX10 8BB Tel 01491 838800 Fax 01491 692345 Geological Survey of Northern Ireland, Colby House, Stranmillis Court, Belfast BT9 5BF Tel 028 9038 8462 Fax 028 9038 8461 www.bgs.ac.uk/gsni/ Parent Body Natural Environment Research Council, Polaris House, North Star Avenue, Swindon SN2 1EU Tel 01793 411500 Fax 01793 411501 www.nerc.ac.uk Website www.bgs.ac.uk Shop online at www.geologyshop.com OR/11/065 Contents Contents.......................................................................................................................................... 2 Summary ........................................................................................................................................ 3 1 Introduction ............................................................................................................................ 4 2 About the Aquifer Productivity (Scotland) Datasets, Version 2 ........................................ 5 2.1 Background ..................................................................................................................... 5 2.2 What the datasets show................................................................................................... 5 2.3 How can the datasets be used? ....................................................................................... 5 2.4 Who might benefit from using the datasets? .................................................................. 9 3 Technical Information ........................................................................................................... 9 3.1 Definitions ...................................................................................................................... 9 3.2 Scale................................................................................................................................ 9 3.3 Methodology used to create the Datasets ....................................................................... 9 3.4 Dataset History ............................................................................................................. 12 3.5 Coverage ....................................................................................................................... 12 3.6 Data Format .................................................................................................................. 12 3.7 Limitations .................................................................................................................... 13 4 Licensing Information ......................................................................................................... 13 References .................................................................................................................................... 14 FIGURES Figure 1 The bedrock aquifer productivity (Scotland) map ...................................................... 6 Figure 2 The superficial deposits aquifer productivity (Scotland) map .................................... 6 Figure 3 The coverage of the aquifer productivity (Scotland) datasets ................................... 12 TABLES Table 1 Bedrock aquifer productivity classification .................................................................... 7 Table 2 Superficial deposits aquifer productivity classification.................................................. 8 Table 3 Input datasets used to derive the aquifer productivity classifications .......................... 11 Table 4 Data fields and parameter values in the aquifer productivity datasets ......................... 13 2 OR/11/065 Summary This report describes a revised version (Version 2) of the aquifer productivity (Scotland) datasets produced by the British Geological Survey (BGS). There are two maps: bedrock aquifer productivity and superficial deposits aquifer productivity. Version 1 of these datasets was produced in 2004. Version 2 uses updated geological linework and a slightly modified methodology. The aquifer productivity maps describe the potential of aquifers across Scotland to sustain various levels of borehole water supply, and the dominant groundwater flow types in each aquifer. The bedrock aquifer productivity map has five aquifer productivity classes (very high, high, moderate, low and very low); and three groundwater flow categories (significant intergranular flow; mixed fracture/intergranular flow; and fracture flow). The superficial deposits productivity map has four productivity classes (high; moderate to high; moderate; and a category to signify that a deposit is ‘not a significant aquifer’). All superficial deposits aquifers in Scotland are assumed to have primarily intergranular groundwater flow. The aquifer productivity maps are a tool to indicate the location and productivity of aquifers across Scotland. They have been used to help characterise groundwater bodies as required by the Water Framework Directive, and may have several other uses, including in policy analysis and development; to prioritise aquifer and site investigations; to inform planning decisions; and to improve awareness of groundwater in general. The complexity and heterogeneity of geological formations means that the maps are only a guide. They are designed to be used at a scale of 1:100,000, and not to assess aquifer conditions at a single point. 3 OR/11/065 1 Introduction Founded in 1835, the British Geological Survey (BGS) is the world's oldest national geological survey and the United Kingdom's premier centre for earth science information and expertise. The BGS provides expert services and impartial advice in all areas of geoscience. Our client base is drawn from the public and private sectors both in the UK and internationally. Our innovative digital data products aim to help describe the ground surface and what's beneath across the whole of Great Britain. These digital products are based on the outputs of the BGS survey and research programmes and our substantial national data holdings. This data coupled with our in-house Geoscientific knowledge are combined to provide products relevant to a wide range of users in central and local government, insurance and housing industry, engineering and environmental business, and the British public. Further information on all the digital data provided by the BGS can be found on our website or by contacting one of our offices or [email protected]. 4 OR/11/065 2 About the Aquifer Productivity (Scotland) Datasets, Version 2 2.1 BACKGROUND The aquifer productivity (Scotland) datasets, Version 1, were produced in 2004 by the British Geological Survey (BGS). The datasets comprised GIS-based aquifer productivity maps and an associated report with explanatory notes (MacDonald et al. 2004). This revised version (Version 2) has used updated geological linework and a slightly modified methodology to develop new GIS-based maps. Related BGS datasets that the user may also be interested in are a GIS-based map of groundwater vulnerability for Scotland (Version 2) (Ó Dochartaigh et al. 2011); permeability index datasets (British Geological Survey 2010); superficial deposits thickness datasets (Lawley and Garcia-Bajo 2009); and DiGMapGB-50 (the Digital Geological Map of Great Britain at 1:50 000). A related external dataset is the Hydrology of Soil Types (HOST), available through the James Hutton Institute (Boorman et al 1995; http://www.macaulay.ac.uk/host/). Related aquifer productivity studies and publications by BGS are Graham et al. (2009), MacDonald et al. (2005) and Ó Dochartaigh (2004). 2.2 WHAT THE DATASETS SHOW The aquifer productivity maps describe the potential of aquifers across Scotland to sustain various levels of borehole water supply, and the dominant groundwater flow types in each aquifer. The productivity classifications are based on a judgement of the typical long term sustainable abstraction rate from a properly sited, constructed and developed borehole (or, for superficial deposits, a group of boreholes). However, the complexity and heterogeneity of geological formations means that these classes are only a guide. In addition, random drilling within an aquifer without reference to suitable hydrogeological information may not produce the yields indicated by these classes. The bedrock aquifer productivity map has five aquifer productivity classes (very high, high, moderate, low and very low); and three groundwater flow categories (significant intergranular flow; mixed fracture/intergranular flow; and fracture flow) (Table 1, Figure 1). The superficial deposits productivity map has four productivity classes (high; moderate to high; moderate; and a category to signify that a deposit is ‘not a significant aquifer’) (Table 2, Figure 2). All superficial deposits aquifers in Scotland are assumed to have primarily intergranular groundwater flow (although fracture flow may be important in some glacial tills that are classed as ‘not significant aquifers’). 2.3 HOW CAN THE DATASETS BE USED? The aquifer productivity maps are a tool to indicate the location and productivity of aquifers across Scotland. They have been used to help characterise groundwater bodies as required by the Water Framework Directive. They are designed to be used at a scale of 1:100,000, and not to assess aquifer conditions at a single point. As such, they provide only a guide to aquifer conditions, and are not a substitute for detailed site investigation. The dataset may have several uses, including: In policy analysis and development To prioritise aquifer and site investigations To inform planning decisions To improve awareness of groundwater in general. 5 OR/11/065 Figure 1 The bedrock aquifer productivity (Scotland) map Figure 2 The superficial deposits aquifer productivity (Scotland) map 6 OR/11/065 Table 1 Bedrock aquifer productivity classification Aquifer Productivity Rating Associated borehole yields (litres / second)1 Examples SIVH > 20 l/s Some Permo-Triassic sandstones (east Dumfries Basin) and some Upper Devonian sandstones (Fife) > 20 l/s Some Permo-Triassic breccias and sandstones (west Dumfries Basin, Moffat, Arran, Mauchline) 10 to 20 l/s The Carboniferous Passage Formation 10 to 20 l/s Some Upper Devonian sandstones (southern Scotland), Lower Devonian sandstones (Strathmore), general Devonian sandstones (Moray); some Permo-Triassic sandstones (Moray, Solway area) 1 to 10 l/s All Carboniferous sedimentary formations except the Passage Formation and those dominated by mudstones; most Devonian conglomerates, siltstones and limestones (Moray, Turriff, Easter Ross, Strathmore); Lower Devonian sandstones in southern Scotland; Devonian sandstones north of the Great Glen; Mesozoic sandstones and limestones on Skye and Raasay; Permian sandstones in Stranraer 1 to 10 l/s Cambrian limestones and dolomites; some Carboniferous lavas (East Lothian) 0.1 to 1 l/s Volcaniclastic sediments; Carboniferous mudstones 0.1 to 1 l/s Moine pelites; Dalradian (except psammites); Torridonian sandstones; Cambrian rocks except limestone & dolomite; Ordovician/Silurian greywackes, siltstones and related rocks; Devonian flagstones (Caithness and Orkney); lavas (except Carboniferous lavas in East Lothian); Mesozoic mudstones and shales < 0.1 l/s Lewisian gneiss; Moine (except pelites); intrusive igneous rocks - Areas where geology is unmapped, for example beneath lochs. Significantly Intergranular; Very High Productivity IFVH Intergranular/Fracture; High Productivity Very SIH Significantly Intergranular; High Productivity IFH Intergranular/Fracture; Productivity High IFM Intergranular/Fracture: Moderate Productivity FM Fracture; Productivity Moderate IFL Intergranular/Fracture; Productivity Low FL Fracture; Low Productivity FVL Fracture; Productivity Very U Unknown Geology Low Note 1 Productivity is directly linked to the potential of the aquifers classifications to sustain these abstraction rates from properly sited, constructed and developed single or groups of boreholes 7 OR/11/065 Table 2 Superficial deposits aquifer productivity classification Aquifer Productivity Code Associated range in borehole yields (litres/second)1 Examples IH > 10 l/s Glaciofluvial sand and gravel; mixed glaciofluvial deposits; glacial ice-contact deposits. 1 to ≥10 l/s Alluvium and river terrace deposits, unless specified as clay and silt. 0.1 to 10 l/s Marine, raised marine and tidal deposits, unless specified as clay and silt2; talus; landslip; blockfield3. - Till; moraine; hummocky/moundy glacial deposits4; head5; all deposits dominated by clay and silt. - Areas where geology is unmapped, for example beneath lochs or in urban areas. Intergranular; High Productivity IMH Intergranular; Moderate to High Productivity ILM Intergranular; Low to Moderate Productivity NSA Not a significant aquifer U Unknown Geology Notes 1 Productivity is directly linked to the potential of the aquifers to sustain these abstraction rates from properly sited, constructed and developed single or groups of boreholes 2 Any mixed deposit of marine or tidal origin, if not specified as clay and silt, may have the potential to form a moderately productive aquifer capable of supplying sustainable borehole yields of at least 1 l/s, if it contains sufficient sand and/or gravel, is thick enough and is of large enough lateral extent. The user of the map should judge the spatial extent of the outcrop as well as (in conjunction with topographic mapping) the proximity to and height above sea level (related to the risk of saline intrusion), and should carry out site investigations to discover the thickness and exact lithology of the deposit. 3 Talus and blockfield deposits are typically highly permeable and, if thick enough, can store and transmit enough groundwater to supply spring flows of between 1 and 10 l/s. Because of their geometric configuration – typically steeply dipping – drilling into them by conventional means is unlikely to be successful, but inclined drilling or abstraction from shallow dug wells, as well as springs, may provide supplies. 4 Recent evidence suggests that moraine and hummocky/moundy glacial deposits are often highly permeable. However, across much of Scotland, except where the superficial deposits have been re-mapped using modern methods, moraine, hummocky/moundy glacial deposits and till are all mapped interchangeably as till, and their lithology typically described as diamicton (classed as moderate permeability in the BGS Permeability Dataset for Great Britain (British Geological Survey 2010). On a national scale, it is therefore not generally possible to distinguish between till and moraine on the basis of the available lithological descriptions. For the purposes of consistency, this map classes all till, moraine and hummocky/moundy glacial deposits as Not a Significant Aquifer. Note, however, that in some areas these deposits may be highly permeable, and if they are thick and laterally extensive enough, they may form local aquifers. 5 The lithology of head depends on the parent material from which it has been reworked. In general it is thought to have a permeability between that of till and sand/gravel deposits. In the BGS Permeability Dataset its permeability varies from moderate to very high according to the described lithology. However, head is typically only 1 to 2 m thick, and so is unlikely to form a significant aquifer. 8 OR/11/065 2.4 WHO MIGHT BENEFIT FROM USING THE DATASETS? The aquifer productivity maps were originally developed for use by the Scottish Environment Protection Agency (SEPA) in the process of groundwater body characterisation as part of the Water Framework Directive. Other potential users of the dataset may be regional planners and managers in Local Authorities and national government. Any individuals or bodies involved in the activities listed in Section 2.3 are likely to find the aquifer productivity datasets useful. 3 Technical Information 3.1 DEFINITIONS Aquifer productivity describes the potential of an aquifer (a bedrock or superficial deposit unit that contains significant amounts of groundwater) to sustain various levels of groundwater flow and/or abstraction from a properly sited and constructed borehole. For the purposes of these maps, aquifer productivity is directly linked to the potential of the aquifer to sustain various abstraction rates from properly sited, constructed and developed single boreholes or groups of boreholes. 3.2 SCALE The aquifer productivity (Scotland) Version 2 datasets are produced for use at 1:100 000 scale. The datasets are not designed to be used to assess aquifer productivity at a single point. All spatial searches of the maps/datasets should be conducted using a minimum 100 m buffer. 3.3 METHODOLOGY USED TO CREATE THE DATASETS The datasets were developed in ArcGIS using BGS digital geology linework (DiGMapGB-50, Version 5.18) at a scale of 1:50,000. A detailed explanation of the Version 1 aquifer productivity datasets is given in MacDonald et al. (2004). The Version 2 datasets described in this report were produced using updated geological linework and new information on aquifer properties made available since the Version 1 datasets were completed, and a slightly amended methodology. In particular, a study to validate the aquifer productivity classes defined in Version 1 has since been done using aquifer properties information including test pumping data, and this has informed the development of Version 2 of the dataset (Graham et al. 2009). 3.3.1 Bedrock aquifer productivity dataset To create the bedrock aquifer productivity map, each of the geological formations in the 1:50,000 scale DiGMap bedrock geology map was classified according to two criteria: (1) the predominant groundwater flow mechanism; and (2) the estimated aquifer productivity of the formation. Groundwater flows through bedrock either through small interconnected pore spaces as intergranular flow, or through fractures as fracture flow. Most bedrock aquifers in Scotland (except for some small unconsolidated Tertiary formations in Aberdeenshire) are dominated by fracture flow. Even in the most porous bedrock aquifers, such as Upper Devonian or Permian sandstones, downhole geophysical logging has shown that typically only around 20% of groundwater flow occurs as intergranular flow, the remainder flowing through fractures. However, even this minor component is significant in terms of the hydrogeological characteristics of the aquifer. Such aquifers – classified approximately as those with an average porosity of more than 20% – have been distinguished by the term significantly intergranular 9 OR/11/065 flow. Rocks with lower average porosity but which still allow some intergranular flow have been categorised as having mixed intergranular/fracture flow. Rocks with virtually no intergranular porosity are categorised as fracture flow. The flow characteristics and the productivity class for each bedrock formation have been classified based on information from various sources, including laboratory hydraulic testing data, downhole geophysical logs, and pumping test data, where available. However, for much of Scotland few if any of these data are available, and in these cases they are based wholly or partly on extrapolation from other similar geological units with known aquifer properties, and in the case of the productivity classifications, partly on the permeability classification of the geological unit as given in the Permeability Dataset for Great Britain (Bedrock) (Table 3). Some of the aquifer productivity classifications in the Version 1 dataset have been updated based on new aquifer properties data which have become available since the Version 1 dataset was produced. The newly assigned aquifer productivity classifications are listed in Table 1. The bedrock geology map includes a large number of small polygons representing geological outcrops of small areal extent, and long, thin polygons representing igneous dykes and sills. At 1:100 000 scale, which is the scale at which the aquifer productivity map is designed to be used, these polygons provide so much detail that the map becomes less clear and easy to use. All polygons smaller than a specified area (25 000 m2) and very long, thin polygons (any polygon more than 1000 m long and less than 100 m wide) have therefore been removed from the final map. 3.3.2 Superficial deposits aquifer productivity dataset To create the superficial deposits aquifer productivity map, each of the geological formations in the 1:50 000 scale DiGMap superficial deposits geology map was classified according to the likely productivity of the aquifer. For a small number of map sheets, 1:50 000 scale superficial deposits mapping has not yet been done, and in these cases, 1:625 000 scale superficial deposits linework and attribute data were merged in. The assigned superficial deposits aquifer productivity classifications are listed in Table 2. In Scottish superficial deposits aquifers, only intergranular flow is significant, and all of the superficial deposits aquifers are classified as having intergranular flow. The productivity class for each superficial deposits formation has been classified based on information from various sources, including laboratory hydraulic testing data, geophysical downhole logs, and pumping test data, where available. Where few or no such data were available, which is the case for most superficial deposits, the productivity classifications are based partly on the permeability classification of the geological unit as given in the Permeability Dataset for Great Britain (Superficial) (Table 3), and partly on extrapolation from other similar geological units with known aquifer properties. Classifying superficial deposits aquifers on a national scale, in terms of their productivity as well as other characteristics, is subject to more uncertainty than classifying bedrock aquifers, for two main reasons: The inherent heterogeneity of superficial deposits means their properties as aquifers (e.g. permeability (reflecting the relative proportions of clay, silt, sand and gravel within many mixed deposits), thickness and lateral extent) can change significantly over short distances even within the same mapped lithological unit. For this reason, there is often a large range between the minimum and maximum assigned permeability for many deposits in the Permeability Dataset, for example from Low to High. Superficial deposits were historically often mapped in less detail and/or with less precision than bedrock. For example, on many older map sheets all glacially-related deposits were classed as till, but when the area was re-mapped using modern techniques, the same deposits were redefined to include moraine. Till typically has low to moderate 10 OR/11/065 permeability, whereas moraine can be dominated by gravel and sand and can be highly permeable. Hence, because across much of the country superficial deposits haven’t been re-mapped using modern methods, it isn’t generally possible to distinguish between till and moraine on the basis of the available lithological descriptions. To try and ensure the aquifer productivity map is consistent across the whole country, it was therefore decided that all till, moraine and hummocky/moundy glacial deposits would be classed as Not a Significant Aquifer, as in most cases this is likely to be true, and the deposits are unlikely to contain useful groundwater resources. It is, however, recognised that in some areas these deposits may be highly permeable, and if they are thick and laterally extensive enough, they may form local aquifers. The assigned productivity classes for the superficial deposits aquifers (Table 2) are therefore less precise, reflected in the wider range in likely yield from any particular geological unit. The actual productivity in any given area of interest will depend on the superficial deposit lithology, compaction or other post-depositional factors, area of outcrop, and thickness. In the case of marine deposits, it may also depend on the elevation of the deposit above sea level, in relation to the risk of saline intrusion. In most cases, any superficial deposit with a maximum permeability of less than moderate has been classed as Not a Significant Aquifer, while any superficial deposit with a maximum permeability of high or very high has been classed as an aquifer of either moderate or high productivity. However, in certain cases there are exceptions to this, where significant characteristics of the deposit other than permeability (for example, thickness and lateral extent) are likely to affect its aquifer productivity. These are highlighted in the notes for Table 2. Table 3 Input datasets used to derive the aquifer productivity classifications Dataset Description DiGMapGB-50 (Digital Geological Map of Great Britain at 1:50 000) (Superficial) Version 5.18 Most superficial deposits of natural origin, except mass movement deposits. Most are unconsolidated sediments, and onshore they form relatively thin, discontinuous patches or larger spreads. Almost all were formerly classified on the basis of their mode of origin with names such as, 'Glacial Deposits', 'River Terrace Deposits' or 'Blown Sand'; or on their composition such as 'Peat'. Recently some of them have been given formal. lithostratigraphical names such as 'Lowestoft Formation'. More information on named superficial deposits is available in the BGS Lexicon of Named Rock Units at http://www.bgs.ac.uk/lexicon/home.cfm DiGMapGB-50 (Digital Geological Map of Great Britain at 1:50 000) (Bedrock) Version 5.18 The main mass of rocks forming Britain, present everywhere, whether exposed at the surface in outcrops or concealed beneath superficial deposits or water. Wherever possible, they are referred to by their current name: for stratified units this will usually be lithostratigraphical; for igneous intrusions it may be a lithodemic one. More information on named bedrock units is available in the BGS Lexicon of Named Rock Units at http://www.bgs.ac.uk/lexicon/home.cfm. Permeability Dataset for Great Britain (Superficial) Version 6.0 (British Geological Survey 2010) The permeability data describe the fresh water flow through geological deposits and the ability of a lithostratigraphical unit to transmit water. Maximum and minimum permeability indices are given for each geological unit to indicate the range in permeability likely to be encountered and the predominant flow mechanism (fracture or intergranular). Neither of the assigned values takes into account the thickness of either the unsaturated or saturated part of the lithostratigraphical unit. Permeability Dataset for Great Britain (Bedrock) Version 6.0 (British Geological Survey 2010) 11 OR/11/065 3.4 DATASET HISTORY The GIS-based aquifer productivity maps, Version 1, were produced in 2004 by the British Geological Survey (BGS) in 2004. A detailed explanation of the Version 1 aquifer productivity datasets is given in MacDonald et al. (2004). 3.5 COVERAGE The dataset covers all of Scotland (Figure 3). Figure 3 3.6 The coverage of the aquifer productivity (Scotland) datasets DATA FORMAT The aquifer productivity maps (Scotland) Version 2 dataset are available as vector and raster maps with attribute values relating to aquifer productivity (Table 4, Table 1, Table 2). 12 OR/11/065 Table 4 Data fields and parameter values in the aquifer productivity datasets Dataset Description Values Bedrock Aquifer BRProd Productivity Bedrock Aquifer Productivity As Table 1 Superficial Deposits SDProd Aquifer Productivity Superficial Deposits Aquifer As Table 2 Productivity 3.7 Field LIMITATIONS The aquifer productivity maps are designed to be used at a scale of 1:100,000, and not to assess aquifer conditions at a single point. All spatial searches of the maps/datasets should be conducted using a minimum 100 m buffer. The maps provide only approximate descriptions of ground conditions. They are also only a twodimensional representation and do not reflect any changes in geological and/or hydrogeological character with depth. Use of the maps must therefore be pragmatic, and the maps are not a substitute for detailed site investigation. The aquifer productivity maps are based on, and limited to, an interpretation of the data in the possession of the British Geological Survey at the time the datasets were created. 4 Licensing Information The British Geological Survey does not sell its digital mapping data to external parties. Instead, BGS grants external parties a licence to use this data, subject to certain standard terms and conditions. In general, a licence fee will be payable based on the type of data, the number of users, and the duration (years) of a licence. All recipients of a licence (potential licensees) are required to return a signed digital data licence document to us before authorisation for release of BGS digital data is given. In general terms, a BGS digital data licensee will be permitted to: make internal use of the dataset(s) allow a specified number of internal users to access/use the data (the number of users will be agreed with the licensee and specified in the licence document) for the purposes of their day-to-day internal activities reproduce extracts from the data up to A3 for use in external analogue (paper/hard copy) or non-queryable electronic (e.g. secured .pdf) format: to meet a public task duty; fulfil a statutory requirement; and/or as part of academic or other noncommercial research But will not be permitted to: provide a bureau service for others or incorporate the data in the generation of products or services for commercial purposes sell, assign, sublicense, rent, lend or otherwise transfer (any part of) the dataset(s) or the licence place (any part of) the dataset(s) on the Internet 13 OR/11/065 The BGS is committed to ensuring that all the digital data it holds which is released to external parties under licence has been through a robust internal approval process, to ensure that geoscientific standards and corporate quality assurance standards are maintained. This approval process is intended to ensure that all data released: (i) is quality assured; (ii) meets agreed BGS data management standards; (iii) is not in breach of any 3rd party intellectual property rights, or other contractual issues (such as confidentiality issues), that would mean that release of the data is not appropriate. When the BGS digital datasets are revised any upgrades will be automatically supplied to the licensee, at no additional cost. Geological map datasets are revised on a periodic rather than on an annual basis, licensees will therefore not automatically receive a new dataset each year unless changes have been made to the data. These are general comments for guidance only. A licensee of BGS's digital data is provided with full details of the basis on which individual BGS datasets licensed to them are supplied. If you have any doubts about whether your proposed use of the BGS data will be covered by a BGS digital licence, the BGS Intellectual Property Rights (IPR) section will be happy to discuss this with you and can be contacted through the following email address: [email protected]. BGS IPR will usually be able to provide reassurance that the licence will cover individual user requirements and/or to include additional 'special conditions' in the licence documentation, addressing specific requirements within BGS's permitted usage. References Ball D, MacDonald A, Ó Dochartaigh B, del Rio M, FitzSimons V, Auton C and Lilly A. 2004. Development of a groundwater vulnerability screening methodology for the Water Framework Directive. SNIFFER Report Project WFD28. Boorman D B, Hollis J M and Lilly A. 1995. Hydrology of soil types: a hydrologically-based classification of the soils of the United Kingdom. Institute of Hydrology Report No.126. Institute of Hydrology, Wallingford. British Geological Survey. 2010. Permeability Indices (PI) data: Information Note, 2010: Permeability Index – Version 6.0. British Geological Survey Information Note. Accessed from http://www.bgs.ac.uk/products/hydrogeology/permeability.html, 11 October 2011. Graham M T, Ball D F, Ó Dochartaigh B É and MacDonald A M. 2009. Using transmissivity, specific capacity and borehole yield data to assess the productivity of Scottish aquifers. Quarterly Journal of Engineering Geology and Hydrogeology 42, 227-235. Lawley R and Garcia-Bajo M. 2009. The National Superficial Deposit Thickness Model (version 5). British Geological Survey Internal Report OR/09/049. MacDonald A M, Ball D F and Ó Dochartaigh B É, 2004. A GIS of aquifer productivity in Scotland: explanatory notes. BGS Commissioned Report CR/04/047N. MacDonald A M, Robins N S, Ball D F and Ó Dochartaigh B É. 2005. An overview of groundwater in Scotland. Scottish Journal of Geology 41 (1), 3-11. Ó Dochartaigh B É. 2004. The physical properties of the Upper Devonian/Lower Carboniferous aquifer in Fife. British Geological Survey Internal Report IR/04/003. Ó Dochartaigh B É, Doce D D, Rutter H K and MacDonald A M. 2011. User Guide: British Geological Survey Groundwater Vulnerability (Scotland) GIS dataset, Version 2. British Geological Survey Internal Report (IR/11/XX). 14