1
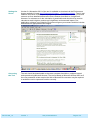
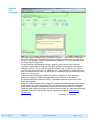
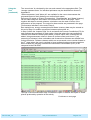
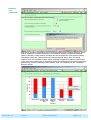
H1 Software Tool User Guide
Quick guide 520_12
What’s this
document
about?
Who does
this apply to?
Issued 08/08/2012
This document is provided to help users of the Environment
Agency’s H1 Software Tool, version 2.4. It reflects the content
of version 2.4 and changes made to the tool during the 2011
upgrade.
Document
details
All users of the Environment Agency’s H1 Software Tool
version 2.4.
Related
documents
Feedback
Contact for
queries
Neil
Heptinstall
Email to
neil.heptinst
all@environ
mentagency.gov.
uk
Doc No 520_12
Version 1
Last printed 08/08/12
Page 1 of 9
Setting the
Scene
Version 2.4 November 2011 of the tool is available to download via the Environment
Agency website H1 page see: Environment Agency - Horizontal guidance. The H1 tool
enables calculation of the impact of proposed pollutant releases to various media and
screens out from detailed assessment those releases described as ‘insignificant’.
However, for releases to air the calculation is pessimistic and should not be used to
calculate a stack height to produce an insignificant environmental impact. Preapplication guidance is provided by Environment Agency area teams and this includes
discussions on appropriate stack heights.
Accessing
the Tool
The tool should be downloaded to the users computer hard drive, unzipped, saved
and opened using Microsoft Access. The tool is based on Microsoft Access 2003 so if
the user possesses a later version the link to Microsoft file converter may be required
to enable the tool to open and function correctly.
Doc No 520_12
Version 1
Last printed 08/08/12
Page 2 of 9
Using the
Tool
Guidance on using the tool is available at a number of locations;
• general instructions within the annex of the H1 Overview document;:
• ‘help’ pages on each page of the tool: and
• content of this user guide.
Data entry by the user is highlighted within the tool by the use of blue cells. ‘Box’ help
within the Help pages gives advice on the specifics of what should be entered in each
blue cell. Within each ‘Help’ window there is a link to the Environment Agency’s H1
webpage: “See EA H1 webpage”. By clicking within the window a scroll bar appears
which may reveal more text lower down. The Help window may be cancelled using the
‘X’ on the window and restored using the ‘question mark’ key on the top toolbar.
Comment boxes are available at the bottom of each data entry page enabling the user
to clarify any points they wish to make.
An ‘Import utility’ button on the Reference Information page is a new addition and
enables the user to upload a previous tool dataset, saving the user time and energy if
wanting to simply modify a previous entry, for example in support of a permit variation
application.
By selecting the appropriate button in the page ‘Describe the Objectives’ the user is
required to choose between a simple assessment or a more detailed evaluation.
Called the ‘Options Appraisal’ this enables users to include more than one option to
secure environmental protection and each option can then be ranked on the basis of
costs and benefits. This enables the Best Available Technique (BAT) to be identified.
Please note that whichever option is chosen steps 1,2 and 3 of the tool are the same
with screening results presented graphically at the end of step 3. It is only when more
than one option is available that steps 4,5 and 6 come into play.
If the Environmental Assessment button is chosen the tool moves on to ’Scope of the
Environmental Assessment’ and then Step 2. The first part of Step 2 is ‘Air release
points’.
Users may find the ‘Go To’ drop down menu on the top tool bar useful in navigating
around the various pages of the tool. This is particularly useful when more than one
option is being considered
Continues on next page
Doc No 520_12
Version 1
Last printed 08/08/12
Page 3 of 9
Using the
Tool
(continued)
This page enables release points to be added using the ‘ Add’ button in the bottom
left corner of the page. To identify the effective height of release users are referred to
Annex F, and Appendix Dwhich includes worked examples of how the effective height
of release may be determined.
On the following ’Air Emissions Inventory’ page for each release point users are
required to enter details of long and short term pollutant concentrations and annual
releases in tonnes. The tool will calculate the release rates in grammes per second
once the user moves the cursor to a different cell. The annual rate is calculated by the
user and entered into the cell. This allows for an operating mode of less than 100% for
every hour of every day.
In entering ‘water discharge locations’ the user must select the ‘final discharge
category’ to trigger the subsequent calculations and selection of the relevant
Environmental Quality Standards (EQS). Freshwater locations require entry of the
freshwater flowrate.
Within the ‘Water Release Points’ page new locations are added using the ‘Add’ button
at the bottom left corner of the page. The user has the option to choose ‘discharge to
sewer’ before the treated effluent reaches the relevant surface water body. Data on
mean and peak effluent flow rates are required for entry here. For salt water discharges
values for mean and initial dilution may be determined using the ‘Initial Dilution
spreadsheet’.
Continues on next page
Doc No 520_12
Version 1
Last printed 08/08/12
Page 4 of 9
Using the
Tool
(continued)
The ‘Water Emissions Inventory’ page requires data entry for long and short term
pollutant concentrations for each release point. Again additional pollutants are added
using the ‘Add’ button at the bottom left hand corner of the page.
Continues on next page
Doc No 520_12
Version 1
Last printed 08/08/12
Page 5 of 9
Using the
Tool
(continued)
The ‘annual rate’ is calculated by the user and entered in the appropriate field. The
‘sewage treatment factor’ for individual pollutants may be obtained from Annex D,
Appendix B.
‘Water temperature’ and ‘Water pH’ are available for the user to demonstrate the
proposed impact of their discharge on surface fresh waters.
Data entry for pages on ‘Energy Consumption’, ‘Raw Materials’ and ‘Waste Inventory’
can be made using the ‘Add’ button in the bottom left corner of the page. Taken
together with data on annual releases, calculations can be made in terms of the
performance of the proposal. The output for these entries are presented in the page
‘Performance Indicators’ at the end of Step 2.
Raw material use, energy consumption and Waste Inventory data may be entered at
the end of Step 2 to enable comparison between options later on.
In Step 3 within the ‘Impacts Page’ for air and water the Process Contribution (PC) for
each pollutant are presented for each option. Note that where the same pollutant is
released from different release points within a chosen option their contributions are
added. Using assessment criteria in Annex D (surface water) and Annex F (air)
screening of releases is then undertaken and screened-out releases are deleted from
further calculation. Pollutant releases which are not screened out are carried forward to
the 2nd stage where the user is required to insert pollutant background concentrations
which enables the resulting Predicted Environmental Concentration (PEC) to be
compared to the EAL/EQS.
Through a recent modification Step 3 includes the option to assess the impact of visible
plumes produced by operation of the activity.
Continues on next page
Doc No 520_12
Version 1
Last printed 08/08/12
Page 6 of 9
Using the
Tool
(continued)
Step 3 also includes comparison of the ‘Photochemical Ozone Creation Impacts’ where
annual releases of relevant substances are compiled enabling comparison between
options. Similarly, carbon dioxide releases are also compiled for each option enabling
comparison within the ‘Global Warming Potential Impacts’ page. Also, the Waste
Impacts score is calculated for each option enabling comparison between options later
in the tool. At the end of Step 3 ‘Summary Tables’ are available for selection and printing
summarising results of data input and impacts. Step 3 is completed by the ‘Graphical
Results’ section.
Doc No 520_12
Version 1
Last printed 08/08/12
Page 7 of 9
Candidate
Options
Selecting the ‘Options Appraisal’ button requires the user to identify the candidate
options for achieving the required environmental outcome. The 1st option may be
described as ‘Base Case’ with subsequent options individually identified. Additional
options are added using the ‘Add’ button in the ‘Options’ field at the base of the page.
Step 4 requires the user to identify the option with the lowest predicted environmental
impact and asks the user to resolve any cross-media impacts. Options are ranked in
terms of their environmental performance.
Continues on next page
Doc No 520_12
Version 1
Last printed 08/08/12
Page 8 of 9
Candidate
Options
(Continued)
Step 5 is used to identify the costs associated with the implementation of each option.
Capital and Investment Costs data and Operating Costs data are combined in
calculation of the total costs.
Step 6 pulls together the results of Steps 4 and 5 enabling identification of the Best
Available Technique ( BAT) or option to secure the desired environmental outcome at
reasonable cost.
Pages from the tool may be printed off and submitted in support of an EPR permit
application. Copies of the .mdb files should be saved and submitted in support of permit
applications.
Doc No 520_12
Version 1
Last printed 08/08/12
Page 9 of 9