1
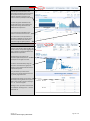
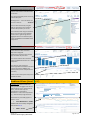
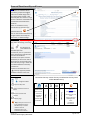
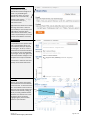
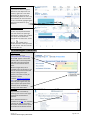
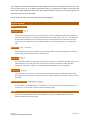
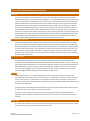
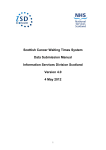
NSS
User Guide
Version 1.2
© Common Services Agency, NHS Scotland
Page 1 of 21
Document Control
Version
Date
1.0
24 Apr 15
1.1
26 Apr 15
Author
Jamie Gray
Jamie Gray
Description
Draft User Guide
Anonymised Screen Shots Added
Additional contents – methodology and functionality
1.2
29 Apr 15
Jamie Gray
explanations added.
1.3
05 May 15
Jamie Gray
Minor grammatical / format changes
Supporting Material
Document
Owner
User Access System User Guides
(http://www.isdscotland.org/Products-andServices/Datamarts/User-Support/)
Fiona MacLeod
Discovery Video Guides (http://www.nssdiscovery.scot.nhs.uk/InfoZone/Training-Support/)
Version 1.2
© Common Services Agency, NHS Scotland
NSS Discovery Team
Page 2 of 21
Contents
NSS Discovery User Guide
4
What is NSS Discovery?
4
Requesting Access to NSS Discovery
5
NSS Discovery – Overview Page
6
Level “1” (Non-Confidential Overview)
7
Level “2” – Potentially Disclosive; Analytics
10
Dashboard Views (Level “ 1+2”) ................................................................................................ 12
Level “3”- Person Centred Views
13
General Functionality and Icons
14
Methodologies + Metadata
16
User access Levels Explained:.................................................................................................. 17
Information Governance ............................................................................................................ 17
Core Functions: ......................................................................................................................... 18
Scorecard & Methodology Descriptions; .................................................................................... 19
Explanation of the A-Z ............................................................................................................... 20
Alternative Navigation Options .................................................................................................. 21
Contact Us
Version 1.2
© Common Services Agency, NHS Scotland
21
Page 3 of 21
NSS Discovery User Guide
This document is a draft user guide for NSS Discovery; its purpose is to aid the user to navigate NSS
Discovery and understand some of the core functionality that exists within the tool.
The images contained within this guide have been modified to ensure they do not contravene
Information Governance principles.
There is a standard icons section within this document which describes the main icons within NSS
Discovery. At the end of the document there is a section which describes the core functions and
methodologies to further aid your understanding.
If you wish to provide feedback regarding the NSS Discovery user guide or the NSS Discovery tool
please email your comments to [email protected]
What is NSS Discovery?
NSS Discovery is an information system that provides access to approved users (data access is
dependant upon the individual users authorised level of access) to a range of comparative
information (indicators) to support benchmarking, performance and quality improvement.
Indicators within NSS Discovery can be viewed by NHS Board of treatment or NHS Board of
residence. The information within NSS Discovery can help NHS Boards to review performance,
benchmark against peers and identify areas where resources can be targeted to address local health
and care needs.
Landing page: at the bottom of every page of the NSS Discovery
website, there is a NSS Discovery hyperlink. This will take the user to
the landing page in Discovery.
(Before the landing page appears
you will be presented with a login
page).
Once you have successfully logged
into NSS Discovery, the page
opposite will appear.
Background Information:
This page opens up when using the
link from the NSS Discovery
Website. It provides some basic
background information about NSS
Discovery along with a hyperlink
(also below) to the NSS Discovery
Organisational Overview:
www.NSS Discovery.scot.nhs.uk
Version 1.2
© Common Services Agency, NHS Scotland
Page 4 of 21
Requesting Access to NSS Discovery
Only authorised individuals logged into a secure N3 network will be able to access to the data held
within NSS Discovery.
To request access to NSS Discovery select the link below to log into the NSS User Access System
(UAS): https://useraccess.nhsnss.scot.nhs.uk/
Please follow the link below to the UAS user guide; provided to assist you with logging into UAS and
creating your NSS Discovery access request:
http://www.isdscotland.org/Products-and-Services/Datamarts/User-Support/
The UAS allows you to register for a username and password (if you do not have UAS login details).
You will be sent two e-mails; one with your username and one with a temporary password (please
change this password as soon as possible using the link provided in the e-mails).
Once registered with the UAS you will be able to create a request to access NSS Discovery.
Within the UAS you can select ‘R
Request New Access’ from the left-hand menu, this will open the
Request window where you can select “D
Discovery-tableau” from the available dropdown menu,
follow this by selecting the Access type and User type.
When your request has been submitted the UAS will notify the appropriate Authoriser who will
consider your request to access NSS Discovery. You should retain your username & password to
enable you to use the UAS in the future and to access NSS Discovery.
Access to NSS Discovery will be reviewed every 6 months for those who have access to person
identifiable data (levels 2 and 3). NSS Discovery will be reviewed annually for those with level 1
access.
It is the responsibility of each organisation to ensure only authorised individuals have access to
NSS Discovery and when a member of staff no longer requires the access it is the responsibility of
the organisation to notify NSS to request that the users access be disabled.
Logging into NSS Discovery
When the NSS Discovery application opens you will be required to enter the username and password
provided to you by the UAS.
Logging In
Users will be asked to enter their username and password on the log in page.
If login has been successful, you will be taken to the landing page.
Further information on Information Governance in relation to NSS Discovery can be found here:
http://www.nssNSS Discovery.scot.nhs.uk/Info-Zone/Training-Support/
Version 1.2
© Common Services Agency, NHS Scotland
Page 5 of 21
NSS Discovery Access & Information Levels:
Below is an explanation of the access and information perspectives within NSS Discovery.
Access Levels
A comprehensive explanation of these levels can be found in the security section.
Level 1 – Non Confidential Overview (Strategic)
At this level, the data is presented at an aggregate level and calculated using standardised rates.
Peer comparisons are possible by NHS Scotland Board of Treatment/ Residence/ Specialty
All Discovery users can see other health board data at this level e.g. – NHS Tayside can see NHS
Grampian’s data and visa versa.
Level 2 – Potentially Disclosive (Analytics)
At this level, the user can only view information from within their host organisation e.g. a NHS
Lothian user can only view NHS Lothian data. The information is calculated using crude rates with
Peer information being provided at an aggregated peer value. Due to the ability to filter on
Specialty/ Age/ Sex etc, there is a potential for the data at this level to be disclosive and user
caution should be exercised.
Level 3 Confidential
At this level the data is presented in tabular form and confidential person identifiable information
can be obtained at this level. When a number is selected in the table, person centred listings of the
selected cohort are returned. Access at this level can be further restricted by your health board
Caldicott to authorised General medical Council (GMC) codes or across appropriate data sources.
Information perspectives:
Data within NSS Discovery can be viewed from a treatment perspective (HB of
Treatment) or from a population perspective (HB of Residence). The option to
change between these information views is available from every visualisation at
Leve1 -2 by the use of the filter on the top row.
NSS Discovery – Overview Page
You will be presented with the NSS
Discovery Overview Page.
NSS Discovery Level 1 – Overview:
1.
2.
3.
Select your NHS Board
Select your location
Select your time period
This will now cause the visualisation
to update based on your selections.
The time period defaults to the last 4
quarters. You can change this to:
•
•
•
Last 3 months
Last Full Year (financial Yr)
Year to date (Calendar Yr)
More information
Version 1.2
© Common Services Agency, NHS Scotland
Page 6 of 21
Level “1” - Non-Confidential Overview
NSS Discovery “Group Overview”:
The top level view within the “Nonconfidential overview” is the “NSS
Discovery Overview” which shows the 6
doughnuts which represent key aspects
from the NHSScotland 2020 vision.
Last Full Year
NHS Board of Treatment
NHS Board/Location
2015/16
All Specialities
They are intended to present a quick
temperature test (denoted by their
Red/A
Amber/Green – RAG status) of the
overall organisation at certain points in
time based on each of the doughnut
groupings.
A range of filters across the top of the
visualisation allow the user to change
parameters,
this
covers;
dates,
information perspectives (Treatment or
population
views),
locations
and
specialties.
If you hover over any doughnut segment,
you will be provided with the underlying
metadata. If you hover over the word in
the centre of the doughnut and then click
on the link, you will be taken to a Level 1 view of the underlying indicators e.g. Click
on “Timely” to view them in more detail in
the “Group Overview”.
Most if not all indicators at this level, can
be viewed by selecting one of the
following tabs;
•
•
•
•
•
Group Overview (1st tab)
Map & Trend (2nd tab)
Indicator Summary (3rd tab)
Control Charts (4th tab)
Peer Group (5th tab)
Version 1.2
© Common Services Agency, NHS Scotland
Page 7 of 21
Strategic Views (Level “1”)
Scorecard View:
This view can be selected by clicking on
the Scorecard tab.
When the visualisation opens you can
use the filters across the top to make
your selections.
The scorecard presents a range of HEAT
target indicators by RAG.
You can click on an IQR Range and the
visualisation will only show the IQ range
you selected e.g. – if you click on the Red
IQR legend, then only those indicators
flagged as “red” will now show on the
visualisation.
More information
Strategic Views (Level “1”) - Group Overview
Group Overview (1st tab):
If you selected “Timely” in the “NSS
Discovery Overview” Visualisation (the
one with the 6 doughnuts), you will be
presented with this visualisation. The
parameters you selected in the previous
view will be passed to this one e.g.
dates/ organisation details etc.
Month
NHS Board
NHS Hospital
Specialty Group
Specialty
NHS Hospital
This group overview shows all of the
Timely related indicators within NSS
Discovery along with their RAG status in
relation to a target and or their peers. It
shows their current value against their
peers for the chosen time period and
previous period.
You can change the information being
presented by changing the filters across
the top.
Month
Month
NHS Board
NHS Hospital
Month
Specialty Group
Specialty
The biggest dot (data point) always
represents the chosen location. Hovering
over any dot will result in a tooltip
appearing with key information about
the selected data.
If you click on the
icon at the end
of the row (far right of the indicator) e.g.
“Outpatient DNA Rate”, it will take you
to a more detailed view of it in the “
Level 2 - view”.
Version 1.2
© Common Services Agency, NHS Scotland
Page 8 of 21
A spark line represents change over time.
The blue line represents your chosen
location and the grey line represents the
aggregate peer value.
The
icon also indicates relevant
links to other related data.
Click on the magnifying glass icon to
navigate to Level 2 (this is only possible if
you have access approval from your NHS
Board approver).
Map & Trend View (2nd tab):
If you selected “Outpatient DNA
Rate”, in the “Group Overview”
Visualisation (ttab 1), you will be
presented with this visualisation on
nd
the 2 Tab – Map & Trend view. The
parameters you selected in the
previous tab will be passed to this
one e.g. dates/ organisation etc.
This view presents the data by ;
•
•
•
Locations
Peers on Map with RAG
status references
RAG trend over time by
month / quarters
Indicator Summary View
(3rd tab):
If you selected “Outpatient DNA
Rate”, in the “Group Overview”
Visualisation, you will be presented
with this visualisation. The
parameters you selected in the
previous view will be passed to this
one e.g. dates/ organisation etc.
NHS
NHS
This view presents the data;
Locations
Peer
•
•
•
•
•
Within the specific NHS
Board Locations
Provides upper quartile
and average reference
points
Opportunities analysis
Breakdown of the selected
site(s) by speciality with site
selected average
Aggregate peer average are
denoted by grey dots on
each specialty and as a grey
line across all of the
specialities for comparison
Version 1.2
© Common Services Agency, NHS Scotland
Hospital
Locations
Page 9 of 21
Control Charts (4th Tab):
If you selected “Outpatient DNA Rate”,
in the Group Overview” the parameters
you select in the previous view will be
passed to this one e.g. dates/
organisation etc.
Funnel Chart: shows your chosen location (big dot) against your selected peer values.
This view allows those with a more
statistical perspective to view the
information in a way they are more
comfortable with e.g.: as either a SPC
Chart or Funnel Plot.
You can change the information
presented within the chart/ plot by
changing the filters running across the
top.
Funnel Plot:
The large dot is your chosen location;
the smaller ones are your peers.
More information
SPC Chart:
There are upper and lower control limits.
Rules can be attached for each indicator
to indicate where a violation has
occurred. A violation is where a data
point exceeds the control limits set and
the relevant data point(s) will turn red to
indicate the violation(s).
Statistical Process Control Chart: A trend is incated by the data points turning red.
Trends (upward or downward) will be
indicated by turning the respective data
points red when there is an observable
trend across at least 5 relevant data
points.
More information
Level “2” – Potentially Disclosive; Analytics
Analytics Views:
This level of user access will provide access to data that could be disclosive of the patient and/or their consultant(s) so
should be treated appropriately.
Most if not all indicators at this level, can be viewed by;
st
•
Age/ Gender (1 tab)
nd
•
Consultants/GP (2 tab)
rd
•
GP Practice Map (3 tab)
th
•
SIMD (4 tab)
th
•
Peer Group (5 tab)
These cuts/ views of the data are possible by selecting the appropriate tab at the top of the visualisation.
Version 1.2
© Common Services Agency, NHS Scotland
Page 10 of 21
Age/ Gender (1st tab):
The Age/Gender tab shows the chosen
indicator you have selected at the
“Overview” (doughnut view) or from the
“Group Overview at Level 1 or from
another navigation point (A-Z) and
breaks it down by a Male/ female split.
It shows the gender breakdowns by
standard age bands and provides peer
comparisons along with board and
NHSScotland comparisons.
It overlays targets/ aggregate peers
values and shows trend over time.
This information is also provided in a
table which highlights an impact value
which would need to be achieved to
reach the target or Upper quartile.
Consultant /GP (2nd tab):
The Consultant/GP tab shows the chosen
indicator and breaks it down by NHS
Board locations and provides aggregated
peer comparisons along with board and
NHSScotland comparisons.
It breaks down the indicator by
consultant /GP activity shown in the
scatterplot to the right hand side.
Locations can be filtered by using the
scroll bar and individual or groups of
clinicians can be selected by lassoing the
required data points.
The parameters you select in the
previous view will be passed to this one
e.g. dates/ organisation etc.
The tables that appear can be further
filtered by hovering above the top line of
data in each column and then clicking on
the + or - icons that appear.
Clicking on the + provides a further level
of breakdown. Clicking on the – rolls the
data back up.
Version 1.2
© Common Services Agency, NHS Scotland
NHS Location
NHS Location
GP or
Consultant
NHS Location
Page 11 of 21
GP Practice Map (3rd tab):
The GP Practice Map shows the chosen
indicator and locates and denotes them
on the map.
The map automatically zooms out to the
furthest data point.
Clicking on the + - icons also allows you
to zoom in and out.
You can refine the view by using the
slider or lassoing the area of interest.
The data will update if you do this.
You can filter further using the standard
filters across the top and the selected
location value is given along with the
aggregate value for the locations peers,
and for the NHS Board and NHSScotland
comparisons.
SIMD (4th tab):
The SIMD tab shows the indicator
broken down into each of the five
deprivation categories.
The bar chart shows the value and the
grey dot shows the peer value.
The chosen indicator also shows the
board and NHSScotland values for
comparison.
The other bar chart shows the
percentage difference between the most
and least deprived by SIMD for the
selected period (in this example the last
3 months).
Trend over time and impact analysis are
available (in table).
Dashboard Views (Level “ 1+2”)
Dashboards:
In addition to indicators which have
been grouped and tagged under the six
2020 doughnuts in the “Organisational
View”, some of these may also
contribute to an information
“Dashboard”. These can be topic based
e.g. – disease based, target based etc.
NHS
Locations
NHS
Locations
Dashboards can potentially appear at
levels 1 + 2 e.g.
• Cross Border Flow – Level 1
Dashboards can be easily navigated
to from the A to Z.
•
RAPID – Level2
Version 1.2
© Common Services Agency, NHS Scotland
Page 12 of 21
Level “3”- Person Centred Views
Data tables:
User with this level of access will
have access to person identifiable
data. This may be either at
consultant level (displaying data at
your GMC code) or by data source .
If permitted to download data to
your local device, you and your
organisation have the responsibility
of the data downloaded; please
ensure you follow local information
governance good practice.
The parameters you selected in the
previous view “Level 2”, will be
passed to this one e.g. dates/
organisation etc.
Further refinement is possible by
changing the parameters using the
filters at the side of the screen.
A table is now presented below with
very specific identifiable data.
Clicking on a blue figure will open up
the Person listing view.
Person Identifiable listings:
This visualisation now provides a
person centred listing and
associated details based on the
indicator e.g. – encounter date/
diagnosis / procedure etc
Version 1.2
© Common Services Agency, NHS Scotland
Page 13 of 21
General Functionality and Icons
A-Z:
In addition to indicators which
have been grouped and tagged
under the six 2020 doughnuts in
the “Organisational View”, NSS
Discovery will also contain a range
of other indicators and dashboards
not defined underneath these
headings.
The A-Z is available in every
visualisation by clicking on the
question Mark icon
.
You can then browse indicators by
using the letters at the top the
search box, or 2020 headings.
Peer Editing:
You can edit your peers using the
peer tab or by clicking on the cog
icon
. You will then be
presented with your default and
extended peer lists.
In either list, click on a particular
site to temporarily exclude them
from the visualisations.
A minimum of 5 peers must be
selected if you wish to be able to
still be able to see the RAG status.
The next time you log in these will
have defaulted back to the fully
inclusive list.
Clicking on the binoculars icon
at the top right will present
navigation options to the user.
Standard Icons:
Navigational URL’s
Located at the top -centre of every visualisation at every level
within NSS Discovery
Export to PDF/ CSV
Revert all selections back to
default
Refresh page
Version 1.2
© Common Services Agency, NHS Scotland
Pause live update
Help; takes you to the A to Z
Index, Metadata and the
NSS Discovery and other
relevant external
WebPages with more
Contextual information.
Revert all
Refresh page
Export
Pause automatic data
updates
Hover over
this icon to
see Level
navigation
options
within NSS
Discovery
Takes you to the
A to Z
Index, Metadata
and the
NSS Discovery and
other
relevant external
WebPages with
more
Contextual
information.
Page 14 of 21
Share Visualisation(s):
It is possible to share your
visualisations with Colleagues via
email or by embedding the
visualisation within your own
website. This can be done by
clicking on the “Share”
icon located in the top right hand
side of the screen.
Again there should be an IG ‘health
warning’ here that it is the user
responsibility to ensure they share
information only with others
authorised to see the data, and it
is their responsibility to ensure the
correct email address is entered.
Bookmarking:
It is possible to save specific views
and or permutations which you
have selected, that you may wish
to view again. To do so, create a
bookmark and name the selection
as you see fit: click on Remember
my changes” at the top right hand
side of the toolbar and type in the
bespoke name of your bookmark.
Click on this in future to view and
quickly access these bookmarks.
Lassoing:
Most if not all of the information
presented within the visualisation
can be lassoed. To do this click the
left mouse button over the set of
data you wish to grab and pull the
mouse across the data, letting go
when you have grabbed the data
selected. This selection will cause
the data to be re-visualised,
highlighting the pertinent data
based on your selection
Version 1.2
© Common Services Agency, NHS Scotland
Page 15 of 21
Specific data selections:
If you wish to select a range of
data that is not adjacent to one
another, right click on the data
element/s you wish to look at
whilst holding down the “Ctrl” key.
This selection will cause the data
to be re-visualised, highlighting the
pertinent data based on your
selection.
Clearing selections:
To clear any bespoke selections
you have made since opening a
visualisation, simply click any blank
part of the screen within the
visualisation or click on the revert
all icon
located on the
standard toolbar at the top centre
of each screen. This also removes
choice of HB’s etc.
Methodologies + Metadata
Rag Explained:
RAG is calculated on an
interquartile rate methodology
where 25% appear in the lower
quartile, 50% in the mid quartile
and 25% in the upper quartile
based on the host site and its
peers.
Where a target exists, this is
included in the visualisation so it is
clear to see that even where 25%
may be in the green upper
quartile, none of them may be
achieving a target.
A further statistical significance
test is available to evaluate the
host and peers against only the
upper quartile peer performers.
This test can be accessed by
clicking on the test button.
Metadata:
Key metadata is available by
hovering over arrow on the right
hand side of the indicator in
question.
More detailed meta data is
available via the A-Z. The metadata
link here will take you to a fuller
description collated within specific
accessible online PDF documents.
Version 1.2
© Common Services Agency, NHS Scotland
Page 16 of 21
User access Levels Explained:
NSS Discovery has an underlying security model applied to it. The model constrains users to certain
levels of access. These levels are described below. All access to NSS Discovery must be authorised by
the requesting organisation’s Caldicott /Senior Responsible Officer (SRO) or appointed delegate(s).
General
Access
Information;
Level 1Non- Confi
Data;
“Overview”
Aggregate
level data
Level 2 –
Potentially
Disclosive
Data;
“Analytics” – not
a) NSS Discovery is hosted by NHS National Services Scotland and is only available via an
N3 connection
b) Access to NSS Discovery can only be authorised by an approved organisation’s Caldicott
Guardian or a recognised Senior Responsible Officer.
c) Authorisations will be handled via the NSS User Access System (UAS)
d) There are 3 levels of user access available Data can be viewed from an NHS Board of
Treatment/ Residence perspective
a) At this level, the data is presented at an aggregate level however the data may be
sensitive at a HB level. Local data disclosure controls must be followed for data release /
sharing.
b) Peer comparisons are possible by NHS Board of Treatment/ Residence/ Specialty
c) All NSS Discovery users can see other organisation details at this level e.g. – NHS
Tayside can see NHS Grampian’s data and visa versa
d) The national Caldicott forum agreed that the S.G (Quest Team & Analytical service reps)
can also access NSS Discovery at Level 1
a) At this level, the user can only view information from within their host organisation e.g.
a NHS Lothian User can only view NHS Lothian Data
b) Peer information will be only be provided at an aggregated peer value
c) Due to the ability to filter on Specialty/ Age/ Sex etc, there is a potential for the data at
this level to be disclosive
disclosure controlled
Level 3 –
NonConfidential
Data;
“Individual level
Data” – Patient
Identifiable
Data; contains
CHI
a) At this level, the user will be able to access all patient identifiable data for their host
organisation e.g. all the Host Board data held within NSS Discovery (all data types/
specialties)
b) Further “Horizontal” security can be applied at the request of the host organisations
Caldicott or SRO, only one of these restrictions can be applied, but data types can be
singly or as a combination of the data type(s);
GMC – Medics can be restricted to only see records that have their GMC number attached
Data Type – The user can be constrained to only see data from a particular data source or
combination of sources e.g. – Inpatients & Outpatients, but not allowed to see
Maternity or Mental Health data.
Information Governance
NSS Discovery is a management information system and is not intended to be used for public
consumption.
Once you log into the NSS Discovery service you are responsible for ensuring there is no
unauthorised access to your NSS Discovery session e.g. anyone unauthorised cannot see the data on
your computer screen, do not share your username and password with anyone else, if leaving your
computer/access device unattended, please ensure the device is appropriately password locked, if
you have the option of downloading data to a local device then you and your organisation will have
the responsibility for the security and governance of this data.
NSS strive to ensure that the information it holds and uses as part of authorised business processes
is appropriately secured in line with NHSScotland information governance policies, procedures,
guidelines and best practice. NSS has a risk management approach to this process and have
completed privacy impact and system security risk assessments. Where risks were unacceptable,
these have been appropriately addressed. Both these assessments will be regularly reviewed by the
appropriate business teams in conjunction with NSS Information Governance Leads.
Version 1.2
© Common Services Agency, NHS Scotland
Page 17 of 21
The computer and network infrastructure that NSS Discovery uses to provide the service has been
risk assessed as part of an in-depth vulnerability test by an approved third party; where this had
raised risks and/or weaknesses these have been addressed and re-tested to ensure the highest level
of security of the service is provided.
Use of the words ‘data’ and ‘information’ are interchangeable.
Core Functions:
Standard Functionality
Favourites button
Firstly, at the top left hand corner you of every screen you will see the NHS Scotland Icon. Next to that
is the title of the screen you are looking at. Beside the title you will notice a ‘star’ icon – this allows you
to favourite this workbook so you can quickly access it from your favourites list. By ‘favouriting’ this
view you will see it appears on your favourites list which is accessed from the star on the right hand
side.
Back Button
Underneath the title you have the ‘Back’ and ‘Workbook’ buttons which will navigate to the previous
view or show you the workbook view in Tableau server.
Help Button
The help button located in the top right of every screen allows you to search for help documents on the
Tableau web site. If you select your user name you can access user preferences which will allow
changing your password, adding in your email address and configuring your start page etc.
Share button
In the next row of icons there is a share button (located directly underneath the NHS Scotland icon)
which allows you to send the current view via email to another colleague or embed the view in another
web page.
Remember my changes
The ‘Remember my changes feature’ is a key feature in that it allows you to bookmark any view and
save for later use so you don’t need to make the selections again.
Tooltips
If you hover over data within each of the visualisations, a tooltip will appear which will provide
additional detail that will help explain.
Version 1.2
© Common Services Agency, NHS Scotland
Page 18 of 21
Scorecard & Methodology Descriptions;
Scorecard
This view is called the scorecard view and it’s really just an alternative overview but it does provide
additional detail that you don’t get with the doughnuts. This could be where personal preference comes
into it as some people may prefer the more minimal look of the doughnuts whereas others will prefer
the extra detail that the scorecard provides. Either way both views give a fairly high level overview of
the system and allow you to pinpoint areas of further interest. If you prefer this view as your default
you can use the bookmarking feature to set this as your default rather than the doughnuts. There is a
lot of flexibility with this view. By switching between the location and specialty view, it allows you to
generate very specific scorecards for each location or each specialty against all the indicators within the
system. Again the bookmarking feature could be useful here. The colour coding applied uses the same
methodology as we saw previously in comparison to your peers. You may want to focus on the red
squares as they indicate potentially poorer comparison compared to your peers.
Inter Quartile Range (IQR)
The RAG methodology used is NSS Discovery is based on the calculation of quartiles within your peer
group. Any location that is performing within the best quartile is classified as green and any within the
worst quartile will be red. Direction of performance is accounted for in this method i.e. whether higher
or lower values are preferred – the visualisation accounts for this and shows it in the same order. You
can see this by looking at A&E waits which is a ‘higher the better’ indicator and DNAs which is ‘lower
the better’. Each location within your peer group is then categorised based on their position relative to
the best and worst quartiles.
Significance Testing
To support further interpretation we have included a statistical test which will test whether the
selected point is statistically significantly better or worse than the upper quartile. To do this, select the
radio button marked statistical test. The visualisation will then change to show whether the selection is
statistically better or worse. The colour coding and tooltip will change to show you the result of the
test. You can then toggle back to the quartile view to compare. This will allow you to make a more
informed judgment about whether further investigation is warranted.
SPC Chart
In NSS Discovery there is an SPC Chart (Statistical Process Control Chart) option to aid the user in
understanding variation over time for chosen measure. In the SPC chart that there is upper and lower
control limits. Rules can be attached for each indicator to indicate where a violation has occurred. A
violation is where a data point exceeds the control limits set and the relevant data point(s) will turn red
to indicate the violation(s).
Trends (upward or downward) will be indicated by turning the respective data points red when there is
an observable trend across at least 5 relevant data points.
Hovering over any data point will cause a tooltip for that data point to appear with the relevant
metadata to present. Again, the standard filters appear at the top of the screen to allow you to filter
the data.
Funnel Plot
This shows the dispersion of the chosen site measured against its peers (all plotted against the average,
the central line). The large dot is the site you have selected.
Version 1.2
© Common Services Agency, NHS Scotland
Page 19 of 21
Again, hovering over any data point will cause a tooltip for that data point to appear with the relevant
metadata to present. Again, the standard filters appear at the top of the screen to allow you to filter
the data.
Overview Page (Doughnut s)
In order to render a visualisation you must firstly:
1. Select your NHS Board
2. Select your location
This will now cause the visualisation to update based on your selections.
You can now choose to change the “Specialty” default which is all to only select a single specialty. Any selections made
here will again re render the visualisation.
You can also view the data across different time periods. It currently defaults to the last 4 quarters. You have the option in
the dropdown to change this to:
•
Last 3 months
•
Last Full Year (Financial Yr)
•
Year to date (Calendar Yr)
N.B- as the data that makes up this visualisation is a blend from a number of different data sources, the
submission dates for the data will vary e.g. – A&E waiting times are submitted monthly, but Maternity is
submitted on a 4 monthly basis. This will therefore result in some information showing and other information
not showing dependant upon the date selections you make.
Explanation of the A-Z
The A-Z contains the entire list of indicators within Discovery, whether or not they sit under a
doughnut, dashboard or are stand alone or all of the above. The A-Z is accessible from the head
icon from any level within Discovery. To access it, simply hover over the head icon and click on
the A-Z hyperlink to open the A-Z.
Using the A-Z:
Alphabetical listings of Indicators
All of the indicators are listed from top to bottom in alphabetical order irrespective or where the
indicators reside within Discovery. Using the grey scroll bar to the right hand side allows you to view
all the way down the alphabetical list. Clicking on this icon
at the far right hand side of the
indicator causes a pop up to appear with hyperlinks to relevant metadata, the visualisation the
indicator appears on etc.
Alphabetical filter across the top of the A-Z
Another way to search and filter indicators alphabetically is to use the alphabetical filter at the top of the page.
Simply click on a letter of the alphabet e.g.”E” and the screen refreshes to only show indicators within
Discovery that begins with “E”. N.B – only letters highlighted in dark blue have indicators sitting underneath
them.
2020 (doughnut) groupings filter across the top of the A-Z
If you only wish to search indicators that sit underneath a particularly 2020 heading (doughnut) you can simply
do this by clicking on the grouping filter at the top of the page. Simply click on the required grouping
e.g.”Timely” and the screen refreshes to only show indicators that reside underneath the timely doughnut.
This same principal applies to filtering indicators by: Residence/Treatment/ Dashboard etc
Search box option
Version 1.2
© Common Services Agency, NHS Scotland
Page 20 of 21
If you are unsure of the specific indicator name or where it may reside within Discovery you may wish to try
searching using the search box so for example, you can search by, word, Group or product; National Efficiency
& Productivity Scorecard (NEPS).
Alternative Navigation Options
Server View: If you click on the
NHS Scotland logo
located
in the top left hand side of all
visualisations, it will take you to the
“w
workbooks” view. This view shows all
of the current workbooks held within
NSS Discovery. If you see the view you
want, you can just click on it and if
you have the correct access, it will
open up the visualisation.
Other options exist here to:
•
•
Go to projects view
Search
Projects View: If you click on the
word “Projects” located in the top left
hand side of the server view,
underneath the NHS Logo it will show
the screen (opposite).
You can see descriptions of NSS
Discovery here and the title is a
hyperlink to these levels of data e.g.
• Discovery – takes you to the
landing page (which takes you to
the Overview screen (doughnut
view)
• Level 1 – shows you all of the
Level 1 workbooks
• Level 2 – shows you all of the
Level 2 workbooks
• Level 3 – shows you all of the
Level 3 workbooks
Other options exist to search:
•
Search box
•
By date
•
By Tags
•
By Favourites
•
Recently used
A to Z
Using your Favourites/
Bookmarks
Click here to find out how to use the A to Z
Click here to find out how to use the favourites options
Click here to find out how to use the bookmark options
Contact Us
If you have any questions regarding NSS Discovery, please contact the Product Support helpdesk at
[email protected] or on 0131 275 7050.
Version 1.2
© Common Services Agency, NHS Scotland
Page 21 of 21