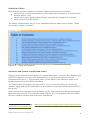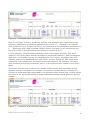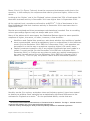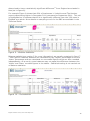
1
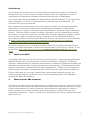
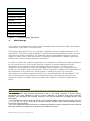
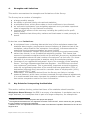
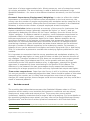
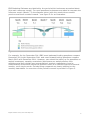
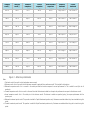
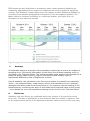
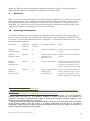
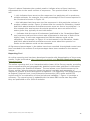
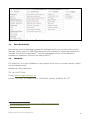
English Business Survey:
User Guide
May 2013
TNS BMRB
© TNS May 2013
JN111115
Contents
Introduction
3
1.
What is the EBS?
3
2.
What does the EBS measure?
3
3.
Methodology
4
4.
Strengths and Limitations
5
5.
Key Points for Interpreting the Statistics
5
6.
Periods covered
6
7.
Accuracy
9
8.
Timeliness
9
9.
Revisions
10
10.
Accessing the statistics
10
11.
Data Availability
16
12.
Feedback
16
English Business Survey User Guide May 2013
2
Introduction
The purpose of this document is to help people interpret the results of the English
Business Survey. It will introduce broad concepts which are important in order to
understand the Statistical Releases and accompanying sets of data tables.
The results have been designated as Experimental Official Statistics. This means they
may be subject to revision if improvements in methodology are identified. All
revisions will be pre-announced.
More detailed information about the survey and its results is presented separately:
information on how the questionnaire was designed is available in the English
Business Survey: Report on Questionnaire Development. Whilst the English Business
Survey: Technical Guide provides in-depth information on the methodology used for
the survey, on how the results are compiled and on other statistical concepts related
to the survey. Both of these documents, together with the Statistical Releases,
accompanying tables and the English Business Survey: Questionnaire, are accessible
at https://www.gov.uk/government/organisations/department-for-businessinnovation-skills/series/english-business-survey.
An online reporting tool (an interactive table viewer of the English Business Survey
results) has been developed to assist with dissemination of the survey results. It can
be found at http://dservuk.tns-global.com/English-Business-Survey-ReportingTool/.
1.
What is the EBS?
The English Business Survey (the Survey) provides timely, robust and geographically
detailed intelligence on business and economic conditions in England. The Survey
enhances understanding of business and economic conditions throughout England and
ultimately improves policy making through this understanding. The statistics are also
useful to businesses, researchers and local organisations, including Local Enterprise
Partnerships interested in intelligence about local economic and business conditions.
Survey estimates are currently classified as experimental statistics as they are
undergoing development and have not yet been assessed against the standards
required for National Statistics.
2.
What does the EBS measure?
The Survey measures business and economic conditions at national, regional and subregional levels. Businesses are asked about their past and current experiences, as well
as their expectations for future conditions. Businesses are asked about a range of
topics, ranging from levels of Output and Employment to Credit conditions and
Investment intentions – Figure 1 outlines the broad structure of the questionnaire and
topics covered.
English Business Survey User Guide May 2013
3
Topic areas covered
Output
Exports
Domestic output
Stocks
Jobs and hours
Prices
Credit conditions
Investment
Capital investment
Figure 1- Questionnaire Structure
3.
Methodology
This section provides an overview of the methods that underpin the EBS. More detail
is available in the EBS Technical Guide1.
The English Business Survey is a monthly telephone survey of approximately 3,000
businesses. The Survey asks managers2 simple directional questions on past, current
and future business conditions, for example, asking respondents whether output is
higher or lower than it was previously; this allows respondents to answer questions
without the need to access detailed information.
In order to reflect the relative importance or contribution of different sized workplaces
to the local economy, the survey uses the number of people employed at each
workplace as the measure of its contribution to the economy. To achieve this,
responses are weighted so that the weighted sample matches the population with
respect to sub-region and employment3. This is designed to capture the importance of
the workplace to the economy; employment is used as a proxy for economic
importance as a robust measure of turnover is not available for all workplaces.4 The
use of employment means that the results effectively estimate the proportion of
employees whose manager believes a particular measure is positive/negative/the
same.
1
https://www.gov.uk/government/organisations/department-for-business-innovation-skills/series/englishbusiness-survey
2
The questionnaire script prompts interviewers to ask for the owner, manager or finance director.
Interviewers are given additional job titles to ask for depending on business sizes (0-49 employees:
Proprietor; 50+ employees: Site manager, Someone in the finance department, managing director, Chief
Accountant)
3
The characteristics used for weighting include: location (NUTS2 Region) and employment size (12 groups:
0-1, 2, 3-4, 5-6, 7-9, 10-19, 20-49, 50-99, 100-249, 250-499, 500-999, 1000+.) More information can be
found in the Technical Guide.
4
The use of employment rather than turnover to allocate the sample, is likely to be preferred even if turnover
data were available, as employment is generally less volatile than turnover.
English Business Survey User Guide May 2013
4
4.
Strengths and Limitations
This section summarises the strengths and limitations of the Survey.
The Survey has a number of strengths:
a large monthly sample;
the ability to provide timely sub-national statistics;
a workplace focus, which allows data on local conditions to be collected;
an ‘economic importance’ type weighting approach to try to better represent
what is happening for sub-national economies;
coverage of all sectors of the economy including the public/not for profit
sectors; and,
timely statistics that allow policy makers and businesses to react promptly to
issues.
It also has some limitations:
A workplace focus: collecting data at the level of the workplace means that
statistics about region, employment size and industry all relate to that of the
workplace, rather than for the enterprise. Accordingly, inferences about the
enterprise-level business population are more limited;
‘economic importance’ weight: the process of grossing to employment totals,
rather than counts, is not a traditional weighting process. This means that
economic importance weights should not be used with the survey variables that
ask respondents about the total number of employees5 at their site. For these
variables it is more appropriate to analyse using the workplace weight.
Coverage of non-registered businesses: due to the coverage of the sampling
frame – the Inter-Departmental Business Register – the EBS does not cover
non-registered6 businesses. This is potentially important as such businesses
make up a significant proportion of the overall business population (55% of
businesses) although they account for a smaller share of employment (12%)
and turnover (3%)7; and,
Seasonality: The statistics derived from the Survey are likely to include
seasonal patterns, which have not been removed through seasonal adjustment;
it is recommended that users interpret the statistics considering this fact – see
time series comparison section for more information.
5.
Key Points for Interpreting the Statistics
This section outlines the key points that Users of the statistics should consider.
Workplace Based Survey: the EBS is a survey of workplaces. A workplace can be a
single business, or a workplace that is part of a larger enterprise, for example the
5
Variables that relate to total employment are qemps and qempsfl.
6
Non-registered businesses are not registered for either PAYE OR VAT, which means they are generally,
the very smallest non-employing businesses.
7
Statistics on the non-registered businesses are taken from Business Population Estimates for the UK and
Regions 2012
English Business Survey User Guide May 2013
5
local store of a large supermarket chain. Ninety-seven per cent of enterprises consist
of a single workplace. The term business is used to describe workplaces in the
Statistical Releases – for more on the different business structures, see the Technical
Guide.
Economic Importance (Employment) Weighting: in order to reflect the relative
importance or contribution of different sized workplaces to the local economy, the
survey uses the number of people employed at each workplace as the measure of its
contribution to the economy. Where the size of business is reported in the Statistical
Releases, it refers to the number of people employed at each workplace.
Balance Statistics: balances provide a summary of the scores for businesses that
expect a variable to change (generally reported as ‘higher’ or ‘lower’); and are
calculated by deducting the scores for the ‘lower’ category from the scores for the
‘higher’ category. If a balance statistic is positive, more businesses experienced or
expected a factor to be higher; conversely, if a balance statistic is negative more
business experienced or expected a factor to be lower. Balance statistics do not
provide an indication of the number of businesses that answered a factor was the
same and it is recommended that users review the scores for all categories when
considering a balance. Users should also be aware that a balance can be achieved
through a number of different scenarios in the underlying results. For example, a
balance of zero can be achieved from Higher and Lower being both 0% or both being
50%. It is therefore important to consider the underlying figures published for each
variable.
It is important to remember that the survey questions ask workplaces whether, for
example, output was higher or lower and this does not take into account the size of
any changes. Therefore a balance of 50% does not necessarily mean output growth
will be higher than if the balance was 20%, as the growth rate seen by those
contributing to the 20% positive balance may, in aggregate, outweigh the growth
rates seen or expected by those contributing to the positive 50% balance. The
difference in size between the two percentages simply means that businesses
accounting for a larger proportion of the economy reported that output was higher.
Time series comparisons: Data from the Survey is still in its infancy and therefore
it is not yet possible to seasonally adjust the data. Users should be aware of this when
interpreting the results; as it is likely that comparisons over time will show large
changes for certain groups; these changes could be true changes, but they could be a
result of seasonal patterns.
6.
Periods covered
The monthly data tables that accompany the Statistical Release relate to 15 key
questions which mostly cover business and economic conditions such as output,
employment, wage costs and output prices. The survey also covers capital
investment, capacity constraints and a range of ad hoc questions. For more details on
the questions workplaces were asked, you may refer to the English Business Survey:
Questionnaire8 and the list of ad hoc questions contained in the Technical Guide.
8
https://www.gov.uk/government/organisations/department-for-business-innovation-skills/series/englishbusiness-survey
English Business Survey User Guide May 2013
6
EBS Statistical Releases are labelled by the period which businesses are asked about
(the main reference month). For most questions businesses are asked to compare the
reference month (Month T in the diagram below) with the month three months
previous and three months forward – see figure 2 for an illustration.
Figure 2 – Reference Period
For example, for the December 2011 EBS most backward-looking questions compare
December 2011 with September 2011 and most forward looking questions compare
March 2012 with December 2011. However, care should be taken, as for questions on
capital investment, capacity constraints (businesses are asked whether their
workforce and their capital were overstretched, used at a satisfactory level or
underutilised) and annual output the question refers to a reference period of several
months, not a single month. Periods being compared are clearly labelled on the
monthly data tables. An overview of the periods covered is provided in Figure 3.
English Business Survey User Guide May 2013
7
Fieldwork
month (i)
Reference
month (ii)
Oct-11
Backward
comparison
month (iii)
Jul-11
Forward
comparison
month (iv)
Jan-12
Annual backward
comparison
month (v)
Oct-10
Backward
investment
period month (vi)
Aug 11-Oct 11
Forward
investment
period month
Nov 11-Jan
(vii) 12
Nov-11
Dec-11
Nov-11
Aug-11
Feb-12
Nov-10
Sep 11-Nov 11
Dec 11-Feb 12
Jan-12
Dec-11
Sep-11
Mar-12
Dec-10
Oct 11-Dec 11
Jan 12-Mar 12
Feb-12
Jan-12
Oct-11
Apr-12
Jan-11
Nov 11-Jan 12
Feb 12-Apr 12
Mar-12
Feb-12
Nov-11
May-12
Feb-11
Dec 11-Feb 12
Mar 12-May 12
Apr-12
Mar-12
Dec-11
Jun-12
Mar-11
Jan 12-Mar 12
Apr 12-Jun 12
May-12
Apr-12
Jan-12
Jul-12
Apr-11
Feb 12-Apr 12
May 12-Jul 12
Jun-12
May-12
Feb-12
Aug-12
May-11
Mar 12-May 12
Jun 12-Aug 12
Jul-12
Jun-12
Mar-12
Sep-12
Jun-11
Apr 12-Jun 12
Jul 12-Sep 12
Aug-12
Jul-12
Apr-12
Oct-12
Jul-11
May 12-Jul 12
Aug 12-Oct 12
Sep-12
Aug-12
May-12
Nov-12
Aug-11
Jun 12-Aug 12
Sep 12-Nov 12
Oct-12
Sep-12
Jun-12
Dec-12
Sep-11
Jul 12-Sep 12
Oct 12-Dec 12
Nov-12
Oct-12
Jul-12
Jan-13
Oct-11
Aug 12-Oct 12
Nov 12-Jan 13
Dec-12
Nov-12
Aug-12
Feb-13
Nov-11
Sep 12-Nov 12
Dec 12-Feb 13
Jan-13
Dec-12
Sep-12
Mar-13
Dec-11
Oct 12-Dec 12
Jan 13-Mar 13
Feb-13
Jan-13
Oct-12
Apr-13
Jan-12
Nov 12-Jan 13
Feb 13-Apr 13
Figure 3 – Reference period dates
Notes:
i. Field work month: the month in which workplaces were surveyed.
ii. Reference month: this is the month that the business compares its past and future performance with. This is asked for all questions.
iii. Backward comparison month: this is a month in the recent past that the business compares its current performance to. This is asked for most (but not all
questions).
iv. Forward comparison month: this is a month in the near future that the business is asked how it expects its performance to compare to the reference month.
v. Annual comparison month: this is 12 months prior to the reference month. The business is asked one question (qoutyr) to compare performance with the
previous year.
vi. Backward investment period month. This question is asked for Capital Investment questions only. Businesses are asked whether they have invested during this
period.
vii. Forward investment period month. This question is asked for Capital Investment questions only. Businesses are asked whether they plan to invest during this
period.
EBS results are also published on a quarterly basis; these quarterly statistics are
created by aggregating three months of responses and using a quarterly weighting
scheme. The quarterly release differs from the regular monthly Statistical Release by
providing more detailed geographical information in the accompanying tables. The
tables refers to business conditions in a reference quarter, see figure 4 for an
illustration of the reference periods.
Figure 4 Quarter reference period
7.
Accuracy
All estimates based on a sample of the population rather than a census are subject to
sampling error. Provisional information on the likely size of these sampling errors is
provided in the Technical Guide. The published tables show whether the estimate for a
particular group (data is split by region, business size and industry type) is
significantly different to that of England as a whole.
Like all statistics, the estimates in the Survey are subject to potential non-sampling
errors – for example biases; measurement errors; and calculation errors. However,
attempts have been made to minimise these by, for example, rigorous testing of the
questionnaires, monitoring the work of interviewers and response rates to the survey
– more details on error and significance testing can be found in the Technical Guide.
8.
Timeliness
Statistics from the Survey are published within two months of the period to which
they refer. The date of publication is announced at least four weeks in advance. Due
to the experimental nature of the data the publication date for each month may vary.
English Business Survey User Guide May 2013
9
However, BIS are working towards a regular publication cycle. Future publication
dates will be added to the National Statistics Publication Hub9.
9.
Revisions
While every care has been taken to produce reliable statistics, the Survey is still being
developed and has been designated an Experimental Official Statistic. As the Survey
develops statistics may be subject to revision if improvements in methodology are
identified. All revisions will be pre-announced where practicable and all known users
notified and details summarised in the Technical Guide.
10.
Accessing the statistics
This section explains how to access the Statistics from the Survey and illustrates to
the user how to access and interpret the statistics, using screenshots. Statistics can
be found on the English Business Survey webpage10 and the EBS Reporting tool11, and
are published as follows:
Description
Publication
frequency
Number of
variables12
Geography available
Splits
Monthly
Statistical Tables
Monthly
15
National and Regional
Business Size, Broad Industrial
Sectors
Quarterly
Statistical Tables
Quarterly
15
National, Regional and
Sub Regional
(NUTS213/LEP)
Business Size, Broad Industrial
Sectors
Monthly
Statistics:
Reporting Tool
Monthly
19
National and Regional
Business Size, Broad Industrial
Sectors, Enterprise type, Age of
Business, Export status, Legal
Status, Nationality of Ownership
Quarterly
Statistics:
Reporting Tool
Quarterly
21
National, Regional and
Sub Regional
(NUTS2/LEP)
Business Size, Broad Industrial
Sectors, Enterprise type, Age of
Business, Export status, Legal
Status, Nationality of Ownership
9
http://www.statistics.gov.uk/hub/index.html
https://www.gov.uk/government/organisations/department-for-business-innovation-skills/series/englishbusiness-survey
11
http://dservuk.tns-global.com/English-Business-Survey-Reporting-Tool/
12
15 of the variables in the reporting tool are the same 15 tables as reported in the monthly/quarterly
statistical tables (see Figure 4). The additional variables for monthly statistics are extra questions on
magnitude of change in output/expected change in output and investment (quarterly statistics on the
reporting tool also include questions on exporting.
13
The nomenclature of territorial units for statistics (NUTS) classification is a hierarchical system for dividing
up the economic territory of the EU. NUTS1 is a regional classification and NUTS2 is a sub-regional
classification. Within the NUTS1 region of North West England are the NUTS2 sub-regions Tees Valley and
Durham, and Northumberland and Tyne & Wear.
10
English Business Survey User Guide May 2013
10
Statistical Tables
Overall there are two categories of tables, tables showing how businesses:
perceive the current performance of their business compared to a month, three
months before; and,
expect the current performance of their business will compare to a month,
three month’s into the future.
The tables released have the 15 ‘core’ questions that are asked every month. These
are shown in figure 5 (below).
Figure 5 – Table of Contents
Structure and format of published tables
Figure 6 is an example of the layout of a typical data table. It shows the result for the
QOUTPUT question on Level of business activity or volume of output in Dec-11
compared with Sep-11. The variable name on the tables is the same as used in the
questionnaire and in the SPSS microdata.
The Table’s title information can be found in row 7 of the worksheet. It shows the
variable name and a brief explanation of the question that respondents were asked in
the survey14.
Row 8 shows the coverage of the question; in the table below this was all businesses
that were interviewed. In the Stocks table (Figure 10), the question was only asked
of those industry sectors that commonly hold stocks.
14
The questionnaire is published:
questionnaire-core-questions-only
English Business Survey User Guide May 2013
https://www.gov.uk/government/publications/english-business-survey-
11
Figure 6 – Example table (Qoutput)
Row 12 (in Figure 6 above) shows the number of businesses who responded to the
question. Results are provided at national level (column C - ‘England’), at regional
level (columns D to L ‘Region (NUTS1)’), by broad size of the workplace (columns M to
P
‘Workplace size’) and by broad industry sector (not seen in this screenshot but
are to the right of the Workplace size results in columns Q to T).
In this example, 2,995 English businesses were interviewed. Of these, 410 were
located in the South West and 685 workplaces employed between 1 and 9 employees.
Note that, in this table, figures by characteristics (e.g. region, workplace size and
industry sector) are independent of each other. In other words the 685 businesses
employing 1 to 9 employees are spread across the regions; for example, this table
does not show how many businesses with 1 to 9 employees are located in the South
West.
Figures on this row are counts of the number of businesses that responded to the
question and are rounded to the closest 5 to preserve confidentiality; knowing the
number of businesses that responded to the question helps assess how reliable results
are likely to be, as results based on small unweighted counts would generally be less
reliable.
Figure 7 – example of directional indicators
English Business Survey User Guide May 2013
12
Rows 13 to 16 (in Figure 7 above) show the responses businesses could give to the
question; in this example, the responses that can be given are higher, lower or the
same.
Looking at the ‘Higher’ row in the ‘England’ column shows that 33% of businesses felt
that their business activity in December 2011 was higher than in September 2011.
At the regional level, sometimes referred to as NUTS115, 31% of businesses in the
East Midlands felt that their business activity in December 2011 was lower than in
September 2011.
Results are weighted and then percentages calculated and rounded. Due to rounding,
column percentage figures may not always add up to 100%.
Many of the tables which accompany the Statistical Release have the same possible
response of higher, the same, or lower; however, a few do differ:
Workforce and Capital Use questions: ask about whether the workforce/ capital
were overstretched, used at a satisfactory level or underutilised in the reference
month (for the December 2011 EBS this is December 2011), this question can
be treated in a similar way to questions reporting higher/ the same/ lower.
Capital investment question: ask if any capital investment has been made in a
certain 3 month period (for the December 2011 EBS this is October 2011December 2011) or if there are any plans to make any capital investments in
the next 3 month period (for the December 2011 EBS this is January 2012March 2012). This is a yes/ no question rather than a directional question.
Figure 8 – significant differences
Monthly results (for regions, workplace sizes and industry sectors) have been tested
to determine whether each estimate has a statistically significant difference to the
estimate for England as a whole.16 On the published tables, results that are
15
The acronym NUTS stand for Nomenclature of Territorial Units for Statistics. The digit ‘1’ indicate the level
at which these statistics are, in this case the English regional level.
16
BIS are currently developing the ability to test the quarterly statistics for statistical significance.
English Business Survey User Guide May 2013
13
determined to have a statistically significant difference17 from England are shaded in
blue (as in figure 8).
For example Figure 8 shows that 42% of businesses in Yorkshire and The Humber
report output being higher in December 2011 compared to September 2011. This cell
is highlighted so it indicates that 42% is significantly different from the 33% seen in
England as a whole. More details on sampling errors for the EBS are available in the
Technical Guide.
Figure 9 – Balance statistics
Balance statistic (see section 5 for more information) are usually contained in Row 17
– see Figure 8. Balance statistics are calculated by the ‘Higher’ percentage minus the
‘Lower’ percentage and are calculated on unrounded figures which are then rounded
independently; as a result, some balances may not equal the difference between the
‘higher’ and ‘lower’ rounded figures in the tables. Statistical testing is not carried out
on balance statistics.
Figure 10 – Presentation
17
At the 95% confidence level
English Business Survey User Guide May 2013
14
Figure 10 above illustrates the symbols used to indicate when a figure has been
suppressed due to the small number of responses. The symbols used in the tables
are:
*: this indicates there were too few responses in a particular cell to produce a
reliable estimate, for example, the small percentage of Don’t knows reported in
the Construction sector in Figure 10.
-: this indicates that there were too few responses in this particular column to
produce reliable results. Figure 10 shows that the results for Education, Health
and Public administration and defence sector were too few to be published – in
this example this was because the stocks questions were not asked of this
sector given they typically do not hold stocks.
...: indicates that the count of businesses (published in the ‘Unweighted Base’
row) was too small and the column was suppressed or that one or both of the
higher/ lower % cells was suppressed so that the balance could not be
calculated. For example, in Figure 10 no businesses in the Education, Health
and Public administration and defence sector were asked the question on
Stocks so the balance could not be calculated.
All figures and percentages in the tables have been rounded. Unweighted counts have
been rounded to the nearest 5 and percentages have been rounded to the nearest
integer.
Reporting Tool
An online reporting tool has been developed to assist with dissemination of the survey
results. It can be found at http://dservuk.tns-global.com/English-Business-SurveyReporting-Tool/
The online reporting tool is an interactive table viewer of the Survey results, providing
more comprehensive and geographically detailed results than published in the tables
that accompany the Statistical Release. The tool allows more flexible access to the
Survey results, allowing users to choose the period, variable and geography of
interest to produce a more tailored set of statistics. The Reporting Tool allows analysis
at England, Regional level, Local Enterprise Partnership (LEP) areas and NUTS2
regions and for a combination of time periods and variables – Figure 11 provides a
summary. The reporting tool is updated with the latest EBS results two days after
they are published on the .GOV.uk website.
English Business Survey User Guide May 2013
15
Figure 11 – Online Reporting Tool options
11.
Data Availability
Data tables and the statistical release are available within two months of the period
that the survey refers to. EBS Micro data are also available to ‘approved researchers’
via ONS’ Virtual Micro Laboratory18 and an aggregated version of the dataset is
available to academics from the UK Data Archive19.
12.
Feedback
For enquiries, or to give feedback on any aspect of the survey or data outputs, please
use the details below:
Statistician: Gary Wainman
Tel: 0114 207 5114
E-mail: [email protected]
Letters: 2nd Floor, 2 St Paul’s Place, 125 Norfolk Street, Sheffield, S1 2FJ
18
http://www.ons.gov.uk/ons/about-ons/who-we-are/services/vml/index.html
19
http://www.data-archive.ac.uk
English Business Survey User Guide May 2013
16