1
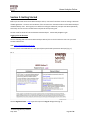
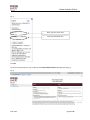
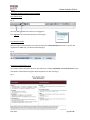
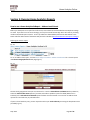
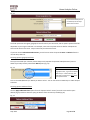
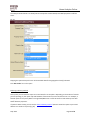
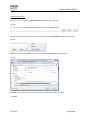
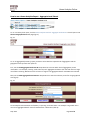
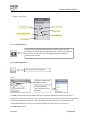
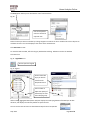
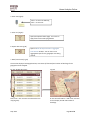
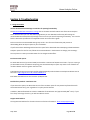
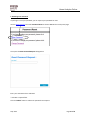
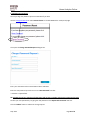
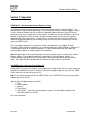
Home Analytics Online
Basic User Guide v1.1
EST Home Analytics v3 – Basic User Guide
Sept 2014
Page 1 of 32
Home Analytics Online
Basic User Guide v1.1
Table of Contents
Section 1: Introduction ..........................................................................................................3
Background .......................................................................................................................3
Section 2: Getting Started .....................................................................................................4
Logging In for the first time ...............................................................................................4
Navigating the Home Analytics Online window .................................................................6
Section 3: Running Home Analytics Reports ..........................................................................9
Address Output report ......................................................................................................9
Choosing optional geographical filters........................................................................ 10
Choosing optional additional filters ............................................................................ 10
Selecting a delivery method ....................................................................................... 11
Downloading the data ................................................................................................ 13
Summary Output report .................................................................................................. 14
Choosing the Geographic Hierarchy ........................................................................... 14
Using optional geographical filters ............................................................................. 16
Choosing optional additional filters ............................................................................ 16
Section 4: Using the GIS Dashboard ..................................................................................... 19
Using optional filters ....................................................................................................... 19
Map selection .................................................................................................................. 20
The GIS Dashboard .......................................................................................................... 23
GIS Dashboard components in detail ............................................................................... 23
Exporting the underlying dataset..................................................................................... 23
Section 5: Troubleshooting .................................................................................................. 27
Things to consider ........................................................................................................... 27
Resetting your password ................................................................................................. 28
Changing your password ................................................................................................. 29
Section 6: Additional Information ........................................................................................ 30
Section 7: Appendix…………………………………………………………………………………………………………….31
Sept 2014
Page 2 of 32
Home Analytics Online
Basic User Guide v1.1
Section 1: Introduction
Background
EST Home Analytics – Retrofit assessment tool
To help local authorities and housing associations target retrofit activity effectively, understand their housing
stock and meet their carbon reduction aspirations, the Energy Saving Trust has developed EST Home Analytics.
Using survey data, statistical modelling and GIS, EST Home Analytics is the first address-level profile of all 26
million homes in the UK in terms of their key property attributes and opportunities for low carbon retrofit.
EST Home Analytics’ data can be used to maximise uptake of retrofit opportunities such as ECO, HEEPS:ABS, the
Green Deal, Feed in Tariffs and the Renewable Heat Incentive. It also enables organisations to understand the
current challenges and opportunities facing their housing stock in moving to a low carbon future, and enables
them to set evidence based targets and actions plans to mitigate CO2 emissions and alleviate fuel poverty.
The modelled data provided by EST Home Analytics helps to identify:
•
•
•
Which homes are suitable for which energy efficiency measures.
The overall potential for retrofit in an area.
Those households most likely to be at risk of fuel poverty.
The Home Analytics Statistical Model
Weighting coefficients are produced by combining baseline data from house condition surveys with predictor
variable information. These weightings are then used to model the UK housing stock from 5.2 million
installation and survey records held by EST. Multi-nomial regression is used to produce address level
propensities for over 19 million properties for which no survey data exists.
During this process, data is aggregated and then disaggregated to produce a non-disclosure model which
anonymises actual data while attaining a high degree of accuracy, outputting to address-level or higher.
This Guide
This manual provides a user guide which describes the basic functions of EST Home Analytics On-line such as
logging in, running reports and using the built-in GIS tool.
Links are also provided at the end of this document to sources of further information including a technical guide.
Sept 2014
Page 3 of 32
Home Analytics Online
Basic User Guide v1.1
Section 2: Getting Started
Before you can have access to EST Home Analytics online, users must first obtain a licence and sign a Provision
of Data Agreement. The terms and conditions of this contract cover the authorised use of EST Home Analytics
modelled data by users. Once signed, users will be issued logon credentials (a unique user ID and password)
which they can use to access the EST Home Analytics GIS and reporting tool.
Contact email for details of how to obtain EST Home Analytics: [email protected]
Logging In for the first time
Use the following URL to access EST Home Analytics Online (click on the link below or enter into your web
browsers address bar:
LINK: https://homeanalytics.est.org.uk
This will open the EST HEED Online 31 web portal (same portal used by EST Home Analytics) (Fig. 1):
Fig. 1.
Use the Registered Users – Login hyperlink to open the Log on dialogue box (Fig. 2):
1
Homes Energy Efficiency Database.
Sept 2014
Page 4 of 32
Home Analytics Online
Basic User Guide v1.1
Fig. 2.
Enter your User name here
Enter your Password here
Click OK.
Once you have entered your user credentials, the Home Analytics Online web page opens (Fig. 3):
Fig. 3.
Sept 2014
Page 5 of 32
Home Analytics Online
Basic User Guide v1.1
Navigating the Home Analytics Online window
Your Tool bar Area
Fig. 4.
Your User Name appears here while you are logged on.
Fig 5
Click ‘Log Off’ to end your Home Analytics session (Fig 5).
Your Web portal Tabs
When you login to Home Analytics you will be directed to the Home Analytics Online tab. If you are also
registered as a HEED user, you will see both tabs (Fig 6).
Fig. 6.
The Status and Information Area
This contains useful information which for your reference, including a Disclaimer and Terms of Use which you
should refer to these before using EST Home Analytics for the first time (Fig 7).
Fig. 7.
Sept 2014
Page 6 of 32
Home Analytics Online
Basic User Guide v1.1
The Status section provides details of the Home Analytics version release and latest updates plus a link (‘click
here’) to the latest System Maintenance information. This provides information on scheduled production
maintenance activities during which the system may be inaccessible.
In the Links section, you can find links to the User Guide and to a pdf describing recommended settings for
Internet Explorer, both of which are downloadable for your reference.
Please refer to the Recommended Internet Explorer settings document for a ‘how to’, and description of the
recommended Internet Explorer settings that need to be applied before attempting to run Home Analytics
reports. Failure to do so may result in loss of critical functionality, particularly when downloading competed
reports to Excel.
A support email address is also supplied which you can use to raise technical issues or request further
information: [email protected].
Your Home Analytics Reports
Fig. 8.
Fig. 8 shows the type of report that you have access to. The example used throughout this guide is for a Scottish
local authority user which uses the Home Analytics Scotland v3.0 report format. Non Scottish local authority
users will use other report formats depending on their security credentials.
Clicking on the high-level link opens a new page which lists the reports that the user can run. The options
presented are dependent on the level of user access (Fig.9):
Fig. 9.
Reporting access users can run Home Analytic reports and will see only the Address Output and Summary
Output reports listed. Those users with GIS Dashboard access will see the three options shown in Figure 8
above.
GIS Dashboard access allows users to run the two types of reports plus use a built-in GIS Tool to produce and
export GIS maps and their underlying datasets.
Sept 2014
Page 7 of 32
Home Analytics Online
Basic User Guide v1.1
Home Analytics Scotland: Address Level Extract
This produces an address-level report for domestic properties in a given location. You can run a full report for
all properties in your local authority area, or customise the report by selecting particular geographical areas
and/or selecting optional data filters. For example, you may want to identify only the solid wall properties that
are off-gas in a particular ward or data zone.
Home Analytics Scotland: Aggregate Level Extract
This produces an aggregated summary report for domestic properties in a given location. As with the Address
Output reports, you can customise the report by selecting particular geographical areas and/or selecting
optional data filters. For example, you may want to produce a summary report which shows the numbers of
domestic properties of a given tenure in particular Wards or Data Zones.
Home Analytics Scotland: GIS Dashboard
Users who have GIS Dashboard access can make use of a built-in GIS reader. This allows users to render the
Home Analytics data in a geographically visual format one layer (data parameter) at a time, and to produce and
export maps. In addition the dataset which underlies the particular map being viewed can be exported to Excel.
Sept 2014
Page 8 of 32
Home Analytics Online
Basic User Guide v1.1
Section 3: Running Home Analytics Reports
How to run a Home Analytics ScReport - Address Level Extract
Before you attempt to run a report for the first time, ensure that the recommended Internet Explorer settings
are used. If you don’t use the correct settings, you may lose critical functionality which will result in you being
unable to download reports to Excel. A link is provided to a downloadable pdf from the EST website in the
Status and Information Area of the Home Analytics Online window (Recommended Internet Explorer settings).
Selecting the correct report.
Fig. 10.
To run an address-level report, click the Home Analytics Scotland - Address Level Extract link. This will open a
new Choose Geographical Area web page (Fig.11):
Fig. 11.
Choose which geographical area you are interested in. From the View address Level Data For: drop-down list,
select the Selected Data Zones option if you want to be able to produce reports for LSOAs (Data zones in
Scotland) or the Selected Electoral Wards option for data on Council Wards. You can also run address-level
reports for a local authority or postcode sector.
If you are a local authority user, you are required to select your Local Authority area using the drop-down menu
provided (Fig. 12):
Sept 2014
Page 9 of 32
Home Analytics Online
Basic User Guide v1.1
Fig. 12.
If your local authority area is
not selected, use the dropdown menu to select.
This field represents the highest geographical area for which you have access, and the options presented will be
dependent on your logon credentials. For example, some users may have access to data for multiple areas
which will be listed in the menu. Only one area may be selected at a time.
If you have chosen Selected Postcode Sectors, you will have to select the postcode Area and District from the
relevant drop-down list.
Choosing optional geographical filters
Once you have made your selection, Home Analytics will populate the optional LSAO (Data Zone) menu or
Wards if you had previously selected the Ward option (Fig. 13):
Fig. 13.
Tip:
If you want all the data for your
geographical area, e.g. for all the LSOAs
(Data zones) in a local authority, your
report will run faster if you don’t select
all the optional areas.
Click on the LSAO (Data Zone) or Wards you want to select. You can use the Ctrl and Shift keys to make multiple
selections.
Choosing optional additional filters
Use the Apply Additional Filters option from the ‘Optional Filters’ menu if you wish to narrow the report
dataset (Fig 14) and then select the query parameters from the menus provided (Fig 15).
Fig. 14.
Sept 2014
Page 10 of 32
Home Analytics Online
Basic User Guide v1.1
The example shown below is to identify Owner Occupied or Private Rented, Solid Wall properties in Off Gas
areas.
Fig. 15.
Skipping this optional step will return all the available data for the geographical area(s) selected.
Click ‘Get results’ to run the report.
Selecting a delivery method.
At this point you can leave the report to run and wait for it to complete. Depending on the number of records
you are reporting on, the report may take between a few minutes to more than half an hour. For example, a
filtered report for only Cavity Walls in a single LSOA/Data zone vs a full extract for a local authority area with
250K+ domestic properties.
If you don’t want to wait, you can use the ‘Select a delivery method’ option to email the report to your email
address or to another recipient (Fig 16):
Sept 2014
Page 11 of 32
Home Analytics Online
Basic User Guide v1.1
Fig. 16.
Click Select a delivery method.
The Email Report Option box opens (Fig.17):
Fig. 17.
Click ‘Email Report’ to open the Set the email options dialogue box (Fig.18):
Fig. 18.
Enter the recipient here or use the
‘Select the recipients…’ option to
open your address book.
Compose your message here.
Ensure ‘Attach the Report’ is checked.
Click OK to finish and email the report
Sept 2014
Page 12 of 32
Home Analytics Online
Basic User Guide v1.1
Downloading the data.
Once the report is complete, the File Download dialogue box opens (Fig. 19):
Fig. 19a.
Choose the option you want by clicking the correct button on the File Download dialogue box (Fig 19b).
Fig 19b
Open launches Excel; click Save to save the report (opens the Save As dialogue box) (Fig. 20):
Fig. 20.
Navigate to the location where you want to save the file. Rename the file as required.
Click Save.
Sept 2014
Page 13 of 32
Home Analytics Online
Basic User Guide v1.1
How to run a Home Analytics Report - Aggregate Level Extract
To run a summary-level report, click the Home Analytics Scotland – Aggregate Level Extract. This will open a new
Choose Geographical Area web page (Fig.21):
Fig. 21.
To run an aggregated (summary) report you have to select both the required level of aggregation and the
geographical area you want the report for.
First, use the View Aggregated Level Data At: drop-down list to choose which level of aggregation you are
interested in. For example, choosing ‘Local Authority Level’ aggregates the data to this level and returns a single
line of data. Selecting ‘Data Zone Level’ will return a single line of aggregated data for each Data Zone selected.
Next, use the View Aggregated Level Data For: drop-down list to start the selection process for the geographical
area (Fig 22).
Fig. 22.
Three examples to demonstrate the flexibility in reporting are shown below. The example in Fig 23 will return
one line of aggregated data for each of the Data Zones in Eilean Siar (Table A).
Sept 2014
Page 14 of 32
Home Analytics Online
Basic User Guide v1.1
Fig 23.
Table A
Location
LA > Data Zone
Dw ellings
Eilean Siar > S01002339: Vatersay to Castlebay
324
Eilean Siar > S01002340: North Barra
374
Eilean Siar > S01002341: Eriskay to South Boisdale
308
Eilean Siar > S01002342: Loch Boisdale
307
Eilean Siar > S01002343: Loch Eynort to Iochdar
365
Eilean Siar > S01002344: South Benbecula
213
The example in Fig 24 below will return one line of aggregated data for each of the Census Output Areas (COAs)
in the selected Eilean Siar DataZone of S01002348 (Table B)
Fig. 24.
Table B
LA > Data Zone > COA
Dw ellings
Eilean Siar > S01002348: South Harris > S00042413
41
Eilean Siar > S01002348: South Harris > S00042414
45
Eilean Siar > S01002348: South Harris > S00042415
47
Eilean Siar > S01002348: South Harris > S00042416
36
Eilean Siar > S01002348: South Harris > S00042417
49
Eilean Siar > S01002348: South Harris > S00042418
45
Eilean Siar > S01002348: South Harris > S00042419
106
Eilean Siar > S01002348: South Harris > S00042568
66
Eilean Siar > S01002348: South Harris > S00042603
46
Eilean Siar > S01002348: South Harris > S00042604
54
The example in Fig 25 below will return one line of aggregated data for each of the Postcode Sectors in the
selected Ward (Table C)
Sept 2014
Page 15 of 32
Home Analytics Online
Basic User Guide v1.1
Fig 25.
Table C
Location
Postcode Area > District > Sector
Dw ellings
G > G13 > G13 1
301
G > G13 > G13 2
135
G > G13 > G13 3
5,071
G > G13 > G13 4
2,801
G > G14 > G14 0
3,254
G > G14 > G14 9
2,788
Choosing optional additional filters
Use the Apply Additional Filters option from the ‘Optional Filters’ menu if you wish to narrow the report
dataset (see p10).
Skipping this optional step will return all the available data for the geographical area(s) selected.
Choosing optional Display options
When running aggregated reports you have the option to exclude from your report those dataset variables
which you are not interested in.
Fig 26.
Click the Display Options button to open the Display Option dialogue window (Fig 27)
Sept 2014
Page 16 of 32
Home Analytics Online
Basic User Guide v1.1
Fig 27.
Check or un-check the check boxes from the list provided to choose which data columns will display in your
report.
Click ‘Get results’ to run the report.
The ‘Your report is running.’ dialogue box opens (Fig. 28):
Fig. 28.
At this point you can leave the report to run and wait for it to complete. Depending on the number of records
you are reporting on, the report may take between a few minutes to more than half an hour. For example, a
filtered report for only Cavity Walls in a single LSOA/Data zone vs a full extract for a local authority area with
250K+ domestic properties.
If you don’t want to wait, you can use the ‘Select a delivery method’ option to email the report to your email
address or to another recipient. See the bookmarked Selecting a delivery method section above.
To download your report, see the bookmarked Downloading the data section above.
Sept 2014
Page 17 of 32
Home Analytics Online
Basic User Guide v1.1
Section 4: Using the GIS Dashboard
How to use the GIS Dashboard
From the Home Analytics Reports menu, select the Home Analytics Scotland: GIS Dashboard option (Fig. 29):
Fig. 29.
This opens a new Choose Geographical Area report menu where you can select the geographical area you are
interested in (Fig.30):
Fig. 30.
The example shown in Fig 30 will display the Dumfries & Galloway local authority area map showing data for
every Data Zone. Use the Data Zone (Optional) menu to analyse selected Data Zones.
Once you have selected the geographical hierarchy you want to use, you can use the Optional Filters option if
you wish to narrow the report dataset (see p10: Fig. 14). Skipping this step returns all the available data for the
geographical area(s) selected.
Click ‘Next’.
This opens a new Choose GIS Output Area/Level report menu where you can select which map /display the
geographical level you wish to use (Fig.31):
Sept 2014
Page 18 of 32
Home Analytics Online
Basic User Guide v1.1
Fig. 31.
This dashboard gives you several options in how to display maps.
These three Map buttons along the top will produce the following GIS outputs (Figs 32a-c):
Fig 32a. Map Region at LA
This displays data aggregated to local authority level.
Sept 2014
Page 19 of 32
Home Analytics Online
Basic User Guide v1.1
Fig 32b. Map LA At Data Zone
This displays data aggregated to Data Zone level.
Fig 32c. Map LA At Ward
This displays data aggregated to Ward level.
From here, double-clicking the map in area you want will drill-down to the address layer below and display an
address level map for the selected area.
Alternatively, if you want to skip viewing maps at the intermediate (Data Zone etc.) level; and go straight to the
address level map, you can by clicking on the Data Zone or Ward code from the list displayed (Fig 33).
Sept 2014
Page 20 of 32
Home Analytics Online
Basic User Guide v1.1
Fig 33.
Identify the area you want from the
displayed list and click the ID.
This will open the selected area’s map at address level (Fig34):
Fig 34.
Sept 2014
Page 21 of 32
Home Analytics Online
Basic User Guide v1.1
The GIS Dashboard in detail
The GIS Dashboard for your selected area opens and shows the Data Zone/LSOA or Ward boundaries, depending
on which hierarchy was selected (Fig.35).
Navigating the GIS Dashboard
Fig.35 GIS Dashboard components
1
6
5
2
3
7
8
4
1. Selected geographical hierarchy
2. Tools menu
3. Zoom tool
4. Scale bar
5. Filter icon
6. Export data icon
7. Data/ search area
8. Geo Area information
GIS Dashboard components in detail
2. Tools menu
a) Fig 36. Map Contents menu
Check/un-check to turn
on/off map layers.
Sept 2014
Page 22 of 32
Home Analytics Online
Basic User Guide v1.1
b) Fig 37. Tools menu
Fig 37. Create Image icon.
Click to create a saveable image (png or .bmp format). Opens in a new
window or tab. Right-click the image and ‘Save as..’ to save to a location of
your choice. You can then insert into a Word document or add as an
attachment to an email.
Fig 38. Measuring Tool icon.
Click to open the Ruler window
Fig 39.
The Ruler window opens
in Path as default.
Use the drop-down
menu to select the unit
of length.
The Path option from the Ruler window allows you to calculate the distance between any two points.
Place the cursor over your start point. Click once to start then move the cursor to your end point and doubleclick to start the distance calculation. The result displays next to the end point. You can have several
intermediate waypoints. Click once to anchor the waypoint then move the cursor to the next.
Click Start Over to reset.
Sept 2014
Page 23 of 32
Home Analytics Online
Basic User Guide v1.1
The Area option allows you to calculate the size of a selected area.
Fig 40.
Use the drop-down
menus to select the
required units
Select the area you want to calculate by clicking waypoints to outline the area. Double-click at the end point to
calculate the area. The result displays at the centre of the selected area.
Click Start Over to reset.
To move the Ruler window, left-click the grey window bar and drag. Release to anchor the window.
Click X to close.
Fig 41. Legend Box icon.
Click to open the Legend
Fig 42. Legend
Choose which GIS
layer you wish to
view from the
drop-down menu.
Use the slider to
adjust the opacity of
the GIS layer to view
the underlying map.
When viewing aggregated date (Home Analytics displays the underlying dataset of the GIS layer as data
densities, and displays the values by default in equal intervals.
You can use the Interval menu to select between Equal interval or Quantile:
Sept 2014
Page 24 of 32
Home Analytics Online
Basic User Guide v1.1
3. Zoom tool (Fig 44)
Click + to zoom into GIS map;
Click – to zoom out
5. Filter icon (Fig 45)
Opens the Optional Filters page. You can then
apply filters to the underlying dataset.
6. Export data icon Fig 46)
Opens a Home Analytics Scotland – Aggregate
Level Extract window. You can then run an
aggregated report for the geographic area being
viewed.
7. Data/ search area (Fig 47)
This window displays the Geographical IDs, area names (if allocated) and number of dwellings for the
geographical level mapped.
Fig 47a. At Data Zone level:
Fig 47b
Search icon. Click to zoom into selected area on
map (Fig 47b).
8. Geo Area information: hold cursor over Geo
Area to display area ID and number of
dwellings.
Sept 2014
Page 25 of 32
Home Analytics Online
Basic User Guide v1.1
Section 5: Troubleshooting
1. Things to consider
Use the Recommended IE Settings to avoid loss of reporting functionality.
The Recommended Internet Explorer settings link on the Status and Information Area of the Home Analytics
Online window takes you to an EST website page where you can download a reference pdf covering the
recommended Internet Explorer (IE) settings to use to ensure you have full reporting functionality. You can also
find this document reproduced in the Appendix section at the end of this guide.
Failure to use these recommended settings may result in loss of critical functionality and prevent IE
downloading Home Analytics reports to your workstation.
If you find that the IE window goes blank and the report fails to download when attempting to download Home
Analytics reports for the first time, follow the recommendations in the document to change your IE settings.
You may have to re-start your web browser for the changes to take effect.
Excel Issues with reports.
Pre Excel 2007 versions (up to Excel 2003) are limited to a maximum of 65,536 record rows. If you are running a
pre-Excel 2007 version, be aware that opening your EST Home Analytics report may result in loss of data if the
resultant dataset row size is greater than this limit.
A workaround using a macro to open the file and automatically break the data into multiple worksheets can be
found here: http://support.microsoft.com/kb/120596/en-us
Excel 2007 and 2010 versions are limited to 1,048,576 rows.
Email delivery method – attachment size.
If you choose this option, be aware that the size of the resultant report file may exceed any firewall limits for
email attachments set by your organisation’s IT policy and be blocked.
In addition, Microsoft Outlook has a built-in 35MB limit for attachment size (approximately 90K+ rows). If your
file is likely to be larger than this, you will be unable to email it.
Support Email Address
The support email address for all technical issues or further information is: [email protected]
Sept 2014
Page 26 of 32
Home Analytics Online
Basic User Guide v1.1
2. Resetting Your Password
If you forget or lose your password, you can request your password be reset.
Use the Reset Password link under Password Reset on the EST HEED Online 3 web portal page.
This opens the Reset Password Request dialogue box:
Enter your User Name where indicated.
* Indicates a required field.
Click the ‘Submit’ button to submit the password reset request.
Sept 2014
Page 27 of 32
Home Analytics Online
Basic User Guide v1.1
3. Changing Your Password
You may change the password you were issued with if you wish.
Use the Change Password link under Password Reset on the EST HEED Online 3 web portal page.
This opens the Change Password Request dialogue box:
Enter your User Name and Current Password where indicated.
Enter the new password you wish to use in the New Password* text box.
* Indicates a required field.
NB. Passwords must be a minimum of 8 characters with at least 1 number and at least 1 uppercase character
Confirm your new password by re-typing the new password in the Repeat New Password* text box.
Click the ‘Submit’ button to submit the change request.
Sept 2014
Page 28 of 32
Home Analytics Online
Basic User Guide v1.1
Section 6: Additional Information
Further information about EST Home Analytics can be found on EST’s website at the following locations:
EST Home Analytics web pages: http://www.energysavingtrust.org.uk/scotland/Organisations/Businessservices/Home-Analytics-housing-data-and-analysis
Background information (public sector): http://www.energysavingtrust.org.uk/scotland/Publications2/Localauthorities-and-housing-associations/Existing-housing/EST-Home-Analytics-services-for-organisations-in-thepublic-sector
A detailed description of methodology and data variables can be found here:
http://www.energysavingtrust.org.uk/scotland/Publications2/Local-authorities-and-housing-associations/Existinghousing/EST-Home-Analytics-detailed-description-of-data-variables
EST will be regularly updated with new data sets and the reporting functions are subject to on-going
development and improvement. Where possible, the Home Analytics team will endeavour to provide updates
on the availability of new reports and new data at the earliest opportunity.
Full user training is recommended. Contact the Home Analytics team on [email protected]
Sept 2014
Page 29 of 32
Home Analytics Online
Basic User Guide v1.1
Section 7: Appendix
HEED Online – Recommended Internet Explorer settings
This document describes how to implement some recommended settings in Internet Explorer. The
implementation of the recommended settings is necessary due to changes to default settings in recent
versions of Internet Explorer that has resulted in a degraded experience when using HEED Online,
particularly when running reports with an Excel output. The behaviour of Internet Explorer is driven by
Microsoft’s modifications to recent versions of Internet Explorer and/or by internet security policies
implemented by some organizations. Clearly EST has no control over these activities however this
document will provide advice on how to modify settings to ensure that useful functionality is not lost
when using HEED Online.
The issues appear to be much less prevalent in other internet browsers (e.g. Google Chrome).
Therefore a simple resolution could be to use an alternative browser to Internet Explorer. However if it
is not possible to switch to an alternative browser, it is highly recommended that you modify your
Internet Explorer settings as recommended in this document.
NB. Some organizations do not grant individuals the necessary permissions to set their own Internet
Explorer settings. If you experience difficulty in modifying your Internet Explorer settings, it is
recommended that you speak to an IT administrator in your organization before taking any further
action. An IT Administrator should be able to modify the relevant settings on your behalf.
Add HEED Online 3 into your Trusted Sites list
Adding HEED Online to your trusted sites and modifying the settings for this zone is a more secure way
to implement modifications to your IE settings as they will only apply to web sites you trust (e.g. HEED
Online) rather than all web sites you may visit.
NB. You will need to add the new URL for HEED Online 3 even if HEED Online 2 has previously been
added to you trusted sites list
Open an Internet Explorer browser and Click:
1. Tools
2. Internet options
3. Security
4. Trusted Sites
5. “Sites” button - Type “https://homeanalytics.est.org.uk” into the ‘Add this website to the
zone’ box and then click “Add”
See screenshot below
Sept 2014
Page 30 of 32
Home Analytics Online
Basic User Guide v1.1
How to resolve problems when running HEED Online reports with an Excel output
Please follow the instructions below if you experience the following symptoms when running a HEED
Online (Cognos) report to Excel:
• The Cognos Report Viewer window displays a blank page
• The Cognos Report Viewer window closes and returns you to the portal page or folder page.
Change the following settings to allow HEED Online reports to be provided in Excel.
With Trusted Sites selected on the Security Tab (see screenshot above)
• Click Custom Level – find the Settings and change to:
o Use Popup Blocker- Disable
o Automatic prompting for file download – Enable
o File download – Enable
Once these settings have been changed, save and close Internet Explorer. Start a new session and
login to HEED Online. You should be able to run reports to Excel (see below).
To download an Excel or PDF output of a report
Click on the View Options icon (top right of screen once a report has been run) and select the required
option (see below).
Sept 2014
Page 31 of 32
Home Analytics Online
Basic User Guide v1.1
Further guidance on Excel outputs can be found here:
http://www.energysavingtrust.org.uk/Publications2/Housing-professionals/HEEDPDFs/HEED-Online-2-DownloadReports-To-Excel-Format
Disable Popup security warning
The warning message below is likely to popup when running all Heed Online reports:
To disable this message - With Trusted Sites selected on the Security Tab (see screenshot above)
• Click Custom Level – find the Setting below and change to:
o Display mixed content – Enable
NB. Some users may also need to apply this setting in the Internet zone.
Sept 2014
Page 32 of 32