1
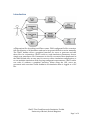
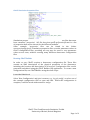
CReST User Guide John Cartlidge & Alex Sheppard University of Bristol Last Modified: September 2012 This document is being periodically updated and is not complete. Documentation on the following is required: Detailed outline of how each module behaves CReST: The Cloud Research Simulation Toolkit University of Bristol, United Kingdom Page 1 of 9 Introduction Fig 1. CReST architecture diagram. As input, CReST requires an XML configuration file describing each data centre. XML configuration files contain a full specification of all hardware and can be large and difficult to write manually. The CReST builder offers a graphical interface for users to generate and edit these files. In conjunction, CReST is able to read simulation parameters from a simple text parameters file. Parameters in this file overwrite those duplicated in the XML file and offer an easy way for users to edit a simulation configuration, or to run multiple simulations with varying configuration parameters. CReST can be run with or without a graphical interface. When using the GUI, users are presented with run-time visual feedback. All simulation data is logged to a CSV file. CReST: The Cloud Research Simulation Toolkit University of Bristol, United Kingdom Page 2 of 9 Running CReST Building Build CReST by running ant build: $ ant -buildfile build-CReST.xml This creates a distribution directory dist/ containing three folders: 1. CReST-app: containing executable CReST jar and start scripts 2. CReST-code: containing a copy of CReST source code 3. Javadocs: containing CReST javadocs documentation Running CReST To run CReST, move to the dist/CReST-app directory and run the example start script: $ ./example-start-crest.sh This script contains the following command: $ java -Xmx1000m -Xdock:name="CReST" -jar CReST.jar -c resources/config/example_1dc_1.xml.gz -p resources/config/prop/example_params_1.properties This command will start an instance of CReST in graphical interactive mode. For non-graphical batch mode, use the command line flag '-nogui' or '-ng'. The required '-c' flag indicates the datacentre configuration file to run and the optional (but recommended) '-p' flag indicates the CReST simulation properties file to run. The CReST GUI will open when the script is run. The configuration file can be changed by using the file > open dialog box. To start CReST, do Run > Run Simulator (or the short-cut F5). This starts the simulation running. To stop the simulation, do Run > Stop Simulator (or the short-cut q). CReST: The Cloud Research Simulation Toolkit University of Bristol, United Kingdom Page 3 of 9 CReST Simulation Properties Files Simulation properties can be input into CReST using simple text files that must have extension '.properties'. See file: docs/user-guide-properties-file.txt for a list of properties that can be altered for the different modules. Some example '.properties' files can be found in the folder: resources/config/prop/. Simulation properties files override parameter values in CReST configuration files, providing an easy way for users to vary parameter values across runs, without creating many different datacentre configuration files. Running CReST Builder In order to run, CReST requires a datacentre configuration file. These files contain an XML description of the physical properties of the datacentre, including the location and description of all servers. Configuration files can be generated and edited using the CReST Builder GUI application. To create a new configuration file, run CReSTBuilder using the shell script: $ startCReSTBuilder.sh Select 'New Configuration' and give it a name, e.g., 'my_dc_config', or select one of the example configuration files to open and edit. When the configuration is complete, it will be saved with extension .xml.gz CReST: The Cloud Research Simulation Toolkit University of Bristol, United Kingdom Page 4 of 9 Module Descriptions Simulation Module If this is off the model does not generate its own events. Events Module The events module drives the simulation, generating events. The event queue for the simulator is implemented as a single, ordered queue. It holds each event in ascending order of start-time, popping each event in turn from the front of the queue. Additional events can be added to the queue, which is sorted each time a new event is added. User Events Module Users can directly input events into CReST via a user events file. This file is read when CReST is started and events added to the event queue. This allows a mechanism for shocking the system with, for example, a large group of server failures. The user events file has the following format: #demo user events file: Failure of aircon and servers #[event_type],[object_type],[time_unit],[start_time],[object_id],[fail_type] failure aircon second 45 12 soft failure aircon second 45 13 soft failure server second 45 2 hard failure server second 45 3 hard failure server minute 1 4 hard To enable user events, it is necessary to switch on the User Events module and point to the appropriate user events file. This file can then be edited (using the framework above) to generate events. Failures Module The servers and air conditioning units with a datacentre can fail in one of two ways: a soft failure and a hard failure. A soft failure only requires a reboot since no hardware has been damaged or needs replacing. Whereas a hard failure requires hardware replacements due to a physical fault. A soft failure could arise from an overheat, so the server shuts down until the temperature reduces, at which point the server can start up again. Each server has a mean soft and hard fail time and a standard deviation, modelled on the Poisson distribution, so that during the simulation servers will randomly fail over time. Once the failed server or aircon unit has been fixed, a fix event is observed by other modules so that they can act upon it and update the datacentre map, for example. CReST: The Cloud Research Simulation Toolkit University of Bristol, United Kingdom Page 5 of 9 Replacements Module Servers or air conditioning units that undergo a hard failure need replacing. This is carried out by the replacements module. Servers can be replaced individually or in blocks, a block being a container of racks and air conditioning units that are replaced in one go, once the proportion of failed hardware within it is too high. When a server replacement takes place, the simulator can replace the server by either a preset list of available servers (as specified in the builder), or using a replacement function. The function determines the server specifications based on time since the start of the simulation so that the servers created should be realistic to current specifications. Subscriptions Module The subscriptions module describes a communications network between individual servers. Servers connect to a subset of other servers that they periodically query to see if they are “alive”. This enables servers to have a view of which other hardware is available to communicate. However, within this framework it is possible for servers to have an “inconsistent” view of other servers, e.g., when Server A believes Server B is “alive” when Server B is, in fact, “dead”, or conversely, when Server A believes Server B is “dead” when Server B is, in fact, “alive”. Inconsistencies occur within the subscriptions network after server hardware “failure” or server hardware “fix” events. Depending on the topology of the communications network, the number of servers with an inconsistent view will vary. Also, different “protocols” will enable these inconsistencies to percolate across the network in different ways. The subscriptions module is designed to test the efficacy of different communications network topologies and communications protocols by plotting the proportion of inconsistent server nodes and the network communications load of each protocol over time. The Subscriptions module pre-defines the following communications protocols and network topologies. Topologies use 3 parameter value inputs: (1) Max_Subscriptions K, (2) Miu, (3) Rewire. Some parameter values are only used by a subset of topologies. Topologies: Random: server nodes are connected at random, with each node randomly connected to exactly K other nodes. Nearest Neighbours: nodes are arranged in a 1D circular array, with each attached to the K nearest neighbours to the left and right. Regular Grid-Lattice: nodes are arranged on a toroidal grid/lattice network structure and then subscribed to their K nearest neighbours. CReST: The Cloud Research Simulation Toolkit University of Bristol, United Kingdom Page 6 of 9 Barabasi-Albert (Scale Free): nodes are connected using an implementation of the Barabasi-Albert algorithm that generates a “Scale Free” network. Refer to: Watts-Strogatz (Small World): nodes are connected using an implementation of the Watts-Strogatz algorithm that generates a “Small World” network. Klem Eguiluz (Scale Free – Small World): nodes are connected using an implementation of the Klem-Eguiluz algorithm that utilises a parameter Miu to generate a “Scale Free” network with “Small World” properties. Refer to: http://arxiv.org/abs/cond-mat/017607 Protocols: Simple peer-to-peer: nodes communicate with each other directly using a peer-to-peer protocol, requesting the status (“alive”/”dead”) of connected nodes. Transitive peer-to-peer: nodes communicate with each other directly using a peer-to-peer protocol in a similar fashion to the simple peer-topeer protocol. However, nodes also pass information about the status of other nodes that are mutually connected. This protocol generates fewer status requests than simple p2p, but has the side effect that “stale” information may percolate across the network (if node A receives information from node B about the status of node C that is “out of date”). Centralised: a central node periodically requests status information from all other nodes in the network. Individual nodes then query the central node for status information of other nodes, rather than querying those nodes directly. When activated, the subscriptions module generates a communications network across a data centre, with each node corresponding to an individual server. [Note: This should ideally be extended to be across individual VMs running on the servers] The SubscriptionsModuleEventThread generates subscription update events that cause nodes to query the status of other nodes. When a server fail or fix event is popped from the event queue, the SubscriptionsModuleRunner observes the fail/fix event and updates the status of the corresponding network node to “dead”/”alive”. The proportion of inconsistent nodes are plotted on the inconsistencies time series graph of the GUI and also logged to the subscriptions log. Other event types observed by the SubscriptionsModuleRunner are ignored. Thermal Module The temperature module simulates heat generation, propagation and extraction within the datacentre. Servers produce heat which then distributes across the datacentre, with air conditioning units extracting heat from the building. Temperature extraction is non-linear and dependent on the temperature local to each air conditioning unit. Each server has a failure temperature, the temperature at which it will shut down due to an overheat. CReST: The Cloud Research Simulation Toolkit University of Bristol, United Kingdom Page 7 of 9 Services Module Demand on the datacentre. Start and stop. Broker Module Brokerage agents reserving instances and reselling to demand. CReST: The Cloud Research Simulation Toolkit University of Bristol, United Kingdom Page 8 of 9 Logs Each module logs the events that it observes for each datacentre to CSV format so that they can be analysed in the post run application or in another application by importing the CSV data. As an example, a Thermal Log Event occurs every second, to match how often a thermal update occurs. The simulation time, average datacentre temperature, percentage of servers working and percentage server utilisation are logged. The following list is what each module logs: Broker Module Time Contracts Executed Scheduled Units On-demand Cash Failure Module Simulation Time Servers Working (%) Service Module Simulation Time Services (Running) Services (Failed) Services (Queued) Services (Completed) Services (Total) Server Utilisation (%) Servers Working (%) Subscription Module Simulation Time Servers Working (%) Inconsistency (%) Network Load (Hops) Thermal Module Simulation Time Temperature Servers Working (%) Server Utilisation (%) CReST: The Cloud Research Simulation Toolkit University of Bristol, United Kingdom Page 9 of 9