1
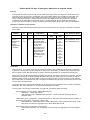
and the level (e.g. national / regional with large numbers of events, local with small numbers of events) at which
the data are to be used.
Confidence Intervals - Some of the values and factors influencing the indicator may be chance occurrences, with
values fluctuating at random between organisations and from year to year. Numbers of admissions may be small
at Primary Care Organisation, Local Authority and provider Trust level. The results should therefore be interpreted
with caution and with the aid of confidence intervals. The 95% confidence interval provides a measure of the
statistical precision of the rate for an area or institution. It indicates a range which, with 95% confidence, will
contain the underlying value of the indicator. If the confidence interval for an area’s rate does not contain the
overall national rate, the difference between the two rates is considered statistically significant. If the confidence
interval overlaps the national rate, in most cases the difference between the rates would not be considered
statistically significant. 95% and 99.8% confidence intervals have been calculated.
Effect of case-mix/severity - A number of factors outside the control of hospitals, such as the socio-economic mix
of local populations and events prior to hospitalisation, may contribute to the variation shown by the indicators.
Differences in case-mix, severity of the stroke, comorbidities and other potential risk factors also contribute to the
variation. Current data do not allow assignment of severity of illness across continuous inpatient spells, nor do they
allow adjustment for any of these factors. This may pose less of a constraint at geographical organisational level
than at hospital level. We have tried to deal with this constraint by presenting the data in clusters that are similar
with respect to institution or organisation type. Gender-specific data standardised to person rates as well as
analyses at England level by the Index of Multiple Deprivation are presented.
Other potential confounding factors - A continuous inpatient spell may include transfers to other hospitals for
rehabilitation. The patterns of providing care may vary between NHS hospital Trusts in terms of whether patients
are transferred elsewhere for rehabilitation and convalescence before final discharge. Planned transfers, for
example for rehabilitation, may extend length of stay and affect discharge destination figures.
Levels of primary, social and community care and family support may have implications for the ability of a hospital
to discharge patients. The indicator may help to highlight such constraints and thereby reduce unnecessarily
prolonged hospital stay. Some patients may not be ready for discharge within 8 weeks, needing further
rehabilitation. The data in the indicator could be supplemented, at local level, with data on levels of function,
disability, handicap etc.
Potential value of indicator:
To stimulate discussion and encourage local investigation, and to lead to improvement in data quality and quality
of care.
Potential for follow-up action leading to change:
Studies to assess the reasons for any observed local prolonged stay are recommended.
Relevant national initiatives:
This indicator was part of the NHS Performance Indicators published by the Department of Health up to 2002. The
National Service Framework for Older People contains standards and guidelines for the prevention and treatment
of strokes. A new Stroke Strategy for England was published by the Department of Health in December 2007.
Further reading:
1.
2.
CRAG Clinical Outcomes Working Group. Clinical Outcome Indicators. Edinburgh: The Scottish Office, 1994.
Rudd A, Goldacre M, Amess M, Fletcher J, Wilkinson E, Mason A, Fairfield G, Eastwood A, Cleary R, Cole J
(eds). Health Outcome Indicators: Stroke. Report of a working group to the Department of Health. Oxford:
National Centre for Health Outcomes Development, 1999 (www.nchod.nhs.uk ).
3. Department of Health. National service framework for older people. London: Department of Health, 2001.
4. Department of Health. NHS Performance Indicators: 2002. London: Department of Health, 2002.
5. Lakhani A, Coles J, Eayres D, Spence C, Rachet B. Creative use of existing clinical and health outcomes data
to assess NHS performance in England: Part 1—performance indicators closely linked to clinical care. BMJ
2005;330: 1426-31.
Department of Health. National Stroke Strategy. London: Department for Health, 2007.
Updated: November 2010
429