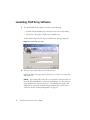
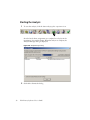
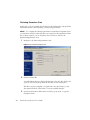
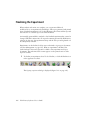
1
FCAP Array
Software
User’s Guide
Windows Version
FCAP Array™ Software
is manufactured by
Soft Flow Hungary Ltd.
for BD Biosciences
Part No. 641489 Rev. A
June 2006
BD Biosciences
2350 Qume Drive
San Jose, CA 95131-1807
USA
Tel (877) 232-8995
Fax (408) 954-2347
Asia Pacific
Tel (65) 6-861-0633
Fax (65) 6-860-1590
Brazil
Tel (55) 11-5185-9995
Fax (55) 11-5185-9895
Canada
Tel (888) 259-0187
(905) 542-8028
Fax (905) 542-9391
[email protected]
Europe
Tel (32) 53-720211
Fax (32) 53-720452
Japan
Nippon Becton Dickinson Company, Ltd.
Tel 0120-8555-90
Mexico
Tel (52) 55 5999 8296
Fax (52) 55 5999 8288
© 2006, Becton, Dickinson and Company. All rights reserved. No part of this publication may be reproduced,
transmitted, transcribed, stored in retrieval systems, or translated into any language or computer language, in any
form or by any means: electronic, mechanical, magnetic, optical, chemical, manual, or otherwise, without prior
written permission from BD Biosciences.
The information in this guide is subject to change without notice. BD Biosciences reserves the right to change its
products and services at any time to incorporate the latest technological developments. Although this guide has been
prepared with every precaution to ensure accuracy, BD Biosciences assumes no liability for any errors or omissions,
nor for any damages resulting from the application or use of this information. BD Biosciences welcomes customer
input on corrections and suggestions for improvement.
Each sale of a stored unit of this software grants the purchaser a nontransferable, nonexclusive, personal license. This
software may not be duplicated, reproduced, or copied in any form or by any means whatsoever, except as otherwise
permitted by law.
BD, the BD logo, BD FACS, BD FACSDiva, and BD FACSArray are trademarks of Becton, Dickinson and Company.
FCAP Array is a trademark of Soft Flow Hungary Ltd.
Adobe and Acrobat are registered trademarks of Adobe Systems Incorporated.
Microsoft and Windows are registered trademarks of Microsoft Corporation.
Pentium is a registered trademark of Intel Corporation.
All other company and product names might be trademarks of the respective companies with which they are
associated.
Notice to Customers
BD Biosciences delivers software and workstations that are intended for running the instruments supplied by
BD Biosciences. It is the responsibility of the buyer/user to ensure that all added electronic files including software
and transport media are virus free. If the workstation is used for Internet access or purposes other than those specified
by BD Biosciences, it is the buyer/user’s responsibility to install and maintain up-to-date virus protection software.
BD Biosciences does not make any warranty with respect to the workstation remaining virus free after installation.
BD Biosciences is not liable for any claims related to or resulting from buyer/user's failure to install and maintain
virus protection.
History
Revision
Date
Change Made
338995 Rev. A
01/2005
Initial release
641489 Rev. A
06/2006
Update for software v1.0.1
Contents
Preface
ix
Text Conventions . . . . . . . . . . . . . . . . . . . . . . . . . . . . . . . . . . . . . . . . . . . . .
x
Basic Terms . . . . . . . . . . . . . . . . . . . . . . . . . . . . . . . . . . . . . . . . . . . . . . . . .
xi
Technical Assistance . . . . . . . . . . . . . . . . . . . . . . . . . . . . . . . . . . . . . . . . . . .
xii
Soft Flow Contact Information . . . . . . . . . . . . . . . . . . . . . . . . . . . . . . . . . . .
xii
Limitations . . . . . . . . . . . . . . . . . . . . . . . . . . . . . . . . . . . . . . . . . . . . . . . . . .
xiii
Chapter 1: Overview
15
Bead Assay Overview . . . . . . . . . . . . . . . . . . . . . . . . . . . . . . . . . . . . . . . . . .
16
Quantitative Analysis . . . . . . . . . . . . . . . . . . . . . . . . . . . . . . . . . . . . . . . . . .
17
Qualitative Analysis . . . . . . . . . . . . . . . . . . . . . . . . . . . . . . . . . . . . . . . . . . .
17
FCAP Array Software Workflows . . . . . . . . . . . . . . . . . . . . . . . . . . . . . . . . .
18
Data First Workflow . . . . . . . . . . . . . . . . . . . . . . . . . . . . . . . . . . . . . . .
19
BD FACSArray Bioanalyzer Workflow . . . . . . . . . . . . . . . . . . . . . . . . .
20
Chapter 2: System Requirements and Installation
21
System Requirements . . . . . . . . . . . . . . . . . . . . . . . . . . . . . . . . . . . . . . . . . .
22
Installing FCAP Array Software . . . . . . . . . . . . . . . . . . . . . . . . . . . . . . . . . .
23
Reinstalling or Installing an Updated Version of FCAP Array Software . . . .
24
iii
Chapter 3: FCAP Array Software Startup
Launching FCAP Array Software . . . . . . . . . . . . . . . . . . . . . . . . . . . . . . . . .
26
Quick Start Dialog . . . . . . . . . . . . . . . . . . . . . . . . . . . . . . . . . . . . . . . . . . . .
27
Experiment Window . . . . . . . . . . . . . . . . . . . . . . . . . . . . . . . . . . . . . . . . . . .
29
Chapter 4: Getting Started Tutorial
iv
25
31
Launching FCAP Array Software . . . . . . . . . . . . . . . . . . . . . . . . . . . . . . . . .
32
Designing an Experiment
with the Experiment Wizard . . . . . . . . . . . . . . . . . . . . . . . . . . . . . . . . . . . . .
33
Entering Test Samples and Dilutions . . . . . . . . . . . . . . . . . . . . . . . . . . . .
34
Creating a New Plex . . . . . . . . . . . . . . . . . . . . . . . . . . . . . . . . . . . . . . . .
37
Bead Library . . . . . . . . . . . . . . . . . . . . . . . . . . . . . . . . . . . . . . . . . . . . . .
39
Choosing Plex Components . . . . . . . . . . . . . . . . . . . . . . . . . . . . . . . . . .
43
Assigning Beads to Clusters . . . . . . . . . . . . . . . . . . . . . . . . . . . . . . . . . .
43
Specifying Standards . . . . . . . . . . . . . . . . . . . . . . . . . . . . . . . . . . . . . . . .
47
Controls and Reporting Messages . . . . . . . . . . . . . . . . . . . . . . . . . . . . . .
50
Plate Layout Options . . . . . . . . . . . . . . . . . . . . . . . . . . . . . . . . . . . . . . .
51
Ending the Experiment Wizard Session . . . . . . . . . . . . . . . . . . . . . . . . . .
52
Bead Assay Data Analysis . . . . . . . . . . . . . . . . . . . . . . . . . . . . . . . . . . . . . . .
54
Opening a Saved Experiment . . . . . . . . . . . . . . . . . . . . . . . . . . . . . . . . .
54
File Assignment . . . . . . . . . . . . . . . . . . . . . . . . . . . . . . . . . . . . . . . . . . . .
55
Starting the Analysis . . . . . . . . . . . . . . . . . . . . . . . . . . . . . . . . . . . . . . . .
58
Saving the Analysis Data . . . . . . . . . . . . . . . . . . . . . . . . . . . . . . . . . . . . .
59
Printing a Report . . . . . . . . . . . . . . . . . . . . . . . . . . . . . . . . . . . . . . . . . .
59
Inspecting the Standard Curves . . . . . . . . . . . . . . . . . . . . . . . . . . . . . . . .
61
Reviewing the Raw Data . . . . . . . . . . . . . . . . . . . . . . . . . . . . . . . . . . . .
64
Finalizing the Experiment . . . . . . . . . . . . . . . . . . . . . . . . . . . . . . . . . . . .
67
FCAP Array Software User’s Guide
Chapter 5: FCAP Array Experiment Design
69
Introduction . . . . . . . . . . . . . . . . . . . . . . . . . . . . . . . . . . . . . . . . . . . . . . . . .
70
Experiments . . . . . . . . . . . . . . . . . . . . . . . . . . . . . . . . . . . . . . . . . . . . . .
70
Plexes and Beads . . . . . . . . . . . . . . . . . . . . . . . . . . . . . . . . . . . . . . . . . .
70
Creating an Experiment
with the Experiment Wizard . . . . . . . . . . . . . . . . . . . . . . . . . . . . . . . . . . . . .
71
Navigating Experiment Wizard Views . . . . . . . . . . . . . . . . . . . . . . . . . .
72
Test Samples View . . . . . . . . . . . . . . . . . . . . . . . . . . . . . . . . . . . . . . . . .
74
Dilution and Replicates View . . . . . . . . . . . . . . . . . . . . . . . . . . . . . . . . .
75
Selecting Saved Plex View . . . . . . . . . . . . . . . . . . . . . . . . . . . . . . . . . . .
77
Plate Layout Options View . . . . . . . . . . . . . . . . . . . . . . . . . . . . . . . . . .
93
Experiment Name . . . . . . . . . . . . . . . . . . . . . . . . . . . . . . . . . . . . . . . . .
95
Continuing Your Experiment . . . . . . . . . . . . . . . . . . . . . . . . . . . . . . . . .
97
Creating or Modifying an Experiment
with the Experiment Window . . . . . . . . . . . . . . . . . . . . . . . . . . . . . . . . . . . .
98
Creating an Experiment . . . . . . . . . . . . . . . . . . . . . . . . . . . . . . . . . . . . .
100
Saving an Experiment . . . . . . . . . . . . . . . . . . . . . . . . . . . . . . . . . . . . . . .
100
Opening a Saved Experiment . . . . . . . . . . . . . . . . . . . . . . . . . . . . . . . . .
100
Copying an Experiment . . . . . . . . . . . . . . . . . . . . . . . . . . . . . . . . . . . . .
101
General Information View . . . . . . . . . . . . . . . . . . . . . . . . . . . . . . . . . . .
102
Experiment View . . . . . . . . . . . . . . . . . . . . . . . . . . . . . . . . . . . . . . . . . .
103
Samples View . . . . . . . . . . . . . . . . . . . . . . . . . . . . . . . . . . . . . . . . . . . . .
112
Plate View . . . . . . . . . . . . . . . . . . . . . . . . . . . . . . . . . . . . . . . . . . . . . . .
113
File Assignment View . . . . . . . . . . . . . . . . . . . . . . . . . . . . . . . . . . . . . . .
114
Contents
v
Chapter 6: Using FCAP Array Software with the BD FACSArray Bioanalyzer
115
Performing Instrument Setup . . . . . . . . . . . . . . . . . . . . . . . . . . . . . . . . . . . . .
116
Transferring the BD CBA Flex Set Template . . . . . . . . . . . . . . . . . . . . . . . . .
117
Creating an FCAP Array Software Experiment . . . . . . . . . . . . . . . . . . . . . . .
118
Specifying the Plate Layout . . . . . . . . . . . . . . . . . . . . . . . . . . . . . . . . . . . . . .
118
Generating and Exporting the XML Experiment File . . . . . . . . . . . . . . . . . .
119
Preparing Samples . . . . . . . . . . . . . . . . . . . . . . . . . . . . . . . . . . . . . . . . . . . . .
124
Acquiring Data and Creating FCS 2.0 Data Files . . . . . . . . . . . . . . . . . . . . .
124
Analyzing the FCS 2.0 Data Files . . . . . . . . . . . . . . . . . . . . . . . . . . . . . . . . .
125
Chapter 7: Data Analysis
vi
127
File Assignment View . . . . . . . . . . . . . . . . . . . . . . . . . . . . . . . . . . . . . . . . . .
128
Analysis . . . . . . . . . . . . . . . . . . . . . . . . . . . . . . . . . . . . . . . . . . . . . . . . . . . . .
130
Bead-Cluster Assignment . . . . . . . . . . . . . . . . . . . . . . . . . . . . . . . . . . . .
131
Analysis Messages Dialog . . . . . . . . . . . . . . . . . . . . . . . . . . . . . . . . . . . .
132
After an Analysis . . . . . . . . . . . . . . . . . . . . . . . . . . . . . . . . . . . . . . . . . .
134
Report Printout View . . . . . . . . . . . . . . . . . . . . . . . . . . . . . . . . . . . . . . . . . .
134
Printing a Report . . . . . . . . . . . . . . . . . . . . . . . . . . . . . . . . . . . . . . . . . .
136
Editing Report Templates . . . . . . . . . . . . . . . . . . . . . . . . . . . . . . . . . . . .
136
Standard Curves View . . . . . . . . . . . . . . . . . . . . . . . . . . . . . . . . . . . . . . . . . .
138
Printing Standard Curves . . . . . . . . . . . . . . . . . . . . . . . . . . . . . . . . . . . .
139
Modifying a Curve Fitting Model . . . . . . . . . . . . . . . . . . . . . . . . . . . . . .
139
Raw Data View . . . . . . . . . . . . . . . . . . . . . . . . . . . . . . . . . . . . . . . . . . . . . . .
141
Displaying Raw Data . . . . . . . . . . . . . . . . . . . . . . . . . . . . . . . . . . . . . . .
141
Printing Raw Data . . . . . . . . . . . . . . . . . . . . . . . . . . . . . . . . . . . . . . . . .
142
Exporting Raw Data . . . . . . . . . . . . . . . . . . . . . . . . . . . . . . . . . . . . . . . .
143
Displaying Histograms, Dot Plots, and Statistics . . . . . . . . . . . . . . . . . . .
144
Finalizing the Experiment . . . . . . . . . . . . . . . . . . . . . . . . . . . . . . . . . . . . . . .
146
FCAP Array Software User’s Guide
Chapter 8: FCAP Array Software Management
149
Maintaining the Bead Library . . . . . . . . . . . . . . . . . . . . . . . . . . . . . . . . . . . .
150
Adding Beads . . . . . . . . . . . . . . . . . . . . . . . . . . . . . . . . . . . . . . . . . . . . .
151
Deleting Beads . . . . . . . . . . . . . . . . . . . . . . . . . . . . . . . . . . . . . . . . . . . .
152
Bead Groups . . . . . . . . . . . . . . . . . . . . . . . . . . . . . . . . . . . . . . . . . . . . .
152
Maintaining the Plex Library . . . . . . . . . . . . . . . . . . . . . . . . . . . . . . . . . . . .
156
Creating a Plex Group . . . . . . . . . . . . . . . . . . . . . . . . . . . . . . . . . . . . . .
158
Exporting Plex Documents . . . . . . . . . . . . . . . . . . . . . . . . . . . . . . . . . . .
159
Preferences . . . . . . . . . . . . . . . . . . . . . . . . . . . . . . . . . . . . . . . . . . . . . . . . . .
160
Precision . . . . . . . . . . . . . . . . . . . . . . . . . . . . . . . . . . . . . . . . . . . . . . . . .
160
Printing . . . . . . . . . . . . . . . . . . . . . . . . . . . . . . . . . . . . . . . . . . . . . . . . .
160
Fitting Accuracy . . . . . . . . . . . . . . . . . . . . . . . . . . . . . . . . . . . . . . . . . . .
162
Default Replicate Number . . . . . . . . . . . . . . . . . . . . . . . . . . . . . . . . . . .
163
Additional Preferences . . . . . . . . . . . . . . . . . . . . . . . . . . . . . . . . . . . . . .
164
User Management . . . . . . . . . . . . . . . . . . . . . . . . . . . . . . . . . . . . . . . . . . . . .
165
Adding a New User . . . . . . . . . . . . . . . . . . . . . . . . . . . . . . . . . . . . . . . .
166
Setting a Default Password . . . . . . . . . . . . . . . . . . . . . . . . . . . . . . . . . . .
167
Removing a User . . . . . . . . . . . . . . . . . . . . . . . . . . . . . . . . . . . . . . . . . .
168
Modifying a User . . . . . . . . . . . . . . . . . . . . . . . . . . . . . . . . . . . . . . . . . .
168
Clustering Test Tool . . . . . . . . . . . . . . . . . . . . . . . . . . . . . . . . . . . . . . . . . . .
169
Viewing the Daily Logs . . . . . . . . . . . . . . . . . . . . . . . . . . . . . . . . . . . . . . . . .
171
Chapter 9: Troubleshooting
173
Troubleshooting . . . . . . . . . . . . . . . . . . . . . . . . . . . . . . . . . . . . . . . . . . . . . .
174
Contents
vii
Appendix A: Glossary
179
Appendix B: User Interface Reference
183
Application Menus . . . . . . . . . . . . . . . . . . . . . . . . . . . . . . . . . . . . . . . . . . . .
184
File Menu . . . . . . . . . . . . . . . . . . . . . . . . . . . . . . . . . . . . . . . . . . . . . . . .
184
Experiment Menu . . . . . . . . . . . . . . . . . . . . . . . . . . . . . . . . . . . . . . . . . .
186
Plex Menu . . . . . . . . . . . . . . . . . . . . . . . . . . . . . . . . . . . . . . . . . . . . . . .
187
Tools Menu . . . . . . . . . . . . . . . . . . . . . . . . . . . . . . . . . . . . . . . . . . . . . .
188
Help Menu . . . . . . . . . . . . . . . . . . . . . . . . . . . . . . . . . . . . . . . . . . . . . . .
189
Application Toolbar . . . . . . . . . . . . . . . . . . . . . . . . . . . . . . . . . . . . . . . . . . .
190
Workspace Views . . . . . . . . . . . . . . . . . . . . . . . . . . . . . . . . . . . . . . . . . . . . .
192
Appendix C: Analysis Parameters
193
Appendix D: Analysis Messages
195
Index
197
viii
FCAP Array Software User’s Guide
Preface
The FCAP Array Software User’s Guide describes how to install and operate
Flow Cytometric Analysis Program (FCAP) Array software. The software
facilitates experiment design and data analysis for multiplex bead assays.
This guide assumes you have a working knowledge of the basic Microsoft®
Windows® operating system. If you are not familiar with the operating system of
your computer, refer to the documentation provided with your system.
Before using FCAP Array™ software, review the ReadMe file by double-clicking
the FCAP Array ReadMe icon added to the desktop at installation. The ReadMe
file contains important information not covered in this user’s guide.
ix
Text Conventions
The following table lists text and keyboard conventions used throughout this
guide.
Table 1 Text and keyboard conventions
Convention
Use
NOTICE
Indicates key information about the software.
; Tip
x
Highlights features or hints that can save time and prevent
difficulties.
Italics
Italics are used to highlight book titles and new or unfamiliar
terms on their first appearance in the text. Italics are also used
to clarify some GUI elements.
>
The arrow indicates a menu choice. For example:
“Select File > Print” means to select Print from the File menu.
Ctrl-X
When used with key names, a dash means to press two keys
simultaneously. For example, Ctrl-P means to hold down the
Control key while pressing the P key.
FCAP Array Software User’s Guide
Basic Terms
The following terms are used throughout this manual to indicate specific
constructs, procedures, or concepts. For additional term definitions, see Glossary
on page 179.
Term
Description
bead
An analyte-specific capture particle with distinctive, discrete
fluorescence characteristics (ie, all instances of a bead bind the
same analyte and have the same fluorescence characteristics).
Also, an FCAP Array software construct that specifies the analyte
binding and fluorescence characteristics of a bead.
bead assay
A method of using beads and reporter antibodies to detect or
measure the concentration of analytes in a sample.
cluster
A population of events in a bead assay data file. Each cluster
corresponds to a bead, therefore, the events in a cluster have a
distinctive, discrete fluorescence characteristic.
experiment
A bead assay.
Also, formalizations or file representations of a bead assay,
including an FCAP Array software construct that defines the
plex(es), standards, controls, and test samples for a bead assay.
plex
One or more beads used in a bead assay.
Also, an FCAP Array software construct that specifies a plex, a
standards set, and a bead-cluster assignment.
replicate(s)
One or more copies of a sample. When more than one replicate of
a sample is used, the replicate results are averaged to determine the
result reported for the sample.
sample
A solution containing analytes to be measured by a bead assay. A
sample can be a test, a standard, or a control.
Preface
xi
Technical Assistance
For technical questions or assistance in solving a problem:
•
Read sections of the documentation specific to the operation you are
performing.
•
See Chapter 9: Troubleshooting.
If additional assistance is required, contact your local BD Biosciences technical
support representative or supplier.
When contacting BD Biosciences, have the following information available:
•
version of FCAP Array software you are using
•
name and version of acquisition software you are using
•
any error messages
•
details of recent system performance
For FCAP Array software support from within the US, call (877) 232-8995.
For support from within Canada, call (888) 259-0187.
Customers outside the US and Canada, contact your local BD representative or
distributor.
Soft Flow Contact Information
Soft Flow Hungary Ltd.
H-7628 Pecs, Kedves 20, Hungary
Additional technical information about FCAP Array software can be found at the
Soft Flow website: www.softflow.com.
xii
FCAP Array Software User’s Guide
Limitations
For Research Use Only. Not for use in diagnostic or therapeutic procedures.
FCAP Array software has been written and manufactured by Soft Flow, Inc.
Software is covered by a one-year policy under which revisions released during
the twelve-month period from original installation will be provided at no charge.
Software is provided as-is and is not warranted to be defect-free. The foregoing is
exclusive and in lieu of all other warranties either expressed or implied, including
warranty of merchantability, fitness for particular purpose, and noninfringement. Purchaser agrees that BD Biosciences is not liable under the
software warranty or otherwise relating to the software for indirect,
consequential, or business damages that can be suffered.
Customers with FCAP Array software questions or problems should contact BD
Biosciences (see Technical Assistance on page xii).
Preface
xiii
xiv
FCAP Array Software User’s Guide
1
Overview
This chapter presents an overview of bead assays and outlines typical workflows
with FCAP Array software. The workflow outlines include references to
documentation (including sections of this user’s guide) where task instructions
can be found.
15
Bead Assay Overview
FCAP Array software facilitates the design and data analysis of bead assays.
These assays can detect presence of, or determine concentrations for, multiple
analytes (example: proteins and peptides) in a sample.
In a bead assay, one or more bead populations (beads) with discrete and distinct
fluorescence intensities are used to simultaneously detect multiple analytes in a
small sample volume. The beads capture and quantify soluble analytes through a
sandwich schema.
Figure 1-1 Bead assay sandwich schema
bead
analyte
reporter
antibody
capture
antibody
A particular analyte in the sample binds to a corresponding bead with a given
fluorescence characteristic. The bead is coated with capture antibodies specific
for that analyte. A reporter antibody (different from the capture antibody) binds
to the analyte. The reporter antibody is conjugated with fluorescent molecules
(different color from those used to distinguish beads). Unbound (excess) reporter
antibodies and analytes are eliminated by washing.
Samples are acquired with a flow cytometer and acquisition software capable of
saving data in a Flow Cytometry Standard (FCS) 2.0 file format. FCAP Array
software analyzes the FCS 2.0 files. Bead populations are found by clustering,
and assigning beads to clusters. Reporter antibody florescence within a
population measures analyte-specific binding.
NOTICE
16
FCAP Array software cannot read or analyze FCS 3.0 files.
FCAP Array Software User’s Guide
Quantitative Analysis
Quantitative analysis determines analyte concentrations based on known
concentration values of a set of standards. FCAP Array software can determine
analyte concentration for many analytes (beads) per sample. The number of
concentration levels used to calibrate the standard curve and the number of
sample and standard replicates are easily adjusted.
FCAP Array software reads the FCS 2.0 data files from an experiment, locates
clusters (to which analytes have been assigned), and then determines the median
fluorescence intensity (MFI) of the detector antibody for each analyte. The
software fits a standard curve to the data from the concentration standards. The
curve used to fit the data is selected from several mathematical models. The
standard curve is used to calculate concentration values for each of the measured
analytes in each sample.
Qualitative Analysis
Qualitative analysis determines whether a specific type of analyte exists in a
sample. FCAP Array software can determine analyte existence for many analytes
(beads) per sample. Controls can be positive, negative, or both.
FCAP Array software reads the FCS 2.0 data files from an experiment, locates
clusters (to which analytes have been assigned), and then determines the median
fluorescence intensity (MFI) of the detector antibody for each analyte. The
control data is used to determine MFI cutoff values for each analyte. Test sample
results are based on the cutoff values. For more information on how qualitative
assay cutoff values are determined, refer to your reagent product insert.
Chapter 1: Overview
17
FCAP Array Software Workflows
There are two typical workflows for the design and analysis of bead assays with
FCAP Array software:
•
The data first workflow is used when you have already acquired the sample
data, and you need to create an FCAP Array software experiment that can
analyze your FCS 2.0 data files. See Data First Workflow on page 19 for an
outline of the workflow, and instruction references.
The Getting Started Tutorial on page 31 presents step-by-step instructions
for a bead assay based on the data first workflow, and uses FCS data files
included with FCAP Array software.
•
The BD FACSArray bioanalyzer workflow (a design first workflow) can be
used when integrating FCAP Array software with BD FACSArray™
software and the BD FACSArray bioanalyzer to coordinate bead assay
instrument setup, data acquisition, and data analysis. See BD FACSArray
Bioanalyzer Workflow on page 20 for an outline of the workflow, and
instruction references.
Chapter 6, Using FCAP Array Software with the BD FACSArray
Bioanalyzer, provides details for those BD FACSArray bioanalyzer
workflow tasks that are performed within or are directly related to
FCAP Array software.
BD FACSArray Bioanalyzer: BD CBA Flex Sets: Instrument Setup, Data
Acquisition, and Analysis Instruction Manual (BD CBA Flex Set setup
manual for BD FACSArray) contains instructions for performing
instrument setup on the BD FACSArray bioanalyzer for BD CBA Flex Sets.
FCAP Array Software for BD FACSArray Bioanalyzer, a tutorial based on
the BD FACSArray bioanalyzer workflow, is available at
bdbiosciences.com/training. Follow the link to Online Training.
The Getting Started Tutorial on page 31, although based on the data first
workflow, includes key tasks used with the BD FACSArray bioanalyzer
workflow, as well.
18
FCAP Array Software User’s Guide
Data First Workflow
Use the data first workflow when you have already acquired the sample data, and
you need to create an FCAP Array software experiment that can analyze your
FCS 2.0 data files.
Activity
Instruction Reference
If needed, prepare the samples, acquire the
data, create FCS 2.0 list-mode data files.
Refer to your instrument system
documentation.
If needed, transfer the FCS 2.0 data files to
the computer with FCAP Array software.
Refer to your computer system
documentation.
Create an FCAP Array software
experiment reflecting the existing data
files. Complete the plex cluster
assignment.
Creating an Experiment with the
Experiment Wizard on page 71
Choose a sample layout that best matches
the order of the data files.
Plate Layout Options View on page 93
Assign data files to experiment samples.
File Assignment View on page 128
Analyze the data, review the results, and
finalize the experiment.
Analysis on page 130
Plate View on page 113
Report Printout View on page 134
Finalizing the Experiment on page 146
Chapter 1: Overview
19
BD FACSArray Bioanalyzer Workflow
In the BD FACSArray bioanalyzer workflow, the FCAP Array and BD
FACSArray softwares are integrated to encompass the complete bead assay
procedure, from instrument setup to analysis report.
Activity
Instruction Reference
Perform instrument setup for
BD CBA™ Flex Set on the
BD FACSArray bioanalyzer.
BD CBA Flex Set setup manual for
BD FACSArray
Transfer the setup template file to
FCAP Array software.
Transferring the BD CBA Flex Set Template on
page 117
Create an FCAP Array software
experiment.
Creating an Experiment with the Experiment
Wizard on page 71
Specify the plate layout to be used
with the BD FACSArray bioanalyzer.
Plate Layout Options View on page 93
Export the XML experiment file to
BD FACSArray software.
Generating and Exporting the XML
Experiment File on page 119
Prepare the samples, acquire the data,
and create FCS 2.0 data files.
BD CBA master buffer kit manual
Plate View on page 113
BD FACSArray System User’s Guide
BD CBA Flex Set setup manual for
BD FACSArray
Acquiring Data and Creating FCS 2.0 Data
Files on page 124
If needed, transfer the FCS 2.0 data
files to the computer with
FCAP Array software.
Refer to your computer system documentation.
Assign data files to experiment
samples.
File Assignment View on page 128
Analyze the data, review the results,
and finalize the experiment.
Analysis on page 130
Report Printout View on page 134
Finalizing the Experiment on page 146
20
FCAP Array Software User’s Guide
2
System Requirements
and Installation
This chapter specifies system requirements and provides instructions for
installing FCAP Array software.
21
System Requirements
Minimum Configuration
FCAP Array software requires a PC workstation equipped with the following
minimum configuration:
•
Pentium-compatible processor (Pentium® III 600 Mhz or better
recommended)
•
32 MB of RAM (128 MB recommended)
•
16 MB of available hard-drive space
•
CD ROM drive for the installation
•
256-color display (true color recommended)
•
USB port for the hardware key
Validation
FCAP Array software has been validated for use on computers running English
(United States) Regional Options with these operating systems:
•
Microsoft Windows 2000 Professional
•
Microsoft Windows XP Professional
Compatibility with computers and operating systems using other Regional
Options has not been tested.
22
FCAP Array Software User’s Guide
Installing FCAP Array Software
NOTICE
Do not install the FCAP Array Hardware Key until after step 7 below.
To install FCAP Array software:
1 Ensure that no other programs are running.
2 Insert the FCAP Array software Installation CD into the CD-ROM drive.
If the installer does not start up automatically, use Windows Explorer to
view the CD contents, and double-click the Setup.exe icon.
3 Click Next on the Installer Welcome screen.
4 Read the licensing information.
Click Yes to accept the agreement and continue installation.
5 Note the destination folder for FCAP Array software. We recommend that
you accept the default location.
6 Review and follow the remaining installation instructions.
Click Next until you reach the summary view of the installation options. To
alter installation options, click Back until you reach the appropriate screen,
change the option, and then click Next until you reach the summary screen
again.
NOTICE You can skip past the installer view that allows you to register the
software. You do not need to register FCAP Array software.
7 Click Finish to exit the Installer.
8 Install the FCAP Array Hardware Key in a USB port.
Chapter 2: System Requirements and Installation
23
Reinstalling or Installing an Updated Version of
FCAP Array Software
Before reinstalling or installing an updated version of FCAP Array software,
uninstall the existing version:
1 Select Start > Settings > Control Panel.
2 From the Control Panel folder, open Add or Remove Programs.
3 In the Add or Remove Programs list, click the FCAP Array item and then
click Remove.
After the uninstall finishes, follow Installing FCAP Array Software on page 23.
24
FCAP Array Software User’s Guide
3
FCAP Array Software Startup
This chapter provides instructions for launching FCAP Array software, including
using the Login to FCAP Array and Quick Start dialogs.
25
Launching FCAP Array Software
1 To launch FCAP Array software, do either of the following:
•
Double-click the FCAP Array software shortcut icon on the desktop
•
Select Start > Programs > FCAP Array > FCAP Array
As the software launches, the Login to FCAP Array dialog is displayed.
Figure 3-1 Login to FCAP Array dialog
2 Enter your user name and password. Click Log in.
If the login fails, a message appears asking you to re-enter your user name
and password.
NOTICE User names and passwords are case-sensitive. The password can
be blank. When FCAP Array software is installed there is a user with user
name Administrator, password welcome, and administrative rights. The
Administrator password should be changed immediately, and accounts
created as needed. See User Management on page 165.
26
FCAP Array Software User’s Guide
If the login is successful, one of the following is displayed:
•
the Quick Start dialog (Figure 3-2)
•
the General Information view of the main activity window (Figure 3-4
on page 29)
Quick Start Dialog
The Quick Start dialog is displayed when you launch FCAP Array software if
Quick Start display has not been previously disabled.
Figure 3-2 FCAP Array software Quick Start dialog
NOTICE To skip the Quick Start dialog in subsequent sessions, enable Do not
show this dialog at startup by marking its checkbox.
If the Quick Start dialog has been disabled, you can re-enable it by selecting
File > Preferences > Show Quick Start dialog at startup (Figure 3-3 on page 28).
The dialog will be displayed the next time you launch FCAP Array software.
Chapter 3: FCAP Array Software Startup
27
Figure 3-3 Enabling the Quick Start dialog
The Quick Start dialog provides the following options:
•
New experiment starts the Experiment Wizard.
•
Define new plex starts the New Plex Wizard.
•
Open existing experiment invokes an Open (saved experiment) dialog.
•
Open last experiment opens the last saved experiment.
Each of these options eventually takes you to the FCAP Array software
experiment window (Figure 3-4 on page 29).
28
FCAP Array Software User’s Guide
Experiment Window
The General Information view (Figure 3-4) of the experiment window is
displayed if the Quick Start dialog has been disabled.
Figure 3-4 Experiment window: General Information view
With the General Information view you can enter Institute information (name,
address, and logo) that is saved for subsequent experiments.
Chapter 3: FCAP Array Software Startup
29
30
FCAP Array Software User’s Guide
4
Getting Started Tutorial
This chapter presents a tutorial based on the data first workflow outlined in
FCAP Array Software Workflows on page 18.
As you work through this tutorial you’ll learn key FCAP Array software tasks,
and use FCS files installed with the software to perform data analysis.
The tutorial starts with software launch instructions. The main content is in two
sections:
•
Designing an Experiment with the Experiment Wizard on page 33
•
Bead Assay Data Analysis on page 54
Either section can be done first. To skip experiment design, open a saved
experiment provided with the software to perform the data analysis tasks. See
Opening a Saved Experiment on page 54.
31
Launching FCAP Array Software
If you have not yet installed FCAP Array software, do that now. See System
Requirements and Installation on page 21.
1 To launch FCAP Array software, select Start > Programs > FCAP Array >
FCAP Array. If you changed the installation file path from the default
during installation, navigate to your FCAP Array software location. For
more information see FCAP Array Software Startup on page 25.
As the software launches, the Login to FCAP Array dialog is displayed.
2 Enter your user name and password and click Log in.
NOTICE When FCAP Array software is installed, the user name
Administrator is provided, with password welcome.
Figure 4-1 Login to FCAP Array dialog
If the login is successful, either the Quick Start dialog, or the General
Information view of the experiment window is displayed.
32
FCAP Array Software User’s Guide
Designing an Experiment
with the Experiment Wizard
In the first part of the tutorial, you use the Experiment Wizard to create an
experiment document.
Start an Experiment Wizard session:
•
If the Quick Start dialog is displayed, click the New experiment icon.
•
Otherwise, click the New Experiment Wizard icon in the application
toolbar:
The opening view of the Experiment Wizard is displayed.
Figure 4-2 Experiment Wizard
Chapter 4: Getting Started Tutorial
33
Entering Test Samples and Dilutions
In this section, you enter information about your test samples. The FCS data files
for this tutorial contain four dilutions of a single test sample. Use of the serial
dilution feature of FCAP Array software is not indicated by the tutorial test
sample dilution factors. The alternative is to specify four test samples and a
dilution factor for each.
1 Click Next to advance to the Test Samples view.
In the Test Samples view, you specify the number of test samples, and
provide sample names. To expedite file assignment later, order your test
samples to agree with their acquisition order.
Figure 4-3 Specifying test samples using the Experiment Wizard
2 Specify 4 for Number of samples (if you type in the value, press Enter).
Default sample names are displayed for four test samples. In the next step,
you modify the test sample names to represent a single test sample with
four dilution factors.
34
FCAP Array Software User’s Guide
3 Change the test sample names to
001_x256, 001_x64, 001_x8, and 001_x2 (Figure 4-4):
a
Click on the first line to highlight it.
b
Click again on the test sample name to obtain an editable field.
c
Edit the test sample name and press Enter to advance to the next line
and obtain an editable field.
d
Repeat step c until done.
Figure 4-4 Specifying test sample names
Chapter 4: Getting Started Tutorial
35
4 Click Next to advance to the Dilution and Replicates view.
Figure 4-5 Dilutions and Replicates view
5 Specify a dilution factor for each of the test samples (leave Number of
Replicates and Additional serial dilution as is):
a
Select a test sample from the pull-down list (Figure 4-6 on page 37).
b
Enter its Dilution factor.
Test Sample
Dilution Factor
001_x256
256.00
001_x64
64.00
001_x8
8.00
001_x2
2.00
; Tip
After dilution factors are entered for individual samples, avoid
selecting All Samples from the pull-down list. If you do, the currently
entered dilution factor is applied to all samples.
36
FCAP Array Software User’s Guide
Figure 4-6 Selecting a test sample
Creating a New Plex
When you install FCAP Array software, your plex and bead libraries are empty.
In this tutorial, you define and save a new plex. Also, you add the beads needed
by the plex to your bead library.
1 Click Next to advance to the Selecting Saved Plex view (Figure 4-7 on
page 38).
2 Verify that **New Plex** is selected in the browser window and click
Next to advance to the Plex Components view (Figure 4-8 on page 38).
In the Plex Components view, you specify the beads for your plex.
However, as seen in Figure 4-8 on page 38, there are currently no beads to
choose from. To create the beads for your plex, you need to visit the bead
library.
Chapter 4: Getting Started Tutorial
37
Figure 4-7 Selecting Saved Plex view
Figure 4-8 Plex Components view
38
FCAP Array Software User’s Guide
Bead Library
In this section, you will enter new beads in the bead library. While you are at the
library, you also learn how to create a group for your new beads.
1 Click Edit to display the Bead Library dialog.
Figure 4-9 on page 40 shows the Bead Library dialog as it appears after
completing step 2 below.
2 For each bead listed in the table below, enter the Analyte and Bead ID and
click Add.
Analyte
Bead ID (cluster location)
Human IL-4
A5
Human IL-6
A7
Human IL-7
A8
Human IL-9
B6
Human Angiogenin
C4
Human LT-alpha
D7
As you add each bead, it is displayed in the Bead library list.
Chapter 4: Getting Started Tutorial
39
Figure 4-9 Bead Library dialog
3 Click Edit Groups to display the Bead Groups dialog.
Figure 4-10 Bead Groups dialog
4 Click New Group to display the New Bead Group dialog.
40
FCAP Array Software User’s Guide
5 Enter Tutorial Beads as the name of the new group and click OK.
Figure 4-11 New Bead Group dialog
The Bead Group dialog is displayed. Figure 4-12 shows the Bead Group
dialog as it appears after completing step 6 below.
6 Choose all six of the new beads for the Tutorial Beads group by marking
their checkboxes.
Figure 4-12 Bead Group dialog
Chapter 4: Getting Started Tutorial
41
7 Click OK to return to the Bead Groups dialog.
The Tutorial Beads group now appears in the browser listing.
8 Click the + box to the left of the new group to open it. Verify that six beads
are in the group.
Figure 4-13 Bead Groups dialog with new group
9 Click OK to return to the Bead Library dialog.
10 Click OK to return to the Plex Components view of the Experiment
Wizard.
42
FCAP Array Software User’s Guide
Choosing Plex Components
Now that there are beads in your bead library, you can specify the beads needed
by your plex. Because you defined a group for the plex beads, a shortcut is
available:
Double-click on the Tutorial Beads group in the browser on the left side of
the Plex Components view. All six beads from the group are added to the
Selected beads list on the right (Figure 4-14). Beads can also be selected one
at a time using the
button, or by double-clicking the individual analyte
name.
Figure 4-14 Plex Components view after selecting beads
Assigning Beads to Clusters
In this section you load an FCS data file from your experiment, identify the key
bead assay parameters, and establish a correspondence between beads and data
clusters.
1 Click Next to advance to the Clustering Parameters view. Figure 4-15 on
page 44 shows the Clustering Parameters view as it appears after
completing step 3 of this procedure.
Chapter 4: Getting Started Tutorial
43
2 Click Load Data File and navigate to the folder C:\Program Files\
Soft Flow\FCAP Array v1.0\Demo Files\6 plex Experiment. Load any one
of the files in that folder.
3 Select BD FACSArray using the Instrument name pull-down menu.
The remaining fields are automatically populated with default values for
the BD FACSArray bioanalyzer.
NOTICE Analysis parameters are instrument dependent. For more
information, see Appendix C, Analysis Parameters.
Figure 4-15 Clustering Parameters view
4 Verify that your values match those shown in Figure 4-15, and that the
message indicates that 6 clusters were found.
5 Click Next to advance to the Analyte Assignment view (Figure 4-17 on
page 45).
44
FCAP Array Software User’s Guide
Figure 4-16 Clustering Parameters view
If your beads have standard Bead ID location information, the ID codes
indicate relative cluster positions as shown in Figure 4-17.
Figure 4-17 Bead ID location codes
Chapter 4: Getting Started Tutorial
45
6 Assign beads to clusters:
; Tip
To simplify assignment, first click on the Bead column header in the
Analyte Assignment view to sort by Bead ID. Then assign the clusters left to
right in successive rows, top to bottom.
a
Click the first line of the bead-cluster list (Cluster ID = 1) to select it.
b
In the dot plot, double-click the left-most cluster in the top row of
clusters (labeled 1 in Figure 4-18 and also in Figure 4-19 on page 47)
to assign the selected bead to that cluster.
The Cluster ID of the bead appears near the cluster, indicating that the
bead has been assigned accordingly. The number of collected events for
that cluster is also displayed in the list. The bead-cluster list selection
advances to the next line (Figure 4-18).
c
As in step b, assign the remaining beads to their corresponding clusters.
Consult Figure 4-17 on page 45. The correct completed assignment is
shown in Figure 4-19 on page 47. If you make a mistake, click Clear
Assignment to restart.
Figure 4-18 Assigning a bead to its cluster
46
FCAP Array Software User’s Guide
Figure 4-19 Completed bead-cluster assignment
NOTICE Correct assignment of beads to clusters is necessary for proper
reporting of the analysis results.
Specifying Standards
In this section, you specify the fitting equation and standards for a quantitative
assay.
1 Click Next to advance to the Quantitative/Qualitative view. Figure 4-20 on
page 48 shows the Quantitative/Qualitative view as it appears after step 3
of this procedure.
2 Verify that Quantitative is selected and Uniform fitting equations is
enabled.
Chapter 4: Getting Started Tutorial
47
3 Click in the table cell in the top row under Fitting equation to activate its
pull-down menu and select 4 parameter logistic.
The table changes to display 4 parameter logistic as the fitting equation for
every bead-cluster.
Figure 4-20 Choosing a fitting equation
NEEDS REPLACEMENT
4 Click Next to advance to the Standards view (Figure 4-21 on page 49).
In the Standards view for a Quantitative assay, you specify the standard
concentrations and the number of replicates of each.
The tutorial FCS files contain 10 standard samples with uniform analyte
concentrations of 0, 20, 40, 80, 156, 312, 625, 1250, 2500, and 5000
pg/ml, acquired in that order.
48
FCAP Array Software User’s Guide
Figure 4-21 Standards view
5 Verify that Number of standard samples is set to 10, and that Uniform
concentrations for all analytes is enabled. Keep replicate values at 1.
6 Click in the table cell of the Unit row and CC column to activate the units
pull-down menu. Select pg/ml as the concentration unit.
7 Enter the standard sample concentrations as shown in the table below.
Press Enter after each entry to advance to the next line.
Standard
Sample
Concentration
Standard
Sample
Concentration
Std1
0.00
Std6
312.00
Std2
20.00
Std7
625.00
Std3
40.00
Std8
1250.00
Std4
80.00
Std9
2500.00
Std5
156.00
Std10
5000.00
Chapter 4: Getting Started Tutorial
49
8 After you enter all the concentrations, verify that your Standards view
looks exactly like Figure 4-22. Ensure that you specified Unit in step 6
above.
Figure 4-22 Completed Standards view
Controls and Reporting Messages
In this tutorial you do not use the Controls and the Reporting Messages views.
Therefore, you will skip over these next two views.
50
FCAP Array Software User’s Guide
Plate Layout Options
In this section, you specify your sample arrangement. When the tutorial data files
were created, the standard samples were acquired before the test samples.
Therefore, the default settings for plate layout are compatible with the
acquisition order of the tutorial FSC data files.
1 Click Next three times (once on each of three consecutive views) to advance
to the Plate Layout Options view (Figure 4-23).
2 Verify that Place samples at the end is enabled.
NOTICE When using the data first workflow, the Plate/Rack selection and row
versus column orientation selection do not affect the experiment, so you can
leave the default selections unchanged.
Figure 4-23 Plate Layout Options view
Chapter 4: Getting Started Tutorial
51
Ending the Experiment Wizard Session
In this section, you name the experiment, and name and save your new plex.
1 Click Next to advance to the Experiment Name view. Figure 4-24 shows
the Experiment Name view as it appears after step 5 below.
2 Enter myTutorial as the Experiment Name.
3 Enable Save plex by marking its checkbox.
4 Enter Tutorial as the Plex name.
5 Verify that Protected is not enabled (its checkbox is not marked).
Figure 4-24 Experiment Name view
52
FCAP Array Software User’s Guide
6 Click Finish to close the Experiment Wizard.
The new experiment opens in the Plate Layout view (Figure 4-25), and a
Save As dialog is provided to save the experiment.
7 Keep the filename myTutorial.exp and navigate, if needed, to
C:\Program Files\Soft Flow\FCAP Array v1.0\Demo Files\6 plex
Experiment
8 Click Save.
The file path of the saved experiment is listed in the experiment window
title bar.
Figure 4-25 Experiment window Plate view
Chapter 4: Getting Started Tutorial
53
Bead Assay Data Analysis
If you are continuing with a new experiment created in the previous section, skip
ahead to File Assignment on page 55. Otherwise, open either the saved
experiment document you created in the last section, or the saved experiment
document installed with the software, as described in the following section.
Opening a Saved Experiment
To open a saved experiment:
1 If the Quick Start dialog is displayed, click the Open existing experiment
icon. Otherwise select File > Open existing experiment.
An Open dialog is displayed.
2 Navigate to the experiment document and click Open.
•
For the experiment you created in the previous section, open:
C:\Program Files\Soft Flow\FCAP Array v1.0\Demo Files\6 plex
Experiment\myTutorial.exp
•
For the experiment installed with the software, open:
C:\Program Files\Soft Flow\FCAP Array v1.0\Demo Files\6 plex
Experiment\Tutorial.exp
54
FCAP Array Software User’s Guide
File Assignment
Before you can analyze your FCS data files, you must match them up with the
samples in your experiment.
1 Click the File Assignment tab to display the File Assignment view.
The left side of the view lists the experiment samples.
Figure 4-26 Experiment window File Assignment view
2 Enter instrument information:
NOTICE
Instrument name and Serial number must be specified.
a
Verify that BD FACSArray is selected as Instrument name.
b
Specify unknown for the Serial number.
Chapter 4: Getting Started Tutorial
55
3 Click Folder, navigate to C:\Program Files\Soft Flow\
FCAP Array v1.0\Demo Files\6 plex Experiment, and select any FCS data
file in that folder.
The FCS files are loaded, and the right side of the File Assignment view
now lists the FCS files found in the folder you selected.
Figure 4-27 File Assignment view: preparing to assign files
4 Verify that the FCS file order matches the corresponding experiment
sample order.
56
FCAP Array Software User’s Guide
5 To assign the files using one-step assignment:
a
Select the top line of the experiment sample list (Figure 4-27).
b
Select the top line of the FCS file list.
c
Click
.
The left side list now includes the FCS file assignments, and the FCS files in
the right side list have been marked to denote that they are assigned. Also,
the Start analyzing this experiment toolbar icon is now active.
Figure 4-28 File Assignment view: file assignment complete
When the FCS file order does not match exactly, you should use manual
assignment (see File Assignment View on page 128).
Chapter 4: Getting Started Tutorial
57
Starting the Analysis
1 To start the analysis, click the Start analyzing this experiment icon:
Since the bead-cluster assignments are complete for each plex in the
experiment, data analysis begins. When the analysis is complete, the
Analysis Messages dialog is displayed.
Figure 4-29 Analysis Messages dialog
2 Click OK to dismiss the dialog.
58
FCAP Array Software User’s Guide
Three new tabs are now displayed in the experiment window (see Figure 4-30 on
page 60):
•
Report Printout
•
Standard Curves
•
Raw Data
Saving the Analysis Data
Before reviewing the analysis results, save your experiment and the new analysis
data by clicking the Save this experiment icon:
Printing a Report
In the Report Printout view, you can view, format, and print an analysis report.
1 Click the Report Printout tab to display the Report Printout view
(Figure 4-30 on page 60).
Chapter 4: Getting Started Tutorial
59
Figure 4-30 Report Printout view
60
FCAP Array Software User’s Guide
The full report is displayed in the Report Printout view. By default, it
consists of:
•
Experiment identifiers
•
Sample/FCS file table
•
Statistics from the standard samples and the curve fit
•
Standard curve plots
•
Color-coded charts of test sample concentrations (without dilution
factor applied)
•
Statistics from the test samples
2 Scroll down through the sections of the full report.
You can modify the contents and formatting of the full report, or create
additional custom report templates (see Report Printout View on
page 134).
3 Click Page Setup to specify page information, choose a printer, and select
printer properties.
4 Click Print to print a copy of the full report (no Print dialog).
Inspecting the Standard Curves
In the Standard Curves view, you can inspect and print standard curve plots and
apply a new curve fitting model to the data.
1 Click the Standard Curves tab to display the Standard Curves view
(Figure 4-31 on page 62).
The standard curve for the Human IL-4 analyte is shown.
Chapter 4: Getting Started Tutorial
61
Figure 4-31 Standard Curves view
2 Change the selection in the Analytes scroll box to view the other standard
curves.
62
FCAP Array Software User’s Guide
3 Print one or more of the standard curve plots:
a
Select File > Page Setup to specify page information, choose a printer,
and select printer properties.
b
Click Print.
The Select Clusters to Print dialog is displayed (Figure 4-32).
c
Choose one or more standard curves to be printed by marking the
checkbox of its analyte.
d
Click OK.
The standard curve plots are printed (no Print dialog).
Figure 4-32 Select Clusters to Print dialog
Chapter 4: Getting Started Tutorial
63
Reviewing the Raw Data
In the Raw Data view, you inspect analysis statistics and plots.
1 Click the Raw Data tab to display the Raw Data view.
MFI (median fluorescence intensity) statistics are shown for every analyte
of every sample.
Figure 4-33 Raw Data view
2 Click the Event Num, SD, %CV, Sample CC, and Final CC buttons to
display those statistics.
3 Click Histogram to create a plot window.
4 Click Statistics to create a statistics window.
5 Click on cells of the table and note the changing contents of the plot and
statistics windows (Figure 4-34).
64
FCAP Array Software User’s Guide
Figure 4-34 Plot and statistics windows
Chapter 4: Getting Started Tutorial
65
6 To export a comma delimited raw data file (.csv):
a
Click Export
The Raw Data Export dialog is displayed.
Figure 4-35 Raw Data Export dialog
66
b
Choose to export Samples and Statistics by marking their checkboxes.
c
Select Samples in rows, analytes in columns.
d
Click Continue.
e
Specify a file name and location in the Specify Export File dialog that
follows, and click Export.
f
Open the file you created in a .csv compatible spreadsheet (example:
Microsoft Excel).
FCAP Array Software User’s Guide
Finalizing the Experiment
In this section, you finalize the experiment to prevent additional modifications.
For more information, see Finalizing the Experiment on page 146.
1 Click the Finalize icon in the application toolbar:
The Signing experiment dialog is displayed.
Figure 4-36 Signing experiment dialog
2 Choose a user name with signing authorization from the Login name pulldown menu.
If you have an authorized account, choose your own user name. Otherwise,
use Administrator.
3 Enter the password.
4 Click OK.
Chapter 4: Getting Started Tutorial
67
When an experiment is finalized, the Finalize icon in the toolbar is replaced with
a Lock icon to signify the locked status of this experiment:
The report document of the finalized experiment now contains additional
information.
5 Click the Report Printout tab to return to the Report Printout view.
Note that the experiment identifiers section has changed to include a
Release Authorization and a Finalization time.
68
FCAP Array Software User’s Guide
5
FCAP Array Experiment Design
This chapter describes how to develop experiment documents, using both the
Experiment Wizard and the standard interface (experiment window):
•
Introduction on page 70
•
Creating an Experiment with the Experiment Wizard on page 71
•
Creating or Modifying an Experiment with the Experiment Window on
page 98
For an outline of typical workflows, see FCAP Array Software Workflows on
page 18.
69
Introduction
Experiments
With FCAP Array software, you create experiments that define bead assays, and
then analyze the acquired FCS 2.0 data files. When used with the BD FACSArray
flow cytometer, the FCAP Array experiment document can be exported to
coordinate data acquisition.
Experiments are created with either the Experiment Wizard or the standard
experiment document interface (main activity window). Experiments created
with the Experiment Wizard can be modified in the main activity window. You
can also save and reuse experiments, often by making a few quick edits.
Plexes and Beads
An FCAP experiment contains one or more plexes. A plex defines the beads used
in analyte testing, as well as the standards or controls. Beads associate the distinct
fluorescence characteristics of a capture bead with an analyte. A plex also
specifies the instrument parameters used to distinguish clusters and quantify
analyte concentration. A sample data file is used to assign bead analytes to
clusters.
A plex is created or modified from within an experiment. Plexes can be saved for
reuse and exported to other users.
Plex creation and modification is built into the Experiment Wizard. The main
activity window supports plex development through the New Plex Wizard and
the Plex Modification Wizard. All three wizards support bead list maintenance.
70
FCAP Array Software User’s Guide
Creating an Experiment
with the Experiment Wizard
With the Experiment Wizard, you follow a series of menus and selections
resulting in the creation of a new experiment. The Experiment Wizard can be
invoked in several ways:
•
Select File > New Experiment Wizard.
•
Click the New Experiment icon in the Quick Start dialog at startup.
•
Click the New Experiment icon in the application toolbar:
The opening view of the Experiment Wizard is shown in Figure 5-1 on page 73.
The wizard has six main views:
Experiment Wizard
Main View
Activity
Overview
None.
Test Samples
Specify the number and names of test samples.
Dilution and Replicates
Specify dilution factor, number of replicates, and optional
serial dilutions.
Selecting Saved Plex
Choose to create a new plex or to select an existing plex to
reuse.
Plate Layout Options
Specify the arrangement of samples on the plates or tube
racks.
Experiment Name
Name the experiment.
Optional: save a new or modified plex.
Chapter 5: FCAP Array Experiment Design
71
Additional plex views are used to define a new plex or modify an existing plex.
You can skip these when reusing an existing plex as is. The optional views of the
Experiment Wizard are sub-views of the Selecting Saved Plex view:
Experiment Wizard
Optional Plex Views
Activity
Plex Components
Specify the beads used in the plex.
Clustering Parameters
Specify the instrument, load a sample data file, specify
scatter, clustering, and reporting parameters.
Analyte Assignment
Assign bead analytes to the clusters identified in the sample
data file.
Qualitative/Quantitative
Choose qualitative or quantitative analysis. If quantitative,
specify a fitting equation.
Standards
If quantitative, enter the concentrations of the standards. If
qualitative, specify the controls used and cutoff index
constants.
Controls
Specify control samples that contain known concentrations
of the analytes.
Reporting Messages
Specify the messages to be printed in the report documents,
depending on the measured concentration or cut-off index
of selected analytes.
Navigating Experiment Wizard Views
The standard method of advancing through the Experiment Wizard is to click the
Next buttons at the bottom of each view. However, the order in which you access
the views is somewhat flexible.
A menu of the views is provided on the left side of the Wizard. The current view
is highlighted. Active views are listed in white. Inactive views are greyed.
Additional views are activated as you satisfy experiment requirements. You can
use the view menu to visit any active view without losing your experiment
settings.
72
FCAP Array Software User’s Guide
To exit the Experiment Wizard, click the Finish or Cancel buttons. If you cancel
an Experiment Wizard session, you will lose any work you have done on the new
experiment. The Cancel button is always available.
When your experiment can be safely transferred out of the Wizard, the Finish
button is activated. If the Finish button is greyed, your experiment is missing vital
information. Views that require additional input are listed in bold in the view
menu. Instructions for completing the current view are found in the bottom bar
of the wizard window.
Figure 5-1 Experiment Wizard
Chapter 5: FCAP Array Experiment Design
73
Test Samples View
The number of test samples, and their names, is entered in the Test Samples view.
NOTICE If replicates or serial dilutions of a sample are used, specify the sample
in the Test Samples view. Use the Dilutions and Replicates view to subsequently
specify the replicates or serial dilutions (Dilution and Replicates View on
page 75).
1 Navigate to the Test Samples view.
Figure 5-2 Defining test samples using the Experiment Wizard
2 Specify the number of test samples for your experiment. The default test
sample names are S0001, S0002, …
If you are using the data first workflow, order your test samples to agree
with their acquisition order. To determine the acquisition order of FCS data
files, the Clustering Test tool can be used to look at the BTIM keyword
value in the FCS file header information. See Clustering Test Tool on
page 169.
74
FCAP Array Software User’s Guide
3 To change a test sample name:
a
Select the line to be changed.
b
Click again on the test sample name to obtain an editable field.
c
Type the new name.
d
To continue editing with the next sample name, press Enter to advance
to the next line and obtain an editable field.
If finished, click anywhere outside the name field.
Dilution and Replicates View
The dilution factor and number of replicates are entered in the Dilution and
Replicates view.
1 Navigate to the Dilution and Replicates view.
Figure 5-3 Entering dilution and replicate information for samples
Chapter 5: FCAP Array Experiment Design
75
2 Select a test sample name from the pull-down menu. Select All Samples if
you want to apply the dilution settings to all samples.
; Tip
After dilution factors are entered for individual samples, avoid
selecting All Samples from the pull down list. If you do, the currently entered
dilution factor is applied to all samples.
a
Specify the number of replicates (default = 1).
NOTICE Replicates of a sample have the same dilution. Serial dilutions of
a sample are NOT replicates.
b
Specify the dilution factor (default = 1). For serial dilutions, the
dilution factor specifies the dilution of the most concentrated sample in
the series.
c
If using serial dilutions, enable Additional Serial Dilution by marking
its checkbox, and specify the number of additional dilutions and the
dilution factor of the serial dilution.
; Tip
When a serial dilution is specified, the dilution series is listed at the
bottom of the Sample dilution control area. Compare these values with the
intended dilution series.
3 Repeat step 2, as needed, for individual samples.
; Tip
You can select All Samples and apply settings to all samples, then select
samples individually to change the settings for those samples only.
76
FCAP Array Software User’s Guide
Selecting Saved Plex View
In this view you select a plex to be used in the experiment. You can specify either
to reuse a saved plex or to create a new plex.
1 Navigate to the Selecting Saved Plex view.
Figure 5-4 Selecting Saved Plex view
2 Select either **New Plex** (top line), or an existing plex.
The sections that follow describe how to use the additional plex views to define a
new plex. You can also use these views to modify an existing plex.
If you are defining a new plex, use the Next buttons to visit each of the views. If
you are reusing a saved plex, use the menu at the left to access any of the plex
views needed to modify the plex, or to skip ahead to the Plate Layout Options
view.
Chapter 5: FCAP Array Experiment Design
77
Plex Components View
In this view, you specify the beads used in a plex.
With the Plex Components view, you can also access the Bead Library and Bead
Groups dialogs. Tasks associated with these dialogs are described in Maintaining
the Bead Library on page 150.
1 Navigate to the Plex Components view (Figure 5-5).
The view has two list boxes, Beads and Selected Beads.
Beads lists all beads previously defined, organized into one or more groups.
The All Beads group contains the complete bead list. A given bead may also
appear in one or more additional (optional) groups. The list of beads may
be empty the first time FCAP Array software is run. See Maintaining the
Bead Library on page 150.
Figure 5-5 Plex Components view
2 In the View options section, choose either the Analyte ID and Bead ID view,
or the Catalog # and Lot # view.
78
FCAP Array Software User’s Guide
3 Select one or more beads from the Beads list on the left (make multiple
selections with the Ctrl or Shift keys).
4 Click
.
The selected beads are added to the plex, and appear in the Selected beads
list on the right.
5 Repeat step 3 and step 4 until all beads for the plex appear in the Selected
beads list (Figure 5-6).
Alternatively, you can assign beads to your plex by:
•
double-clicking a bead in the Beads list on the left to add that bead to the
plex.
•
double-clicking a bead group name in the Beads list on the left to add the
entire bead group to the plex.
Figure 5-6 Plex Components view showing the selected beads
Chapter 5: FCAP Array Experiment Design
79
Clustering Parameters View
In this view, you load a sample data file based on the defined plex, and specify the
instrument and the scatter, clustering, and reporting parameters.
NOTICE To complete the Clustering Parameters and Analyte Assignment views,
you must have an FCS 2.0 data file that was acquired for the experiment. If data
has not been acquired, you can skip these views, and move ahead to the
Qualitative/Quantitative view.
1 Navigate to the Clustering Parameters view.
Figure 5-7 The Clustering Parameters view
2 Click Load Data File
A standard Open dialog is displayed. Navigate to the data files folder, and
open any one of bead assay list-mode data files for the current plex.
This file is used as a template to assign beads to the data clusters, so the
data must include all of the beads to correctly establish the plex.
3 Specify the instrument. Either select from the pop-up menu, or type the
instrument name.
80
FCAP Array Software User’s Guide
4 Specify the parameters used for the bead assay.
NOTICE FCAP Array software has default clustering and reporter parameters
defined for most BD CBA Flex Set–compatible BD flow cytometry instruments.
Choosing the Instrument name from the menu assigns the default parameters for
that instrument. For instruments not defined, choose the parameters to be used
for clustering.
When the software has succeeded in finding clusters based on the specified
parameters, a message appears in the Clustering Parameters view.
Figure 5-8 Successful data file clustering
Chapter 5: FCAP Array Experiment Design
81
Analyte Assignment View
In this view, you assign the plex beads to corresponding clusters in the data file.
1 Navigate to the Analyte Assignment view.
Figure 5-9 Analyte Assignment view
82
FCAP Array Software User’s Guide
2 Assign beads to clusters:
a
Click the first line of the bead list (Cluster ID = 1).
The bead information is highlighted.
b
Double-click the corresponding cluster in the dot plot to assign the
selected bead to that cluster (Figure 5-10).
A small number (the cluster ID of the bead) appears near the cluster,
indicating that the bead has been assigned. The number of cluster
events for that bead is now displayed in the bead list. The bead list
selection advances to the next line.
c
Repeat step b to assign the remaining beads to clusters. If you make a
mistake, you can correct individual assignments, or click Clear
Assignment to restart.
NOTICE Bead-cluster assignment information is provided in the BD CBA
Flex Set Master Buffer Kit manual.
Figure 5-10 Assignment of the beads to the individual clusters
Chapter 5: FCAP Array Experiment Design
83
Figure 5-11 shows an example of a completed bead-cluster assignment.
Figure 5-11 Completed bead-cluster assignment
NOTICE Correct assignment of beads to clusters is necessary for proper labeling
of the analysis results.
84
FCAP Array Software User’s Guide
Qualitative/Quantitative View
FCAP Array software performs both quantitative and qualitative analyses, but in
defining an experiment, you must choose to do one or the other. For an overview
of the two experiment types, see the Quantitative Analysis and Qualitative
Analysis sections on page 17.
The information you enter in this view, as well as the Standards view, depends on
your experiment type. Therefore, the discussion in each of these views is split into
two sections: Quantitative Analysis and Qualitative Analysis.
Quantitative Analysis
1 Navigate to the Qualitative/Quantitative view.
Figure 5-12 Selecting Quantitative experiment and the Fitting equation
2 Select Quantitative.
3 For each analyte, select a Fitting equation from the pull-down menu.
If you enable Uniform fitting equations, you set only one Fitting equation
and it applies to all of the analytes.
Chapter 5: FCAP Array Experiment Design
85
Qualitative Analysis
1 Navigate to the Qualitative/Quantitative view.
Figure 5-13 Selecting a Qualitative experiment
2 Select Qualitative.
Fitting equations are not used in qualitative analysis.
Standards View
Quantitative Analysis
In the Standards view for a quantitative analysis, you specify the number of
standard samples, number of replicates for each standard, and the standard
concentrations. You can choose uniform concentrations for all analytes (default),
or specify the concentrations for each analyte.
86
FCAP Array Software User’s Guide
1 Navigate to the Standards view.
Figure 5-14 Standards view (quantitative)
2 Set the number of replicates.
3 If you want to specify standard concentrations for each analyte
individually, disable Uniform concentrations for all analytes by clearing its
checkbox.
4 Specify the Unit for the concentrations (in the CC column).
5 Enter the standard concentrations (in the CC column).
A completed Standards view (quantitative) is shown in Figure 5-15 on
page 88.
Chapter 5: FCAP Array Experiment Design
87
Figure 5-15 Completed Standards view (quantitative)
NOTICE FCAP Array software is not able to plot standard curves for non-zero
standard concentrations less than or equal to 1.00. Change the units so that all
non-zero concentrations are greater than 1.00.
Example: for a standard concentration of 0.5 ng/ml, change the units to pg/ml
(500 pg/ml).
NOTICE If a concentration is not entered for a given standard sample, that
standard sample will not be included in standard curve plots or standard curve
calculations.
; Tip
To exclude a standard sample for some analytes in a plex, leave its
concentration unspecified for those analytes. To do this, you must enter standard
concentrations for each analyte individually (disable Uniform concentrations for
all analytes by clearing its checkbox). If a value is currently specified for a
concentration, select the entry and press Delete to make that concentration
unspecified.
88
FCAP Array Software User’s Guide
Qualitative Analysis
In the Standards view for a qualitative analysis, you specify the type of control(s),
number of replicates for each control, and the cutoff value parameters. You can
choose uniform cutoff value parameters for all analytes (default), or specify the
cutoff value parameters for each analyte.
1 Navigate to the Standards view.
Figure 5-16 Standards view (qualitative)
2 Enable one or both of Use NS (negative control) and Use PS (positive
control), by marking their checkboxes.
3 Set Replicate number for the enabled control(s).
4 If you want to specify cutoff value parameters for each analyte individually,
disable Uniform parameter values.
5 Enter the cutoff value parameters (see Cutoff Value Calculation on
page 90).
Chapter 5: FCAP Array Experiment Design
89
Cutoff Value Calculation
The cutoff value (CO) is determined from the following equation:
CO = [a + log MFI(NS)] * b + [c + log MFI(PS)] * d
where:
MFI(NS) denotes the mean fluorescence intensity (median) of the
negative control
MFI(PS) denotes the mean fluorescence intensity (median) of the
positive control
a, b, c, d are constants
The cutoff index (COI) is defined as:
COI = log MFI(S)/CO
where MFI(S) denotes the mean fluorescence intensity (median) of the test
sample
For appropriate values to enter for the a, b, c, and d parameters of a qualitative
analysis, see your reagent product insert.
90
FCAP Array Software User’s Guide
Controls View
In the Controls view, you can specify control samples that contain known
concentrations of the analytes, used to verify the analysis results.
Controls can be added for both quantitative and qualitative analyses. The only
difference is how the expected concentrations are specified:
•
For quantitative experiments, the expected concentrations are calculated
concentration (CC) values.
•
For qualitative experiments, the expected concentrations are cutoff indexes
(COIs). See Cutoff Value Calculation on page 90 for more information
about COI values.
1 Navigate to the Controls view.
Figure 5-17 shows the Controls view for a quantitative experiment. The
qualitative Controls view is similar.
Figure 5-17 Controls view
Chapter 5: FCAP Array Experiment Design
91
2 Enter the Number of samples (controls).
3 Set the Number of replicates for each sample.
4 Select the Default range of acceptable calculated concentrations for each
control.
5 Enter the expected calculated concentration for each control. If the controls
have different concentrations for each analyte, disable Uniform
concentrations and enter the expected calculated concentrations for each
analyte individually.
Reporting Messages View
In this view (Figure 5-18), you create message flags that are triggered during data
analysis. Messages report when a control sample has a calculated concentration
above, below, within, or outside a certain value or value range. The messages can
be customized and applied to all analytes uniformly or separately.
Figure 5-18 Reporting Messages view
92
FCAP Array Software User’s Guide
Plate Layout Options View
In this view, you specify how to lay out the test, standard, and control samples on
a plate (wells) or in a rack of tubes.
1 Navigate to the Plate Layout Options view.
Figure 5-19 Plate Layout Options view
2 Select a Plate/Rack option:
•
96-well plate
•
384-well plate
•
rectangular rack of tubes
Chapter 5: FCAP Array Experiment Design
93
3 Select a Row/Column option:
•
Row by row
Sets up samples horizontally. If a sample contains more than the
number of wells or tubes in a row, the sample continues to the next
row and does not skip any wells.
•
Column by column
Sets up samples vertically. If a sample contains more than the number
of wells or tubes in a column, the sample continues to the next column
and does not skip any wells.
4 Choose whether to enable each of the following options by marking its
checkbox:
•
Place samples at the end
If enabled, the layout starts with the standards and controls (if any),
followed by the test samples.
•
No side wells used (plates only)
If enabled, no samples are placed in the wells on the edges of the plate.
•
Standards / samples start on a new row / column
Used with replicates to start each sample (standards, controls, tests) on
a new row or column.
•
Each sample starts on a new row / column
Used with replicates to start each test sample on a new row or column.
94
FCAP Array Software User’s Guide
Experiment Name
In this view, you review the experiment, name the experiment, and name and save
a new or modified plex.
1 Navigate to the Experiment Name view.
2 Review the experiment settings in the Summary text scroll box. If you need
to make changes to any of the settings, navigate to the view to be changed,
make the changes, and return to the Experiment Name view.
Figure 5-20 Experiment Name view
3 Enter an Experiment Name.
4 To save a new or modified plex:
a
Enable Save plex by marking its checkbox.
b
Enter a Plex name.
NOTICE You can save a plex only if the Clustering Parameters and Analyte
Assignment tasks have been completed.
Chapter 5: FCAP Array Experiment Design
95
NOTICE If you choose to protect a plex by marking the Protected
checkbox when saving, the plex properties can no longer be modified. Plex
properties include the number of standard curve points, their concentration
values, and the data file used for the cluster assignment. You can create a
non-protected copy of a protected plex. See Maintaining the Plex Library
on page 156.
5 Click Finish to exit the Experiment Wizard.
The Experiment Wizard session ends. The experiment you created opens in
the Plate View of the experiment window (Figure 5-21), and a Save As
dialog is provided to save the experiment.
6 Navigate to the folder you want to use to save the experiment, and click
Save.
The file path of the saved experiment is listed in the experiment window
title bar.
Figure 5-21 Experiment window: Plate View tab
96
FCAP Array Software User’s Guide
Continuing Your Experiment
The next section describes tasks performed with experiment window views. For
information about continuing experiment development with the Plate view, see
Plate View on page 113.
To add additional plexes to the experiment, see Adding a Plex to the Experiment
on page 104.
To modify the experiment, see Creating or Modifying an Experiment with the
Experiment Window on page 98.
If you are using the BD FACSArray bioanalyzer workflow:
1 Verify your plate layout with the Plate view (Plate View on page 113).
2 Export your experiment for use with BD FACSArray system software
(Generating and Exporting the XML Experiment File on page 119).
Chapter 5: FCAP Array Experiment Design
97
Creating or Modifying an Experiment
with the Experiment Window
Each task described in Creating an Experiment with the Experiment Wizard on
page 71 can also be performed from the experiment window. In addition, you
can modify existing experiments, as well as continue development of experiments
created with the Experiment Wizard.
Tasks are organized by view. The table below provides assistance in locating
instructions for a specific task, and shows a correspondence between Experiment
Wizard views and experiment window views.
Where Plex Wizard appears in the Experiment Window View column, the
functionality is obtained by invoking one of the plex wizards (New Plex Wizard
or Plex Modification Wizard) from the Experiment view of the experiment
window. See Adding a Plex to the Experiment on page 104 and Modifying an
Experiment Plex on page 106.
Task
Experiment Wizard View
Experiment Window View
Add test samples
Test Samples view
Experiment view
Modify, delete test samples
Test Samples view
Experiment view
Specify dilution factor,
replicates, serial dilutions
Dilution and Replicates
view
Experiment view
Choose to create a new
plex or reuse existing plex
Selecting Saved Plex view
Experiment view
Add additional plexes
98
Experiment view
Specify the beads in a plex
Plex Components view
Plex Wizard
Load a sample data file,
specify instrument and
parameters
Clustering Parameters view
Plex Wizard
Assign beads to clusters
Analyte Assignment view
Plex Wizard
FCAP Array Software User’s Guide
Task
Experiment Wizard View
Experiment Window View
Choose qualitative or
quantitative analysis
Qualitative/Quantitative
view
Plex Wizard
Specify fitting equation
Qualitative/Quantitative
view
Plex Wizard
Enter the concentrations of
the quantitative standards
Standards view
Plex Wizard
Delete a standard sample
Samples view
Specify the controls used
and cutoff index constants
Standards view
Plex Wizard
Specify control samples
Controls view
Plex Wizard
Specify control messages
Reporting Messages view
Plex Wizard
Specify the sample layout
Plate Layout Options view
Plate view
Name the experiment
Experiment Name view
General Information view
Specify lab information
Save new or modified plex
General Information view
Experiment Name view
Plex Wizard
Create new experiment
Any experiment window
view
Load experiment
Any experiment window
view
Save experiment
Any experiment window
view
Copy experiment
Any experiment window
view
Chapter 5: FCAP Array Experiment Design
99
Creating an Experiment
To create a new experiment, select File > New experiment.
Saving an Experiment
The status of your experiment document is indicated in the title bar of the
experiment window. An asterisk indicates that your experiment has changed
since it was saved. No file path indicates that you have never saved the
document.
An experiment can be saved in either of two ways:
•
Select File > Save
•
Click the Save this experiment icon:
Opening a Saved Experiment
To open an experiment:
1 Select File > Open existing experiment
An Open dialog is displayed.
2 Navigate to the experiment document and click Open.
100
FCAP Array Software User’s Guide
Copying an Experiment
By creating a copy of an existing experiment, you can reuse the settings
(associated with a plex) of the experiment, and assign new samples (tests,
standards, controls).
To create a copy of the currently open experiment:
1 Click the Create copy of experiment icon in the application toolbar:
The Copy Experiment dialog is displayed.
Figure 5-22 Copy Experiment dialog
2 Enable Clear test samples by marking its checkbox. This deletes all test
samples from the experiment document and allows you to re-run the same
bead assay with new test samples.
Always include standards with an experiment. Do not enable the Disable
standards option.
For instructions on entering the new test samples see Adding Test Samples
to an Experiment and Specifying Dilutions on page 108.
Chapter 5: FCAP Array Experiment Design
101
General Information View
In the General Information view, you name the experiment, provide lab
information, and enter comment text.
Click the General Information tab to display the General Information view.
Figure 5-23 General Information view
102
FCAP Array Software User’s Guide
Experiment View
With the Experiment view, you add, modify, and delete plexes. You also add,
modify, and delete test samples, and specify their dilutions.
While an experiment can have more than one plex, each test sample is associated
with a unique plex. When you add test samples in the experiment window, you
associate them with an experiment plex. Therefore, no test samples can be added
until there is at least one plex. Also, if you delete a plex from an experiment, any
test samples associated with that plex are also deleted.
Click the Experiment tab to display the Experiment view.
Figure 5-24 Experiment view
Chapter 5: FCAP Array Experiment Design
103
Adding a Plex to the Experiment
To add a plex to the experiment, click Add Plex (Figure 5-24 on page 103).
The Selecting Saved Plex view of the New Plex Wizard is displayed.
Figure 5-25 New Plex Wizard: Selecting Saved Plex view
The views (and their functionality) of the New Plex Wizard duplicate those of the
same name from the Experiment Wizard.
For example, on the screen shown above, you select a plex to be added to the
experiment. You can specify either to reuse a saved plex, or to create a new one.
For additional instructions on completing this view, and those that follow, see the
corresponding sections in Creating an Experiment with the Experiment Wizard,
starting with Selecting Saved Plex View on page 77.
104
FCAP Array Software User’s Guide
The final view of the New Plex Wizard, the Plex Summary view (Figure 5-26),
does not have a matching view in the Experiment Wizard. In the Plex Summary
view, you can review your plex settings and save your plex if the Clustering
Parameters and Analyte Assignment tasks have been completed.
Figure 5-26 New Plex Wizard: Plex Summary view
Deleting an Experiment Plex
To delete a plex from the experiment, select that plex in the browser listing of the
Experiment View, and click Delete (see Figure 5-27 on page 106).
Chapter 5: FCAP Array Experiment Design
105
Modifying an Experiment Plex
If you have added a plex to your experiment, it will appear in the Experiment
view browser listing, as shown in Figure 5-27.
To modify a plex, select that plex in the browser listing and click Modify.
Figure 5-27 Experiment view with plex
The Plex Components view of the Plex Modification Wizard is displayed
(Figure 5-28 on page 107).
106
FCAP Array Software User’s Guide
Figure 5-28 Plex Modification Wizard: Plex Components view
The views (and their functionality) of the Plex Modification Wizard duplicate
those of the same name from the Experiment Wizard.
For additional instructions on completing this view, and those that follow, see the
corresponding sections in Creating an Experiment with the Experiment Wizard,
starting with Plex Components View on page 78.
The final view of the Plex Modification Wizard, the Plex Summary view
(Figure 5-29 on page 108), does not have a matching view in the Experiment
Wizard. In the Plex Summary view, you can review your plex settings and save
your plex if the Clustering Parameters and Analyte Assignment tasks have been
completed.
Chapter 5: FCAP Array Experiment Design
107
Figure 5-29 Plex Modification Wizard: Plex Summary view
Adding Test Samples to an Experiment and Specifying Dilutions
If you have at least one plex in your experiment, you can add test samples to the
experiment.
To add test samples to an experiment and specify their dilutions:
1 Find the plex in the browser listing that the test samples will be associated
with. If the plex already has components, open the plex by clicking the +
sign to the left of the plex name. Select the plex.
2 Click Add Sample.
The Add Sample dialog is displayed (Figure 5-30 on page 109).
108
FCAP Array Software User’s Guide
Figure 5-30 Add Sample dialog
3 Enter the Sample ID and other relevant information.
4 Click Add.
5 Repeat steps 3 and 4 for additional samples.
6 Click Close.
Chapter 5: FCAP Array Experiment Design
109
Modifying a Test Sample
1 Find the test sample in the browser listing to be modified. You may need to
open the plex containing the test sample by clicking the + sign to the left of
the plex name. Select the test sample.
Figure 5-31 Experiment view with plex and test samples
110
FCAP Array Software User’s Guide
2 Click Modify.
The Modify Sample dialog is displayed.
Figure 5-32 Modify Sample dialog
3 Modify the test sample information as needed.
4 Click OK to apply the changes, or Cancel to cancel the changes.
Deleting a Test Sample
1 Find the test sample in the browser listing to be deleted. You may need to
open the plex containing the test sample by clicking the + sign to the left of
the plex name. Select the test sample.
2 Click Delete.
Chapter 5: FCAP Array Experiment Design
111
Samples View
You can delete an individual standard sample in the Samples view. This is useful
when a standard sample acquisition fails or the data point from a standard
sample is an outlier in the standard sample curve fit.
Click the Samples tab to display the Samples view (Figure 5-33).
Deleting a Standard Sample
1 Expand the browser listing and select the standard sample to be deleted.
2 Click Delete.
Figure 5-33 Samples view: deleting a standard sample
112
FCAP Array Software User’s Guide
Plate View
With the Plate view, you set sample layout options or modify the sample layout
options set with the Experiment Wizard. You can also modify the sample color
codes, and print an image of the sample layout.
Click the Plate View tab to display the Plate view.
Figure 5-34 Plate view
Sample Layout Settings
The sample layout setting controls duplicate those found on the Plate Layout
Options view of the Experiment Wizard. For a description of these settings, see
Plate Layout Options View on page 93.
Chapter 5: FCAP Array Experiment Design
113
Exporting an XML Experiment File for the
BD FACSArray Bioanalyzer
Export an XML experiment file to coordinate the acquisition of samples with the
BD FACSArray bioanalyzer. For detailed instructions, see Generating and
Exporting the XML Experiment File on page 119.
Sample Layout Color Codes
You can redefine the colors used to code the different bead assay sample types. To
access this feature, click Define Colors.
Printing the Sample Layout
You can print the sample layout graphic as a guide for preparing your acquisition
samples and setting up the instrument. To print the sample layout, click Print. To
preview the print format, click Print Preview.
File Assignment View
The File Assignment view is used to assign FCS 2.0 data files to corresponding
FCAP Array software experiment samples.
Tasks performed in the File Assignment view are described in Chapter 7, Data
Analysis. See File Assignment View on page 128.
114
FCAP Array Software User’s Guide
6
Using FCAP Array Software with
the BD FACSArray Bioanalyzer
FCAP Array software provides special support to coordinate setup and sample
acquisition on the BD FACSArray bioanalyzer. This chapter reviews the
BD FACSArray bioanalyzer workflow, and describes in detail only the steps
specific to that workflow that are directly related to FCAP Array software:
•
Transferring the BD CBA Flex Set Template on page 117
•
Generating and Exporting the XML Experiment File on page 119
•
Acquiring Data and Creating FCS 2.0 Data Files on page 124
As noted, other steps of the BD FACSArray bioanalyzer workflow are described
elsewhere in this user’s guide, or in other documentation.
115
Performing Instrument Setup
You set up the BD FACSArray bioanalyzer with BD FACSArray system software.
A successful setup results in an experiment template that contains acquisition
settings including
•
the loader and instrument settings
•
predefined plots
•
an acquisition gate
The experiment template can be exported to FCAP Array software where it is
integrated with each sample experiment to ensure that the proper instrument
settings and compensation data are applied to all sample acquisitions.
For more information about performing instrument setup, refer to:
116
•
BD CBA Flex Set setup manual for BD FACSArray
•
BD FACSArray System User’s Guide
FCAP Array Software User’s Guide
Transferring the BD CBA Flex Set Template
New or updated BD CBA Flex Set templates are integrated with FCAP Array
software by copying the BD CBA Flex Set template to the FCAP Array software
Template folder.
1 Modify the BD CBA Flex Set template on the BD FACSArray bioanalyzer
with the optimized instrument settings that will be used for acquisition of
the bead assay. Refer to the BD CBA Flex Set setup manual for
BD FACSArray for information on modifying this file.
2 Copy the modified BD CBA Flex Set template XML file:
a
Open the folder
C:\Program Files\BD FACSArray System Software\templates
b
Identify and open your setup folder.
c
Copy the BD CBA Flex Set template XML file.
3 Paste the modified BD CBA Flex Set template XML file:
a
Open the folder C:\Program Files\Soft Flow\FCAP Array\Templates.
b
Paste the template XML file.
Chapter 6: Using FCAP Array Software with the BD FACSArray Bioanalyzer
117
Creating an FCAP Array Software Experiment
Before acquiring data, design your sample experiment using the Experiment
wizard in FCAP Array software. Skip the Clustering Parameters and Analyte
Assignment views at this time.
For more information about creating an FCAP Array software experiment:
•
see Creating an Experiment with the Experiment Wizard on page 71
•
refer to BD CBA Flex Set setup manual for BD FACSArray
Specifying the Plate Layout
When you create an FCAP Array software experiment, you specify the plate
layout that will be used for your standards and patient samples. This can done
either in the Plate Layout Options view of the Experiment Wizard, or with the
Plate view of the experiment document window after you exit the wizard. Before
specifying a plate layout, you should be familiar with any restrictions imposed by
the BD FACSArray bioanalyzer or by BD FACSArray system software.
For more information about specifying a plate layout see:
118
•
Plate Layout Options View on page 93
•
Plate View on page 113
•
BD CBA Flex Set setup manual for BD FACSArray
•
BD FACSArray System User’s Guide
FCAP Array Software User’s Guide
Generating and Exporting the XML Experiment
File
1 If needed, open your FCAP Array software experiment file.
2 Click the Plate Layout tab to display the Plate Layout view.
Figure 6-1 Reviewing the sample layout
3 Review the sample layout.
NOTICE Ensure that the Plate/Rack selection is 96 well plate. The
BD FACSArray bioanalyzer is not compatible with any other Plate/Rack
format.
Chapter 6: Using FCAP Array Software with the BD FACSArray Bioanalyzer
119
4 Click Export Experiment.
The Experiment Export Wizard opens in the Select Template view.
Figure 6-2 FACSArray Experiment Export Wizard: Select Template view
5 Select the BD CBA Flex Set template to be used to acquire the bead assay.
NOTICE Although an example BD CBA Flex Set template is installed with
FCAP Array software, it should only be used with tutorial exercises. Create
a current template by performing an instrument setup on your
BD FACSArray bioanalyzer and transferring the experiment template as
described in Transferring the BD CBA Flex Set Template on page 117. This
will ensure that the template file will have the correct instrument settings
for your acquisition.
120
FCAP Array Software User’s Guide
6 Click Next.
The wizard advances to the Set Stopping Rule view (Figure 6-3).
7 Set the number of events to be acquired.
The recommended value is 300 events per bead.
Figure 6-3 Set Stopping Rule view
NOTICE The number specified becomes approximately the average
number of events acquired per bead. This is because the total number of
events to be acquired is determined by multiplying the events per bead by
the number of beads.
For example, the suggested number of events to be acquired from a 23-plex
sample is 23 × 300 = 6,900.
Chapter 6: Using FCAP Array Software with the BD FACSArray Bioanalyzer
121
8 Click Next.
The wizard advances to the Select Folder view (Figure 6-4).
9 Click Browse.
A Browse for Folder dialog is displayed.
10 Navigate to a destination folder for the exported experiment file and click
OK.
Figure 6-4 Select Folder view
122
FCAP Array Software User’s Guide
11 Click Finish.
The wizard advances to the Complete view.
Figure 6-5 FACSArray Experiment Export Wizard: Complete view
12 Click OK.
A new folder has been created in the destination folder to hold the exported
XML experiment file. The new folder name is the name of the FCAP Array
software experiment.
Chapter 6: Using FCAP Array Software with the BD FACSArray Bioanalyzer
123
Preparing Samples
Prepare the standards and patients samples specified in your experiment. For
more information, refer to:
•
BD CBA Flex Set Technical Data Sheet
•
BD CBA Flex Set setup manual for BD FACSArray
Acquiring Data and Creating FCS 2.0 Data Files
In this step, you import the XML experiment file to BD FACSArray system
software, and use it to direct acquisition on the BD FACSArray bioanalyzer.
After acquiring, you create FCS 2.0 list-mode files for analysis in FCAP Array
software.
NOTICE Exported FCAP Array software XML experiment files are designed to
be used only with BD FACSArray system software. They cannot be used with
other BD software, for example, BD FACSDiva™ software.
1 If needed, transfer the exported XML experiment file to the computer with
BD FACSArray system software.
2 In BD FACSArray system software, select File > Import Experiments.
3 Navigate to the XML experiment file to be imported. Click on the file
(which looks like a folder) to select it, but do not open it.
4 Click Import.
The imported experiment is added to the database of BD FACSArray
software and appears in the Browser.
5 Open the imported experiment in the Browser of BD FACSArray system
software, and ensure that the sample layout of the experiment reflects the
layout in the plate to be loaded.
124
FCAP Array Software User’s Guide
NOTICE The sample layout in the Plate Layout view of the experiment
window, and the sample layout in the plate view displayed in
BD FACSArray system software should be identical.
6 Acquire the plate(s) containing the BD CBA Flex Set assay. For more
information, refer to:
•
BD CBA Flex Set setup manual for BD FACSArray
•
BD FACSArray System User’s Guide
7 Export the FCS 2.0 list-mode files from this experiment:
a
Select File > Export > FCS.
b
Choose FCS 2.0 as the file version to export.
c
If needed, transfer the FCS data files to the computer with FCAP Array
software for data analysis.
Analyzing the FCS 2.0 Data Files
Return to FCAP Array software to assign data files to experiment samples,
analyze the data, review the results, and finalize the experiment. See Chapter 7,
Data Analysis, for detailed instructions.
Chapter 6: Using FCAP Array Software with the BD FACSArray Bioanalyzer
125
126
FCAP Array Software User’s Guide
7
Data Analysis
This chapter describes the procedures used to analyze the sample data of an
FCAP Array software experiment.
For an outline of typical workflows, see FCAP Array Software Workflows on
page 18.
127
File Assignment View
Use FCAP Array software File Assignment view to assign FCS 2.0 data files to
corresponding experiment samples. FCAP Array software can read and analyze
valid FCS 2.0 list-mode data files produced from data acquisition on any flow
cytometry instrument. The acquired files need to be located in a single folder to
assign them to samples of an experiment.
1 Open a saved experiment file or create a new experiment file (see
Chapter 5, FCAP Array Experiment Design).
2 If needed, transfer the acquired FCS 2.0 data files from the acquisition
platform to the computer running FCAP Array software.
3 Select the File Assignment tab (experiment window) to display the File
Assignment view (Figure 7-1 on page 129). The view consists of three main
areas:
•
instrument information (top)
•
sample list (left)
•
data file list (right)
4 If test samples in the experiment were not acquired, or acquisition failed,
they can be deselected by clearing the checkbox to the left of the sample.
When a test sample is deselected, a note will appear indicating that the
sample was not acquired. Data files cannot be assigned to the deselected
sample names.
NOTICE If standard or control samples are deselected, the analysis will
fail. To delete a standard sample from the experiment, see Samples View on
page 112.
5 Click the Folder button and locate the folder containing the FCS 2.0 data
files for the experiment.
The FCS 2.0 file names are displayed, in the order in which they were
acquired, in the Data files list (Figure 7-1 on page 129).
128
FCAP Array Software User’s Guide
Figure 7-1 File Assignment view
6 Assign the Data files to the corresponding samples. Depending on how well
the files are ordered, use either one-step assignment, or manual assignment:
Use one-step assignment only if the sample order exactly matches the data
file order:
a
Verify that each FCS 2.0 data file name appears on the same line as the
corresponding sample name.
b
Select the top item in both lists and click
.
The view changes to indicate that all file names are assigned to the
corresponding sample names.
Chapter 7: Data Analysis
129
Use manual assignment when the sample order does not exactly match the
data file order:
a
In the sample list, select the first (top) sample name. Then select the
corresponding FCS data file name. Both names are highlighted.
b
Click
.
The view changes to indicate that the selected FCS data file is assigned
to its corresponding sample name.
c
Repeat step a and step b above until all samples (that have not been
deselected) are associated with data files.
7 Enter instrument name and serial numbers.
NOTICE The instrument name must exactly match the instrument name
specified on the Clustering Parameters view of the Experiment or Plex
Wizard. Otherwise, the data analysis cannot be completed.
When required information has been entered, the Start analyzing this
experiment icon becomes active.
Analysis
The FCAP Array software bead assay data analysis includes cluster
identifications, MFI value calculations, curve fittings, and individual analyte
concentration determinations.
To invoke the analysis, click the Start analyzing this experiment icon:
If the bead-cluster assignments are complete for each plex in the experiment, data
analysis begins (skip ahead to Analysis Messages Dialog on page 132).
130
FCAP Array Software User’s Guide
Bead-Cluster Assignment
If bead-cluster assignments are not complete for each plex in the experiment, a
dialog indicates that cluster assignment must be performed.
Figure 7-2 Bead-cluster assignment notification dialog
1 Click OK to continue with the bead-cluster assignment.
Otherwise, click Cancel to stop the analysis.
2 Selecting OK opens the Plex Modification Wizard, which duplicates the
Clustering Parameters and Analyte Assignment activities of the Experiment
Wizard.
Figure 7-3 Plex Modification Wizard
Chapter 7: Data Analysis
131
3 Complete the bead-cluster assignment. For more information, see the
instructions in Clustering Parameters View on page 80 and Analyte
Assignment View on page 82.
4 When the bead-cluster assignment is complete, click Finish to proceed with
the experiment analysis.
Analysis Messages Dialog
When the analysis is complete, the Analysis Messages dialog is displayed
(Figure 7-4 on page 132). Messages indicate the analysis status, including data
processing error messages. For details about specific analysis messages, see
Appendix D: Analysis Messages.
If an error involves a standard curve data file (one or more standard curves
cannot be fit), no test sample results can be calculated for the corresponding
analytes. See Chapter 9: Troubleshooting, for more information about restarting
an analysis after an error.
Use the drop down menu on the analysis Messages dialog to limit the types of
messages displayed.
Figure 7-4 Analysis Messages dialog
‘mp
132
FCAP Array Software User’s Guide
NOTICE When the mean fluorescence intensity (MFI) of a test sample lies
outside the range of MFIs of the standard samples, an Above the standard range
warning is displayed in the Analysis Messages dialog. Results are calculated for
the values outside the range by extrapolating the standard curves. Results further
out from the standard range are more susceptible to statistical error. Check the
corresponding MFI values in the Raw Data view to determine likelihood of error
(see Raw Data View on page 141).
1 If the message indicates the analysis finished without error, click OK to
dismiss the dialog.
Three new workspace tabs are now displayed:
•
Report Printout: shows the printout of the report document.
•
Standard Curves: allows inspection of the fitting curves and change of
the fitting model, if necessary.
•
Raw Data: shows the raw data of the analysis in table formats.
2 Save the experiment now to protect the bead assay results. This can be
done in either of two ways:
•
Select File > Save
•
Click the Save this experiment icon:
Chapter 7: Data Analysis
133
After an Analysis
After an analysis completes, you can:
•
view and print an experiment report (see Report Printout View, following)
•
inspect standard curves and apply alternate models (see Standard Curves
View on page 138)
•
inspect and export raw analysis data (see Raw Data View on page 141)
•
finalize the experiment (see Finalizing the Experiment on page 146)
Report Printout View
Click the Report Printout tab to display the experiment report in the default
format (Figure 7-5 on page 135).
Printing preferences determine the type, style, and size of the fonts to be used in
the report. For information about changing these settings, see Printing on
page 160.
You can select an alternate report format from the Templates pull-down menu.
134
FCAP Array Software User’s Guide
Figure 7-5 Report Printout view
Chapter 7: Data Analysis
135
Printing a Report
1 Click Page Setup to specify page information, choose a printer, and select
printer properties.
2 Click Print to print the displayed report (no Print dialog).
Editing Report Templates
Use the Printout Templates dialog to modify existing report templates or create
new templates.
1 Click Edit on the workspace Report Printout view. The Printout templates
dialog is displayed.
Figure 7-6 Printout Templates dialog
136
FCAP Array Software User’s Guide
With the Printout templates dialog you can:
•
highlight a template name and click Delete to delete that template.
•
highlight a template name and click Set as default to make that
template the default template.
•
set template options, enter the name of an existing template into the
Save As field, and click Save to modify an existing template.
•
set template options, enter the name of a new template into the Save As
field, and click Save to create a new template.
2 When finished, Click OK to close the dialog.
Chapter 7: Data Analysis
137
Standard Curves View
Click the Standard Curves tab to display the Standard Curves view in the
workspace (Figure 7-7). The standard curve for the first analyte of the first plex
in the experiment is shown.
To display other standard curves, use the Plex and Analyte pull-downs.
Figure 7-7 Standard Curves view
138
FCAP Array Software User’s Guide
Printing Standard Curves
To print one or more of the standard curves:
1 Select File > Page Setup to specify page information, choose a printer, and
select printer properties.
2 Click Print (in the Standard Curves view).
The Select Clusters to Print dialog is displayed (Figure 7-8).
3 Choose the bead analytes whose standard curves are to be printed by
marking their checkboxes, and click OK to print.
Figure 7-8 Select Clusters to Print dialog
Modifying a Curve Fitting Model
You can change the curve fitting model for a given bead, or for all beads in a
plex. However, since the fitting model is a plex component, changing the fitting
model defines a new plex. This is indicated by an asterisk added to the original
plex name. A new plex ID is automatically generated for the modified plex.
Chapter 7: Data Analysis
139
Changing a fitting model also changes the experiment ID. Before you change a
fitting model, you should save the experiment. This way you can easily return to
the original experiment and plex.
To change the curve fitting model for one or more beads in the currently selected
plex:
1 Select the Change model radio button in the Standard Curve view.
The associated pull-down model menu becomes active.
Figure 7-9 Changing the Curve Fit model
2 If the new fitting model should apply to every bead in the plex, enable
Uniform model by marking its checkbox.
3 Select a model from the pull-down menu.
The fitting equations and analyte concentrations are automatically
recalculated. The standard curve plot, equation, and parameters change to
reflect the new model.
140
FCAP Array Software User’s Guide
Raw Data View
With the Raw Data view, you can print, export, and graph the raw data, as well
as show a summary of individual cluster statistics.
Displaying Raw Data
1 Click the Raw Data tab to display the Raw Data view.
Figure 7-10 Raw Data view
Chapter 7: Data Analysis
141
2 Select the plex to be displayed from the Plex pull-down menu.
3 Select the data type to be displayed by clicking a data type tab:
Data Type Tab
Raw Data Displayed
MFI
Median of the fluorescence intensity of the reporting
parameter
Event Num
Event number of the selected cluster
SD
Standard deviation of the fluorescence intensity in the selected
cluster
%CV
Percentage coefficient of variance of the fluorescence intensity
in the selected cluster
Sample CC
Sample concentration calculated from the fitting curve.
Dilution factor is not applied
Final CC
Sample concentration calculated from the fitting curve with
dilution factor applied
Message
Reporting messages defined in the plex
Printing Raw Data
To print the currently displayed raw data:
1 Select File > Page Setup to specify page information, choose a printer, and
select printer properties.
2 Click Print.
142
FCAP Array Software User’s Guide
Exporting Raw Data
Raw data can be exported and saved as a comma delimited text file (comma
separated values format). This format allows you to import the data into
standard spreadsheet applications (example: Microsoft Excel) for further
processing.
1 Click Export in the Raw Data view to export the currently displayed data.
The Raw Data Export dialog is displayed.
Figure 7-11 Raw Data Export dialog
2 Select the sample types to be included in the exported document, choose
from the available Arrangement options, and click Continue.
3 Enter the file name for the exported file in the Save dialog that appears, and
click Save.
Chapter 7: Data Analysis
143
Displaying Histograms, Dot Plots, and Statistics
NOTICE To display histograms, dot plots, or individual cluster statistics, the
acquired list-mode data files must be accessible by FCAP Array software. (Plot
images and cluster statistics are not saved with the experiment.)
1 Select the plex to be displayed from the Plex pull-down menu.
2 Select the cell of the table that corresponds to the sample (row) and analyte
(column) of interest.
3 Click Histogram. A histogram or dot plot window for the selected sample
is displayed with the selected analyte cluster highlighted (Figure 7-12 on
page 145).
•
Right-click on an axis to change a plot parameter.
•
Right-click within the histogram view to select options from a
histogram display menu.
4 Click Statistics. A statistics window displays a summary of the cluster
statistics for the selected sample analyte (Figure 7-12 on page 145).
NOTICE The CC field of the statistics window corresponds to the
Sample CC column of the raw data table.
Saving a Plot as an Image
1 Right-click within the histogram view and select Save as Image from the
pop-up menu.
2 Enter the file name in the Save dialog box and click Save.
Locking a Plot or Statistics Window
The content of the plot and statistics windows corresponds to the selected cell of
the raw data table. The content is automatically updated if you select another
cell.
144
FCAP Array Software User’s Guide
Lock a plot or statistics window by clicking the lock icon located in the upperright corners of the windows. A locked window remains associated with its table
cell (sample and analyte) and does not update if you select another cell.
Open a plot or statistics window for another cell by selecting that cell and
clicking the Histogram or Statistics buttons. Any number of plot and statistics
windows can be displayed simultaneously.
Figure 7-12 Raw Data view with plot and statistics windows
Chapter 7: Data Analysis
145
Finalizing the Experiment
When analysis and review are complete, you can prevent additional
modifications to an experiment by finalizing it. The report generated and printed
from a finalized experiment is also locked. However, the format and the reported
data selection of a locked report can still be modified.
An internally generated ID is attached to the finalized experiment that cannot be
changed. This ID is written into all output documents generated by FCAP Array
software. In this way, the experimental setup and the data processing details can
be subsequently reviewed.
Experiments can be finalized only by users authorized to sign report documents
(see User Management on page 165). When an experiment is finalized, the
authorized user’s electronic signature is added to the experiment and report
documents. The authorized user’s name appears on the printed version of the
report document.
1 To finalize an experiment, select Tools > Finalize, or click the Finalize icon
in the application toolbar:
The Signing experiment dialog is displayed (Figure 7-13 on page 147).
146
FCAP Array Software User’s Guide
Figure 7-13 Signing experiment dialog
2 Choose your name from the Login name pull-down menu, enter your
password, and click OK.
The experiment is finalized as described.
NOTICE An authorized user must be selected, and password provided, to
finalize an experiment.
When an experiment is finalized, the Finalize icon in the toolbar is replaced with
a Lock icon to signify the locked status of this experiment:
Chapter 7: Data Analysis
147
148
FCAP Array Software User’s Guide
8
FCAP Array Software Management
This chapter describes a number of FCAP Array software features that add
flexibility to the software and enhance the core Experiment design and data
analysis features described in earlier chapters:
•
Maintaining the Bead Library on page 150
•
Maintaining the Plex Library on page 156
•
Preferences on page 160
•
User Management on page 165
•
Clustering Test Tool on page 169
149
Maintaining the Bead Library
The bead library is used when selecting beads for a plex. You maintain your bead
library with the options available in the Bead Library dialog.
The Bead Library dialog (Figure 8-1) can be accessed in any of the following
ways:
•
Select Tools > Bead Library.
•
Click Edit in the Plex Components view of any of the following wizards:
-
Experiment Wizard
-
New Plex Wizard
-
Plex Modification Wizard
Figure 8-1 Bead Library dialog
150
FCAP Array Software User’s Guide
Bead library tasks are discussed below. When finished, click OK to close the Bead
Library dialog. Actions performed with the dialog cannot be canceled.
In the View Options section, you can choose either the Analyte ID and Bead ID
view, or the Catalog # and Lot # view.
Adding Beads
You can choose from several methods to add beads to the bead library.
Manual Entry
To add a new bead using manual entry:
1 Enter Analyte ID, Bead ID in the Bead Information section.
2 OPTIONAL: Enter Catalog # and LOT #.
3 Click Add to add the bead to the bead library.
Importing a Bead Library
To add new beads by importing a bead library file:
1 Download an XML file containing bead information. Currently, these files
are found at the BD Biosciences website:
www.bdbiosciences.com/flexset
2 Save the XML file on your computer.
3 Click Import Bead Library.
The Import Bead Library dialog is displayed.
4 Navigate to the bead library XML file, and click Open.
The beads from the XML file are added to the local bead library.
Chapter 8: FCAP Array Software Management
151
Deleting Beads
To delete a bead, highlight the bead in the bead library and click Delete.
Bead Groups
Bead groups help you to easily access a predefined combination of beads from
your bead library. You can create bead groups consisting of any number of beads.
The Bead Groups dialog is used to create, delete, and modify plex groups.
To open the Bead Groups dialog (Figure 8-2), click Edit groups in the Bead
Library dialog.
Bead group tasks are discussed below. When finished, click OK to close the Bead
Groups dialog. Actions performed with the dialog cannot be canceled.
Figure 8-2 Bead Groups dialog
152
FCAP Array Software User’s Guide
Adding a New Bead Group
1 Click New group.
The New Bead Group dialog is displayed.
Figure 8-3 New Bead Group dialog
2 Enter the name of the new group and click OK.
The Bead Group dialog is displayed (Figure 8-4 on page 154).
Chapter 8: FCAP Array Software Management
153
Figure 8-4 Bead Group dialog
3 Choose the beads to be added to the bead group (checkboxes marked) and
click OK.
The new bead group appears in the bead group list (Figure 8-5 on
page 155).
Modifying a Bead Group
To modify the contents of an existing plex group:
1 Select a bead group from the Bead Groups dialog (Figure 8-2 on page 152)
and click Modify group.
The Bead Group dialog is displayed (Figure 8-4).
2 Choose the modified group of beads by marking and unmarking
checkboxes as needed. When finished, click OK.
154
FCAP Array Software User’s Guide
Figure 8-5 Updated Bead Groups dialog
Deleting a Bead Group
To delete a bead group, select it and click Delete group.
Organizing a Bead Group
The list of beads in a bead group can be reordered.
1 Open a bead group by clicking its plus sign box.
2 Select (highlight) a bead to move in the list.
3 Click the
and
buttons to move the beads up and down in the list.
Chapter 8: FCAP Array Software Management
155
Maintaining the Plex Library
The plex library is used to select a plex for an experiment. Recall, a plex specifies
the beads used in a bead assay, a standards set, and a bead-cluster assignment.
You maintain your plex library with the options available in the Saved Plex
Library dialog.
You can open the Saved Plex Library dialog (Figure 8-6) with either of the
following methods:
•
Select Plex > Plex Library.
•
Click the Plex Library icon in the application toolbar:
Figure 8-6 Saved Plex Library dialog
156
FCAP Array Software User’s Guide
The functions provided by the Saved Plex Library dialog are outlined in Table 8-1
below.
Table 8-1 Saved Plex Library tools
Button
Action
New Plex
Uses the New Plex Wizard to create a new plex (see Adding
a Plex to the Experiment on page 104).
Copy as Non-protected
Creates a non-protected copy of a protected plex. The
Saved Plex List Maintenance window uses different icons
for the protected and non-protected plexes.
Remove from Group
Removes a plex from a group.
Delete Plex
Deletes a plex.
View Printout
Displays the printout of the selected plex.
Import Plex
Imports a plex from a disk file.
Export Plex
Creates an export file from the selected plex that can be
imported by other FCAP Array software users.
New Group
Defines new plex group.
Modify Group
Modifies the contents of an existing plex group.
Delete Group
Deletes a plex group.
Rearranges the items of a plex list.
Close
Closes the Saved Plex List Maintenance dialog.
Chapter 8: FCAP Array Software Management
157
Creating a Plex Group
1 Click New Groups.
The New Plex Group dialog is displayed.
Figure 8-7 New Plex Group dialog
2 Enter a group name and click OK.
The Plex Group dialog is displayed.
Figure 8-8 Plex Group dialog
3 Choose the plexes to be associated with the group (mark the checkboxes).
4 Click OK.
The new group is now displayed in the Saved Plex Library dialog.
158
FCAP Array Software User’s Guide
Exporting Plex Documents
You can export plexes in a file to be imported by another FCAP Array software
user. In this way, laboratories can share plex definitions.
1 Select the plex to be exported by clicking the line containing the plex name.
The selected plex is highlighted.
2 Click Export Plex.
A Save As dialog is displayed.
Figure 8-9 Save As dialog box for exporting a plex group
3 Navigate to a folder for your exported file.
4 Enter a name for the exported file (or keep the default name).
5 Click Save.
Chapter 8: FCAP Array Software Management
159
Preferences
Precision
To set the number of significant digits shown in data tables:
1 Select File > Preferences > Precision.
The precision Preferences dialog is displayed.
Figure 8-10 Preferences dialog for precision settings
2 Set the number of decimal digits and click OK.
Printing
Printing preferences provide default print settings for:
•
reports
•
sample layout from the Plate view of an experiment (plate-tube assignment)
1 Open File > Preferences > Printing.
The Printing Preferences dialog is displayed (Figure 8-11 on page 161).
160
FCAP Array Software User’s Guide
Figure 8-11 Printing preferences dialog
2 In the Plate-tube assignment section, choose Colors or Patterns for sample
layout printing.
; Tip
The Patterns option is recommended for black-and-white printers.
3 Set the type, style, and size of the fonts to be used in reports.
4 Click the Show Preview button to preview your settings.
5 Click OK to close the dialog.
Chapter 8: FCAP Array Software Management
161
Fitting Accuracy
The Fitting Accuracy setting determines the degree of accuracy required when
fitting standard curves. Fitting accuracy is expressed by the regression coefficient,
whose values range from 0–1 (0%–100%). Fitting accuracy affects both the
feasibility and the number of computation iterations needed for a standard curve
fit.
1 Select File > Preferences > Fitting Accuracy.
The Fitting Accuracy dialog is displayed.
Figure 8-12 Fitting Accuracy dialog
2 Set or enter the fitting accuracy, and click OK. The default value is 98%.
NOTICE BD Biosciences recommends that the default value of 98% be used for
bead assay standard curve fits.
162
FCAP Array Software User’s Guide
Default Replicate Number
With the Default Replicate Number preference, you can set the default number of
sample replicates.
1 Select File > Preferences > Default replicate number.
The Set Default Replicate Number dialog is displayed.
Figure 8-13 Set Default Replicate Number dialog
2 Set the default, and click OK.
Chapter 8: FCAP Array Software Management
163
Additional Preferences
The following preferences are set without using additional dialogs.
Show Quick Start Dialog at Startup
You can choose whether to display the Quick Start dialog when you launch
FCAP Array software.
Toggle this preference by selecting File > Preferences > Show Quick Start Dialog
at Startup.
Show Wizard Advisor
You can choose whether to display the Wizard Advisor window during manual
experiment creation.
Toggle this preference by selecting File > Preferences > Show Wizard Advisor.
164
FCAP Array Software User’s Guide
User Management
NOTICE Only a user with Administrator rights can modify the user list and the
status of users.
To access the User Management dialog (Figure 8-15 on page 166), select Tools >
User Management.
If the current user does not have Administrator rights, the Authentication to user
management dialog is displayed.
Figure 8-14 Authentication to user management dialog
If an administrator name and password is successfully entered, the User
Management dialog is obtained.
Chapter 8: FCAP Array Software Management
165
Figure 8-15 User Management dialog
User management tasks are discussed below. When finished, Click OK to close
the User Management dialog.
Adding a New User
1 Enter a Login name and Full name for the new user.
2 Enable the appropriate special rights options by marking their checkboxes:
•
Administrator: access to the user management tools.
•
Sign: authorization to sign and finalize an experiment.
Users without special rights can use all FCAP Array software features
except user management and finalizing an experiment.
166
FCAP Array Software User’s Guide
3 Click Add to add the new user to the user database. The new user’s Full
name appears in the List of Users on the left side of the dialog (Figure 8-15
on page 166).
4 Set the default password as described below.
Setting a Default Password
This feature is used both to set an initial password for a new user, and to set a
new password for a user who has forgotten.
1 Select a user from the List of Users.
The selected name becomes highlighted.
2 Click Set Password.
The Change Password dialog is displayed.
Figure 8-16 Change Password dialog
3 Enter and verify the password.
4 Click OK.
NOTICE The password can be subsequently changed by the user by
selecting Tools > Change Password.
Chapter 8: FCAP Array Software Management
167
Removing a User
1 Select a user from the List of Users.
The selected name becomes highlighted.
2 Click Remove.
Modifying a User
1 Select a user from the List of Users.
The selected name becomes highlighted.
2 Click Modify.
3 Enter changes to Login name and Full name and Rights.
4 Click Add.
168
FCAP Array Software User’s Guide
Clustering Test Tool
The Clustering Test tool displays the clusters in a list-mode data file, and can list
FCS 2.0 file header information.
1 Select Tools > Clustering Test.
The Clustering Test dialog is displayed.
2 Click Load Data File and navigate to an FCS 2.0 data file to be tested.
Figure 8-17 Clustering Test dialog
3 Select the Scatter Parameter and the Clustering Parameters.
The clustering procedure is applied to the data and the identified clusters
are displayed.
Chapter 8: FCAP Array Software Management
169
4 To view file header information, click the File Header tab.
Figure 8-18 Clustering Test dialog: File Header
170
FCAP Array Software User’s Guide
Viewing the Daily Logs
FCAP Array software maintains a daily log of user activity. You can view the
daily logs with the View Logs dialog.
Open the View Logs dialog (Figure 8-19) with either of the following methods:
•
Select File > View Logs.
•
Click the View Logs icon in the application toolbar:
To copy the text from a daily log:
1 Make a text selection with the mouse.
2 Right-click on the text and select Copy.
Figure 8-19 View Logs dialog
Chapter 8: FCAP Array Software Management
171
172
FCAP Array Software User’s Guide
9
Troubleshooting
The tips in this section are designed to help you troubleshoot problems with
FCAP Array software.
If additional assistance is required, contact your local BD Biosciences technical
support representative. See Technical Assistance on page xii.
173
.
Troubleshooting
Observation
Possible Causes
Recommended Solutions
User cannot log in.
The user name is incorrect.
Check caps lock. Re-type your
user name.
The user name is forgotten.
The software administrator can
determine your user name.
The password is incorrect.
Check caps lock. Re-type your
password.
The password is forgotten.
The software administrator can
reset your password.
Acrobat® Reader® software
is not installed.
Download and install the free
version of Acrobat Reader
(www.adobe.com).
The user’s guide PDF was not
installed with the software.
Re-run the FCAP Array installer.
Choose Modify and select User’s
Guide.
A plex cannot be
modified in Experiment
Wizard or Samples view.
The plex is protected.
With the Saved Plex Library
dialog, make a non-protected
copy of the plex.
Experiment cannot be
edited.
The experiment is finalized
(locked).
Make a copy of the finalized
experiment.
Dilution factor not
applied to calculated
concentrations in the
Raw Data View.
This is the intended behavior
of the Raw Data View.
The Report Printout view contains
a table for sample results that
applies dilution factors.
I/O error when opening a
saved experiment.
The experiment file was renamed or moved.
Find the re-named or re-located
file and open it with File > Open
existing experiment.
New bead cannot be
added to the bead
library.
Catalog number already
exists in the bead library.
Make corrections to the bead
identifiers.
User’s guide does not
open from Help menu.
174
FCAP Array Software User’s Guide
Troubleshooting (continued)
Observation
Possible Causes
Recommended Solutions
A plot or statistics
window in the Raw Data
view cannot be changed
or updated.
The plot or statistics window
has been locked.
Unlock the plot or statistics
window by clicking on the lock
icon in the upper right corner of
the window.
Unexpected analysis
results.
Using saved fitting curves.
BD Biosciences recommends
calculating new standard curves
for every experiment.
Software extrapolates
inaccurate values above or
below the standard curve.
Dilute the sample concentration
within the range of the standards.
Single-color and dual-color
beads in the same experiment.
Single-color and dual-color beads
require different instrument
setups.
Experiment sample layout
does not match actual sample
layout.
Correct experiment layout, redo
file assignment, and reanalyze.
Incorrect bead information in
bead library
Correct the information.
Incorrect file assignment.
Review acquisition sample order.
Correct file assignment and
reanalyze.
Too much debris in one or
more samples.
Use another application (eg, BD
CellQuest) to create a gated data
file that excludes the debris.
Import bead list from an XML file
to avoid entry errors.
Chapter 9: Troubleshooting
175
Troubleshooting (continued)
Observation
Possible Causes
Recommended Solutions
Unable to fit standard
curves.
One or more standard
samples failed.
• If the experiment plex is nonprotected, remove failing
standards (see Tip on page 88,
and Samples View on
page 112), then re-analyze.
If the experiment plex is
protected, create an
unprotected copy (see
Maintaining the Plex Library
on page 156), replace the
experiment plex using the
Experiment View (see
page 103), and then modify the
plex as described above.
• Acquire another standard
sample set.
Cannot analyze data file.
Choice of fitting curve does
not model the standard
sample data.
Choose another fitting curve. BD
Biosciences suggests 4 parameter
and 5 parameter logistic curves for
most beads.
Fitting accuracy is too high.
Lower the fitting accuracy setting
with File > Preferences > Fitting
Accuracy.
Sample preparation error.
Prepare and acquire new standard
sample set.
Experiment standard sample
layout does not agree with
actual layout.
Correct experiment layout, redo
file assignment, and reanalyze.
Corrupt or incorrect FCS file
format (eg, FCS 3.0).
Use FCS 2.0 list-mode data files
only.
Re-export list mode data files
from instrument system in
FCS 2.0 format.
176
FCAP Array Software User’s Guide
Troubleshooting (continued)
Observation
Possible Causes
Recommended Solutions
Standard concentrations
value is rejected.
Standard concentrations not
allowed between 0 and 1.
Change the units.
When analyzing, get
message: ‘Cluster
positions are not
defined... Press OK to
define now or press
Cancel to abort analysis.’
The bead–cluster assignment
was not completed during
plex definition.
Press OK and perform
bead–cluster assignment.
During plex definition,
clustering fails, or
incorrect number of
clusters found
User loads a data file from the
wrong experiment.
Load a data file from the correct
experiment.
Wrong scatter or clustering
parameters specified.
Specify the correct parameters.
Incorrect instrument settings.
Correct the instrument settings so
that clusters are in expected
locations.
Follow the instrument set up
procedures described in the
BD CBA Flex Set setup manual for
your instrument.
BD CBA FlexSet beads are
not properly aligned in the
data files due to incorrect
instrument settings in the BD
FACSArray template.
The template associated with the
experiment should be less than
one month old and from the same
instrument that is used to acquire
the samples.
Instrument name specified in
the plex does not match
Instrument name specified in
File Assignment.
Check instrument name spellings.
A plex is defined for acquisition
on one or more instruments. The
experiment must be acquired on a
supported instrument.
Chapter 9: Troubleshooting
177
Troubleshooting (continued)
Observation
Possible Causes
Recommended Solutions
BD FACSArray cannot
acquire with experiment
created from exported
FCAP Array software
experiment.
Exported FCAP experiment
was associated with a non-BD
FACSArray template.
Export a FCAP Array software
experiment associated with a BD
FACSArray template.
FCAP Array experiment
specified a 384 well plate or
rack layout.
The BD FACSArray bioanalyzer
supports only 96 well plates.
Correct the plate layout and retry.
A standard sample was
deselected on the File
Assignment view.
Ensure that all standard samples
are selected on the File
Assignment view. Rather than
deselect an unwanted standard
sample, use the Samples view of
the Experiment window to delete
it. See Deleting a Standard Sample
on page 112.
Curve fitting failed for
all analytes.
178
FCAP Array Software User’s Guide
Appendix A
Glossary
The following terms are defined as they are used in FCAP Array software and
this user’s guide.
Term
Description
batch plex
An experiment plex that calculates standard curves from newly
acquired standard samples. The standard curves are then used to
measure analyte concentrations for multiple test samples.
bead
An analyte-specific capture particle with distinctive, discrete
fluorescence characteristics (all instances of a bead bind the same
analyte and have the same fluorescence characteristics).
Also, an FCAP Array software construct that specifies the analyte
binding and fluorescence characteristics of a bead.
bead assay
A method of using beads and reporter antibodies to detect or
measure the concentration of analytes in a sample.
bead group
A subset of the beads in the bead library.
bead library
A structure used to organize the beads available for use, consisting
of the bead list and the bead groups.
bead list
The set of all beads contained in the bead library.
CC
Calculated concentration of analyte in a sample.
179
Term
Description
cluster
A population of events in a bead assay data file. Each cluster
corresponds to a bead, therefore, the events in a cluster have a
distinctive, discrete fluorescence characteristic.
clustering
The process of determining the clusters (bead populations) in a
data file.
clustering
parameters
The parameters used to measure the distinctive fluorescence
characteristics of beads.
control sample
A sample of known concentration (or fluorescence intensity) added
to a bead assay to verify the accuracy of the calculations.
experiment
A bead assay.
Also, formalizations or file representations of a bead assay,
including an FCAP Array software construct that defines the
plex(es), standards, controls, and test samples for a bead assay.
Experiment
Wizard
An FCAP Array software interface that facilitates the design phase
of experiment development.
FCS data file
The Flow Cytometric Standard for recording the data from a
cytometry acquisition. FCAP Array software requires data files
that conform to the FCS 2.0 specification.
Fitting Accuracy
The regression coefficient obtained from a curve fit, defined in the
range 0 to 1 (0% to 100%), with 1 being a perfect fit. An FCAP
Array software preference allows the user to specify a minimum
acceptable fitting accuracy in the range 90% to 100%.
MFI
The median of the fluorescence intensities measured from a
population (cluster).
Negative control
sample (NS)
Negative sample for a qualitative analysis.
plex
One or more beads used in a bead assay.
Also, an FCAP Array software construct that specifies a plex, a
standards set, and a bead-cluster assignment.
plex group
180
A subset of the plexes in the plex library.
FCAP Array Software User’s Guide
Term
Description
plex library
A structure used to organize the plexes available for use, consisting
of the plex list and the plex groups.
plex list
The set of all plexes contained in the plex library.
plex wizard
One of several equivalent FCAP Array software interfaces used to
define a plex.
Positive control
sample (PS)
Positive sample for a qualitative analysis.
Qualitative
analysis
Bead assay that detects the presence of one or more analytes in a
sample.
Quantitative
analysis
Bead assay that measures the concentration of one or more
analytes in a sample.
Random plex
An experiment plex with predetermined standard curves used to
measure analyte concentrations for a test sample.
BD Biosciences does not support the use of random plexes with
FCAP Array software.
replicate(s)
One or more copies of a sample. When more than one replicate of
a sample is used, the replicate results are averaged to determine the
result reported for the sample.
Reporting
Messages
User defined custom messages used to report information about an
analysis.
Reporting
Parameter
The parameter used to measure the fluorescence intensity
indicating the concentration of analyte in a sample.
sample
A solution containing analytes to be measured by a bead assay. A
sample can be a test, a standard, or a control.
Standard
deviation (SD)
FCAP Array software reports the standard deviation of the
fluorescence intensity in a selected cluster.
standard sample
One of several samples of known analyte concentration used to
calculate the standard curves used to measure analyte
concentration in test samples.
(test) sample
A sample with unknown concentration of analytes.
Appendix A: Glossary
181
182
FCAP Array Software User’s Guide
Appendix B
User Interface Reference
This chapter contains images and descriptions of the FCAP Array software
experiment window user interface elements.
183
Application Menus
File Menu
184
File Menu Item
Description
New Experiment
Opens a new, empty experiment
document, and displays the General
Information view.
New Experiment Wizard
Opens the Experiment Wizard with a new,
empty experiment document.
Create Copy of Experiment
Creates a copy of the currently open
experiment document. Opens the Copy
experiment dialog which allows you to
clear the sample specifications and/or
disable the standards.
Open Existing Experiment
Opens a previously saved experiment
document.
FCAP Array Software User’s Guide
File Menu Item
Description
Save
Saves the open experiment document.
Save As
Allows you to save the open experiment
document into another experiment file.
Page Setup
Opens the Page Setup dialog box that
allows you to set printing options such as
paper size, margins, orientation, etc.
Print Report
Opens a Print dialog for printing the
report document of the open experiment.
View Logs
Opens the Log View window and displays
the automatically saved log information
(user activity) recorded on a selected date.
Preferences > Precision
Opens the Precision dialog box and allows
you to set the number of decimals to be
shown.
Preferences > Printing
Opens the Printing preferences dialog and
allows you to chose the printing options of
the report document printouts.
Preferences > Fitting Accuracy
Opens the Fitting Accuracy dialog box
and allows you to set the statistical
accuracy criteria of standard curve
fittings.
Preferences > Default Replicate Number
Opens the Replicates dialog box and
allows you to set the default number of
standard and sample replicates.
Preferences > Show Quick Start Dialog at
Startup
Enables the Quick Start dialog
Preferences > Show Wizard Advisor
Enables the Wizard Advisor
Preferences > Barcode Reader
Opens the Barcode reader settings dialog
(not supported).
<numbered experiment filename>
Opens the recent experiment document.
Appendix B: User Interface Reference
185
File Menu Item
Description
Log out <User>
Allows the current user to log out and
another user to log in.
Exit
Quits FCAP Array software.
Experiment Menu
186
Experiment Menu Item
Description
Analyze
Starts the data analysis of the open
experiment. This menu item is active after
data files have been assigned to the
samples.
Analysis Messages
Opens the current Analysis Messages
dialog for the open experiment.
Finalize
Finalizes the open experiment. The
settings of a finalized experiment cannot
be changed. This menu item is active after
the data has been analyzed.
Printout Templates
Opens the Printout templates dialog and
allows you to design your customized
report document format.
Export Experiment
Opens the FACSArray Experiment Export
Wizard.
FCAP Array Software User’s Guide
Plex Menu
Plex Menu Item
Description
Define a new plex
Opens the New Plex wizard.
Import saved plex
Opens the Import FCAP Array plex dialog
and allows you to import a plex template
that has been exported.
Plex Library
Opens the Saved Plex Library dialog and
allows you to organize the plex library
items.
Appendix B: User Interface Reference
187
Tools Menu
188
Tools Menu Item
Description
Change password
Opens the Change Password dialog and
allows to change the password of the
currently logged in user.
User management
Opens the User management dialog and
allows to add or delete authorized FCAP
Array users. This menu is active only if the
logged in user has administrator
privileges.
Bead Library
Opens the Bead Library dialog which
provides tools to maintain the Bead
Library.
Clustering test
Opens the Clustering Test dialog and
allows you to check the number of clusters
found in a FCS 2.0 list mode data file. The
Clustering Test dialog can also display
FCS file header information.
FCAP Array Software User’s Guide
Help Menu
Help Menu Item
Description
User’s Guide
Opens the FCAP Array Software User’s Guide PDF.
Online Support
Opens the FCAP Array software support web site.
Online BD FlexSet Support
Opens the BD FlexSet support web site.
Online Tutorial
Opens the FCAP Array software tutorial web site.
Online Registration
Opens the FCAP Array software registration web site.
About
Opens the FCAP Array software About box.
Appendix B: User Interface Reference
189
Application Toolbar
Finalize Experiment
Open Log
Print Report
Start Analysis
Open Plex Library
Import Plex Template
Open New Plex Wizard
Copy Experiment
Save Experiment
Open Experiment
New Experiment Wizard
Icon
Tool Description
Opens the Experiment Wizard with a new, empty experiment document.
Opens a previously saved experiment document.
Saves the open experiment document.
Creates a copy of the currently open experiment document. Opens the Copy
experiment dialog which allows you to clear the sample specifications and/or
disable the standards.
190
FCAP Array Software User’s Guide
Icon
Tool Description
Opens the New Plex wizard.
Opens the Import FCAP Array plex dialog and allows you to import a plex
template that has been exported.
Opens the Saved Plex Library dialog and allows you to organize the plex library
items.
Starts the data analysis of the open experiment. This icon is active after data
files have been assigned to the samples.
Prints the report document of the open experiment.
Opens the Log View window and displays the automatically saved log
information (user activity) recorded on a selected date.
Finalizes the open experiment. The settings of a finalized experiment cannot be
changed. This menu item is active after the data has been analyzed.
Appendix B: User Interface Reference
191
Workspace Views
192
Workspace View
Functionality
General Information
View and edit the experiment name, the date it was
created, the creator, and lab information.
Experiment
View and edit plexes and samples.
Sample
Delete a standard sample.
Plate Layout
View, edit, and print the experiment plate layout.
File Assignment
Assign FCS data files to the experiment samples prior to
data analysis.
Report Printout
View, format, and print the analysis report document.
Standard Curves
View the standard curves for each analyte. Modify the
standard curve model.
Raw Data
View raw analysis data in a table format. Generate plots
and statistics. Print and export data.
FCAP Array Software User’s Guide
Appendix C
Analysis Parameters
The following table specifies the analysis parameters used by BD cytometers for
bead assays.
Instrument
Default
Scatter
Parameter
No. of
Scatter
Peaks
Clustering
Parameters
Reporter
Parameter
BD FACSArray
SSC-W
1
Red-A and NIR-A
Yellow-A
SSC-W
1
APC-A and APC-Cy7
PE-A
SSC-H
1
FL4-H and FL3-H
FL2-H
BD FACSCanto™
BD™ LSR II
BD FACSAria™
BD FACSCalibur™
s
193
194
FCAP Array Software User’s Guide
Appendix D
Analysis Messages
Message Text
Meaning
The analysis finished without any
error.
There was no error during the analysis of the
experiment
Loading of saved standard curve
failed.
Saved curves were specified for the plex, but
the loading of the curves failed.
Standard has no successful replicate.
All replicates of a standard failed, therefore it
cannot be used for curve fitting.
Concentrations cannot be calculated
due to failure of standard samples.
No concentration calculation could be
performed for a plex as one or more standard
sample failed.
Curve fitting failed for analytes:
[Analytes].
The standard curves for the listed analytes did
not meet the fitting accuracy requirement (see
Fitting Accuracy on page 180).
[Control] has no successful replicate.
All replicates of a control failed, therefore the
acceptance criteria cannot be tested for that
control.
Negative/Positive Standard has no
successful replicate.
All replicates of a standard failed, therefore
cutoff value calculation cannot be performed.
All replicates of the sample failed.
All replicates of the sample failed, therefore
concentration calculations cannot be
performed.
195
196
Message Text
Meaning
[Analyte] has no successful estimation
in replicates.
Estimation for the analyte could not be
performed in any replicate of the sample.
Failed at: [Analytes]
The control sample's calculated concentration
falls out of the acceptance range.
Error opening the data file.
Data file of the replicate could not be opened
(missing or corrupted data file).
The data file is incompatible with the
instrument definition.
The parameter names in the data file of the
replicate differ from the parameters selected
on Clustering Parameters.
Scatter gating failed.
The required number of scatter gates could
not be found in the data file of the replicate.
Number of found clusters differs
from required.
The clusters found in the data file of the
replicate differs from the number of beads in
the plex.
Clustering failed due to changes in
cluster positions.
The cluster positions strongly differ in the
data file of the replicate from the positions
used in the definition of the plex.
Cluster assignment failed.
The cluster—bead assignment failed in the
data file of the replicate.
[Analyte] is out of range.
Concentration cannot be calculated because
the replicate's MFI value falls outside of the
standard curve's invertible range.
[Analyte] is below the standard
range.
The calculated concentration is less than the
lowest standard's nominal value.
[Analyte] is above the standard range.
The calculated concentration for some sample
is greater than the highest standard's nominal
value.
FCAP Array Software User’s Guide
Index
Numerics
96-well plate compatibility
119
A
adding
bead group 153
beads
by importing 151
manually 151
troubleshooting 174
new user 166
plexes 104
test samples 103, 108
All Samples, dilution setting 36, 46, 76,
88
analysis, troubleshooting 175
analyte binding 16
analyzing bead assays 18
Application toolbar 190
assigning
beads to clusters 131
data files to samples
manually 130
one-step 129
FCS 2.0 data files 128
plex beads to clusters 43, 82
B
batch plex 179
BD Biosciences technical assistance
BD CBA Flex Set template 120
copying to FCAP Array 117
BD FACSArray
analysis workflow 20
importing XML file 124
bead
assay 179
design and analysis 18
overview 16
workflows 18
cluster assignment 83, 131
defined 179
deleting 152
group
adding 153
defined 179
deleting 155
modifying 154
organizing 155
library 39
adding beads 151
bead groups 152
defined 179
dialog 150
maintaining 150
list 179
problems adding to library 174
specifying for plex 78
verifying cluster assignment 46
xii
197
C
D
calculating cutoff value 90
CC
defined 179
field 144
cluster
defined 180
positions, troubleshooting 177
statistics, displaying 144
clustering parameters 180
Clustering Test tool 169
COI See cutoff index
color
display requirements 22
printing 161
column by column sample layout 94
compatibility, plate/rack format with
FACSArray 119
concentrations, standard 86
control sample 180
copying
an experiment 101
BD CBA Flex Set template 117
creating
experiment 100
with wizard 71
message flags with wizard 92
new plex with wizard 37, 77
plex group 158
curve fitting
modifying model 139
recommended value 162
cutoff
index (COI) 90
value calculation 90
daily logs 171
data analysis
scope 130
troubleshooting 175
data file
assignment
manual 130
one-step 129
troubleshooting 176
data first workflow 19
ordering test samples 74
tutorial 31
default parameters, instrumentspecific 81
Default Replicate Number 163
defining plex, troubleshooting 177
definition of terms 179
deleting
bead group 155
beads 152
plexes 103, 105
standard sample 112
test sample 111
design first workflow
with BD FACSArray 20
designing bead assays 18
dilution
factor
entering with wizard 36, 75
troubleshooting 174
setting, All Samples 46, 76, 88
dilution setting, All Samples 76
dot plots, displaying 144
198
FCAP Array Software User’s Guide
E
F
electronic signature on experiment 146
equation, cutoff value 90
events, recommended value 121
exiting Experiment Wizard 73
experiment
attached ID 146
copying 101
creating 100
creating with wizard 71
defined 180
electronic signature 146
menu 186
opening 54
overview 70
problem modifying 174
qualitative analysis wizard view 86
quantitative analysis wizard view 85
reviewing settings 95
saving 100
Experiment Export Wizard 120
Experiment Wizard
creating an experiment 71
exiting 73
navigating 72
optional plex views 72
qualitative view 86
quantitative view 85
reviewing experiment settings 95
specifying plex beads 78
Test Samples view 74
vs experiment window 98
exporting raw data 143
FACSArray See BD FACSArray
FCAP Array
configuration requirements 22
exported experiment problem 178
File Assignment view 128
installing 23, 24
launching 26, 32
limitations xiii
password 26
QuickStart dialog 27
support contact xii
Canada xii
Soft Flow, Hungary xii
troubleshooting 173
tutorial 31
user name 26
workflows for bead assays 18
FCS (Flow Cytometry Standard)
2.0 file
assigning 128
testing 169
2.0 format 16
3.0 format 176
data file 180
file troubleshooting 176
File Assignment view, FCAP Array 128
file header information 170
File menu 184
fitting
accuracy
defined 180
setting 162
equation, specifying 47
model, modifying 139
fonts in reports 161
Index
199
G
M
glossary of terms
179
message flags 92
MFI 180
modifying
bead group 154
plexes 106
user privileges 168
H
Help menu 189
histograms, displaying
144
I
N
I/O error 174
icon descriptions 190
ID, attached to experiment 146
installation, FCAP Array 23, 24
instrument settings, verifying 120
New Plex Wizard 104
number of events, recommended
x
P
L
launching FCAP Array 26, 32
limitations, software xiii
Lock icon 145
locking plot or statistics window
login troubleshooting 174
logs, daily 171
200
O
opening a saved experiment 54
operating systems validated for
software 22
K
keyboard, text conventions
121
144
FCAP Array Software User’s Guide
parameters, specifying 80
password
FCAP Array 26
setting default 167
Pentium processor requirement
plate layout
options 51
view 113
with wizard 93
22
plex
adding 104
bead-cluster assignment 43, 82
defined 180
defining 37
deleting 105
deleting from experiment 103
exporting 159
group 180
creating 158
library 156, 181
list 181
loading data files 80
menu 187
modifying 77, 106
overview 70
saving 95
selecting for experiment 77
specifying beads 78
specifying parameters 80
troubleshooting 174, 177
wizard 181
plot, saving as image 144
precision preferences 160
preferences
additional 164
Default Replicate Number 163
fitting accuracy 162
precision 160
printing 160
printing
colors, patterns 161
preferences 160
raw data 142
standard curves 139
Printout templates dialog 137
Q
qualitative analysis
defined 181
Experiment Wizard view
overview 17
quantitative analysis
defined 181
Experiment Wizard view
overview 17
Quick Start dialog 27
disabling 27
86
85
R
RAM requirements 22
raw data
exporting 143
printing 142
Raw Data view 141
troubleshooting 175
ReadMe file location ix
regression coefficient 162
removing a user 168
reordering a bead group 155
replicates 181
entering 75
standard 86
Reporting Messages 181
Reporting Parameter 181
reports
alternate format 134
choosing fonts 161
editing templates 136
requirements, FCAP Array
configuration 22
row by row sample layout 94
Index
201
S
sample
defined 181
layout
plate view 113
with wizard 93
standard 86
Saved Plex Library tools 157
saving
experiments 100
plexes, with wizard 95
plot as image 144
Setup.exe icon 23
Soft Flow contact xii
software See FCAP Array
specifying
beads for plex 43
dilution factors 36
fitting equation 47
plate layout with wizard 93
qualitative analysis, expected
concentrations 91
quantitative analysis
expected concentrations 91
standard concentrations 48
standards 86
tube layout with wizard 93
standard concentrations
specifying 48
troubleshooting values 177
units 88
standard curve 17
fitting accuracy 162
printing 139
recommended value 162
troubleshooting 176
Standard Curves view 138
202
FCAP Array Software User’s Guide
standard sample
defined 181
deleting 112
standards, specifying
qualitative analysis 89
quantitative analysis 86
support, software xii
T
technical assistance xii
template report, editing 136
test sample
adding 103, 108
changing name with wizard 75
defined 181
deleting 111
entering info 34
Test Samples view 74
text, keyboard conventions x
Tools menu 188
troubleshooting FCAP Array 173
tube layout with wizard 93
tutorial, FCAP Array 31
U
user
activity log 171
adding 166
list, modifying 165
name, FCAP Array 26
privileges, modifying 168
removing 168
user’s guide, problem opening 174
V
validated operating systems 22
verifying bead-cluster assignment
46
W
wizard vs experiment window 98
wizards
Experiment Export Wizard 120
Experiment Wizard 71
New Plex Wizard 104
Plex Modification Wizard 106
workflow
BD FACSArray 20
data first 19
tutorial 31
workspace views 192
X
XML file
bead library 151
copying 117
Index
203
204
FCAP Array Software User’s Guide