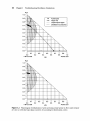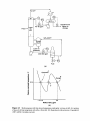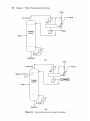
1
Distillation
Troubleshooting
Henry Z. Kister
Fluor Corporation
AlChE ®
iWILEYINTERSCIENCE
A JOHN WILEY & SONS, INC., PUBLICATION
This page intentionally left blank
Distillation
Troubleshooting
This page intentionally left blank
Distillation
Troubleshooting
Henry Z. Kister
Fluor Corporation
AlChE ®
iWILEYINTERSCIENCE
A JOHN WILEY & SONS, INC., PUBLICATION
DISCLAIMER
The author and contributors to "Distillation Troubleshooting" do not represent, warrant, or otherwise
guarantee, expressly or impliedly, that following the ideas, information, and recommendations outlined in
this book will improve tower design, operation, downtime, troubleshooting, or the suitability, accuracy,
reliability or completeness of the information or case histories contained herein. The users of the ideas,
the information, and the recommendations contained in this book apply them at their own election and at
their own risk. The author and the contributors to this book each expressly disclaims liability for any loss,
damage or injury suffered or incurred as a result of or related to anyone using or relying on any of the
ideas or recommendations in this book. The information and recommended practices included in this
book are not intended to replace individual company standards or sound judgment in any circumstances.
The information and recommendations in this book are offered as lessons from the past to be considered
for the development of individual company standards and procedures.
Copyright ©2006 by John Wiley & Sons, Inc. All rights reserved.
Published by John Wiley & Sons, Inc., Hoboken, New Jersey.
Published simultaneously in Canada.
No part of this publication may be reproduced, stored in a retrieval system, or transmitted in any form
or by any means, electronic, mechanical, photocopying, recording, scanning, or otherwise, except as
permitted under Section 107 or 108 of the 1976 United States Copyright Act, without either the prior
written permission of the Publisher, or authorization through payment of the appropriate per-copy fee to
the Copyright Clearance Center, Inc., 222 Rosewood Drive, Danvers, MA 01923, 978-750-8400,
fax 978-646-8600, or on the web at www.copyright.com. Requests to the Publisher for permission should
be addressed to the Permissions Department, John Wiley & Sons, Inc., 111 River Street, Hoboken,
NJ 07030, (201) 748-6011, fax (201) 748-6008, or online at www.wiley.com/go/permission.
Limit of Liability/Disclaimer of Warranty: While the publisher and author have used their best efforts in
preparing this book, they make no representations or warranties with respect to the accuracy or
completeness of the contents of this book and specifically disclaim any implied warranties of
merchantability orfitness for a particular purpose. No warranty may be created or extended by sales
representatives or written sales materials. The advice and strategies contained herein may not be suitable
for your situation. You should consult with a professional where appropriate. Neither the publisher nor
author shall be liable for any loss of profit or any other commercial damages, including but not limited to
special, incidental, consequential, or other damages.
For general information on our other products and services please contact our Customer Care Department
within the U.S. at 800-762-2974, outside the U.S. at 317-572-3993 or fax 317-572-4002.
Wiley also publishes its books in a variety of electronic formats. Some content that appears in print, may
not be available in electronic format. For more information about Wiley products, visit out web site at
www.wiley.com.
Library of Congress Cataloging-in-Publication Data:
Kister, Henry Z.
Distillation troubleshooting / Henry Z. Kister.
p. cm.
Includes bibliographical references.
ISBN-13 978-0-0471-46744-1 (Cloth)
ISBN-10 0-471-46744-8 (Cloth)
1. Distillation apparatus—Maintenance and repair. I. Title.
TP159.D9K57 2005
660'.28425—dc22
2004016490
Printed in the United States of America
10 9
8 7
6 5
To my son, Abraham and my wife, Susana, who have been my
love, inspiration, and the lighthouses illuminating my path,
and to my life-long mentor, Dr. Walter Stupin - it is easy to rise
when carried on the shoulders of giants.
This page intentionally left blank
Contents
Preface
xxiii
Acknowledgments
xxvii
How to Use this Book
Abbreviations
xxix
xxxi
1. Troubleshooting Distillation Simulations
1
2. Where Fractionation Goes Wrong
25
3. Energy Savings and Thermal Effects
61
4. Tower Sizing and Material Selection Affect Performance
73
5. Feed Entry Pitfalls in Tray Towers
97
6. Packed-Tower Liquid Distributors: Number 6 on the
Top 10 Malfunctions
111
7. Vapor Maldistribution in Trays and Packings
133
8. Tower Base Level and Reboiler Return: Number 2 on the
Top 10 Malfunctions
145
9. Chimney Tray Malfunctions: Part of Number 7 on the
Top 10 Malfunctions
163
10. Draw-Off Malfunctions (Non-Chimney Tray) Part of Number 7
on the Top 10 Malfunctions
179
vii
viii
Contents
11. Tower Assembly Mishaps: Number 5 on the Top 10 Malfunctions
193
12. Difficulties During Start-Up, Shutdown, Commissioning, and
Abnormal Operation: Number 4 on the Top 10 Malfunctions
215
13. Water-Induced Pressure Surges: Part of Number 3 on the
Top 10 Malfunctions
225
14. Explosions, Fires, and Chemical Releases: Number 10 on the
Top 10 Malfunctions
233
15. Undesired Reactions in Towers
237
16. Foaming
241
17. The Tower as a Filter: Part A. Causes of Plugging—Number 1
on the Top 10 Malfunctions
253
18. The Tower as a Filter: Part B. Location of Plugging—Number 1
on the Top 10 Malfunctions
257
19. Coking: Number 1 on the Top 10 Malfunctions
271
20. Leaks
281
21. Relief and Failure
287
22. Tray, Packing, and Tower Damage: Part of Number 3 on the
Top 10 Malfunctions
291
23. Reboilers That Did Not Work: Number 9 on the
Top 10 Malfunctions
315
24. Condensers That Did Not Work
335
25. Misleading Measurements: Number 8 on the Top 10 Malfunctions
347
Contents
ix
26. Control System Assembly Difficulties
357
27. Where Do Temperature and Composition Controls Go Wrong?
373
28. Misbehaved Pressure, Condenser, Reboiler, and Preheater Controls
377
29. Miscellaneous Control Problems
395
DISTILLATION TROUBLESHOOTING DATABASE
OF PUBLISHED CASE HISTORIES
1. Troubleshooting Distillation Simulations
1.1 VLE
1.1.1
1.1.2
1.1.3
1.1.4
1.1.5
1.1.6
1.2
1.3
1.4
1.5
1.6
398
Close-Boiling Systems
398
Nonideal Systems
399
Nonideality Predicted in Ideal System
400
Nonideal VLE Extrapolated to Pure Products
400
Nonideal VLE Extrapolated to Different Pressures
401
Incorrect Accounting for Association Gives
Wild Predictions
401
1.1.7 Poor Characterization of Petroleum Fractions
402
Chemistry, Process Sequence
402
Does Your Distillation Simulation Reflect the Real World?
404
1.3.1 General
404
1.3.2 With Second Liquid Phase
406
1.3.3 Refinery Vacuum Tower Wash Sections
406
1.3.4 Modeling Tower Feed
406
1.3.5 Simulation/Plant Data Mismatch Can Be Due to an
Unexpected Internal Leak
406
1.3.6 Simulation/Plant Data Mismatch Can Be Due to
Liquid Entrainment in Vapor Draw
407
1.3.7 Bug in Simulation
407
Graphical Techniques to Troubleshoot Simulations
407
1.4.1 McCabe-Thiele and Hengstebeck Diagrams
407
1.4.2 Multicomponent Composition Profiles
407
1.4.3 Residue Curve Maps
407
How Good Is Your Efficiency Estimate?
407
Simulator Hydraulic Predictions: To Trust or Not to Trust
409
1.6.1 Do Your Vapor and Liquid Loadings Correctly
Reflect Subcool, Superheat, and Pumparounds?
409
1.6.2 How Good Are the Simulation Hydraulic
Prediction Correlations?
409
398
Contents
2. Where Fractionation Goes Wrong
2.1
2.2
2.3
2.4
2.5
2.6
410
Insufficient Reflux or Stages; Pinches
410
No Stripping in Stripper
412
Unique Features of Multicomponent Distillation
412
Accumulation and Hiccups
413
2.4.1 Intermediate Component, No Hiccups
413
2.4.2 Intermediate Component, with Hiccups
414
2.4.3 Lights Accumulation
416
2.4.4 Accumulation between Feed and Top
or Feed and Bottom
417
2.4.5 Accumulation by Recycling
418
2.4.6 Hydrates, Freeze-Ups
418
Two Liquid Phases
419
Azeotropic and Extractive Distillation
421
2.6.1 Problems Unique to Azeotroping
421
2.6.2 Problems Unique to Extractive Distillation
423
3. Energy Savings and Thermal Effects
3.1 Energy-Saving Designs and Operation
424
3.1.1 Excess Preheat and Precool
424
3.1.2 Side-Reboiler Problems
424
3.1.3 Bypassing a Feed around the Tower
424
3.1.4 Reducing Recycle
425
3.1.5 Heat Integration Imbalances
426
3.2 Subcooling: How It Impacts Towers
428
3.2.1 Additional Internal Condensation and Reflux
3.2.2 Less Loadings above Feed
429
3.2.3 Trapping Lights and Quenching
429
3.2.4 Others
430
3.3 Superheat: How It Impacts Towers
430
424
428
4. Tower Sizing and Material Selection Affect Performance
4.1
4.2
4.3
4.4
4.5
4.6
4.7
4.8
Undersizing Trays and Downcomers
431
Oversizing Trays
431
Tray Details Can Bottleneck Towers
433
Low Liquid Loads Can Be Troublesome
434
4.4.1 Loss of Downcomer Seal
434
4.4.2 Tray Dryout
435
Special Bubble-Cap Tray Problems
436
Misting
437
Undersizing Packings
437
Systems Where Packings Perform Different from Expectations
431
437
Contents
4.9
4.10
4.11
4.12
4.13
Packed Bed Too Long
438
Packing Supports Can Bottleneck Towers
439
Packing Hold-downs Are Sometimes Troublesome
Internals Unique to Packed Towers
440
Empty (Spray) Sections
440
440
5. Feed Entry Pitfalls in Tray Towers
5.1
5.2
5.3
5.4
5.5
Does the Feed Enter the Correct Tray?
441
Feed Pipes Obstructing Downcomer Entrance
441
Feed Flash Can Choke Downcomers
441
Subcooled Feeds, Refluxes Are Not Always Trouble Free
Liquid and Unsuitable Distributors Do Not Work
with Flashing Feeds
442
5.6 Flashing Feeds Require More Space
443
5.7 Uneven or Restrictive Liquid Split to Multipass Trays
at Feeds and Pass Transitions
443
5.8 Oversized Feed Pipes
444
5.9 Plugged Distributor Holes
444
5.10 Low Δ Ρ Trays Require Decent Distribution
445
441
442
6. Packed-Tower Liquid Distributors: Number 6 on the
Top 10 Malfunctions
6.1
6.2
6.3
6.4
6.5
6.6
6.7
6.8
6.9
6.10
6.11
6.12
6.13
xi
Better Quality Distributors Improve Performance
446
6.1.1 Original Distributor Orifice or Unspecified
446
6.1.2 Original Distributor Weir Type
447
6.1.3 Original Distributor Spray Type
447
Plugged Distributors Do Not Distribute Well
448
6.2.1 Pan/Trough Orifice Distributors
448
6.2.2 Pipe Orifice Distributors
449
6.2.3 Spray Distributors
450
Overflow in Gravity Distributors: Death to Distribution
451
Feed Pipe Entry and Predistributor Problems
454
Poor Hashing Feed Entry Bottleneck Towers
455
Oversized Weep Holes Generate Undesirable Distribution
456
Damaged Distributors Do Not Distribute Well
457
6.7.1 Broken Flanges or Missing Spray Nozzles
457
6.7.2 Others
457
Hole Pattern and Liquid Heads Determine Irrigation Quality
458
Gravity Distributors Are Meant to Be Level
459
Hold-Down Can Interfere with Distribution
460
Liquid Mixing Is Needed in Large-Diameter Distributors
460
Notched Distributors Have Unique Problems
461
Others
461
446
xii
Contents
7. Vapor Maldistribution in ΊΥ-ays and Packings
462
7.1 Vapor Feed/Reboiler Return Maldistributes Vapor
to Packing Above
462
7.1.1 Chemical/Gas Plant Packed Towers
462
7.1.2 Packed Refinery Main Fractionators
463
7.2 Experiences with Vapor Inlet Distribution Baffles
465
7.3 Packing Vapor Maldistribution at Intermediate Feeds
and Chimney Trays
465
7.4 Vapor Maldistribution Is Detrimental in Tray Towers
466
7.4.1 Vapor Cross-Flow Channeling
466
7.4.2 Multipass Trays
467
7.4.3 Others
467
8. Tower Base Level and Reboiler Return: Number 2 on the
Top 10 Malfunctions
468
8.1 Causes of High Base Level
468
8.1.1 Faulty Level Measurement or Level Control
468
8.1.2 Operation
469
8.1.3 Excess Reboiler Pressure Drop
470
8.1.4 Undersized Bottom Draw Nozzle or Bottom Line
470
8.1.5 Others
470
8.2 High Base Level Causes Premature Tower Flood
(No Tray/Packing Damage)
470
8.3 High Base Liquid Level Causes Tray/Packing Damage
471
8.4 Impingement by the Reboiler Return Inlet
472
8.4.1 On Liquid Level
472
8.4.2 On Instruments
473
8.4.3 On Tower Wall
473
8.4.4 Opposing Reboiler Return Lines
474
8.4.5 On Trays
474
8.4.6 On Seal Pan Overflow
474
8.5 Undersized Bottom Feed Line
475
8.6 Low Base Liquid Level
475
8.7 Issues with Tower Base Baffles
476
8.8 Vortexing
476
9. Chimney Tray Malfunctions: Part of Number 7 on the
Top 10 Malfunctions
9.1
9.2
9.3
9.4
Leakage
477
Problem with Liquid Removal, Downcomers, or Overflows
478
Thermal Expansion Causing Warping, Out-of-Levelness
479
Chimneys Impeding Liquid Flow to Outlet
480
477
Contents
9.5 Vapor from Chimneys Interfering with Incoming Liquid
9.6 Level Measurement Problems
481
9.7
Coking, Fouling, Freezing
482
9.8
Other Chimney Tray Issues
482
480
10. Drawoff Malfunctions (Non-Chimney Tray): Part of Number 7 on
the Top 10 Malfunctions
10.1
10.2
10.3
10.4
10.5
10.6
10.7
10.8
10.9
Vapor Chokes Liquid Draw Lines
484
10.1.1 Insufficient Degassing
484
10.1.2 Excess Line Pressure Drop
485
10.1.3 Vortexing
486
Leak at Draw Tray Starves Draw
486
Draw Pans and Draw Lines Plug Up
488
Draw Tray Damage Affects Draw Rates
488
Undersized Side-Stripper Overhead Lines Restrict Draw Rates
Degassed Draw Pan Liquid Initiates Downcomer Backup Flood
Other Problems with Tower Liquid Draws
489
Liquid Entrainment in Vapor Side Draws
490
Reflux Drum Malfunctions
490
10.9.1 Reflux Drum Level Problems
490
10.9.2 Undersized or Plugged Product Lines
490
10.9.3 Two Liquid Phases
490
11. Tower Assembly Mishaps: Number 5 on the Top 10 Malfunctions
11.1
11.2
11.3
11.4
11.5
11.6
11.7
11.8
11.9
11.10
11.11
11.12
11.13
xiii
Incorrect Tray Assembly
491
Downcomer Clearance and Inlet Weir Malinstallation
491
Flow Passage Obstruction and Internals Misorientation
at Tray Tower Feeds and Draws
492
Leaking Trays and Accumulator Trays
493
Bolts, Nuts, Clamps
493
Manways/Hatchways Left Unbolted
493
Materials of Construction Inferior to Those Specified
494
Debris Left in Tower or Piping
494
Packing Assembly Mishaps
495
11.9.1 Random
495
11.9.2 Structured
496
11.9.3 Grid
496
Fabrication and Installation Mishaps in Packing Distributors
Parts Not Fitting through Manholes
498
Auxiliary Heat Exchanger Fabrication and Assembly Mishaps
Auxiliary Piping Assembly Mishaps
498
484
488
489
491
496
498
xiv
Contents
12. Difficulties during Start-Up, Shutdown, Commissioning, and
Abnormal Operation: Number 4 on the Top 10 Malfunctions
12.1
12.2
12.3
12.4
12.5
12.6
12.7
12.8
12.9
12.10
12.11
12.12
Blinding/Unblinding Lines
499
Backflow
500
Dead-Pocket Accumulation and Release of Trapped Materials
Purging
501
Pressuring and Depressuring
502
Washing
502
On-Line Washes
504
Steam and Water Operations
506
Overheating
506
Cooling
507
Overchilling
507
Water Removal
508
12.12.1 Draining at Low Points
508
12.12.2 Oil Circulation
508
12.12.3 Condensation of Steam Purges
508
12.12.4 Dehydration by Other Procedures
508
12.13 Start-Up and Initial Operation
509
12.13.1 Total-Reflux Operation
509
12.13.2 Adding Components That Smooth Start-Up
509
12.13.3 Siphoning
509
12.13.4 Pressure Control at Start-Up
510
12.14 Confined Space and Manhole Hazards
510
499
501
13. Water-Induced Pressure Surges: Part of Number 3 on the
Top 10 Malfunctions
13.1
13.2
13.3
13.4
13.5
13.6
13.7
Water in Feed and Slop
512
Accumulated Water in Transfer Line to Tower and in
Heater Passes
513
Water Accumulation in Dead Pockets
513
Water Pockets in Pump or Spare Pump Lines
514
Undrained Stripping Steam Lines
515
Condensed Steam or Refluxed Water Reaching Hot Section
Oil Entering Water-Filled Region
517
14. Explosions, Fires, and Chemical Releases: Number 10 on the
Top 10 Malfunctions
14.1
Explosions Due to Decomposition Reactions
518
14.1.1 Ethylene Oxide Towers
518
14.1.2 Peroxide Towers
519
14.1.3 Nitro Compound Towers
520
14.1.4 Other Unstable-Chemical Towers
521
512
516
518
Contents
14.2
14.3
Explosions Due to Violent Reactions
523
Explosions and Fires Due to Line Fracture
524
14.3.1 C3-C4 Hydrocarbons
524
14.3.2 Overchilling
525
14.3.3 Water Freeze
526
14.3.4 Other
527
14.4 Explosions Due to Trapped Hydrocarbon or Chemical Release
14.5 Explosions Induced by Commissioning Operations
528
14.6 Packing Fires
529
14.6.1 Initiated by Hot Work Above Steel Packing
529
14.6.2 Pyrophoric Deposits Played a Major Role, Steel Packing
14.6.3 Tower Manholes Opened While Packing Hot,
Steel Packing
532
14.6.4 Others, Steel Packing Fires
532
14.6.5 Titanium, Zinconium Packing Fires
533
14.7 Fires Due to Opening Tower before Cooling
or Combustible Removal
533
14.8 Fires Caused by Backflow
534
14.9 Fires by Other Causes
535
14.10 Chemical Releases by Backflow
536
14.11 Trapped Chemicals Released
536
14.12 Relief, Venting, Draining, Blowdown to Atmosphere
537
15. Undesired Reactions in Towers
15.1
15.2
15.3
15.4
15.5
15.6
15.7
15.8
15.9
Excessive Bottom Temperature/Pressure
539
Hot Spots
539
Concentration or Entry of Reactive Chemical
539
Chemicals from Commissioning
540
Catalyst Fines, Rust, Tower Materials Promote Reaction
Long Residence Times
541
Inhibitor Problems
541
Air Leaks Promote Tower Reactions
542
Impurity in Product Causes Reaction Downstream
542
16. Foaming
16.1
What Causes or Promotes Foaming?
543
16.1.1 Solids, Corrosion Products
543
16.1.2 Corrosion and Fouling Inhibitors, Additives,
and Impurities
544
16.1.3 Hydrocarbon Condensation into Aqueous Solutions
16.1.4 Wrong Filter Elements
546
16.1.5 Rapid Pressure Reduction
546
16.1.6 Proximity to Solution Plait Point
546
527
530
539
540
543
545
xvi
Contents
16.2
16.3
16.4
16.5
16.6
What Are Foams Sensitive To?
546
16.2.1 Feedstock
546
16.2.2 Temperature
547
16.2.3 Pressure
547
Laboratory Tests
547
16.3.1 Sample Shake, Air Bubbling
547
16.3.2 Oldershaw Column
547
16.3.3 Foam Test Apparatus
548
16.3.4 At Plant Conditions
548
Antifoam Injection
548
16.4.1 Effective Only at the Correct Quantity/Concentration
548
16.4.2 Some Antifoams Are More Effective Than Others
549
16.4.3 Batch Injection Often Works, But Continuous
Can Be Better
549
16.4.4 Correct Dispersal Is Important, Too
550
16.4.5 Antifoam Is Sometimes Adsorbed on Carbon Beds
550
16.4.6 Other Successful Antifoam Experiences
550
16.4.7 Sometimes Antifoam Is Less Effective
551
System Cleanup Mitigates Foaming
551
16.5.1 Improving Filtration
551
16.5.2 Carbon Beds Mitigate Foaming But Can
Adsorb Antifoam
553
16.5.3 Removing Hydrocarbons from Aqueous Solvents
553
16.5.4 Changing Absorber Solvent
553
16.5.5 Other Contaminant Removal Techniques
554
Hardware Changes Can Debottleneck Foaming Towers
555
16.6.1 Larger Downcomers
555
16.6.2 Smaller Downcomer Backup (Lower Pressure Drop,
Larger Clearances)
556
16.6.3 More Tray Spacing
556
16.6.4 Removing Top Two Trays Does Not Help
556
16.6.5 Trays Versus Packings
556
16.6.6 Larger Packings, High-Open-Area Distributors Help
557
16.6.7 Increased Agitation
557
16.6.8 Larger Tower
557
16.6.9 Reducing Base Level
557
17. The Tower as a Filter: Part A. Causes of Plugging—Number 1
on the Top 10 Malfunctions
17.1
17.2
17.3
17.4
17.5
Piping Scale/Corrosion Products
558
Salting Out/Precipitation
559
Polymer/Reaction Products
560
Solids/Entrainment in the Feed
561
Oil Leak
561
558
Contents
17.6 Poor Shutdown Wash/Flush
562
17.7 Entrainment or Drying at Low Liquid Rates
17.8 Others
562
562
18. The Tower as a Filter: Part B. Locations of Plugging—Number 1
on the Top 10 Malfunctions
18.1
18.2
18.3
18.4
18.5
18.6
18.7
18.8
Trays
563
Downcomers
564
Packings
565
How Packings and Trays Compare on Plugging Resistance
18.4.1 Trays versus Trays
565
18.4.2 Trays versus Packings
566
18.4.3 Packings versus Packings
567
Limited Zone Only
567
Draw, Exchanger, and Vent Lines
569
Feed and Inlet Lines
570
Instrument Lines
570
563
565
19. Coking: Part of Number 1 on Tower Top 10 Malfunctions
19.1
19.2
19.3
19.4
19.5
xvii
Insufficient Wash Flow Rate, Refinery Vacuum Towers
Other Causes, Refinery Vacuum Towers
572
Slurry Section, FCC Fractionators
573
Other Refinery Fractionators
574
Nonrefinery Fractionators
574
571
571
20. Leaks
20.1 Pump, Compressor
575
20.2 Heat Exchanger
575
20.2.1 Reboiler Tube
575
20.2.2 Condenser Tube
576
20.2.3 Auxiliary Heat Exchanger (Preheater, Pumparound)
20.3 Chemicals to/from Other Equipment
577
20.3.1 Leaking from Tower
577
20.3.2 Leaking into Tower
577
20.3.3 Product to Product
578
20.4 Atmospheric
578
20.4.1 Chemicals to Atmosphere
578
20.4.2 Air into Tower
579
575
576
21. Relief and Failure
21.1 Relief Requirements
580
21.2 Controls That Affect Relief Requirements and Frequency
21.3 Relief Causes Tower Damage, Shifts Deposits
581
580
580
xviii
Contents
21.4
21.5
21.6
21.7
21.8
21.9
21.10
21.11
Overpressure Due to Component Entry
581
Relief Protection Absent or Inadequate
582
Line Ruptures
583
All Indication Lost When Instrument Tap Plugged
584
Trips Not Activating or Incorrectly Set
Pump Failure
585
Loss of Vacuum
585
Power Loss
585
22. Tray, Packing, and Tower Damage: Part of Number 3 on the
Top 10 Malfunctions
22.1
22.2
22.3
22.4
22.5
22.6
22.7
22.8
22.9
22.10
22.11
22.12
22.13
22.14
22.15
586
Vacuum
586
Insufficient Uplift Resistance
587
Uplift Due to Poor Tightening during Assembly
587
Uplift Due to Rapid Upward Gas Surge
589
Valves Popping Out
590
Downward Force on Trays
590
Trays below Feed Bent Up, above Bent Down and Vice Versa
Downcomers Compressed, Bowed, Fallen
592
Uplift of Cartridge Trays
593
Flow-Induced Vibrations
593
Compressor Surge
594
Packing Carryover
595
Melting, Breakage of Plastic Packing
595
Damage to Ceramic Packing
595
Damage to Other Packings
595
23. Reboilers That Did Not Work: Number 9 on the Top 10
Malfunctions
23.1
23.2
23.3
23.4
Circulating Thermosiphon Reboilers
596
23.1.1 Excess Circulation
596
23.1.2 Insufficient Circulation
596
23.1.3 Insufficient Δ Τ, Pinching
596
23.1.4 Surging
596
23.1.5 Velocities Too Low in Vertical Thermosiphons
23.1.6 Problems Unique to Horizontal Thermosiphons
Once-Through Thermosiphon Reboilers
597
23.2.1 Leaking Draw Tray or Draw Pan
597
23.2.2 No Vaporization/Thermosiphon
598
23.2.3 Slug Flow in Outlet Line
599
Forced-Circulation Reboilers
599
Kettle Reboilers
599
23.4.1 Excess Δ Ρ in Circuit
599
23.4.2 Poor Liquid Spread
601
23.4.3 Liquid Level above Overflow Baffle
602
591
596
597
597
Contents
xix
23.5
23.6
23.7
Internal Reboilers
602
Kettle and Thermosiphon Reboilers in Series
603
Side Reboilers
603
23.7.1 Inability to Start
603
23.7.2 Liquid Draw and Vapor Return Problems
603
23.7.3 Hydrates
603
23.7.4 Pinching
604
23.7.5 Control Issues
604
23.8 All Reboilers, Boiling Side
604
23.8.1 Debris/Deposits in Reboiler Lines
604
23.8.2 Undersizing
604
23.8.3 Film Boiling
604
23.9 All Reboilers, Condensing Side
605
23.9.1 Non condensables in Heating Medium
605
23.9.2 Loss of Condensate Seal
605
23.9.3 Condensate Draining Problems
606
23.9.4 Vapor/Steam Supply Bottleneck
606
24. Condensers That Did Not Work
607
24.1 Inerts Blanketing
607
24.1.1 Inadequate Venting
607
24.1.2 Excess Lights in Feed
608
24.2 Inadequate Condensate Removal
608
24.2.1 Undersized Condensate Lines
608
24.2.2 Exchanger Design
609
24.3 Unexpected Condensation Heat Curve
609
24.4 Problems with Condenser Hardware
610
24.5 Maldistribution between Parallel Condensers
611
24.6 Flooding/Entrainment in Partial Condensers
611
24.7 Interaction with Vacuum and Recompression Equipment
24.8 Others
612
612
25. Misleading Measurements: Number 8 on the Top 10 Malfunctions
25.1
25.2
25.3
25.4
25.5
Incorrect Readings
613
Meter or Taps Fouled or Plugged
614
Missing Meter
615
Incorrect Meter Location
615
Problems with Meter and Meter Tubing Installation
25.5.1 Incorrect Meter Installation
616
25.5.2 Instrument Tubing Problems
616
25.6 Incorrect Meter Calibration, Meter Factor
617
25.7 Level Instrument Fooled
617
25.7.1 By Froth or Foam
617
25.7.2 By Oil Accumulation above Aqueous Level
25.7.3 By Lights
619
616
618
613
xx
Contents
25.7.4 By Radioactivity (Nucleonic Meter)
25.7.5 Interface-Level Metering Problems
25.8 Meter Readings Ignored
619
25.9 Electric Storm Causes Signal Failure
619
619
619
26. Control System Assembly Difficulties
26.1 No Material Balance Control
620
26.2 Controlling Two Temperatures/Compositions
Simultaneously Produces Interaction
621
26.3 Problems with the Common Control Schemes, No Side Draws
26.3.1 Boil-Up on TC/AC, Reflux on FC
622
26.3.2 Boil-Up on FC, Reflux on TC/AC
623
26.3.3 Boil-Up on FC, Reflux on LC
624
26.3.4 Boil-Up on LC, Bottoms on TC/AC
625
26.3.5 Reflux on Base LC, Bottoms on TC/AC
626
26.4 Problems with Side-Draw Controls
626
26.4.1 Small Reflux below Liquid Draw Should Not Be
on Level or Difference Control
626
26.4.2 Incomplete Material Balance Control with Liquid Draw
26.4.3 Steam Spikes with Liquid Draw
628
26.4.4 Internal Vapor Control makes or Breaks
Vapor Draw Control
628
26.4.5 Others
628
27. Where Do Temperature and Composition Controls Go Wrong?
27.1 Temperature Control
629
27.1.1 No Good Temperature Control Tray
629
27.1.2 Best Control Tray
630
27.1.3 Fooling by Nonkeys
630
27.1.4 Averaging (Including Double Differential)
631
27.1.5 Azeotropic Distillation
631
27.1.6 Extractive Distillation
631
27.1.7 Other
632
27.2 Pressure-Compensated Temperature Controls
632
27.2.1 AT Control
632
27.2.2 Other Pressure Compensation
633
27.3 Analyzer Control
633
27.3.1 Obtaining a Valid Analysis for Control
633
27.3.2 Long Lags and High Off-Line Times
633
27.3.3 Intermittent Analysis
634
27.3.4 Handling Feed Fluctuations
635
27.3.5 Analyzer-Temperature Control Cascade
635
27.3.6 Analyzer On Next Tower
635
620
622
628
629
Contents
28. Misbehaved Pressure, Condenser, Reboiler, and Preheater Controls
xxi
636
28.1 Pressure Controls by Vapor Flow Variations
636
28.2 Flooded Condenser Pressure Controls
637
28.2.1 Valve in the Condensate, Unflooded Drum
637
28.2.2 Flooded Drum
637
28.2.3 Hot-Vapor Bypass
637
28.2.4 Valve in the Vapor to the Condenser
639
28.3 Coolant Throttling Pressure Controls
640
28.3.1 Cooling-Water Throttling
640
28.3.2 Manipulating Airflow
640
28.3.3 Steam Generator Overhead Condenser
640
28.3.4 Controlling Cooling-Water Supply Temperature
640
28.4 Pressure Control Signal
641
28.4.1 From Tower or from Reflux Drum?
641
28.4.2 Controlling Pressure via Condensate Temperature
641
28.5 Throttling Steam/Vapor to Reboiler or Preheater
641
28.6 Throttling Condensate from Reboiler
642
28.7 Preheater Controls
643
29. Miscellaneous Control Problems
29.1
29.2
29.3
29.4
29.5
29.6
Interaction with the Process
644
A Ρ Control
644
Flood Controls and Indicators
644
Batch Distillation Control
645
Problems in the Control Engineer's Domain
645
Advanced Controls Problems
646
29.6.1 Updating Multivariable Controls
646
29.6.2 Advanced Controls Fooled by Bad Measurements
29.6.3 Issues with Model Inaccuracies
647
29.6.4 Effect of Power Dips
647
29.6.5 Experiences with Composition Predictors in
Multivariable Controls
647
References
Index
649
669
About the Author
713
644
646
This page intentionally left blank
Preface
"To every problem, there's always an easy solution—neat, plausible, and wrong."
—Mencken's Maxim
The last half-century has seen tremendous progress in distillation technology. The
introduction of high-speed computers revolutionized the design, control, and operation of distillation towers. Invention and innovation in tower internals enhanced
tower capacity and efficiency beyond previously conceived limits. Gamma scans and
laser-guided pyrometers have provided troubleshooters with tools of which, not-solong-ago, they would only dream. With all these advances, one would expect the
failure rate in distillation towers to be on the decline, maybe heading towards extinction as we enter the 21 st century. Our recent survey of distillation failures (255)
brought disappointing news: Distillation failures are not on the path to extinction.
Instead, the tower failure rate is on the rise and accelerating.
Our survey further showed that the rise is not because distillation is moving into
new, unchartered frontiers. By far, the bulk of the failures have been repetitions of
previous ones. In some cases, the literature describes 10-20 repetitions of the same
failure. And for every case that is reported, there are tens, maybe hundreds, that are
not.
In the late 1980s, I increased tray hole areas in one distillation tower in an attempt
to gain capacity. Due to vapor cross flow channeling, a mechanism unknown at the
time, the debottleneck went sour and we lost 5% capacity. Half a year of extensive
troubleshooting, gamma scans, and tests taught us what went wrong and how to regain
the lost capacity. We published extensively on the phenomenon and how to avoid. A
decade later, I returned to investigate why another debottleneck (this time by others)
went sour at the same unit. The tower I previously struggled with was replaced by a
larger one, but the next tower in the sequence (almost the same hydraulics as the first)
was debottlenecked... by increasing tray hole areas!
It dawned on me how short a memory the process industries have. People move on,
the lessons get forgotten, and the same mistakes are repeated. It took only one decade
to forget. Indeed, people moved on: only one person (beside me) that experienced the
1980s debottleneck was involved in the 1990s efforts. This person actually questioned
xxiii
xxiv
Preface
the debottleneck proposal, but was overruled by those who did not believe it will
happen again.
Likewise, many experiences are repeatedly reported in the literature. Over the
last two decades, there has been about one published case history per year of a tower
flooding prematurely due to liquid level rising above the reboiler return nozzle, or of
a kettle reboiler bottleneck due to an incorrectly compiled force balance. One would
think that had we learned from the first case, all the repetitions could have been
avoided. And again, for every case that is reported, there are tens, maybe hundreds
that are not.
Why are we failing to learn from past lessons? Mergers and cost-cuts have retired
many of the experienced troubleshooters and thinly spread the others. The literature
offers little to bridge the experience gap. In the era of information explosion, databases,
and computerized searches, finding the appropriate information in due time has become likefinding a needle in an evergrowing haystack. To locate a useful reference,
one needs to click away a huge volume of wayward leads. Further, cost-cutting measures led to library closures and to curtailed circulation and availability of some prime
sources of information, such as, AIChE meeting papers.
The purpose of this book is pick the needles out of the haystack. The book
collects lessons from past experiences and puts them in the hands of troubleshooters
in a usable form. The book is made up of two parts: thefirst is a collection of "war
stories," with the detailed problems and solutions. The second part is a database
mega-table which presents summaries of all the "war stories" I managed tofind in the
literature. The summaries include some key distillation-related morals. For each of
these, the literature reference is described fully, so readers can seek more details. Many
of the case histories could be described under more than one heading, so extensive
cross references have been included.
If an incident that happened in your plant is described, you may notice that some
details could have changed. Sometimes, this was done to make it more difficult for
people to tell where the incident occurred. At other times, this was done to simplify
the story without affecting the key lessons. Sometimes, the incident was written up
several years after it occurred, and memories of some details faded away. Sometimes,
and this is the most likely reason, the case history did not happen in your plant at all.
Another plant had a similar incident.
The case histories and lessons drawn are described to the best of my and the
contributors' knowledge and in good faith, but do not always correctly reflect the
problems and solutions. Many times I thought I knew the answer, possibly even
solved the problem, only to be humbled by new light or another experience later.
The experiences and lessons in the book are not meant to be followed blindly. They
are meant to be taken as stories told in good faith, and to the best of knowledge and
understanding of the author or contributor. We welcome any comments that either
affirm or challenge our perception and understanding.
If you picked the book, you expressed interest in learning from past experiences.
This learning is an essential major step along the path traveled by a good troubleshooter
or designer. Should you select this path, be prepared for many sleepless nights in
the plant, endless worries as to whether you have the right answer, tests that will
Preface
xxv
shatter your favorite theories, and many humbling experiences. Yet, you will share
the glory when your fix or design solves a problem where others failed. You will
enjoy harnessing the forces of nature into a beneficial purpose. Last but not least,
you will experience the electric excitement of the "moments of insight," when all the
facts you have been struggling with for months suddenly fall together into a simple
explanation. I hope this book helps to get you there.
HENRY Z . KISTER
March 2006
This page intentionally left blank
Acknowledgments
Many of the case histories reported in this book have been invaluable contributions
from colleagues and friends who kindly and enthusiastically supported this book.
Many of the contributors elected to remain anonymous. Kind thanks are due to all
contributors. Special thanks are due to those who contributed multiple case histories,
and to those whose names do not appear in print. To those behind-the-scenes friends,
I extends special appreciation and gratitude.
Writing this book required breaking away from some of the everyday work
demands. Special thanks are due to Fluor Corporation, particularly to my supervisors,
Walter Stupin and Paul Walker, for their backing, support and encouragement of this
book-writing effort, going to great lengths to make it happen.
Recognition is due to my mentors who, over the years, encouraged my work,
immensely contributed to my achievements, and taught me much about distillation and
engineering: To my life-long mentor, Walter Stupin, who mentored and encouraged
my work, throughout my career at C F Braun and later at Fluor, being a ceaseless source
of inspiration behind my books and technical achievements; Paul Walker, Fluor, whose
warm encouragement and support have been the perfect motivators for professional
excellence and achievement; Professor Ian Doig, University of NSW, who inspired
me over the years, showed me the practical side of distillation, and guided me over a
crisis early in my career; Reno Zack, who enthusiastically encouraged and inspired
my achievements throughout my career at C F Braun; Dick Harris and Trevor Whalley,
who taught me about practical distillation and encouraged my work and professional
pursuits at ICI Australia; and Jack Hull, Tak Yanagi, and Jim Gosnell, who were
sources of teaching and inspiration at C F Braun. The list could go on, and I express
special thanks to all that encouraged, inspired, and contributed to my work over the
years. Much of my mentors' teachings found their way into the following pages.
Special thanks are due to family members and close friends who have helped,
supported and encouraged my work—my mother, Dr. Helen Kister, my father, Dr.
John Kister, and Isabel Wu—your help and inspiration illuminated my path over the
years.
Last but not least, special thanks are due to Mireille Grey and Stan Okimoto at
Fluor, who flawlessly and tirelessly converted my handwritten scrawl into a typed
manuscript, putting up with my endless changes and reformats.
H.Z.K.
xxvii
This page intentionally left blank
How to Use this Book
The use of this book as a story book or bedtime reading is quite straight forward and
needs no guidance. Simply select the short stories of specific interest and read them.
More challenging is the use of this book to look for experiences that could have
relevance to a given troubleshooting endeavor. Here the database mega-Table in the
second part of the book is the key. Find the appropriate subject matter via the table
of contents or index, and then explore the various summaries, including those in
the cross-references. The database mega-Table also lists any case histories that are
described in full in this book. Such case histories will be prefixed "DT" (acronym for
Distillation Troubleshooting). For instance, if the mega-Table lists DT2.4, it means
that the full experience is reported as case history 2.4 in this book.
The database as well as many of the case histories list only some of the key lessons
drawn. The lessons listed are not comprehensive, and omit nondistillation morals (such
as the needs for more staffing or better training). The reader is encouraged to review
the original reference for additional valuable lessons.
For quick reference, the acronyms used in Distillation Troubleshooting are listed
up front, and the literature references are listed alphabetically.
Some of the case histories use English units, others use metric units. The units
used often reflect the unit system used in doing the work. The conversions are straightforward and can readily be performed by using the conversion tables in Perry's Handbook (393) or other handbooks.
The author will be pleased to hear any comments, experiences or challenges
any readers may wish to share for possible inclusion in a future edition. Also, the
author is sure that despite his intensive literature search, he missed several invaluable
references, and would be very grateful to receive copies of such references. Feedback
on any errors, as well as rebuttal to any of the experiences described, is also greatly
appreciated and will help improve future editions. Please write, fax or e-mail to Henry
Z. Kister, Fluor, 3 Polaris Way, Aliso Viejo, CA 92698, phone 1-949-349-4679; fax
1-949-349-2898; e-mail [email protected].
xxix
This page intentionally left blank
Abbreviations
AC
AGO
aMDEA
AMS
APC
AR
ASTM
atm
Β
barg
BFW
BMD
BPD
BPH
BSD
BTEX
BTX
Ci, C2, C3...
CAT
Cat
C-factor
CFD
CHP
C02
Co.
CS
CT
CTC
CW
CWR
CWS
D
D86
Analyzer control
Atmospheric gas oil
Activated MDEA
Alpha-methyl styrene
adaptive process control
on-line analyzer
American Society for Testing and Materials
atmospheres, atmospheric
Bottoms
bars, gauge
Boiler feed water
2-bromomethyl-l, 3-dioxolane
Barrels per day
Barrels per hour
bottom side draw
Benzene, toluene, ethylbenzene, xylene
Benzene, toluene, xylene
Number of carbon atoms in compound
computed axial tomography
Catalytic
Vapor capacity factor, defined by equation 2 in Case Study 1.14
computational fluid dynamics
cumene hydroperoxide
Carbon dioxide
Company
Carbon steel
Chimney Tray
Carbon tetrachloride
Cooling water
Cooling water return
Cooling water supply
Distillate
ASTM atmospheric distillation test of petroleum fraction
xxxii
DAA
DC,
DC 2
DC 3
DC 4
DCs
DCM
DCS
DEA
DFNB
DIB
DMAC
DMC
DMF
DMSO
DO
dP
DQI
DRD
dT
DT
EB
ED
EDC
EG
EGEE
EO
EOR
ETFE
FC
FCC
FI
fph
FR
FS
ft
gal
GC
GC-MS
gpm
GS
h
H2
H2O
Abbreviations
diacetone alcohol
Demethanizer
Deethanizer
Depropanizer
Debutanizer
Depentanizer
Dichloromethane
Distributed control system
Diethanol amine
2,4-difluoronitrobenzene
Deisobutanizer
dimethylacetamide
Dynamic matrix control
Dimethylformamide
Dimethyl sulphoxide
Decant oil
Same as A Ρ
Distribution quality index
distillation region diagram
Same as Δ Γ
Distillation troubleshooting (this book)
Energy balance; ethylbenzene
extractive distillation
Ethylene dichloride
Ethylene glycol
Ethylene glycol monoethyl ether
ethylene oxide
End of run
Ethylene tetrafluoroethylene, a type of teflon
Flow control
Fluid catalytic cracker
Flow indicator
feet per hour
Flow recorder
Flow Switch
Feet
gallons
Gas chromatographs
Gas chromatography-mass spectrometry
gallons per minute
A process of concentrating deutrium by dual-temperature isotope
exchange between water and hydrogen sulfide with no catalyst
hours
Hydrogen
Water
Abbreviations
H2S
HA
HAZOP
HC
HCGO
HCl
HCN
HCO
HD
HETP
HF
Hg
HK
HN
HP
HR
HSS
HV
HVGO
IBP
ICO
ID
IK
in.
IPA
IPE
IR
IVC
kPa
kPag
lb
LC
LCGO
LCO
LD
LI
LK
LL
LMTD
LP
LPB
LPG
LR
LT
L/V
Hydrogen sulfide
Hydroxyl amine
Hazard and operability study
Hydrocarbon
Heavy coker gas oil
Hydrogen chloride
Hydrogen cyanide
Heavy cycle oil
Heavy diesel
Height equivalent of a theoretical plate
Hydrogen fluoride
Mercury
Heavy key
Heavy naphtha
High pressure
High reflux
Heat-stable salts
hand valve
Heavy vacuum gas oil
Initial boiling point
intermediate cycle oil
Internal diameter
Intermediate key
inch
Isopropyl alcohol
Isopropyl ether
Infrared
Internal vapor control
Kilopascals
Kilopascals gage
pounds
Level control
Light coker gas oil
Light cycle oil
Light diesel
Level indicator
Light key
Liquid-liquid
Log mean temperature difference
Low pressure
Loss Prevention Bullletin
Liquefied petroleum gas; refers to C3 and C4 hydrocarbons
Low reflux
Level transmitter
Liquid-to-vapor molar ratio
xxxiii
xxxiv
LVGO
m
MB
MDEA
MEA
MEK
MF
min
MISO
mm
MNT
MOC
MP
MPC
mpy
MSDS
MTS
MV
MVC
N2
NC
NGL
NNF
NO
NPSH
NRTL
NRU
02
ORS
OS HA
PA
P&ID
PC
PCV
PI
PR
psi
psia
psig
PSV
PT
PVC
PVDF
R22
Abbreviations
Light vacuum gas oil
meters
Material balance
Methyl (Methanol amine
Monoethanol amine
Methyl ethyl ketone
Main fractionator
Minutes or minimum
Multiple inputs, single output
millimeters
Mononitrotoluene
Management of change
Medium Pressure
Model predictive control
mils per year, refers to a measure of conosion rates. 1 mil is 1/1000 inch
Material safety data sheets
Refers to a proprietary liquid distributor marketed by
Sulzer under license from Dow Chemical
Manual valve
Multivariate control, or more volitle component
nitrogen
Normally closed
Natural gas liquids
Normally no flow
Normally open
Net positive suction head
Nonrandom two liquid; refers to a popular VLE prediction method
Nitrogen rejection unit
oxygen
Oxide redistillation still
Occupational Safety and Health Administration
Pumparound
Process and instrumentation diagram
Pressure control
Pressure control valve
Pressure indicator
Peng-Robinson; refers to a popular VLE prediction method
pounds per square inch
psi absolute
psi gauge
Pressure safety valve
Pressure transmitter
Polyvinyl chloride
Polyvynilidene fluoride
Freon 22
Abbreviations
R/D
Ref.
Refrig
RO
RVP
s
SBE
sec.
SG
SPA
SRK
SS
STM
T/A
TBP
TC
TCE
TDC
TEA
TEG
TI
Ti
TRC
UNIQAC
VAM
V/B
VCFC
VCM
VGO
VLE
VLLE
VOC
vol
w.g.
wt
AΡ
AT
Reflux-to-distillate molar ratio
Reference
Refrigeration
Restriction orifice
Reid vapor pressure
seconds
Di-Sec-butyl ether
secondary
specific gravity
Slurry pumparound
Soave, Redlich, and Kwong; refers to a popular VLE method
Stainless steel
Steam
Turnaround
True boiling point
Temperature control
Trichloroethylene
Temperature difference controller
Triethanol amine
Triethylene glycol
Temperature indicator
Titanium
temperature recorder/controller
Unified quasi-chemical; refers to a popular VLE prediction method
Vinyl acetate monomer
Stripping ratio, i.e., molar ratio of stripping section
vaporflow rate to tower bottomflow rate
Vapor cross-flow channeling
Vinyl chloride monomer
Vacuum gas oil
Vapor-liquid equilibrium
Vapor-liquid-liquid equilibrium
Volatile organic carbon
Volume
water gage
by weight
Pressure difference
Temperature difference
This page intentionally left blank
Chapter 1
Troubleshooting Distillation
Simulations
It may appear inappropriate to start a distillation troubleshooting book with a malfunction that did not even make it to the top 10 distillation malfunctions of the last
half century. Simulations were in the 12th spot (255). Countering this argument is
that simulation malfunctions were identified as the fastest growing area of distillation
malfunctions, with the number reported in the last decade about triple that of the four
preceding decades (252). If one compiled a distillation malfunction list over the last
decade only, simulation issues would have been in the equal 6th spot. Simulations
have been more troublesome in chemical than in refinery towers, probably due to the
difficulty in simulating chemical nonidealities. The subject was discussed in detail in
another paper (247).
The three major issues that affect simulation validity are using good vapor-liquid
equilibrium (VLE) predictions, obtaining a good match between the simulation and
plant data, and applying graphical techniques to troubleshoot the simulation (255).
Case histories involving these issues account for about two-thirds of the cases reported
in the literature. Add to this ensuring correct chemistry and correct tray efficiency,
these items account for 85% of the cases reported in the literature.
A review of the VLE case studies (247) revealed major issues with VLE predictions for close-boiling components, either a pair of chemicals [e.g., hydrocarbons
(HCs)] of similar vapor pressures or a nonideal pair close to an azeotrope. Correctly
estimating nonidealities has been another VLE troublespot. A third troublespot is
characterization of heavy components in crude oil distillation, which impacts simulation of refinery vacuum towers. Very few case histories were reported with other
systems. VLE prediction for reasonably ideal, relatively high volatility systems (e.g.,
ethane-propane or methanol-ethanol) is not frequently troublesome.
The major problem in simulation validation appears to be obtaining a reliable,
consistent set of plant data. Getting correct numbers out of flowmeters and laboratory analyses appears to be a major headache requiring extensive checks and
rechecks. Compiling mass, component, and energy balances is essential for catching a
Distillation Troubleshooting. By Henry Z. Kister
Copyright © 2006 John Wiley & Sons, Inc.
1
2
Chapter 1 Troubleshooting Distillation Simulations
misleadingflowmeter or composition. One specific area of frequent mismatches between simulation and plant data is where there are two liquid phases. Here comparison of measured to simulated temperature profiles is invaluable for finding the
second liquid phase. Another specific area of frequent mismatches is refinery vacuum
towers. Here the difficult measurement is the liquid entrainment from theflash zone
into the wash bed, which is often established by a component balance on metals or
asphaltenes.
The key graphical techniques for troubleshooting simulations are the McCabeThiele and Hengstebeck diagrams, multicomponent distillation composition profiles,
and in azeotropic systems residue curve maps. These techniques permit visualization and insight into what the simulation is doing. These diagrams are not drawn
from scratch; they are plots of the composition profiles obtained by the simulation
using the format of one of these procedures. The book by Stichlmair and Fair (472)
is loaded with excellent examples of graphical techniques shedding light on tower
operation.
In chemical towers, reactions such as decomposition, polymerization, and hydrolysis are often unaccounted for by a simulation. Also, the chemistry of a process
is not always well understood. One of the best tools for getting a good simulation
in these situations is to run the chemicals through a miniplant, as recommended by
Ruffert (417).
In established processes, such as separation of benzene from toluene or ethanol
from water, estimating efficiency is quite trouble free in conventional trays and packings. Problems are experienced in afirst-of-a-kind process or when a new mass transfer
device is introduced and is on the steep segment of its learning curve.
Incorrect representation of the feed entry is troublesome if thefirst product leaves
just above or below or if some chemicals react in the vapor and not in the liquid. A
typical example is feed to a refinery vacuum tower, where thefirst major product exits
the tower between 0.5 and 2 stages above the feed.
The presentation of liquid and vapor rates in the simulation output is not always
user friendly, especially near the entry of subcooled reflux and feeds, often concealing
higher vapor and liquid loads. This sometimes precipitates underestimates of the vapor
and liquid loads in the tower.
Misleading hydraulic predictions from simulators is a major troublespot. Most
troublesome have been hydraulic predictions for packed towers, which tend to be
optimistic, using both the simulator methods and many of the vendor methods in the
simulator (247, 254). Simulation predictions of both tray and packing efficiencies as
well as downcomer capacities have also been troublesome. Further discussion is in
Ref. 247.
CASE STUDY 1.1 METHANOL IN
C 3 SPLITTER OVERHEAD?
Installation Olefins plant C3 splitter, separating propylene overhead from propane
at pressures of 220-240 psig, several towers.
Case Study 1.1
Methanol in C 3 Splitter Overhead?
3
Background Methanol is often present in the C3 splitter feed in small concentrations, usually originating from dosing upstream equipment to remove hydrates.
Hydrates are loose compounds of water and HCs that behave like ice, and methanol
is used like antifreeze. The atmospheric boiling points of propylene, propane, and
methanol are -54, -44, and 148°F, respectively. The C3 splitters are large towers,
usually containing between 100 and 300 trays and operating at high reflux, so they
have lots of separation capability.
Problem Despite the large boiling point difference (about 200°F) and the large
tower separation capability, some methanol found its way to the overhead product in
all these towers. Very often there was a tight specification on methanol in the tower
overhead.
Cause Methanol is a polar component, which is repelled by the nonpolar HCs. This
repulsion is characterized by a high activity coefficient. With the small concentration
of methanol in the all-HC tray liquid, the repulsion is maximized; that is, the activity
coefficient of methanol reaches its maximum (infinite dilution) value. This high activity coefficient highly increases its volatility, to the point that it almost counterbalances
the much higher vapor pressure of propylene. The methanol and propylene therefore
become very difficult to separate.
Simulation All C3 splitter simulations that the author worked with have used equations of state, and these were unable to correctly predict the high activity coefficient
of the methanol. They therefore incorrectly predicted that all the methanol would end
up in the bottom and none would reach the tower top product.
Solution In most cases, the methanol was injected upstream for a short period only,
and the off-specification propylene product was tolerated, often blended in storage.
In one case, the methanol content of the propylene was lowered by allowing some
propylene out of the C3 splitter bottom at the expense of lower recovery.
Related Experience A very similar experience occurred in a gas plant depropanizer separating propane from butane and heavier HCs. Here the methanol
ended in the propane product.
Other Related Experiences Several refinery debutanizers that separated C3 and
C 4 [liquefied petroleum gases (LPGs)] from C5 and heavier HCs (naphtha) contained
small concentrations of high-boiling sulfur compounds. Despite their high boiling
points (well within the naphtha range), these high boilers ended in the overhead LPG
product. Sulfur compounds are polar and are therefore repelled by the HC tray liquid.
The repulsion (characterized by their infinite dilution activity coefficient) made these
compounds volatile enough to go up with the LPG. Again, tower simulations that
were based on equations of state incorrectly predicted that these compounds would
end up in the naphtha.
4
Chapter 1 Troubleshooting Distillation Simulations
In one refinery and one petrochemical debutanizer, mercury compounds with
boiling points in the gasoline range were found in the LPG, probably reaching it by
a similar mechanism.
CASE STUDY 1.2
VADIS?
WATER IN DEBUTANIZER: QUO
Installation A debutanizer separating C4 HCs from HCs in the Cs-Cg range. Feed
to the tower was partially vaporized in an upstream feed-bottom interchanger. The
feed contained a small amount of water. Water has a low solubility in the HCs and
distilled up. The reflux drum was equipped with a boot designed to gravity-separate
water from the reflux.
Problem When the feed contained a higher concentration of water or the reflux
boot was inadvertently overfilled, water was seen in the tower bottoms.
Cause The tower feed often contained caustic. Caustic deposits were found in the
tower at shutdown. Sampling the water in the tower bottom showed a high pH. Analysis showed that the water in the bottom was actually concentrated caustic solution.
Prevention Good coalescing of water and closely watching the interface level in
the reflux drum boot kept water out of the feed and reflux. Maximizing feed preheat
kept water in the vapor.
CASE STUDY 1.3 BEWARE OF HIGH HYDROCARBON
VOLATILITIES IN WASTEWATER SYSTEMS
Benzene was present in small concentration, of the order of ppm, in a refinery wastewater sewer system. Due to the high repulsion between the water and benzene molecules,
benzene has a high activity coefficient, making it very volatile in the wastewater.
Poor ventilation, typical of sewer systems, did not allow the benzene to disperse,
and it concentrated in the vapor space above the wastewater. The lower explosive
limit of benzene in air is quite low, about a few percent, and it is believed that the
benzene concentration exceeded it at least in some locations in the sewer system.
The sewer system had one vent pipe discharging at ground level without a gooseneck. A worker was doing hot work near the top of that pipe. Sparks are believed to
have fallen into the pipe, igniting the explosive mixture. The pipe blew up into the
worker's face, killing him.
Morals
• Beware of high volatilities of HCs and organics in a wastewater system.
• Avoid venting sewer systems at ground level.
Case Study 1.4 A Hydrocarbon VLLE Method Used For Aqueous Feed Equilibrium
5
CASE STUDY 1.4 A HYDROCARBON VLLE METHOD
USED FOR AQUEOUS FEED EQUILIBRIUM
Contributed by W. Randall Hollowell, CITGO, Lake Charles, Louisiana
Installation Feed for a methanol-water separation tower was the water-methanol
phase from a three-phase gas-oil-aqueous separator. Gas from the separator was
moderately high in H2S and in CO2. Tower preliminary design used a total overhead
condenser to produce 95% methanol. Methanol product was cooled and stored at
atmospheric pressure. Off gas from storage was not considered a problem because
the calculated impurities in the methanol product were predominantly water.
Problem Tower feed had been calculated with a standard gas-processing vaporliquid-liquid equilibrium (VLLE) method (Peng-Robinson equation of state). A consultant noted that the VLLE method applied only to aqueous phases that behaved like
pure water and only to gas-phase components that had low solubility in the aqueous
phase.
The large methanol content of the aqueous phase invalidated these feed composition calculations. Every gas component was far more soluble in the tower feed
than estimated. The preliminary tower design would have produced a methanol product with such a high H2S vapor pressure that it could not be safely stored in the
atmospheric tank.
Better Approach Gas solubility in a mixed, non-HC solvent (methanol and water)
is a Henry's constant type of relationship for which process simulation packages often
do not have the methods and/or parameters required.
Addition of a pasteurization section to the top of a tower is a common fix for
removing light impurities from the distillate product. After condensing most of the
overhead vapor, a small overhead vent gas stream is purged out of the tower to remove
light ends. Most or all of the overhead liquid is refluxed to minimize loss of desired
product in the purges. The pasteurization section typically contains 3-10 trays or a
short packed bed, used to separate light ends from the distillate product. The distillate
product is taken as a liquid side draw below the pasteurization trays. The side draw
may be stripped to further reduce light ends. The vent gas may be refrigerated and
solvent washed or otherwise treated to reduce loss of desired product.
Solution An accurate, specific correlation (outside of the process simulation package) was used to calculate H 2 S and CO2 concentration in the methanol-water tower
feed. Solubility of HC components was roughly estimated because they were at relatively low concentrations in the tower feed. A high-performance coalescer was used
to minimize liquid HC droplets in the tower feed.
A pasteurization section was added to the top of the tower. The overhead vent
gas purge stream was designed to remove most of the H 2 S, CO2, and light HCs.
Downstream recovery of methanol from the vent gas and stripping of the methanol
product side draw were considered but found to be uneconomical.
6
Chapter 1 Troubleshooting Distillation Simulations
Moral Poor simulation and design result from poor selection of VLE and VLLE
methods. Computer output does not include a warning when the selected VLE method
produces garbage.
CASE STUDY 1.5 MODELING TERNARY MIXTURE
USING BINARY INTERACTION PARAMETERS
Contributed by Stanislaw K. Wasylkiewicz, Aspen Technology, Inc., Calgary,
Alberta, Canada
This case study describes a frequently encountered modeling problem during simulation of heterogeneous azeotropic distillation. Phase diagrams are invaluable for
troubleshooting this type of simulation problems.
Distillation Simulation A sequence of distillation columns for separation of a
mixture containing water and several organic alcohols was set up in a simulator.
Since some of the alcohols are not fully miscible with water, a nonrandom two-liquid
(NRTL) model was selected to model VLLE in the system. At atmospheric pressure,
the vapor phase was treated as an ideal gas.
Problem Simulation of the sequence of distillation columns never converged, giving many warnings aboutflash failures.
Investigation For the three key components (methanol, water, and n-butanol) a
phase diagram was created (508) (Fig. 1.1a). As expected, the water-methanol and
methanol-w-butanol edges are homogeneous and the water-n-butanol edge contained
an immiscibility gap. Surprisingly, the three-liquid region and three two-liquid regions
covered almost the entire composition space. Since water and methanol, as well as
butanol and methanol, are fully miscible, the diagram should have been dominated
by a single-liquid region. Just looking at the phase diagram one can conclude that the
model is not correct.
Analysis Binary interaction parameters for activity models used for VLLE calculations are published for thousands of components [see, e.g., DECHEMA (158)
series]. They are regressed based on various experimental data and usually fit the
experimental points quite well. NRTL, UNIQUAC, and Wilson models extend these
binary data to multicomponent systems without requiring additional ternary, quaternary, and so on, interaction parameters. That is why these models are so popular for
modeling VLE for strongly nonideal azeotropic mixtures. This extension, however,
is not always performed correctly by the model.
For the ternary mixture methanol-water-n-butanol, the binary interaction parameters have been taken from DECHEMA (158). Some of them are recommended
values. All of them describe all the binary pairs very well. But what they predict
when combined together can be seen in Figure 1.1a. Notice that to create this VLLE
diagram an extremely robustflash calculation with stability test is essential. Without
a reliable global stability test,flash calculation can easily fail at some points in this
component space or give unstable solutions (526).
Case Study 1.5
Modeling Ternary Mixture Using Binary Interaction Parameters
7
Water
1.0
0.8
0.0
n-Butanol
1.0
Methanol
(a)
Two-liquid region
Three-liquid region
+ +
Vapor line
I I I I | l I I I I I I I I | I I I I I I I I I | I I I I I I I I I |I I I I |I I I I j I I I I I
0.1
0.0
n-Butanol
I
0.2
0.3
I
0.4
0.5
I
0.6
0.7
I
0.8
0.9
I
1.0
Methanol
Φ)
Figure 1.1
Phase diagram for nonideal system methanol-water-n-butanol, based on extension of
good binary data using NRTL model: (a) incorrect extension; (b) correct extension.
8
Chapter 1 Troubleshooting Distillation Simulations
Solution Another set of binary interaction parameters was carefully selected and
a new phase diagram was recreated (34). The VLLE changed dramatically (Fig.
1.1 b). There is no more three-liquid phase region and only one two-liquid phase
region covers only a small part of the composition space. After proper selection
of interaction parameters of the thermodynamic model, the sequence of distillation
columns converged quickly without any problems.
Morals
• To simulate multicomponent, nonideal distillation, the behavior of the mixture
must be carefully verified, starting from binary mixtures, then ternary subsystems, and so on.
• Since there may be many pairs of binary interaction parameters of an activity
thermodynamic model that describe behavior of a binary mixture equally well,
it is recommended to select one with the lowest absolute values. It is our
experience that such values extrapolate better to multicomponent mixtures.
• To correctly create a multicomponent, nonideal VLLE model, an extremely
robust VLLE calculation routine with a reliable global stability test is a must
[even if liquid-liquid (LL) split is not expected].
• Because of their visualization capabilities, VLLE phase diagrams are invaluable (for ternary and quaternary mixtures) for verification of thermodynamic
models used in distillation simulations.
CASE STUDY 1.6 VERY LOW CONCENTRATIONS
REQUIRE EXTRA CARE IN VLE SELECTION
Contributed by W. Randall Hollowell, CITGO, Lake Charles, Louisiana
Problem Bottoms from a tower recovering methanol from a methanol-water mixture contained 6 ppm methanol, exceeding the maximum specification of 4 ppm
required for discharging to the ocean.
Investigation A consultant pointed out that unusual hydrogen-bonding behavior
had been reported at very low concentration of methanol in water. He recommended
use of the UNIQUAC equation.
Wilson's equation is generally the method of choice for alcohol-water mixtures
when there is no unusual behavior. The more complex NRTL equation is the usual
choice for systems that cannot be handled by Wilson's equation. The UNIQUAC equation often applies to systems with chemicallike interactions (i.e., hydrogen bonding,
which behaves like weak chemical bonding) that neither Wilson's nor the NRTL
equations can represent.
Solution Schedule constraints precluded independently developing UNIQUAC
parameters. Various process simulation packages were checked for methanol-water
VLE with Wilson's, NRTL, and UNIQUAC equations. All of the equations in all of
the packages gave essentially the same VLE, except that UNIQUAC in one major
Case Study 1.7 Diagrams Troubleshoot Acetic Acid Dehydration Simulation
9
simulator gave lower methanol relative volatilities (by as much as 15%) at very
low methanol concentrations. This package executed much slower than the other
alternatives. The only methanol concentration predictions that were in line with the
field data came from this UNIQAC equation.
Postmortem Exceptions to the typical choices of chemical VLE methods are often not reflected in process simulation packages. For this case, the same data base
was probably used by all of the process simulation packages for the regression of
UNIQUAC parameters. Predicting VLE for high-purity mixture often requires extrapolation of activity coefficients. Only one method and one simulation package did
a good extrapolation to the low-methanol end. Cross checking of VLE equations and
packages is a useful way to identify potential problems.
CASE STUDY 1.7 DIAGRAMS TROUBLESHOOT
ACETIC ACID DEHYDRATION SIMULATION
Contributed by Stanislaw K. Wasylkiewicz, Aspen Technology, Inc., Calgary,
Alberta, Canada
This case study describes a typical thermodynamic modeling problem in distillation
simulation and an application of residue curve maps for troubleshooting and proper
model selection. The problem described here happened far too many times for many
of our clients.
Dehydration of Acetic Acid At atmospheric pressure, there is no azeotrope
in the binary mixture of water and acetic acid. However, there is a tangent pinch
close to pure water. This makes this binary separation very expensive if only a small
concentration of acetic acid in water is allowed (high reflux, many rectifying stages).
The difficult separation caused by the tangent pinch can be avoided by adding an
entrainer that forms a new heterogeneous azeotrope, moving the distillation profile
away from the binary pinch toward the minimum-boiling heterogeneous azeotrope.
A decanter can then be used to obtain required distillate purity in far fewer stages
than in the original binary distillation (525).
Distillation Simulation A column with top decanter was set up in a simulator
to remove water from a mixture containing mostly water and acetic acid. iV-Butyl
acetate was selected as an entrainer. The vapor phase was treated as an ideal gas [Idel
(227) option]. For the liquid phase, the NRTL model was selected.
Problem Even with an extreme reflux and a large number of stages, the simulation
never achieved the required high-purity water in the bottom product of the column.
Troubleshooting For the three key components (water, acetic acid, and the entrainer) a distillation region diagram (DRD) was created (227) to examine the threecomponent space for multiple liquid regions, azeotropes, and distillation boundaries,
as shown in Figure 1.2a.
10
Chapter 1 Troubleshooting Distillation Simulations
H,0
Azeotropes
Vapor line
Liquid-liquid region
Distillation boundaries
Ι Μ II | Μ II
I 0.1
0.0
n-B-C2-oate
IIIIIIIII|
0.2
0.8
(a)
0.9
1.0
Acetic acid
H20
1.0-
[k
0.9 -;
0.8 -E
0.7 -E'
0.6 -Ε
0.5 Ε
0.4 -Ε
0.3 -Ε
y
0.2 -Ε
o.i -E
o.o-
| I I I I I I Iττττγττ
II
0.3
0.1
0.4
0.0
n-B-C2-oate
0.2
0.5
Φ)
0.6
0.7
0.8
0.9
I
1.0
Acetic acid
Figure 1.2 Phase diagram for dehydration of acetic acid using «-butyl acetate (n-B-C2-oate) entrainer
at 1 atm: (a) with ideal vapor phase, incorrect; (b) accounting for dimerization, correct.
Case Study 1.8 Everything Vaporized in a Crude Vacuum Tower Simulation
11
Analysis By examining the DRD, one can easily conclude that there is something
wrong with the model. We know that there is no binary acetic acid-water azeotrope at
1 atm. The model (ideal vapor phase) is not capable of describing the system properly.
It is well known that carboxylic acids associate in the vapor phase and this has to be
taken into account, for example, by vapor dimerization model (158) [Dimer option
(227)].
Solution Instead of Idel, the Dimer option was selected (227). The DRD for the
system changed tremendously (see Fig. 1 .lb). There are no more binary azeotropes
between acetic acid and water or «-butyl acetate. After proper selection of the thermodynamic model, the distillation column converged quickly to the required high-purity
water specifications in the bottoms.
Morals
• It is important to select the proper thermodynamic model and carefully verify
the behavior of the mixture.
• Because of their visualization capabilities, DRDs are extremely useful for evaluating thermodynamic models for ternary and quaternary mixtures.
CASE STUDY 1.8 EVERYTHING VAPORIZED
IN A CRUDE VACUUM TOWER SIMULATION
Contributed by W. Randall Hollowell, CITGO, Lake Charles, Louisiana
Problem Atmospheric crude tower bottom was heated, then entered a typical,
fuel-type vacuum tower. A hand-drawn curve estimated the atmospheric crude tower
bottom composition from assay distillation data for a light crude oil. The simulation
estimated that all of the vacuum tower feed vaporized in the flash zone. This was a
preposterous result inconsistent with plant data.
Investigation The heaviest assay cuts fell progressively lower than those from
another assay of the same crude oil. The heaviest cut was at 850°F atmospheric cut
point, compared to the other assay at 1000°F. The assay data were extrapolated on a
linear scale to 100% at 1150°F atmospheric boiling point.
The high-boiling part of crude assay data must be carefully assessed. The last several assay points are often poor, particularly when coming from laboratories that cut
back on quality control for increased productivity. Crude oils have very high boiling
point material. Even light crude oils have material boiling above 1500°F. Extrapolation should be done with percent distilled on a probability-type scale, particularly for
light crudes where the slope increases very rapidly on a linear scale.
Solution A new boiling point curve was developed. Another assay was used up
to 1000°F cut point, thus reducing the needed extrapolation range. Extrapolation and
smoothing of assay data were based upon a probability scale for percent distilled.
12
Chapter 1 Troubleshooting Distillation Simulations
A 95% point (whole crude oil basis) of 1400°F was estimated by this extrapolation.
Simulation based upon the new boiling point curve was in reasonable agreement with
plant data.
Moral Crude oil high-boiling-point data are often poor and must be extrapolated.
Experience, following good procedures, and cross checks with plant data are essential
for reliable results.
CASE STUDY 1.9 CRUDE VACUUM TOWER
SIMULATION UNDERESTIMATES RESIDUE YIELD
Contributed by W. Randall Hollowell, CITGO, Lake Charles, Louisiana
Problem Process simulation estimated much lower vacuum residue yields than
obtained from plant towers and from pilot unit runs. Vacuum tower feed boiling point
curves were based upon high-temperature gas chromatography (GC) analyses.
Investigation Vacuum tower feed boiling point curves from the GC fell well
below curves estimated from assays. The GC analyses assumed that all of the feed
oil vaporized in the test and was analyzed.
The highest boiling part of crude oil is too heavy to vaporize in a GC test. Thus
the reported GC results did not include the highest boiling part (that above about
1250°F boiling point) of the feed. Simulations based upon this GC data estimated
much higher vaporization than actual because they were missing the heaviest part of
the feed.
Solution The GC method was modified to include a standard that allowed estimation of how much oil remained in the GC column and was not measured. New GC
data and extrapolations of assay data indicated that 10-15% of the feed oil was not
vaporized and thus had not been measured by the earlier GC method.
With this improved GC data, simulations agreed well with most of the pilot data.
The agreement between simulation and plant data was much better than before but
was still not good. This may have been due to poor plant data. Specifically, measured
flash zone pressures were often bad.
Moral
The analyses used for process simulations must be thoroughly understood.
CASE STUDY 1.10
MISLED BY ANALYSIS
Contributed by Geert Hangx and Marleen Horsels, DSM Research, Geleen,
The Netherlands
Problem After a product change in a multipurpose plant, a light-boiling by-product
could not be removed to the proper level in the (batch) distillation. The concentration
Case Study 1.11
Incorrect Feed Characterization Leads to Impossible Product Specifications
of the light-boiling component in the final product was 0.5%. It should have been
(and was in previous runs) 200 ppm.
Investigation The feed was analyzed by GC per normal procedure. The concentration levels of different components looked good. No significant deviation was
found. Then some changes in the distillation were performed, such as
• increasing the "lights fraction" in the batch distillation,
• increasing the reflux ratio during the lights fraction, and
• decreasing the vapor load during the lights fraction.
These changes yielded no significant improvement.
The off-specification product was redistilled. The purity was improved, but still
the specification could not be met. The GC analysis was checked (recalibrated) again.
Everything was OK.
As all of the above-mentioned actions did not improve the product quality, it
seemed that something was wrong with the column. After long discussions it was
decided to open the handhole at the top of the column and to have a closer look at the
feed distributor. Nothing suspicious was found.
Then it was decided to have a closer look at the analysis again. A gas
chromatography-mass spectrometry (GC-MS) analysis was performed. This method
showed that the impurity was not the light-boiling component as presumed. This
component was a remainder from the previous run in the multipurpose plant. Having
a boiling point much closer to the end product, this component could not be separated
in the column.
Moral It is a good idea to check the analysis with GC-MS before shutting down a
column.
CASE STUDY 1.11 INCORRECT FEED
CHARACTERIZATION LEADS TO IMPOSSIBLE
PRODUCT SPECIFICATIONS
Contributed by Chris Wallsgrove
Installation A new, entirely conventional depentanizer, recovering a C5 distillate
stream from a C5/C6/C7 raffinate mixture from a catalytic reformer/aromatics extraction unit, with some light pyrolysis gasoline feed from an adjacent naphtha-cracking
ethylene plant. The column had 30 valve trays, a steam-heated reboiler, and a condenser on cooling water.
Problem The C5 distillate was guaranteed by the process licensor to contain a
maximum of 0.5% wt. C^s. Laboratory testing by the on-site laboratory as well
13
14
Chapter 1 Troubleshooting Distillation Simulations
as an impartial third-party laboratory consistently showed about 1.0% of C^'s in
the distillate. Increasing reflux ratio or other operation adjustments did not improve
distillate purity.
Troubleshooting The tower was shut down after about 6 weeks of operation to
inspect the trays. No damage was found and the trays were reported to be "cleaner
than new."
The design simulation was rerun with a variety of options: correlations, convergence criteria, and plant analysis data. The laboratory methods, which were established American Society for Testing and Materials (ASTM) test methods, were
reviewed. It became apparent that the feed contained some low-boiling components, such as certain methyl-cyclo Cs's which were analyzed (correctly) as C^'s
but whose boiling points are in the C5 range. Since these components would end
up in the distillate, it was thermodynamically impossible to achieve the specified
performance.
Solution The higher impurity level could be lived with without excessive economic
penalty and was accepted.
Moral Correct characterization of feed components is essential even for an "ideal"
hydrocarbon mixture.
CASE STUDY 1.12 CAN YOU NAME
THE KEY COMPONENTS?
Henry Z. Kister, reference 254. Reproduced with permission.
Copyright © (1995) AIChE. All rights reserved
Installation A stabilizer separating C3 and lighter HCs from «C4 and heavier
operated at its capacity limit. It was to be debottlenecked for a 25% increase in
capacity. In addition, it was required to handle several different feedstocks at high
throughputs. Due to the tight requirements, thorough tests were conducted and formed
the basis for a simulation, which was used for the debottlenecking. We have seen very
few tests as extensive and thorough as the stabilizer tests. Two tests were conducted:
a high-reflux (HR) test and a low-reflux (LR) test.
Simulation Versus Measurement With two seemingly minor and insignificant
exceptions, all reliable measurements compared extremely well with simulated values.
In most tests, the accuracy and reliability of the data would have made it difficult to
judge whether the exceptions were real or reflected a minor test data problem. In this
case, however, consistency checks verified that the exceptions were real. The high
accuracy and reliability of the test data made even small discrepancies visible and
significant.
Case Study 1.12 Can You Name the Key Components?
15
The discrepancies occurred in the HR test, while the LR test showed no discrepancy. This was strange because the stabilizer was extremely steady and smooth during
the HR test. Any data problems should have occurred in the LR test or in both tests,
but not in the HR test alone.
The two exceptions were interlinked. For the HR test, the simulation predicted
three times the measured C5 concentration in the stabilizer overhead, which would
lead to a warmer rectifying section. Indeed, the second exception was simulated
rectifying section temperatures 2-5° F warmer than measured.
What Does the Stabilizer Do? Atfirst glance, this question appears stupid. But
it turned out to be the key for understanding the test versus the simulation discrepancy.
There was a tight specification on the content of C3 in the stabilizer bottoms.
An excessive amount of C3 would lead to excessive Reid vapor pressure (RVP) in
the bottom, which was undesirable. For similar reasons, it was desirable to minimize
/C4 in the stabilizer bottom, although there was no set specification. In the bottoms,
nC4 and heavier were desirable components and were to be maximized. Any C5
and heavier, and even «C4, ending up in the overhead product incurred an economic
penalty because the bottoms were far more valuable than the overheads. There were
no set specifications for any of these components.
With the above in mind, what is the stabilizer actually doing? Which pair is the
key components? Initially, we thought it was iCJnCn—but could it have been C^li C4,
«C4/C5, C3/C5, or maybe some other pair? Computer simulations do not answer such
questions; Hengstebeck diagrams (211, described in detail in Ref. 251) do.
Hengstebeck diagrams (Fig. 1.3) were prepared from the compositions calculated by the simulation. The HR and LR tests each require one Hengstebeck
diagram for each choice of key components; C3//C4, /C4/MC4, and nCJiC^. A
Hengstebeck diagram for the iC^InC^ separation was included in a more detailed
description of the case (254) and showed that this pair behaved the same as the C3//C4
pair.
Figure 1.3a shows that in the HR test, below the feed, the stabilizer effectively
separated C3 and lighter from 1C4 and heavier. The diagram also shows that a limited degree of separation of these components occurred in the top two stages of the
rectifying section, but pinching occurred below these. Overall, very little separation
of C3 and lighter from /C4 and heavier occurred in the rectifying section. The stabilizer essentially behaved as a stripper for separating C3 and lighter from 1C4 and
heavier.
Figure 1.3i> shows that in the HR test, above the feed, the stabilizer effectively
separated «C4 and lighter from 1C5 and heavier. It also illustrates that some separation
of these components took place in the bottomfive stages of the stripping section, but
pinching occurred above these.
Together, Figures 13a and b underscore that the stripping section of the stabilizer
separated C3 and lighter from 1C4 and heavier and, per Ref. 254, also 1C4 and lighter
from «C4 and heavier. The rectifying section of the stabilizer separated i C5 and
heavier from nC 4 and lighter.
16
Chapter 1
Troubleshooting Distillation Simulations
0
0.2
0.4
0.6
0.8
1
Mole fraction C 3 and lighter In liquid
(a)
0.4
0.6
0.8
1
Mole fraction nC, and lighter in liquid
(f)
0.3
0.5
0.7
0.9
Mole fraction nC 4 and lighter In liquid
(c)
Figure 1.3 Hengstebeck diagrams for stabilizer tests: (a) C3-1C4 separation, HR test; (b) HC4-1C5
separation, HR test; (c) «C4-/C5 separation, LR test. (From Ref. 254. Reproduced with permission.
Copyright © (1995) AIChE. All rights reserved.)
Case Study 1.12 Can You Name the Key Components?
17
In the LR test, the Hengstebeck diagrams for the C3/1C4 and ICJuCa separation
were similar to those for the HR test (Fig. 1.3a). In this test, too, the stabilizer stripping
section effectively separated C3 and lighter from / C4 and heavier and 1C4 and lighter
from nC4 and heavier.
Figure 1.3c indicates that in the LR test, above the feed, the separation of nC4 and
lighter from 1C5 and heavier was pinched. This is different from the HR test, where
the rectifying section effectively separated «C4 and lighter from / C5 and heavier. The
diagram also shows that, as in the HR test, the nC4/iC5 separation was pinched in the
stripping section.
Overall, the stabilizer behavior in the LR test resembled that of HR test, with the
exception that the rectifying section, which separated nC4 from iC5 in the HR test,
was pinched and did little of this separation in the LR test.
Why the Differences Between Measurement and Simulation? There
were two conceivable explanations to the high C 5 concentration in the HR test simulation:
1. Inaccuracies in VLE data. Detailed checks of the VLE confirmed that the
values used were very good and superior to those predicted by the commercial
simulator program, but not perfect. Two relevant inaccuracies were a high
C3//C4 volatility prediction for the stripping section and a low C4/C5 volatility
prediction for the rectifying section.
2. Efficiency differences between different binary pairs. This explanation was
unlikely because the simulation would suggest a considerably higher efficiency for the higher volatility pair, nC4/iC5, than for the lower volatility pair,
iC4/nC4. In contrast, test data (52, 379, 381) show that lower volatility pairs
have a higher efficiency.
It was therefore concluded that VLE inaccuracy is the most likely explanation.
One unanswered question is why the differences between measurement and simulation were observed only in the HR test and not in the LR test. Again, the Hengstebeck
diagrams provided the answer.
For the HR test, the Hengstebeck diagram (Fig. 13b) shows that the rectifying
section rectifies C 5 from the MC4 and lighter. Any error in the relative volatility of the
/1C4/1C5 and «C4//JC5 pairs is magnified at each separation stage. Thefinal result is
a large difference between measured and simulated top-product compositions.
For the LR test, the Hengstebeck diagram (Fig. 1.3c) shows very little separation
of nC4 from C5 in the rectifying section. Because of the pinch, an error in the relative volatility of the «C4//C5 and nC^nCs pairs is not magnified in each separation
stage. Such an error, therefore, has little effect on the separation and the temperature profile. For this reason, the LR test simulation gave a good match to measured
data.
Would the Inaccuracy Affect the Debottlenecking Predictions? The
simulation predicted higher C5 in the top product, giving a conservative forecast of
18
Chapter 1 Troubleshooting Distillation Simulations
the stabilizer performance under test conditions. The remaining question is whether
the simulation will continue to give conservative predictions under different process
conditions. The question of extrapolating test data into different process conditions is
addressed rigorously on pp. 400-405 of Ref. 251. In fact, the analysis in Ref. 251 was
part of the stabilizer-debottlenecking assignment. The conclusion reached was that
when test data are simulated with too low a volatility the simulation compensates by
using a greater number of stages (and, hence, higher efficiencies) to match the measured separation. In this case (e.g., the «C4/C5 pair in the stabilizer), the simulation
will continue to give conservative predictions when extrapolated into different process
conditions.
The converse occurs when test data are simulated with too high a relative volatility. The simulation compensates by using a smaller number of stages to match the
measured separation. In this case (e.g., the C3//C4 pair in the stabilizer), extrapolation
to other process conditions will be optimistic, sometimes grossly so.
Based on the above, it was concluded that the simulation was a reliable basis for
debottlenecking for the base case (similar feedstock to that used in one of the tests) and
for alternative feedstocks that are not widely different from the base case. However,
for those cases of feedstock variations where feed composition varied widely from
the base case, the simulation could not be used with confidence until the inaccuracy
in the C^liC^ relative volatility was mitigated.
Postmortem The column was successfully debottlenecked. The same simulation
(modified to account for the debottlenecking hardware modifications) was found to
give superb predictions of the post-revamp performance.
CASE STUDY 1.13 LOCAL EQUILIBRIUM
FOR CONDENSERS IN SERIES
Contributed by W. Randall Hollowell, CITGO, Lake Charles, Louisiana
This is my all-time favorite fractionation simulation problem. The entire refinery
capacity was sometimes limited by the gas rate, which was calculated to be zero.
Installation An atmospheric crude distillation tower had an extremely broad boiling range overhead vapor with significant ethane, high propane, through full-range
kerosene. There were three long, double split-flow condensers in series. The shells
wereflange toflange and located directly above the overhead accumulator.
Problem Simulation predicted a zero off-gas rate at peak summer temperatures.
But actual off-gas rates were substantial, even in winter. Summer crude charge rate
was sometimes reduced to avoidflaring of gas in excess of compressor capacity. There
was a strong economic incentive to increase butane spiking of crude, but this was not
done due to concerns that the gas rate would increase.
Case Study 1.13 Local Equilibrium For Condensers in Series
19
Component Balances Earlier calculations had failed to obtain an adequate material balance of the lightest components in the overhead. The naphtha GC analyses
were found to be poor. Procedures were corrected by the laboratory, and good material
balance closures were obtained.
Simulations predicted that all of the exiting vapor off gas should have been absorbed into the naphtha stream at the operating temperature and pressure. The naphtha
had much lower light-ends concentrations than predicted: 30% of the predicted for
propane, 50% for butanes, and 75% for pentanes concentration. These low concentrations in the naphtha provided the vapor off-gas flow.
With many sets of data, each giving good material balance closure, it was obvious
that the vapor exiting the overhead accumulator was not in equilibrium with liquid
exiting the accumulator. Condensers fouled severely on the tube side, but this did not
explain the large deviations from equilibrium.
Theory Conventional process simulation assumes what can be called the "universal VLE model." This model assumes that VLE is universal, that is, holds at every
location, between the total vaporflow and the total liquid flow. In shell-side condensation, the liquid and vapor are usually close to equilibrium locally when the liquid
condenses on the tube surface. But after the liquid drops off the tube (and to the
bottom of the shell), there is not enough vapor-liquid mixing to maintain equilibrium
with the downstream vapor. Thus there is usually "local VLE" at the tube surface,
but not universal VLE for the system. This local equilibrium is responsible for the
phenomena of subcooled refluxes coexisting with uncondensed vapor. Condensers
designed for total condensation have frequently been partial condensers because of
local VLE.
Deviations from universal equilibrium can be large for condensers in series with
broad boiling range mixtures. Deviations are particularly high for mixtures with high
light-ends content and for arrangements where the liquid stays largely separated
from the downstream vapor. This case study represents an extreme example of these
deviations.
For the overhead accumulator, universal VLE requires that the operating pressure
and the exiting liquid bubble point pressure be equal. But bubble point pressure was
half of the operating pressure. If the entire exiting vapor flow had been absorbed
into the naphtha stream, the bubble point pressure would still have been less than the
operating pressure.
Solution A model was developed to more closely represent the condensation steps.
Liquid condensed in each shell was assumed to be in equilibrium with the gas leaving
that shell. After the liquid left the shell in which it condensed, it was assumed to
have zero mass transfer with the gas phase but to be cooled to the local operating
temperature. This model had only one-third of the total liquid (the one-third that
condensed in the last shell) in equilibrium with the off gas. The other two-thirds of
the liquid was much heavier and caused the overall liquid bubble point pressure to be
about half that of the liquid that condensed in the last shell. The actual system was
20
Chapter 1 Troubleshooting Distillation Simulations
more complex than the above model, in particular:
• The liquid condensed in each shell was heavier than the calculated liquid in
equilibrium with the exiting vapor.
• Liquid condensed in an upstream shell experienced a moderate amount of
mixing (and thus mass transfer) with downstream vapor.
The above two effects are in opposite directions and largely cancel each other for
this case study (perhaps because of the double-split arrangement and three shells in
series). This cancellation of errors caused the model to adequately match actual liquid
composition and actual vapor rate leaving the overhead accumulator.
Morals For broad boiling range mixtures, condensers (particularly condensers in
series) have less capacity than estimated by conventional simulation with universal
VLE. This is a failure in simulation and design rather than an equipment failure.
A simulation based upon good operating data can often be used to adequately
model the effect of local equilibrium. Good heat and material balances and confidence
in them are necessary to step away from universal VLE assumptions and obtain
realistic simulations.
Process designers have compensated for their lack of understanding by using large
design margins for condensers, by specifying off-gas compressors for zero calculated
gas rates, and by greatly oversizing off-gas compressors. These practices can still
result in lack of capacity for installations such as in this case study. Even very rough
estimates of local equilibrium effects can be far better than conventional calculations
for series condensation.
For a single shell and moderate deviations from universal VLE, a reasonable subcooling delta temperature can sometimes be used for simulation and design. In extreme
cases, calculations for zones in each shell may be necessary to give good simulation or
design. For this case study, the zone method would probably have been required if the
condenser paths had been many times longer than in a double split-flow configuration.
CASE STUDY 1.14 SIMULATOR HYDRAULIC
PREDICTIONS: TO TRUST OR NOT TO TRUST?
Henry Z. Kister, reference 254. Reproduced with permission.
Copyright © (1995) AIChE. All rights reserved
In this case study, a simulator hydraulic calculation led a plant to expect a capacity
gain almost twice as high as the tower revamp actually achieved.
History A refinery vacuum tower was debottlenecked for a 30% capacity gain by
replacing 2-in. Pall rings in the wash and heavy vacuum gas oil (HVGO) sections
with 3-in. modern proprietary random packings. Only about 15-20% capacity gain
was achieved. It was theorized that above this throughput vapor maldistribution set in
Case Study 1.14 Simulator Hydraulic Predictions: To Trust or Not to Trust?
21
and caused the tower to lose separation. The refinery sought improvements to vapor
distribution in an effort to gain the missing 10-15%.
Troubleshooting A vacuum manometer pressure survey showed that at the point
where the tower lost separation the pressure drop was 0.65 in. H 2 0/ft packing. Based
on air/water measurements, many suppliers' packages take the capacity limit (or flood
point) to occur at a pressure drop of 1.5-2 in. H20/ft packing. Work by Strigle (473),
Rukovena and Koshy (418), and Kister and Gill (257, 259) demonstrated that such
numbers are grossly optimistic for modern, high-capacity random and structured
packings. Using published flood data, Kister and Gill (257, 259) showed that, for
random and structured packings, theflood pressure drop is given by
.0.7
Δ-Pfiood = 0.115^ρ
(1)
where APflood is theflood pressure drop (in. H20/ft packing) and Fp is the packing
factor (ft -1 ). This equation was shown to give a goodfit to experimental data (many
of which were generated by suppliers) and was later endorsed by Strigle (473) with a
slight change of coefficient. For the high-capacity packing in the vacuum tower, the
packing factor was 12. Equation 1 predicts that ΔΡα0(Χι was 0.65 in. H20/ft packing,
which coincided with the limit observed by the refinery.
For hydraulic calculations, gas velocity usually is expressed as a C-factor (Cs),
(ft/s), given by
(2)
where Us is the gas superficial velocity based on tower cross-sectional area (ft/s), ρ
is the density (lb/ft3), and the subscripts G and L denote gas and liquid, respectively.
The C-factor essentially is a density-corrected superficial velocity. The fundamental
relevance of the C-factor is discussed elsewhere (251).
Based on a flood pressure drop of 0.65 in. H 2 0/ft packing derived from
Equation 1, the maximum efficient capacity of the new 3-in. random packing calculated by the Kister and Gill method (251) was at a C-factor of 0.38 ft/s. This is
about 17% higher than the maximum efficient capacity for the previous 2-in. Pall
rings, just as the refinery observed.
According to the supplier's published hand correlation, which we believe was
similar to the one in the computer simulation, the maximum efficient capacity of the
packing was at a C-factor of 0.43 ft/s, which is 13% higher than observed. This high
C-factor matched a pressure drop of between 1 and 1.5 in. H 2 0/ft packing, well above
the value where the packing reached a capacity limit.
Epilogue Based on the hydraulic calculation in the computer simulation, the refinery expected that changing the 2-in. Pall rings to the 3-in. high-capacity random
packing would increase capacity by 30%. In real life, just over half of the capacity
increase materialized. The half that did not materialize is attributed to the optimistic
prediction from the simulation.
22
Chapter 1 Troubleshooting Distillation Simulations
CASE STUDY 1.15 PACKING HYDRAULIC
PREDICTIONS: TO TRUST OR NOT TO TRUST
Background This case presents a number of experiences which were very similar
to Case Study 1.14. In each one of these, vendor and simulator predictions for a packed
tower were optimistic. In each one of these, the Kister and Gill equation (257, 259)
gave excellent prediction for the maximum capacity. The Kister and Gill equation is
A/>flood = 0.115/v0·7
(1)
where A/Vod is theflood pressure drop (in. H20/ft packing) and Fp is the packing
factor (fr').
Tower A This was a chemical tower, equipped with wire-mesh structured packing
with a packing factor of 21. The tower ran completely smoothly until reaching a
pressure drop of 1 in. H 2 0/ft packing, then would rapidly lose efficiency. This compares to aflood pressure drop of 0.97 in. H20/ft packing from Equation 1. Simulation
prediction (both vendor and general options) predicted a much higher capacity.
Tower Β This was a chemical tower equipped with random packing with a packing
factor of 18. This column would rapidly lose efficiency when the pressure drop increased above 0.67 in. KbO/ft packing. This compares to aflood pressure drop of 0.87
from Equation 1. The measurement was slightly lower than the prediction because
the vapor load varied through the packings, so much of the bed operated at lower
pressure drop. Simulation prediction (both vendor and general options) predicted a
much higher capacity. Similar to Case Study 1.14, the plant initially theorized that
the shortfall in capacity was due to vapor maldistribution.
Tower C This was a chemical absorber equipped with random packing with a
packing factor of 18. The highest pressure drop at which operation was stable was
0.8 in. HiO/ft packing. Above this, the pressure drop would rapidly rise. This compares
to aflood pressure drop of 0.87 from Equation 1. Simulation predictions (both vendor
and general options) were of a 20% higher capacity.
Tower D Random packing installed in a chemical tower fell short of achieving
design capacity. The vendor method predicted flooding at a pressure drop of 1.5 in.
H20/ft packing. With a packing factor of 18, Equation 1 predicted that the packing
would flood much earlier at a pressure drop of 0.8 in. H 2 0/ft packing. The packing
flooded at exactly that pressure drop.
CASE STUDY 1.16 DO GOOD CORRELATIONS MAKE
THE SIMULATION HYDRAULIC CALCULATIONS RELIABLE?
Henry Z. Kister, reference 254. Reproduced with permission.
Copyright © (1995) AIChE. All rights reserved
Case Study 1.16 Do Good Correlations Make the Hydraulic Calculations Reliable?
23
What follows is an actual letter circulated by an engineer working for a reputable
company. The names of the correlations cited, as well as a few sentences, were
changed to protect those involved.
We have had a problem recently with the prediction of flooding in packed towers using
the Smith correlation for packed tower capacity in the Evertrue Simulator. We used this
for sizing a packed tower at 400 psia. The program predicted a percentage flood of
56 percent using the Smith correlation. The vendor predicted 106 percent of flood, and
123 percent of the packing useful capacity.
The Evertrue calculation is based on an article by Smith in Quality Chemical
Engineering magazine. Smith's method, in turn, depends on an earlier correlation by
Jones, also published in an article in Quality Chemical Engineering.
These correlations are neither well developed nor tested. Neither of these articles
(Smith's and Jones') have undergone very close scrutiny, nor are the correlations from
well-known textbooks or journals that have a tradition of peer review. One of the failings
is the use of the correlation at high pressure with hydrocarbon systems. Smith's
correction factor for high pressures produces numbers that are unreasonably high.
There is no indication that this factor is supported either by correlation or by theory. In
addition to the lack of credibility of Smith's values, the correlation of Jones, used as the
basis of the Smith method, appears inaccurate for the high-pressure systems.
For these reasons, I would not recommend use of the Evertrue Smith correlation,
regardless of the system pressure, for predicting whether or not a packed tower will
work. Instead, the 1960 correlation included on Evertrue should be used. This
correlation is based on well-known methods, and can be found in "Perry's Handbook."
It predicts the tower would be at 96 percent of flood, compared to the 106 percent
predicted by the vendor, which is much closer than the Smith correlation.
In either case, calculations must be verified by the packing vendor. 1 recommend that
the vendor verifies the results even for estimates.
What Really Happened In our experience, both the Smith and the Jones correlations are excellent. The correlation that leaves a lot to be desired for modern packing
calculations is the 1960 one. Nevertheless, the letter's author appeared to have reached
the converse conclusion.
It is a sad fact of life that correlation authors always examine their correlations
for good statisticalfit but seldom properly explore and clearly define their correlation
limitations. On page 39 of Ref. 259, Kister and Gill remark: "An excellent fit to
experimental data is insufficient to render a packing pressure-drop correlation suitable
for design. In addition, the correlation's limitations must be fully explored."
In contrast to the letter writer's comment, the problem is more acute in articles
that are peer reviewed. These contain correlations based on fundamental models that
are inherently complex. This complexity makes it very difficult to properly identify
the limitations. A peer review offers little help unless the reviewer spends several
days checking the calculations. This rarely happens.
The Smith correlation works very well for vacuum and atmospheric pressures,
perhaps up to 50 psia. It was never intended to apply to 400 psia. Unfortunately,
Smith's article only contained a hint of the pressure limitation but nofirm statements
to that effect. It, therefore, went into the Evertrue simulator without a warning flag
24
Chapter 1 Troubleshooting Distillation Simulations
above 50 psia. In this case, the 1960 correlation was found to work well. This appears
to be a case of two wrongs making a right.
Epilogue There are many correlations in the published and proprietary literature
for which the limitations are neither well explored nor well defined. Limitations
unflagged in the original articles remain unflagged in the simulator version.
Despite the letter writer's wrong conclusion, his bottom line is broadly valid. A
simulator correlation cannot be trusted, even when the correlation is good, unless the
correlation's limitations are known and included in the simulation. An independent
verification, say, by a supplier or an independent method, is a good idea. When
Distillation Design (251) was compiled, special effort was made to talk to authors
of good correlations, with the objective of exploring their limitations and filling in
the missing blanks. For instance, the pressure ranges for the application of Smith's
correlation were listed in Distillation Design almost two years before the above letter
was written.
Chapter 2
Where Fractionation
Goes Wrong
Fractioination issues featured very low on the distillation malfunctions list for the
last half century (255). Only two issues rated a mention, intermediate-component
accumulation and two liquid phases. Neither of these made it to the top 20 distillation
malfunctions. This contrasts the author's experience. Intermediate-component accumulation is experienced frequently enough to justify a place in the top 20, maybe even
close to the 10th spot. The large number of cases of intermediate-component accumulation reported in this book will testify to that. In many cases, the accumulation led to
periodic flooding in the tower. Other problems induced by the accumulation include
corrosion, product losses, product contamination, and inability to draw a product
stream.
A second liquid phase, either present where undesirable or absent where desired,
was troublesome in several case histories, most from chemical towers. In many cases,
issues in the overhead decanter or its piping induced an undesirable phase either into
the reflux or into the product. Presence or absence of a second liquid phase caused
not only separation issues and production bottlenecks but in some cases also violent
reactions, damage, and explosions.
Other fractionation issues include insufficient reflux, insufficient stages, insufficient stripping, and excessive bottom temperatures. Although basic to fractionation,
it is amazing how often it is overlooked. Unique multicomponent issues include absorption effects in wide-boiling mixtures and location of side draws. Azeotropic and
extractive distillation have their own unique challenges.
CASE STUDY 2.1
NO REFLUX, NO SEPARATION
Contributed by Ron F. Olsson, Celanese Corp.
The feed to a 55-tray tower came in 10 trays below the top. The tower was separating
an alcohol as the distillate from a glycol as a bottom product. A simulation detected
that the losses of glycol in the distillate were excessive. The glycol losses were
Distillation Troubleshooting. By Henry Z. Kister
Copyright © 2006 John Wiley & Sons, Inc.
25
26
Chapter 2 Where Fractionation Goes Wrong
estimated to cost about $250,000 per year. Further investigation revealed that the
reflux had been eliminated. Apparently, the reflux rate was cut out during the 1970s,
when energy savings were most important. Over the years, this mode of operation
became the norm. Further, corrosion of the trays reduced their efficiency, causing the
separation to deteriorate.
The glycol losses were drastically cut once the reflux was reintroduced.
CASE STUDY 2.2 HEAVIER FEEDSTOCK
IMPEDES STRIPPING
Contributed by Dmitry Kiselev and Oleg Karpilovskiy, Koch-Glitsch,
Moscow, Russia
Installation A diesel hydrotreating unit was revamped to a dewaxing process. Due
to increase in production of wild naphtha and gases, the diesel stabilizer was revamped
also. The revamp design proposed to use afired heater reboiler to provide the desired
dieselflash point. The refinery did not have enough time to revamp the heater, so the
unit started with stripping steam injection under the bottom tray, instead of the heater
reboiler circuit.
Problem After several months of operation, the refinery decided to complete the
unit revamp. The heater reboiling circuit was made operational while the steam line
was disconnected. The result was surprising: Theflash point of diesel decreased by
20°C, even though design specifications of the reboiling circuit (flow rate and heater
outlet temperature) were achieved.
Investigation Thefirst suspicion was that tray damage occurred during start-up,
but checking of this required a shutdown or gamma scans, which were expensive
options in that location. A complete set of process data was collected instead and
a tower simulation prepared. The feed composition was surprisingly much heavier
than design. The ASTM D86 50% percent point increased from 265 to 320°C. The
reflux rate was half the design value. The simulation showed almost no vapor in the
stripping part of the column. The heater outlet temperature could not be increased
beyond 330°C to generate additional vapor due to vibration of the 75-m-long heater
outlet line. The simulation showed that heater outlet temperatures even as high as
350-360°C would have been insufficient for achieving the diesel flash point specification.
The reason for poor operation was the new feed composition. The reason for the
heavier feedstock was a revamp of the atmospheric tower of the crude oil distillation
unit that took place at the same time as the last stage of the revamp of the hydrotreating
unit. The crude tower revamp added a diesel draw in order to send light diesel directly
to product blending and to dewax the heavy diesel only.
Case Study 2.4 Heavies Accumulation Interrupts Boil-Up
27
Solution During the next turnaround, the stripping steam line was reconnected.
Simultaneous use of stripping steam and reboiling allowed the tower to achieve the
product specification.
CASE STUDY 2.3 POOR H 2 S REMOVAL FROM
NAPHTHA HYDROTREATER STRIPPER
Contributed by Mark Pilling, Sulzer Chemtech, Tulsa, Oklahoma
Installation
Naphtha hydrotreater stripper, stripping H 2 S from naphtha.
Problem Tower had been operating fine for extended period. At a later time, it
could no longer meet H2S specification for bottom product.
Troubleshooting The tower was operated at the same bottom temperature as it
always had been, but the reflux rate was much lower than normal. Investigations
revealed that the feed to the unit had become considerably heavier. For this heavier
feed, the operating bottom temperature was too low to provide sufficient stripping for
H2S removal.
Solution Bottom operating temperature and reflux ratio were raised to ensure
proper H2S removal.
Morals Tower operation needs to vary to accommodate changing feedstocks. Operators need to be trained to recognize the critical operating set points.
CASE STUDY 2.4 HEAVIES ACCUMULATION
INTERRUPTS BOIL-UP
Contributed by Ron F. Olsson, Celanese Corp.
Figure 2.1 shows a system that recovered product from residues. The system removed
product continuously as an overhead product from column CI. The heavy residues
were periodically removed from drum Dl.
Occasionally, the temperature of drum Dl would rise to the point where the
reboiler could no longer boil it. The plant would then dump the drum content out of
the bottom (route B). When the drum contents were dumped, lots of lights were lost
in the dump. When the reboil ceased, liquid from column CI dumped and much of it
ended in the Dl drum dump.
The problem wasfixed by removing bottom residue streams continuously from
both points A and B. It took some trial and error to correctly set the bottom rate.
28
Chapter 2 Where Fractionation Goes Wrong
CASE STUDY 2.5
TO A PINCH
INTERREBOILER DRIVES TOWER
Henry Z. Kister, references 254,276. Reproduced with permission.
Copyright © (1995) AIChE. All rights reserved
A composition pinch occurs when, due to an insufficient driving force, the change in
composition on each successive distillation stage diminishes and approaches zero. In
the stripping section, an insufficient driving force usually coincides with an excessively low stripping ratio (V/B). Increasing the stripping ratio can reinstate composition changes, but at the expense of higher vapor and liquid hydraulic load. These
higher loads cannot be tolerated when the tower nears a capacity bottleneck.
In this case, a clever debottleneck scheme looked great on the simulation. Yet
pinches and mislocated feeds, readily visible on McCabe-Thiele diagrams, remain
hidden on computer screens. It took a McCabe-Thiele diagram (341, described in
detail in Ref. 251) to see that the scheme would drive the tower too close to a pinch
and would be risky. Fortunately, the McCabe-Thiele diagram was prepared before
the scheme was implemented.
Background An olefins plant was being debottlenecked for a 15% increase in
throughput. The C2 splitter (Fig. 2.2a) was a major bottleneck. The tower contained
95 trays in the rectifying section and 45 trays in a smaller diameter stripping section.
The vapor feed entered close to its dew point.
Case Study 2.5
Interreboiler Drives Tower to a Pinch
29
(a)
οα.
0.8
—
s
c 0.7
ο
α
Ε
οο
φ*
JC 0.6
σι
ο
c
ο
υ
2 0.5
π-
Upper feed
-
Interreboiler and
lower feed
,
ω
ο
0.4
/ /
0.3
κ
0.4
1
0.5
1
0.6
1
0.7
Mole fraction of light component in liquid
(b)
Figure 2.2 Proposed C2 splitter debottleneck: (a) proposed changes, adding an interreboiler and
splitting the feeds; (b) McCabe-Thiele diagram that clearly warned of imminent pinch. (From Ref. 254,
276. Reproduced with permission. Copyright © (1995) AIChE. All rights reserved.)
30
Chapter 2 Where Fractionation Goes Wrong
Hydraulic calculations showed that the rectifying section would be barely capable
of handling the increased throughput. The stripping section was undersized for the
higher throughput and would require an expensive retray with specialty high-capacity
trays.
Alternative Scheme A clever alternative scheme was conceived with a potential
of slashing the revamp costs as well as saving energy. There was scope to have the
feed enter as two separate streams. One contained 70% ethylene, made up 60% of the
feed, and was to enter on tray 55 (Fig. 2.2a). The second contained 50% ethylene,
made up 40% of the feed, and was to enter on tray 45. To unload the bottom section,
an interreboiler was to be added at tray 46, supplying about 10% of the total column
heat duty. Since the interreboiler was to convert 10% of the liquid into vapor, the vapor
and liquid traffic in the narrow-diameter section below would diminish by 10%. This
unloading was enough to accommodate the post-debottleneck throughput.
In principle, the interreboiler was to unload the narrow-diameter section that
bottlenecked the tower. Splitting the feed was to assist in expanding the stripping
section from 45 to 55 trays without adversely affecting separation in the rectifying
section. The extra stripping trays were needed to accommodate for the lower V/B
(stripping ratio) generated below the interreboiler.
A computer simulation showed that the scheme would work well. There were no
convergence problems, nor was there anything about the simulation that may indicate
a potential problem. The scheme received the go-ahead.
Just prior to going into the final design, a McCabe-Thiele diagram was constructed to explore hidden traps (Fig. 2.2b). The pinch just below the interreboiler
was glaring.
Postmortem The interreboiler caused the V/B for the section below to diminish
almost to the minimum stripping. Although hydraulically the interreboiler would have
fulfilled its function, the column may not have achieved the design separation due
to the pinch. Alternatively, to overcome the pinch, the operator would have needed
to raise both the reflux and reboil and would have possibly encountered a hydraulic
bottleneck.
CASE STUDY 2.6 TEMPERATURE MULTIPLICITY IN
MULTICOMPONENT DISTILLATION
Henry Z. Kister and Tom C. Hower, reference 263. Reproduced with
permission. Copyright © (1987) AIChE. All rights reserved
Installation A lean-oil still in an absorption-refrigeration gas plant (Fig. 2.3a).
This still was the last step of purification of the absorption oil before the oil was
returned to the plant absorber to absorb heavy components from natural gas. Feed
to the still was the absorption oil, containing the absorbed gasolines and some LPG.
Lighter components were removed from the oil upstream of the still. Lean oil left
215°F
30
I
Feed
Leanoil
still
45-50 gpm
c
96°F
)
V J
Ο
Gasoline and
[XH— lighter to
storage
525-550° F
Surge
drum
Lean oil
(bottoms)
400-600 gpm
-<TC
Fuel
(a)
Reflux flow, gpm
Φ)
Figure 2.3
Multicomponent still that showed temperature multiciplity: (a) lean-oil still; (b) variation
of lean-oil still top temperature with reflux. (From Ref. 263. Reproduced with permission. Copyright ©
(1987) AIChE. All rights reserved.)
32
Chapter 2 Where Fractionation Goes Wrong
as the still bottom product, while gasoline and LPG were the top product. The still
operated at 210 psig. Note the large temperature difference between the bottom and
top of the still.
The main objective of the still was to keep gasoline out of the column bottom. This
was achieved by the furnace outlet temperature control. The reflux rate was trimmed
by manually adjusting theflow controller set point, so as to give a reasonably constant
column overhead temperature. The reflux drum was flooded, and liquid level in the
condenser was used to control column pressure.
Problem The plant absorber appeared to be malfunctioning. It did not absorb all
the heavy ends out of the gas.
Investigation The initial boiling point (IBP) of the lean oil leaving the still was
low, which indicated the presence of a substantial quantity of gasoline in the still
bottom. This suggested that the still was malfunctioning. The still showed no signs
of flooding. The control temperature, the overhead temperature, and the reflux rate
appeared to be at their design values. The composition of the top product was not
analyzed.
Solution The problem was caused by insufficient reflux rate. The low reflux rate
was unnoticed because of an incorrectly sized orifice plate in the still reflux line.
When the orifice plate was replaced and the correct reflux flow set, the plant observed
a large permanent increase in fuel usage and a large drop in the apparent quantity
of absorption oil, indicating that the gasoline was being stripped off the bottom.
Following this, the plant absorber started functioning normally and absorbing heavy
ends out of the gas.
Analysis The problem was particularly difficult to detect because of the unusual
behavior of the overhead and bottom temperatures. Normally, when a substantial
amount of light impurity is present in the bottom, one would expect the bottom temperature to drop; when a substantial amount of heavy impurity is present in the column
overhead, one would expect this temperature to rise. Over-reboiling can bring the bottom temperature back up, but in such a case, one would expect the top temperature
to rise further above design.
The above considerations are generally valid for binary distillation and often, but
not always, for multicomponent separations. This case is an example of a multicomponent distillation where the above considerations do not apply.
In general terms, at the low reflux rates the column was operated as a gasolineLPG separator instead of an absorption oil-gasoline/LPG separator. This lowered
temperatures throughout. However, the column was over-reboiled; this returned the
bottom and top temperatures to their design values. This is explained in detail below.
At the low reflux ratio, a substantial fraction of the gasoline reached the bottom.
This would have caused a lower temperature at the base of the column, but the control
system increased the reboil rate (i.e., over-reboiled) to keep the bottom temperature
up at design. Because of the low reflux ratio, however, the over-reboil action boiled
over a significant fraction of absorption oil and perhaps most of the gasoline. The
Case Study 2.7
Composition Profiles Are Key to Multicomponent Distillation
33
column probably fractionated out most, but not all, of the absorption oil. The mixture
arriving at the top tray therefore contained the LPGs, some gasoline, and a small
quantity of absorption oil. The presence of the absorption oil acted to increase the
top tray temperature; the absence of gasoline that was lost to the bottom acted to
decrease it. By varying the reflux rate as in normal operation, one could keep the top
temperature at its design value.
Variations of the column overhead temperature are shown in Figure 23b. Under all these conditions, bottom temperature was controlled at 525-550°F. The column overhead initially operated at point A at the low reflux conditions. At the correct reflux rate, the overhead temperature operated at point B. Note the existence of
point C on this curve, at which an increase in reflux rate causes an increase in overhead
temperature. This operating condition (point C) has actually been observed in this
type of column.
CASE STUDY 2.7 COMPOSITION PROFILES ARE KEY
TO MULTICOMPONENT DISTILLATION
Contributed by Frank Wetherill (retired), C. F. Braun, Inc.,
Alhambra, California
Installation A product column in a specialty chemical plant producing a heavy,
water-soluble glycol product. The process is similar to that described in Case
Study 15.1. The column separated glycol product from high-boiling residues. The
column is shown in Figure 2.4a.
Problem Although water was removed from the column feed and water-forming
reactions were suppressed by lowering the base temperature in a manner similar to
that described in Case Study 15.1, a very small quantity of water (about 0.1%) was
still present in the product. It was economical to remove even that amount of water
from the product.
Investigation This amount of water was very small and could have originated
either in the column feed or from water-forming condensation reactions at the column
base. Tackling this problem at the source would have been difficult.
It was realized that the product was very hygroscopic. Therefore, it was suspected
that after the product was condensed and subcooled in the overhead condenser it
reabsorbed water from the inerts stream.
Solution It appeared beneficial to withdraw the product upstream of the point
where it was being subcooled. A suitable point was the top tray of the column. The
column was modified to withdraw product from this tray, as shown in Figure 2.4b.
This eliminated the water problem.
Postmortem The relative volatility for glycol-water separation was large (the
atmospheric boiling point of the glycol was greater than 400°F). Any liquid water
present in the reflux stream therefore easily vaporized on the top tray.
Chapter 2 Where Fractionation Goes Wrong
STM
Residues
(a)
STM
(b)
Figure 2,4
Glycol product column: (a) initial; (b) modified.
Case Study 2.8
Composition Profile Plot Troubleshoots Multicomponent Separation
35
It may appear that withdrawing water from the top tray, instead of from the reflux drum, would have enriched the product with the heavier impurity because the
condenser stage was no longer available for the product-residue separation. This enrichment, however, was minimal, because even before the modification the condenser
behaved as a total condenser from the product-residue separation viewpoint (product
was withdrawn as liquid) and had therefore contributed little to the product-residue
separation.
Another Plant A glycol/residue tower in a completely different plant and operated
by a different company experienced a somewhat similar problem. In that case, the
amount of water was small. Instead of escaping in the inerts route, the water was
condensed and refluxed back into the tower. Over a period of time, water built up in
the overhead loop and adversely affected product purity. The problem was solved by
periodically running the reflux drum liquid to aflash tank.
CASE STUDY 2.8 COMPOSITION PROFILE PLOT
TROUBLESHOOTS MULTICOMPONENT SEPARATION
Henry Z. Kister, Rusty Rhoad, and Kimberly A. Hoyt, references 254,273.
Reproduced with permission. Copyright @ (1996) AIChE. All rights reserved
Engineers seldom bother plotting composition profiles in multicomponent distillation.
Like the McCabe-Thiele and Hengstebeck diagrams, column composition profiles
(generated from the compositions calculated by the simulation; Refs. 243 and 251 have
detailed examples) are a superb analytical and troubleshooting tool that provides visualization that simulations do not. Undetected abnormalities often reveal themselves
as a column malfunction after start-up. This case shows how a composition profile
identified a very unforgiving column design.
Background A chemical vacuum tower containing structured packing (Fig. 24.1 a
and 2.5) separated a heavy key (HK) component from an intermediate key (IK)
component in its lower section. There was a specification of 0.3% maximum IK in
the bottom and 1.0% maximum HK in the vapor side product. Feed to the column
contained many other components that were lighter or heavier than the keys.
Problem While the bottom product was on specification, the vapor side product
contained about 10% HK, which was several times higher that the design.
Troubleshooting Initial suspicion was a malfunction of the structured packing
or the distributors. The design height equivalent of a theoretical plate (HETP) was on
the low side, but not grossly so. The lower bed was simulated by eight stages; six or
seven would have been a closer estimate. The distributor design was found to be good,
and the distributor was successfully water tested and debugged at the manufacturer's
shop before being installed in the tower. The VLE data were examined. While not
perfect, the volatility estimate was quite reasonable.
36
Chapter 2 Where Fractionation Goes Wrong
Figure 2.5
Composition profile pinpoints sensitivity of heavy key. (From Ref. 254, 273. Reproduced
with permission. Copyright © (1996) AIChE. All rights reserved.)
Next, plugging of the packing or distributors was suspected. Extensivefield tests,
described in detail in Case Study 4.9, were performed and showed that the tower
operated well below flood and that both the pressure drop andflood point were well
inline with predictions. Gamma scans verified that distribution below theflood point
was quite reasonable and there were no signs of plugging.
Likely Cause During the troubleshooting, the design simulation was revisited
and the composition profiles plotted. The profiles plot the concentrations of each
component in the liquid (one plot) and the vapor (a second plot) against the theoretical
stage number. Figure 2.5 is a condensed version, singling out the IK in the liquid and
the HK in the vapor. These were the prime actors in the current problem. The diagram
shows an extremely steep peak for the HK in the vapor. Stage 18 vapor contains
55% HK. By the time the vapor draw-off is reached on stage 13 (five stages up), the
HK concentration is supposed to drop to 1%. On stage 14, the HK concentration is
about 7%, and on stage 15, it is 18%. Figure 2.5 therefore depicts a very unforgiving
composition profile.
Case Study 2.9
Accumulation Causes Corrosion in Chlorinated Hyrocarbon Tower
37
Achieving the design separation depends upon the lower packed bed successfully
developing eight theoretical stages. Should this number fall a stage or two short, the
concentration of HK in the vapor side draw would skyrocket, with product going
severely off specification. Sources that can make the number of stages fall short of
expectation by one or two were (and usually are) abundant. These include a slightly
optimistic design HETP, inaccuracies in VLE, differences between design and actual feed compositions, relatively small scale fouling or maldistribution, and even
disturbances to the feed and the heating and cooling media.
CASE STUDY 2.9 WATER ACCUMULATION CAUSES
CORROSION IN CHLORINATED HYROCARBON TOWER
Installation A tower separating HCl and HC gases from chlorinated HCs (Fig.
2.6). There was a very small amount of water (~3 ppm) in the feed.
HCl
C3 =
-33°C
Λ
>
Corrosion
here
HCl
C3 =
Chlorinated HCs
water 3 ppm
J
77°C
Chlorinated HCs
Figure 2.6
Water accumulation in chlorinated hydrocarbon column.
38
Chapter 2 Where Fractionation Goes Wrong
Problem There was severe corrosion on trays 15-30. There was no corrosion at
the top 5 trays and the bottom 15 trays. The column run length was less than a month;
afterward it needed shutting down to replace the trays.
Cause Top temperature was too cold, and bottom temperature too hot, to allow
water to escape. In the bottom section, repulsion of water by the chlorinated HCs
increased its volatility. As a result, the water became trapped in the tower and concentrated near the feed. The accumulation could be predicted using a NRTL or UNIQAC
model, but not using ideal solution or equation-of-state models.
Solution The problem was resolved by replacing trays 15-30 by trays fabricated
from Hastelloy C.
Related Experience A decomposition reaction took place near the bottom of
one chemical tower, yielding a corrosive compound. The boiling point of that compound was well below the tower overhead temperature. It therefore accumulated and
corroded trays in the middle of the tower.
CASE STUDY 2.10 HICCUPS IN A REBOILED
DEETHANIZER ABSORBER
Installation A refinery reboiled deethanizer absorber (Fig. 2.7). The top section
of the tower used a naphtha stream to absorb C3 and C4 HCs from a gas stream that
went to fuel gas.
Feed to the tower contained a small amount of water. Free water was removed in
the feed drum upstream of the tower, but the separation was not perfect. In addition,
the small quantity of water dissolved in the HC feed would not be removed in the
feed drum.
Bottoms from the tower went to a debutanizer that operated much hotter than the
deethanizer. The debutanizer recovered the C3 and C4 HCs in the top product, leaving
gasoline as the bottom product.
Problem Plant economics favored maximizing recovery of C3 and C4 in the deethanizer bottoms. To achieve this, the control temperature in the stripping section was
lowered. The system worked well for 2-3 days following the change. Then the debutanizer pressure suddenly shot up, and a large slug of water was observed tofill the
boot of the debutanizer reflux drum. A few minutes later the water disappeared. Two
to three days later the process repeated. The possibility of steam or water leaks was
investigated, but none were found.
Solution The tower was returned to its previous mode of operation with the higher
deethanizer control temperature.