1
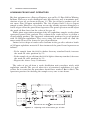
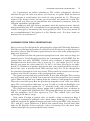
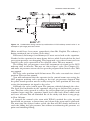
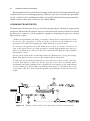
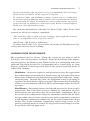
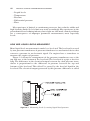
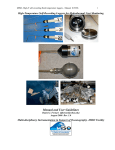
Troubleshooting Process
Plant Control
Norman P. Lieberman
A John Wiley & Sons, Inc., Publication
Troubleshooting Process
Plant Control
Troubleshooting Process Plant Control
Other Books by Norman P. Lieberman
• Troubleshooting Refinery Operations—Penn Well Publications
• Troubleshooting Process Operations 4th Edition—PennWell Publications
• A Working Guide to Process Equipment (with E. T. Lieberman)—3rd
Edition—McGraw Hill Publications
• Troubleshooting Natural Gas Processing (order by e-mail at norm@
lieberman-eng.com)
• Process Design for Reliable Operations 3rd Edition (order by e-mail at
[email protected])
Copies of the first three texts are best ordered from the publishers, but may
be ordered through us. E-mail ([email protected]). Troubleshooting
Refinery Operations (1980) has been incorporated into Troubleshooting
Process Operations and Troubleshooting Natural Gas Processing.
Troubleshooting Process
Plant Control
Norman P. Lieberman
A John Wiley & Sons, Inc., Publication
DISCLAIMER
Company names and the names of individuals used in this book are entirely fictitious. I have
selected company names and the names of colleagues entirely at random. Technically, the
stories I have related are correct but are sometimes combinations of actual incidents. Any
similarity to actually existing events, process plants, or individuals is purely a coincidence. Also,
I sometimes have related projects executed by operators or other engineers as if I had myself
originated, rather than just participated in, such events. I have consistently failed throughout
this text to assign credit to other individuals for their ideas, which I have not stolen but only
borrowed. Any names of actual individuals or process plants or refineries have been chosen at
random and do not correspond to any real events connected with the people or locations
mentioned in my text.
Norman P. Lieberman
Copyright © 2009 by John Wiley & Sons, Inc. All rights reserved
Published by John Wiley & Sons, Inc., Hoboken, New Jersey
Published simultaneously in Canada
No part of this publication may be reproduced, stored in a retrieval system, or transmitted in
any form or by any means, electronic, mechanical, photocopying, recording, scanning, or
otherwise, except as permitted under Section 107 or 108 of the 1976 United States Copyright
Act, without either the prior written permission of the Publisher, or authorization through
payment of the appropriate per-copy fee to the Copyright Clearance Center, Inc., 222
Rosewood Drive, Danvers, MA 01923, (978) 750-8400, fax (978) 750-4470, or on the web at
www.copyright.com. Requests to the Publisher for permission should be addressed to the
Permissions Department, John Wiley & Sons, Inc., 111 River Street, Hoboken, NJ 07030,
(201) 748-6011, fax (201) 748-6008, or online at http://www.wiley.com/go/permission.
Limit of Liability/Disclaimer of Warranty: While the publisher and author have used their best
efforts in preparing this book, they make no representations or warranties with respect to the
accuracy or completeness of the contents of this book and specifically disclaim any implied
warranties of merchantability or fitness for a particular purpose. No warranty may be created
or extended by sales representatives or written sales materials. The advice and strategies
contained herein may not be suitable for your situation. You should consult with a professional
where appropriate. Neither the publisher nor author shall be liable for any loss of profit or any
other commercial damages, including but not limited to special, incidental, consequential, or
other damages.
For general information on our other products and services or for technical support, please
contact our Customer Care Department within the United States at (800) 762-2974, outside the
United States at (317) 572-3993 or fax (317) 572-4002.
Wiley also publishes its books in a variety of electronic formats. Some content that appears in
print may not be available in electronic formats. For more information about Wiley products,
visit our web site at www.wiley.com.
Library of Congress Cataloging-in-Publication Data:
Lieberman, Norman P.
Troubleshooting process plant control / Norman P. Lieberman.
p. cm.
ISBN 978-0-470-42514-5 (cloth)
1. Petroleum refineries–Maintenance and repair. I. Title.
TP690.3.L534 2009
665.5028′8–dc22
2008032181
Printed in the United States of America
10 9 8 7 6 5 4 3 2 1
Dedication
One of life’s little pleasures is working with quality and dedicated people, such
as April Montecino Winn and Phil Negri. Persistently and consistently they
have worked with my wonderful draftsman, Roy Williams, to bring order to
my scribbled manuscript and illegible drawings to produce this book. Inspired
by the Creator, these three wonderful people have brought Order out of
Chaos.
I, too, have been inspired by my equally wonderful partner in life, Liz. She
is a light unto my life.
v
Contents
PREFACE
ix
INTRODUCTION—A HISTORY OF POSITIVE FEEDBACK LOOPS
xi
Chapter 1 Learning from Experience
1
Chapter 2 Process Control Parameter Measurement
9
Chapter 3 Dependent and Independent Variables
21
Chapter 4 Binary Distillation of Pure Components
29
Chapter 5 Distillation Tower Pressure Control
37
Chapter 6 Pressure Control in Multicomponent Systems
51
Chapter 7 Optimizing Fractionation Efficiency by Temperature
Profile
59
Chapter 8 Analyzer Process Control
67
Chapter 9 Fired Heater Combustion Air Control
75
Chapter 10 Sizing Process Control Valves
85
Chapter 11 Control Valve Position on Instrument Air Failure
93
Chapter 12 Override and Split-Range Process Control
101
Chapter 13 Vacuum System Pressure Control
107
Chapter 14 Reciprocating Compressors
115
Chapter 15 Centrifugal Compressor Surge vs. Motor Over-Amping
123
vii
viii
CONTENTS
Chapter 16 Controlling Centrifugal Pumps
131
Chapter 17 Steam Turbine Control
139
Chapter 18 Steam and Condensate Control
147
Chapter 19 Function of the Process Control Engineer
155
Chapter 20 Steam Quality and Moisture Content
163
Chapter 21 Level, Pressure, Flow, and Temperature Indication
Methods
179
Chapter 22 Alarm and Trip Design for Safe Plant Operations
195
Chapter 23 Nonlinear Process Responses
205
ABOUT MY SEMINARS
213
FURTHER READINGS ON TROUBLESHOOTING PROCESS
CONTROLS
217
THE NORM LIEBERMAN VIDEO LIBRARY OF
TROUBLESHOOTING PROCESS OPERATIONS
219
INDEX
221
PREFACE WARNING:
The Surgeon General
Has Determined That
This Book Is a Fraud
Dr. R. K. Sudkamp, Ph.D., having reviewed this text, reports that this book’s
claim to be a technical work on the exalted subject of Process Control has no
basis. Further, findings by the Federal Communications Commission have
determined that this book cannot claim to be a Process Control text as enumerated below:
•
•
•
The entire book is free of complex mathematics. Even simple equations
are rarely encountered.
The text is much too easy to read for any respectable technical book.
Much of the so-called “advanced technology” described by the author is
40 years old and is already in widespread practice in the process
industry.
While Professor Sudkamp notes the potential usefulness of this book to
solve practical plant process problems, he also observes this is more than offset
by its total lack of applicability as a postgraduate university text. Professor
Sudkamp, of the University of Stockholm, has reported a deep loss of personal
dignity as a consequence of his exposure to Mr. Lieberman’s book, which he
considers to be an insult to his lofty intellect.
ix
Introduction—
A History of Positive
Feedback Loops
Process Control Engineering is the most important branch of Chemical Engineering. Ask any panel board operator in a petrochemical plant or refinery.
The P&IDs (Process and Instrumentation Diagrams) are the definitive engineering documents describing how a plant works. The Process Control Engineer has the ultimate responsibility for creating, maintaining, and interpreting
the P&IDs. It is his job—and perhaps his most important function—to explain
to the panel operator how the control valves interact with the process plant
to achieve unit stability.
I don’t know why I wrote “his job,” because half of the Process Control
Engineers I work with are women. Women often make better control engineers and panel board operators than men, because they are more patient.
Men often are driven to reach some distant goal quickly. Women, being patient,
will take a more measured approach to restore stability during a process
upset.
For example, one question I am frequently asked by younger male process
engineers and console operators is how to meet girls. One fellow, Jake, described
his problem. “I met this lady at a bar, Norm. I introduced myself and asked
her name.”
“Hi, I’m Linda.”
“Can I buy you a drink, Linda?”
“Actually, Jake, I’m perfectly capable of buying my own drink.”
“Norm, I hate when girls blow me off like that. I couldn’t think what else
to say.”
xi
xii
INTRODUCTION—A HISTORY OF POSITIVE FEEDBACK LOOPS
“Okay, Jake. Here’s the correct line,” I advised. “Say Linda, I’m conducting
a survey. Which is better, negative feedback or positive feedback?”
“Well, Jake,” Linda will answer, “I’m a positive-thinking person. Therefore
I’m sure that positive feedback is best.”
“Not so, Linda,” you’ll say, “As a highly paid Process Control Engineer I’ve
found negative feedback is best. Do you mind if I explain?”
“Okay, Jake,” she’ll say, “Maybe I will have a small scotch and soda.”
“Let’s say, Linda, you’re driving your car uphill. The car is in automatic
cruise control. As the gradient increases, the car slows. The gas pedal is automatically depressed to accelerate the car. But as the car engine slows, the
amount of combustion air drawn into the engine is reduced. As the air flow
drops, the incremental gasoline injected into the cylinders does not burn. But
as the gasoline vaporizes, it also cools the engine’s cylinders. This reduces the
cylinder pressure and hence the force acting on the pistons heads. This decreases
the engine horsepower. The engine and car both slow further. This signals the
automatic cruise control to inject more gasoline into the cylinders. As the
engine is already limited by combustion air and not by fuel, the extra gasoline
just makes the problem worse. If you don’t switch off the cruise control and
return to manual operation, the car will stall out and the engine will flood with
gasoline.
“The problem, Linda, is positive feedback. The loss of engine speed reduced
the air flow to the engine and also automatically caused more gasoline to flow
into the engine. The problem fed upon itself. That’s why we call this a positive
feedback loop. What the Process Control Engineer wants is negative feedback.
For a negative feedback loop to work, the engine cannot be limited by the
combustion air flow.”
“Linda, I run into this problem all the time. It happens in distillation towers,
vacuum jet systems, and fired heaters. You see, control loops for process equipment only function properly when they are running in the range of a negative
feedback response. Positive feedback is dangerous in that it leads to process
instability.”
Jake has subsequently tried this approach with Gloria, Janet, and Carol, all
with the same result. When he comes to the part about process instability, each
lady suddenly remembers an important appointment and rushed out of
the bar.
NOTE TO READERS
I’ve written this book for three groups of people:
•
•
The experienced plant panel board operator
The Process Control Engineer who, with his degree in hand, must now
face up to the real world
INTRODUCTION—A HISTORY OF POSITIVE FEEDBACK LOOPS
•
xiii
The Process Engineer who must design control loops for new or revamped
units
The text is very basic and very simple. Lots of new control concepts are
presented. But they are all based on old technical concepts. Likely, you are
reading this text because you are one of the 12,000 students who have already
attended one of my seminars, or read one of my other books, or viewed my
videotapes on process technology.
If not, let me tell you something about myself. My descriptions about
control loops, process control optimization, process instrumentation, and
control valves in this book are based on my personal experience which encompasses 44 years. Except for the story about Linda and Jake. I just made that
up.
LATER THAT EVENING
My wife and partner, Liz, has just read the story about Linda and Jake. Liz
says, “Can’t you give an example of a positive feedback loop without all of the
sexist stupidity?” Okay, I will:
•
•
•
•
•
•
•
•
•
CO2 accumulates in the atmosphere.
The rate of CO2 accumulation between 1968 and 2008 was 0.51% compounded annually.
Global warming has increased by 1 °F since the early 1900s, including the
surface of the oceans.
For the 1960–2000 period, sulfur emissions from oil and coal combustion
generated atmospheric sulfates, which reflected sunlight and suppressed
global warming.
Sulfates are scrubbed from the atmosphere by rain every year. Sulfur
emissions in the past decade have mostly been stopped, and the rate of
global warming has increased.
Only 60% of the CO2 generated from combustion of oil, gas, coal, and
cement production has been accumulating in the atmosphere. The rest is
absorbed in ocean surface waters.
The ocean surface water is becoming more acidic and hotter. Both factors
reduce the solubility of CO2 in water.
As the land becomes warmer, ice and snow melt in Greenland and the
Antarctic. The Earth becomes less reflective to sunlight.
As the Earth becomes warmer, methane emissions from frozen tundra,
peat bogs, and offshore hydrate deposits increase. Methane per mole is
23 times more powerful a greenhouse gas than CO2.
xiv
•
•
•
•
INTRODUCTION—A HISTORY OF POSITIVE FEEDBACK LOOPS
In the next few decades the ocean surface waters will become an emitter
rather than an absorber of CO2 because of warming and increased
acidity.
Accumulating CO2, has in the absence of increased sulfate concentration
in the atmosphere, accelerated global warming.
Accelerating global warming will reduce the absorption capacity of the
ocean surface waters for CO2 and increase methane emissions.
Warmer global temperature will increase humidity. Water is a bigger
greenhouse gas than either CO2 or methane. The humidity effect will build
upon itself.1
Liz, that’s a real positive feedback loop. But I don’t think Jake will get very
far in finding a new girlfriend with this grim tale of global warming. Especially
if Jake tells Linda the end of the story.
Eventually the small percentage of ocean surface waters that have warmed
and become acidic will mix with deeper, cooler, neutral pH layers of the ocean,
which contain the vast bulk of the planet’s water. This will stop the positive
feedback loop and global warming. So my story does have a happy ending—if
Linda and Jake can just wait a few thousand years.
REFERENCE
1 Desonie, Dana, “Climate—Our Fragile Planet,” Chelsea House Publishers, 2006.
1
Learning from
Experience
An old Jewish philosopher once said, “Ask me any question, and if I know the
answer, I will answer it. And, if I don’t know the answer, I’ll answer it anyway.”
Me too. I think I know the answer to all control questions. The only problem
is, a lot of my answers are wrong,
I’ve learned to differentiate between wrong and right answers by trial and
error. If the panel board operator persistently prefers to run a new control
loop I’ve designed in manual, if he switches out of auto whenever the flow
becomes erratic, then I’ve designed a control strategy that’s wrong. So, that’s
how I’ve learned to discriminate between a control loop that works and a
control strategy best forgotten.
Here’s something else I’ve learned. Direct from Dr. Shinsky, the world’s
expert on process control:
•
•
“Lieberman, if it won’t work in manual, it won’t work in auto.”
“Most control problems are really process problems.”
I’ve no formal training in process control and instrumentation. All I know
is what Dr. Shinsky told me. And 44 years of experience in process plants has
taught me that’s all I need to know.
Troubleshooting Process Plant Control, by Norman P. Lieberman
Copyright © 2009 John Wiley & Sons, Inc.
1
2
LEARNING FROM EXPERIENCE
LEARNING FROM PLANT OPERATORS
My first assignment as a Process Engineer was on No. 12 Pipe Still in Whiting,
Indiana. This was a crude distillation unit. My objective was to maximize production of gas oil, as shown in Figure 1-1. The gas oil had a product spec of
not more than 500 ppm asphaltines. The lab required half a day to report
sample results. However, every hour or two the outside operator brought in a
bottle of gas oil for the panel board operator. The panel operator would adjust
the wash oil flow, based on the color of the gas oil.
While plant supervision monitored the lab asphaltine sample results, plant
operators ignored this analysis. They adjusted the wash oil rate to obtain a
clean-looking product. The operators consistently produced a gas oil product
with 50–200 ppm asphaltines. They were using too much wash oil. And the
more wash oil used, the lower the gas oil production.
I mixed a few drops of crude tower bottoms in the gas oil to obtain a bottle
of 500 ppm asphaltine material. I then instructed the panel board operators as
follows:
•
•
•
If the sample from the field is darker than my standard bottle, increase
the wash oil valve position by 5%.
If the sample of gas oil from the field is lighter than my standard, decrease
the wash oil valve position by 3%.
Repeat the above every 30 minutes.
The color of gas oil from a crude distillation unit correlates nicely with
asphaltine content. The gas oil, when free of entrained asphaltines, is a pale
yellow. So it seems that my procedure should have worked. But it didn’t. The
operators persisted in drawing the sample every one to two hours.
Figure 1-1 Adjusting wash oil based on gas oil color
LEARNING FROM FIELD OBSERVATIONS
3
So, I purchased an online colorimeter. The online colorimeter checked
whether the gas oil color was above or below my set point. With an interval
of 10 minutes it would move the wash oil valve position by 1%. This never
achieved the desired color, but the gas oil product was mixed in a tank. The
main result was that gas oil production was maximized consistent with the
500 ppm asphaltine specification.
One might say that all I did was automate what the operators were already
doing manually, that all I accomplished was marginally improving an existing
control strategy by automating the strategy. But in 1965 I was very proud of
my accomplishments. I had proved, as Dr. Shinsky said, “If it does work on
manual, we can automate it.”
LEARNING FROM FIELD OBSERVATIONS
Forty years ago I redesigned the polypropylene plant in El Dorado, Arkansas.
I had never paid much attention to control valves. I had never really observed
how they operate. But I had my opportunity to do so when the polypropylene
plant was restarted.
The problem was that the purchased propylene feed valve was too large for
normal service. I had designed this flow for a maximum of 1600 BSD, but the
current flow was only 100 BSD. Control valve response is quite nonlinear.
Nonlinear means that if the valve is open by 5%, you might get 20% of the
flow. If you open the valve from 80% to 100%, the flow goes up by an additional 2%. Nonlinear response also means that you cannot precisely control a
flow if the valve is mostly closed. With the flow only 20% of the design flow,
the purchased propylene feed was erratic. This resulted in erratic reactor temperature and erratic viscosity of the polypropylene product.
The plant start-up had proceeded slowly. It was past midnight. The evening
was hot, humid, and very dark. I went out to look at the propylene feed control
valves. Most of the flow was coming from the refinery’s own propylene supply.
This valve was half open. But the purchased propylene feed valve was barely
open. The valve position indicator, as best I could see with my flashlight, was
bumping up and down against the “C” (closed) on the valve stem indicator.
The purchased propylene charge pump had a spillback line, as shown in
Figure 1-2. I opened the spillback valve. The pump discharge pressure dropped,
and the propylene feed valve opened to 30%. The control valve was now
operating in its linear range.
Now, when I design a control valve to handle a large reduction in flow, I
include an automated spillback valve from pump discharge to suction. The
spillback controls the pump discharge pressure to keep the FRC valve between
20% and 80% open. Whenever I sketch this control loop I recall that dark
night in El Dorado. I also recall the value of learning even the most basic
control principles by personal field observations.
4
LEARNING FROM EXPERIENCE
Figure 1-2
Opening spillback to keep FRC valve in it’s linear operating range
LEARNING FROM MISTAKES
Adolf Hitler did not always learn from his mistakes. For example, he once
ordered a submarine to attack the Esso Lago Refinery in Aruba. The sub surfaced in the island’s harbor and fired at the refinery. But the crew neglected
to remove the sea cap on the gun’s muzzle. The gun exploded and killed the
crew.
I too had my problems in this refinery. The refinery flare was often very
large and always erratic. The gas being burned in the flare was plant fuel. The
plant fuel was primarily cracked gas from the delayed coker, supplemented
(as shown in Fig. 1-3) by vaporized LPG. So much fuel gas was lost by flaring
that 90% of the Aruba’s LPG production had to be diverted to fuel, via the
propane vaporizer.
I analyzed the problem based on the dynamics of the system. I modeled the
refinery’s fuel consumption vs. cracked gas production as a function of time.
The key problem, based on my computer system dynamic analysis, was the
cyclic production of cracked gas from the delayed coker complex. My report
to Mr. English, the General Director of the Aruba Refinery, concluded:
1. The LPG vaporizer was responding too slowly to changes in cracked gas
production from the delayed coker.
2. The natural log of the system time constants of the coker and vaporizer
were out of synchronization.
3. A feed-forward, advanced computer control based on real-time dynamics would have to be developed to bring the coker vaporizer systems into
dynamic real-time equilibrium.
4. A team of outside consultants, experts in this technology, should be contracted to provide this computer technology.
Six months passed. The complex, feed-forward computer system was integrated into the LPG makeup and flaring controls shown in Figure 1-3. Adolf
LEARNING FROM MISTAKES
5
Figure 1-3 Unintentional flaring caused by malfunction of LPG makeup control valve is an
example of split-range pressure control
Hitler would have been more sympathetic than Mr. English. The refinery’s
flaring continued just as before. Now what?
Distressed, discouraged, and dismayed, I went out to look at the vaporizer.
I looked at the vaporizer for many hours. After a while I noticed that the fuel
gas system pressure was dropping. This happened every three hours and was
caused by the cyclic operation of the delayed coker. This was normal.
The falling fuel gas pressure caused the instrument air signal to the LPG
makeup valve to increase. This was an “Air-to-Open” valve (see Chapter 11),
and more air pressure was needed to open the propane flow control valve. This
was normal.
BUT, the valve position itself did not move. The valve was stuck in a closed
position. This was not normal.
You will understand that the operator in the control room was seeing the
LPG propane makeup valve opening as the fuel gas pressure dropped. But
the panel board operator was not really seeing the valve position; he was only
seeing the instrument air signal to the valve.
Suddenly, the valve jerked open. The propane whistled through the valve.
The local level indication in the vaporizer surged up, as did the fuel gas pressure. The flare valve opened to relieve the excess plant fuel gas pressure and
remained open until the vaporizer liquid level sank back down, which took
well over an hour. This all reminded me of the sticky side door to my garage
in New Orleans.
I sprayed the control valve stem with WD-40, stroked the valve up and
down with air pressure a dozen times, and cleaned the stem until it glistened.
The next time the delayed coker cycled, the flow of LPG slowly increased to
catch the falling fuel gas pressure, but without overshooting the pressure set
point and initiating flaring.
6
LEARNING FROM EXPERIENCE
My mistake had been that I had assumed that the field instrumentation and
control valves were working properly. I did not take into account the probability of a control valve malfunction. But at least I had learned from my mistake,
which is more than you could say for Adolf Hitler.
LEARNING FROM THEORY
Northwestern University has an excellent postgraduate chemical engineering
program. I know this because I was ejected from their faculty. I had been hired
to present a course to their graduate engineers majoring in process control
My lecture began:
“Ladies and gentlemen, the thing you need to know about control theory is that
if you try to get some place too fast, it’s hard to stop. Let’s look at Figure 1-4. In
particular, let’s talk about tuning the reflux drum level control valve.
Do I want to keep the level in the drum close to 50%, or doesn’t it matter? As
long as the level doesn’t get high enough to entrain light naphtha into fuel gas,
that’s okay. What is not okay is to have an erratic flow feeding the light naphtha
debutanizer tower.
On the other hand, if the overhead product was flowing into a large feed surge
drum, than precise level control of the reflux drum is acceptable.
In order for the instrument technician to tune the level control valve, you have
to show him what you want. To do this, put the level valve on manual. Next,
manipulate the light naphtha flow to permit the level swings in the reflux drum
you are willing to tolerate. But you will find that there is a problem. If you try
to get back to the 50% level set point quickly you will badly overshoot your level
target.
Figure 1-4
Tuning a level control valve depends on what is downstream
LEARNING FROM RELATIONSHIPS
7
If you return slowly to the set point, it’s easy to reestablish the 50% level target.
However, the level will be off the target for a long time.
In conclusion, ladies and gentlemen, tuning a control loop is a compromise
between the speed at which we wish to return to the set point and our tolerance
to overshooting the target. To establish the correct tuning criteria, the control
loop is best run on manual for a few hours by the Process Control Engineer.
Thank you. Class adjourned for today.”
My students unfortunately adjourned to Dean Gold’s office. Dean Gold
lectured me about the student’s complaints.
“Mr. Lieberman, did you think you were teaching a junior high school science
class or a postgraduate course in process control?”
And I said, “Oh! Is there a difference?”
So that’s how I came to be ejected from the faculty of Northwestern University after my first day of teaching.
LEARNING FROM RELATIONSHIPS
My ex-girlfriend used to tell me, “Norm, the reason we get along so well is
that I give you a lot of positive feedback.” From this I developed the impression that positive feedback is good. Which is true in a relationship with your
girlfriend. But when involved in a relationship with a control loop, we want
negative feedback. Control logic fails when in the positive feedback mode of
control. For example:
•
•
Distillation—As process engineers and operators we have the expectation
that reflux improves fractionation, which is true, up to a point. That point
where more reflux hurts fractionation instead of helps is called the “incipient flood point.” Beyond this point, the distillation tower is operating in
a positive feedback mode of process control. That means that tray flooding
reduces tray fractionation efficiency. More reflux simply makes the flooding worse.
Fired Heaters—Increasing furnace fuel should increase the heater outlet
temperature. But if the heat release is limited by combustion air, then
increasing the fuel gas will reduce the heater outlet temperature. But as
the heater outlet temperature drops, the automatic control calls for more
fuel gas, which does not burn. As the heater outlet temperature continues
to fall, because combustion is limited by air, the outlet temperature drops
further. The heater automatic temperature control loop is now in the
positive feedback mode of control. As long as this control loop is on auto,
the problem will feed upon itself.
8
LEARNING FROM EXPERIENCE
Figure 1-5 Too much steam flow causes a loss in vacuum
•
Vacuum Ejector—Some refineries control vacuum tower pressure by controlling the motive steam flow to the steam ejector. As the steam pressure
and flow to the ejector increases, the ejector pulls a better vacuum, as
shown in Figure 1-5, but as the steam flow increases, so does that load on
the downstream condenser. As the condenser becomes overloaded, the
ejector discharge pressure rises. At some point the increased discharge
pressure adversely affects the ejector’s suction pressure. A further increase
in motive steam will make the vacuum worse, instead of better. As the
vacuum gets worse, the control loop calls for more steam. Having now
entered the positive feedback mode of control, the problem feeds upon
itself.
Many control loops are subject to slipping into a positive feedback loop.
The only way out of this trap is to switch the controls to manual and slowly
climb back out of the trap. Once you guess (but there is no way to know for
sure) that you are in the safe, negative feedback mode of control, you can then
safely switch back to automatic control.
2
Process Control
Parameter Measurement
I mentioned in Chapter 1 that I was ejected from the faculty of Northwestern
University after teaching a single class. This was not the end of my academic
career. I was also an instructor at Louisiana State University. Dr. Dillard
Smythe had hired me on a trial basis to conduct a process control course for
undergraduate chemical engineers. My course was excellent, but judge for
yourself.
“Ladies and gentlemen. Welcome to Process Control 101. The course is
divided into two segments:
•
•
Segment One—Measuring Process Control Parameters
Segment Two—Designing Control Loops for Process Parameters
We must measure the parameter before we can control the parameter.
That’s why we will study measurement first.
The Nazi army was able to initially defeat the allied armies in World War
II because of the superior use of tanks. It wasn’t that the German tanks were
better than the Allied tanks. It was that the Germans had excellent FM radios
in their tanks. The data supplied from forward units enabled senior commanders to coordinate the Panzer attack. That is, the limiting factor for any control
strategy is the quality of the data. Garbage in; garbage out.
I plan to discuss measurement techniques and problems for the following
process parameters:
Troubleshooting Process Plant Control, by Norman P. Lieberman
Copyright © 2009 John Wiley & Sons, Inc.
9
10
PROCESS CONTROL PARAMETER MEASUREMENT
•
•
•
•
•
Liquid levels
Temperature
Pressure
Differential pressure
Flow
My experience is limited to continuous processes, but excludes solids and
high-viscosity fluids. So let’s limit our study accordingly. My experience in the
petrochemical and refining industry has taught me that most control problems
are a consequence of improper parameter measurement, most especially
levels.
HOW ARE LIQUID LEVELS MEASURED?
Most liquid level measurement is made by a level-trol. The level-trol is served
by two pressure transducers. A pressure transducer is a mechanical device that
converts a pressure in an electronic signal. Car engines have a transducer to
measure the engine oil pressure.
Figure 2-1 shows the arrangement of the pressure transducers, one at the
top and one at the bottom of the level-trol. The level-trol is a pipe a few feet
long. The difference in the electrical output between the dual pressure transducers is proportional to the difference in pressure between the top and
bottom of the level-trol. This delta P is caused by the head of liquid in the
level-trol. The electrical output generated by this pressure difference is called
Figure 2-1
Measuring levels by sensing liquid head pressure