1
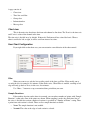
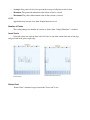
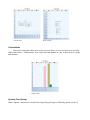
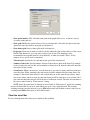
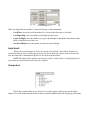
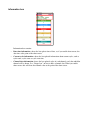
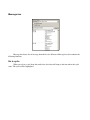
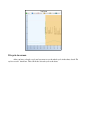
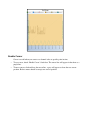
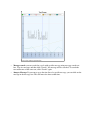
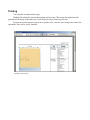
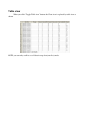
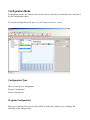
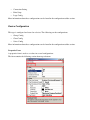
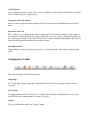
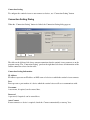
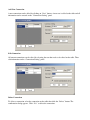
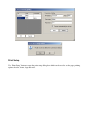
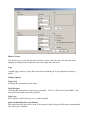
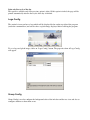
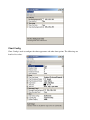
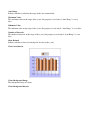
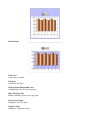
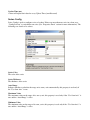
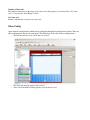
6HQWLQHO9LHZHUYHUVLRQ
8VHU0DQXDO
'DWH0DUFK
'RFXPHQWY
7DEOHRI&RQWHQWV
Overview ................................................................................................................................................... 1
Hardware/Software Requirements ............................................................................................................ 1
Installing Sentinel Viewer ......................................................................................................................... 2
User Interface Overview ........................................................................................................................... 3
Tool bar ..................................................................................................................................................... 4
New tab ................................................................................................................................................ 4
Open file ............................................................................................................................................... 4
Open Folder .......................................................................................................................................... 4
Print ...................................................................................................................................................... 4
Toggle table view ................................................................................................................................. 4
Connect to/Disconnect from a device. .................................................................................................. 4
Login to a Device ................................................................................................................................. 5
Menu bar ................................................................................................................................................... 7
Chart Page ................................................................................................................................................. 8
Chart view............................................................................................................................................. 8
User Chart Configuration ................................................................................................................. 9
Filter ............................................................................................................................................ 9
Sample Functions ........................................................................................................................ 9
Number of Points ........................................................................................................................ 9
Invert X-axis................................................................................................................................ 9
Rotate Chart .............................................................................................................................. 10
Column Mode............................................................................................................................ 10
Options (Chart Setup) ............................................................................................................... 11
Time line scroll bar ............................................................................................................................. 12
Auto Scroll ..................................................................................................................................... 12
Groups box ......................................................................................................................................... 12
Information box .................................................................................................................................. 13
Message box ....................................................................................................................................... 14
Go to cycle ..................................................................................................................................... 14
Fit cycle to screen .......................................................................................................................... 15
Enable Cursor................................................................................................................................. 15
Printing .................................................................................................................................................... 17
Table view ............................................................................................................................................... 18
Configuration Mode ................................................................................................................................ 19
Configuration Type............................................................................................................................. 19
Program Configuration ....................................................................................................................... 19
Device Configuration ......................................................................................................................... 20
Configuration Toolbar ........................................................................................................................ 21
Connection Setting Dialog ............................................................................................................. 22
Print Setup...................................................................................................................................... 24
Logo Config ................................................................................................................................... 26
Group Config ................................................................................................................................. 26
Chart Config................................................................................................................................... 27
Series Config .................................................................................................................................. 30
Other Config .................................................................................................................................. 31
2YHUYLHZ
Sentinel Viewer is the client-side application for monitor data from IMS system. Sentinel Viewer
provides you with ability to view series of data from device as chart, ability to search for specific cycle
and event and many more.
+DUGZDUH6RIWZDUH5HTXLUHPHQWV
•
Memory: Minimum: 256 MB, recommended: 1 GB or above
•
CPU: recommended: 1.8 GHz
•
Microsoft Windows XP service pack 2
•
Microsoft .Net runtime framework 2.0 or above
,QVWDOOLQJ6HQWLQHO9LHZHU
To install Sentinel Viewer on your machine, proceed as follows.
1. Double click setup.exe file
2. Click “Next”
3. Select where to install Sentinel Viewer or accept the default and click “Next”
4. Click Next to start the installation process.
5. Wait for the installation to complete.
6. The installation of Sentinel Viewer is now completed. Click “ Close” to finish the installation.
8VHU,QWHUIDFH2YHUYLHZ
The Sentinel viewer user interface consists of a:
•
Tool bar
•
Menu bar
•
Page
7RROEDU
The tool bar is used to open the data files and for connecting to a device.
From left to right, tool bar contains the following action.
1HZWDE
Click new tab button to open a new view tab. A new tab is useful when you want to connect to
more than one device since each view tab can only display a single connection.
2SHQILOH
To open snapshot of data file collected previously, use “ Open file” button.
2SHQ)ROGHU
This action is used to open a folder that contains group of data files from the same device. The
data of the same group will be merged in to one chart.
3ULQW
Use “ Print” function to print the current active view tab. See Printing topic for more information.
7RJJOHWDEOHYLHZ
Normally the data is display as a chart. However, it is possible to display data in a table using
“ Toggle table view” button.
&XUUHQWOLPLWDWLRQ
It is not possible to scroll and view the tabular data when connecting to a live device or to print a table
view.
&RQQHFW'LVFRQQHFWWRDGHYLFH
To connect to a live device, to get live stream of data, use “ Connect to Device” button.
First, enter the device's address (IP address or machine name) in to the address box.
Then click “ Connect to device” button.
A Login dialog will appear. Enter user name and password and click “ Ok” to connect to the device.
When “ Connect to device” button is clicked, there is not any tab or the current active tab is a
snapshot data tab, a new tab will be automatically opened.
If the current active tab is a live view, this same button can be used to disconnect from the
connected device of the current active tab. Therefore, if you only have one tab that is already in live
mode (connecting to a device) you have to click “ New tab” button to open new tab before you can
connect to a new device from that newly opened tab.
&XUUHQWOLPLWDWLRQ
Do not try connecting to the same IP address while you are already connected to it.
/RJLQWRD'HYLFH
To connect to a device for configure parameters and behaviors of the device, use “ Login to a
Device” button.
First, enter the device's address (IP address or machine name) in the address box.
Then click “ Login” button.
A Login dialog box appears. Enter user name and password and click “ Ok” to login to the device.
The Configuration view appears (see the Configuration section for more information).
0HQXEDU
The menu bar allow user to do following action:
•
•
•
•
•
2SHQ)ROGHU
2SHQ)LOH
2SHQ1HZ7DE
3ULQW
([LWWKHDSSOLFDWLRQ
See Tool bar section for description on each actions.
&KDUW3DJH
Each page represents one connection to a device/file.
A page consists of:
•
Chart view
•
Time line scroll bar
•
Groups box
•
Information box
•
Message box
&KDUWYLHZ
This is the main view that shows the from each channel as line chart. The X-axis is the time axis
and Y-axis is value of the channel at the time.
The time axis is divided in to, by default, 10 intervals. Each interval has a time label on it. When a
chart is scrolled to left, or right, it will be scroll one interval at a time.
8VHU&KDUW&RQILJXUDWLRQ
If you right click on the chart area, you can customize some behavior of the chart control.
)LOWHU
When you want to see only the last specific period of the data, use Filter. Filter enable you to
see only the last, for example, five minutes of the whole series. When Filter is enabled, scrolling to left
edge will only go back as far as, in this case, five minutes.
Use “ More...” button to set up a customized time period that you want.
6DPSOH)XQFWLRQV
If the number of points on the chart is too much, you can reduce number of points with “ Sample
Function” so that only some of the points are shown. When sampling is made, the whole time line of
the series is divided into sections, number of sections is specified by “ Number of Points” setting. Then
a point from each section is elected. There are five sample functions available:
•
•
1RQH The sample function is not enabled.
1RUPDO The value at the edge of each section is selected.
$YHUDJH New point is derived to represent the average of all point in each section.
•
0LQLPXP The point with minimum value in that section is selected.
•
0D[LPXP The point with maximum value in that section is selected.
•
NOTE:
Application may become slow when Sample function is used.
1XPEHURI3RLQWV
This setting changes the number of sections to divide when “ Sample Functions” is enabled.
,QYHUW;D[LV
Select this when you want the time scale in X-axis to start from current date time at left edge
and goes back in the past to right edge.
1RUPDO&KDUW
&KDUWZLWK;D[LVLQYHUWHG
5RWDWH&KDUW
“ Rotate Chart” command swaps between the X-axis and Y-axis.
1RUPDO&KDUW
5RWDWHG&KDUW
&ROXPQ0RGH
Instead of viewing the whole series of data you may choose to view just the data at a specific
single point of time. “ Column mode” show value from each channel as a bar, it shows data at a single
time instance.
&ROXPQ0RGH
2SWLRQV&KDUW6HWXS
When “ Options” command is selected Chart setup dialog will appear. Following options can be set.
•
•
•
•
•
•
•
6KRZSRLQWPDUNHU This will mark each point in the graph with a cross, so that it is easy to
see where each point lies.
6KRZJULG Enable this option to draw a line at each time and value label. In other words, this
option will cause the chart to draw grid at each interval.
6KRZPLQRUJULG draw a minor grid inside each interval.
)LW6FUHHQ Zoom out as much as needed to fit the whole time line of chart data in to the screen.
NOTE: This function is very slow once you have lots of data. This function is only
recommended on snapshot (non-live) data from file, or when you enable “ Filter” of five
minutes or less on live device connection.
7LPHLQWHUYDO Specify the size and unit of time period for each interval.
1XPEHURILQWHUYDOVSpecify number of interval above that is show in the chart. For example,
if you set interval to one second, and set number of intervals to 10, then the chart will show the
time period of ten seconds.
=RRPIDFWRU When your mouse is over the chart area, you can use mouse wheel to zoom in or
out in the chart. When zooming in the time interval will be subtracted by this zoom factor. For
example, if the current time interval is ten seconds and you set the zoom factor to three, when
you use the mouse wheel to zoom in, your time interval will be reduced to seven seconds. Or if
you zoom out then time interval will be increased to thirteen seconds. The unit of zoom factor is
the same as unit of time in “ Time interval” setting.
NOTE: Since the zoom factor is affected by unit of time in “ Time interval” option, the zooming
may not be noticeable if you try to zoom when you are at a very small time unit. For example,
zooming in when your time interval is set to 3000 milliseconds will be hard to notice since you are
zooming from 3000 milliseconds to 2999 milliseconds.
7LPHOLQHVFUROOEDU
To move through time in the chart, move marker in this scrollbar.
When you right-click on scroll bar, a menu will pop up to show commands:
•
•
•
•
6FUROO+HUH move the scroll bar marker to see chart at that date time of scroll bar.
/HIW5LJKW(GJH move the marker to left/right most date time.
3DJH/HIW5LJKW move the marker one page to the left/right so that the the current time in the
chart is completely out of the view.
6FUROO/HIW5LJKW move the marker one interval to the left/right.
$XWR6FUROO
When you are connecting to a device (live mode) you can click “ Auto Scroll” button to set
scroll bar marker to always on the right most edge. In auto scroll mode, when a device has more live
data, the chart will be automatically updated to see the most updated data.
NOTE: The chart will be updated one interval at a time, so if the chart is viewing big interval,
you will have to wait before the next interval is updated.
*URXSVER[
The Groups window shows a tree-styled view of all the groups on this page and all of their
channels. You can uncheck the check box to hide a particular channel data from displaying in the chart.
,QIRUPDWLRQER[
Information box contains:
•
•
•
'DWHWLPHLQIRUPDWLRQ shows the last update time of data, or, if you enable chart cursor, the
date time at the point of the chart cursor.
&XUUHQWF\FOHLQIRUPDWLRQ shows the last updated information about current cycle, such as
cycle name, cycle status as cycle start time.
&KDQQHOGDWDLQIRUPDWLRQ shows the last updated value of each channels, only the unhidden
channel will be shown. See “ Groups box” on how to hide a channel data. When you enable
chart cursor, this will show the channel value at the point of the chart cursor.
0HVVDJHER[
Message box shows list of message from the device. Moreover Message box also contains the
following function.
*RWRF\FOH
When you select a cycle from the combo box, the chart will jump to the time where the cycle
starts. The cycle will be highlighted.
)LWF\FOHWRVFUHHQ
After you have selected a cycle and you want to see the whole cycle in the chart, check “ Fit
cycle to screen” check box. This will fit the selected cycle to the chart.
(QDEOH&XUVRU
Cursor is useful when you want to see channel value at specific point in time.
•
To use cursor, check “ Enable Cursor” check box. The cursor line will appear in the chart as a
purple line.
•
To move cursor, click and drag the cursor line, a gray will appear to show the new cursor
position. Release mouse button to accept new cursor position.
&XUVRUOLQHDQGQHZSRVLWLRQOLQH
•
•
0HVVDJHVHDUFK you can search for a cycle with specific message using message search text
box. Type in a message and then click “ Search” , the message will be searched. To search the
next occurrence of the same text, click “ Search” again.
-XPSWR0HVVDJH If you want to go to the time line of a specific message, you can click on the
message in the message box. This will move the chart to that time.
3ULQWLQJ
You can print out chart and messages.
Printing will reflects the current chart portion and messages. This means the application will
print the current image of the chart you see and all the messages in message list box.
If you want to print only messages from a specific cycle, select the cycle using cycle combo box
and enable “ Fit cycle to screen” function.
([DPSOHRISULQWGLDORJ
7DEOHYLHZ
shown.
When you click “ Toggle Table view” button, the Chart view is replaced by table view as
NOTE: you can only scroll to see old data in snap shot (non-live) mode.
&RQILJXUDWLRQ0RGH
In configuration mode, the sentinel viewer has the same user interface as in normal mode except that it
has the configuration toolbar.
To enter the configuration mode, please see the “ Login to a Device” section.
&RQILJXUDWLRQ7\SH
There are two types of configuration:
Program Configuration
Device Configuration
3URJUDP&RQILJXUDWLRQ
This type is configured and stored on the local PC on which the sentinel viewer is running. The
following are the configurations:
•
Connection Setting
•
Print Setup
•
Logo Config
More information about these configurations can be found in the configuration toolbar section.
'HYLFH&RQILJXUDWLRQ
This type is configured and stored on a device. The following are the configurations:
•
Group Config
•
Chart Config
•
Series Config
More information about these configurations can be found in the configuration toolbar section.
3URSHUWLHV)RUP
A properties form is used to set values in several configurations.
The form contains the following section from top to bottom:
&RQILJ6HOHFWRU
Some configurations have several value sets to be configured, such as Series Config. Each set of values
can be selected from the Config Selector.
3URSHUWLHV*ULG9LHZ2SWLRQ
The set of values displayed on the properties grid view can be viewed in alphabetical or categorized
order.
3URSHUWLHV*ULG9LHZ
This is where a set of configurations values is displayed. The left column contains the value names to
be configured. Values can be set in the right column. The way to set a value is different depending on
the value type for example, if the value is of type Color, when clicking the right column a pop up color
dialog box will appear from which a color can be selected.
'HVFULSWLRQ3DQHO
When clicking a value on the properties grid view, a description of the value will be displayed in the
panel.
&RQILJXUDWLRQ7RROEDU
The tool bar contains the following functions.
6HWXS3DJH
Use “ Setup Page” button to open the Configuration View. If the view is already opened, it will be
activated.
6DYH&RQILJ
All configurations can be saved using “ Save Config” button. Program configurations are stored on a
local PC and device configurations are stored on a device.
/RJRXW
To exit a configuration mode, use “ Logout” button.
&RQQHFWLRQ6HWWLQJ
To configure the sentinel viewer to auto-connect to devices, use “ Connection Setting” button.
&RQQHFWLRQ6HWWLQJ'LDORJ
When the “ Connection Setting” button is clicked, the Connection Setting dialog appears.
The table on the left hand side shows current connections that the sentinel viewer connects to on the
program startup. The “ Connection Setting” panel on the right hand side shows all information of the
current connection selected on the table.
&RQQHFWLRQ6HWWLQJ,QIRUPDWLRQ
,3$GGUHVV
IP Address represents an IP address or DNS name of a device to which the sentinel viewer connects.
3RUW
Port represents a port number of a device which the sentinel viewer will use to communicate with.
8VHUQDPH
A user name, if required, can be entered here.
3DVVZRUG
A password, if required, can be entered here.
$XWR&RQQHFW
If auto-connect to a device is required, check the “ Connect automatically at start up” box.
$GG1HZ&RQQHFWLRQ
A new connection can be added by clicking on “ New” button. A new row is added to the table and all
information can be entered on the “ Connection Setting” panel.
(GLW&RQQHFWLRQ
All current connections can be edited by selecting the row that needs to be edited on the table. Then
edit information on the “ Connection Setting” panel.
'HOHWH&RQQHFWLRQ
To delete a connection select the connection on the table then click the “ Delete” button. The
confirmation dialog appears. Click “ Yes” to delete the connection.
3ULQW6HWXS
Use “ Print Setup” button to open the print setup dialog box which can be used to set the page printing
options: header, footer, logo and misc.
+HDGHU)RRWHU
Use the text areas to add, edit and delete a header or footer. The font style, size and color can be
changed by clicking on the drop down boxes to the right of the text areas.
/RJR
A printing page can have a logo. This can be done by clicking on “ Logo” button and selecting a
picture.
3ULQWLQJ2SWLRQV
3ULQW&KDUW
Checking this option prints out the chart.
3ULQW0HVVDJHV
Checking this option prints out all messages normally . If it is in “ Fit Cycle to Screen Mode” , only
messages in the current cycle will be printed.
3ULQW/RJR
If this option is ticked and a logo is set, it will be printed.
3ULQWDXWRPDWLFDOO\DIWHUF\FOHILQLVKHG
This option has effect only in live mode. If this option is ticked, the page will be printed automatically
after each cycle is finished.
3ULQWRQO\ILUVWF\FOHRIWKHGD\
This option is available only if the previous option is ticked. If this option is ticked, the page will be
printed automatically after the first cycle of the day is finished.
/RJR&RQILJ
The sentinel viewer can have a logo which will be displayed below on the top right of the program
(under the command box) and can also have a splash image displayed before entering the program.
To set a logo and splash image, clicks on “ Logo Config” button. The properties form of Logo Config
will appear.
*URXS&RQILJ
Group Config is used to configure the background color of the info box and the tree view and also to
configure whether to show them or not.
&KDUW&RQILJ
Chart Config is used to configure the chart appearance and other chart options. The followings are
details of its values:
$XWR5DQJH
Indicates whether to calculate the range on the axis automatically.
0D[LPXP9DOXH
The maximum value on the range of the y-axis, this property is used only if “ Auto Range” is set to
false.
0LQLPXP9DOXH
The minimum value on the range of the y-axis, this property is used only if “ Auto Range” is set to false
1XPEHURI,QWHUYDOV
The number of intervals on the range of the y-axis, this property is used only if “ Auto Range” is set to
false
6KRZ'HFLPDO
Indicates whether to show a decimal point of value on the y-axis.
&KDUW$UHD,QWHULRU
&KDUW%DFNJURXQG,PDJH
The background image of a chart
&KDUW%DFNJURXQG,QWHULRU
&KDUW,QWHULRU
7LWOH&RORU
A title color of a chart
7LWOH)RQW
A title font of a chart
0HVVDJH3DQHO%DFNJURXQG&RORU
A background color of a message panel
6KRZ0HVVDJH3DQHO
Indicates whether to show a message panel
&KDUW6HULHV&RQILJ
Configures series of a chart
/HJHQG&RQILJ
Configures a legend of a chart
8SGDWH7LPHPV
A chart will update their data for every Update Time (in millisecond)
6HULHV&RQILJ
Series Config is used to configure series of a chart. If there are more than one series in a chart, uses
“ Config Selector” to switch between series (See “ Properties Form” section for more information). The
followings are details of its values:
6HULHV&RORU
The color of the series
6HULHV7KLFNQHVV
The thickness of the series
$XWR5DQJH
Indicates whether to calculate the range on its own y-axis automatically, this property is used only if
the “ Use Own Axis” is true
0D[LPXP9DOXH
The maximum value on the range of its own y-axis, this property is used only if the “ Use Own Axis” is
true and the “ Auto Range” is false
0LQLPXP9DOXH
The minimum value on the range of its own y-axis, this property is used only if the “ Use Own Axis” is
true and the “ Auto Range” is false
1XPEHURI,QWHUYDOV
The number of intervals on the range of its own y-axis, this property is used only if the “ Use Own
Axis” is true and the “ Auto Range” is false
8VH2ZQ$[LV
Indicates whether this series has its own y-axis
2WKHU&RQILJ
Apart from the configurations which can be configured through the configuration tool bar. There are
other configurations that can be configured. The followings are the list of these configurations:
•
The info box and tree view can be moved, resized.
•
•
The chart and message panel can be resized.
Series can be hidden by ticking out the series in the tree view.