1
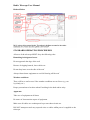
Radio Telescope User Manual
Richard Baker
STANDARD OPERATING PROCEDURES
All users of the telescope MUST obey the following rules:
Remaining in designated areas
Do not approach the edge of the roof
Beware of tripping hazards, loose cables etc.
Do not drop items over the side of the roof
Always fasten down equipment to avoid it blowing off the roof
Weather conditions
There will be no roof access if the weather conditions are too fierce (e.g. too
icy/windy etc.)
Proper precautions to be taken when/if working in the dark and/or rainy.
Apparatus
Take care of equipment at all times
Be aware of electrocution aspect of equipment.
Make sure all cables are weatherproof to prevent short circuits etc.
DO NOT attempt to touch any exposed wires or cables whilst power is supplied to the
telescope.
Follow standard operating procedures when using computers (backrests, breaks etc.)
Follow procedures for lifting heavy equipment
Telescope operating procedures
Park SRT telescope at zenith to ensure minimal surface aspect to wind.
Shut roof doors when not in use.
THERE WILL BE NO ROOF ACCESS WITHOUT SUPERVISION.
G.U.I. OVERVIEW
The SRT Graphical User Interface (G.U.I) is an interactive Java generated window
that allows command and control functions of the telescope, as well as acquisition of
data (see picture above). The G.U.I. consists of:
A. 15 button tool bar
B. Text entry command bar
C. Information side bar
D. Sky map
E. Spectral- line and continuum display
Each of these will be described in turn.
A. THE COMMAND TOOL BAR
The main input device on the SRT G.U.I. is the command tool bar. It consists of 15
buttons arranged horizontally along the top of the screen. Pointing and clicking the
left mouse button on any of these will initiate an automatic sequence (such as cal
(calibrate) or track) or wait on further input from the user (freq, offset). The following
is a list of command functions and their description.
clear
As the label implies, the clear button will clear the control console display of
accumulated spectral- line data, 25-point scan data. This function is useful if the user
is accumulating multiple spectra from different sources or galactic coordinates. The
system will treat new source spectra as additions to the accumulated spectrum.
atten
Enabling the atten (attenuation) button adds or removes a 10dB attenuation to the
receiver with successive left-button mouse clicks. The atten will illuminate red while
the 10dB attenuation is active. The attenuation value can also be read just above the
center of the message board area to the right of the power/temperature information.
stow
Clicking on the Stow button will return the telescope to the "normal" stow position in
the eastern- most, low-elevation position of the main Az/El travel zone. The travel
zone is established by the AZLIMIT and ELLIMIT commands in the srt.cat file.
track
The track button enables the antenna to slew to the selected source from clicking on
the map, selecting from the source list or after typing the source information on the
command entry text box. The track sequence will work automatically when a source
is selected from a command (.cmd) file.
azel
Action on the Azel button allows the user to enter a fixed azimuth/elevation position
in the command entry text box (assuming the entered coordinates are within the Az/El
limits of travel of the SRT, as set in the srt.cat file).
npoint
Initiates a 25-point scan/map of the source selected. The map is 1/2 beamwidth spaced
and when finished displays a false-color, Gaussian plot to the left of the accumulated
spectrum plot. (This plot will clear when the clear button is enabled). The resulting
maximum T(ant) (with associated offset) is displayed under scan results in the
information sidebar. The color plot will NOT refresh if the SRT window is reduced
then refreshed.
bmsw
Initiates a continuous "off/on/off " beamswitched comparison observation of the
selected source at the frequency settings entered with "freq". The off/on/off
measurements are a set and are complimentary, meaning that the two off-source
positions switch sign within each set. The off-source measurements are spaced at +/1 beamwidth in azimuth (offset = +/- beamwidth/cos EL). "BEAMWIDTH" is set in
the srt.cat file. A left mouse click on the bmsw button after the scan has started will
abort the beamswitch operation. Results of the bmsw observation appear in the left
(red) spectral plot window.
freq
Sets the center frequency, number of frequency steps and the step width in MHz.
Clicking on the freq button prompts the user to enter the desired settings in the
command entry window. Example (for the analog receiver): To observe the hydrogen
line at 1420.4 MHz, move the mouse pointer to the freq button. Left click the button
then move the cursor to the lower text input section and enter: 1420.4 25 0.04 (0.04
MHz is the default) Where 1420.4 is the center frequency of an observation that is 25
times 0.04 MHz wide or spanning from 1419.9 to 1420.9 MHz.
offset
Enables the user to enter any az/el offset pair desired. Left click the offset button and
enter the offsets in the command entry box.
drift
A left mouse click on Drift will offset the SRT in Right Ascension and Declination to
allow the selected source to drift through the 7-degree beam of the telescope.
record
Toggles output file recording on and off. Output data files are labeled in the form:
yydddhh.rad Record also allows the user to enter a filename.
rcmdfl
Initiates reading of the default command file (srt.cmd) and begins data recording. The
current line number and text being read is echoed on the message board above the text
entry box. To start automatic recording and reading of a file other than the default
srt.cmd, enter the desired command file name (with the .cmd suffix) in the command
text entry box.
cal
Starts an automatic calibration sequence during which a noise source, located at the
apex of the antenna surface, is enabled for ~1 second. The system then takes a data
sample without the noise source enabled. The resulting system noise temperature is
reported in the information side bar as "Tsys".
Vane
Not applicable to this telescope.
B. MESSAGE BOARD AND TEXT INPUT
The command text- input box and the system message board are located at the bottom
of the SRT control-panel window. Many of the actions initiated by clicking the
command toolbar are implemented by entry of parameter settings in the text box.
Information regarding the correct entry is printed in a message board above the text
entry area when the mouse pointer is moved over the desired command button.
Some of the buttons (source and Rcmdfl) will display more than one set of
instructions if the pointer is moved away then returned to the button area. In the case
of the source button, continuous clicking of the left mouse button will scroll through
the source list on file and each source name will display in the message board.
The message board will also display the current active line command from a
command file and the line number. This text will appear green in the form:
filename.cmd: line nn: text command.
To the right of the message board text area is another space used to echo information
after a text command is entered. Printed in blue, it will repeat the issued command or
advise the user that the issued command is waiting on some other action of the
telescope.
Receiver output and telescope status can be read in two small text boxes just above
the message board and below the map azimuth scale.
In the left box, reading from the left is the current: frequency sweep (set in "freq"),
receiver "counts" (uncorrected power level detected by the receiver), the real-time
system temperature and the attenuation setting.
In the right box the user can reading the current status of the telescope as a whole:
Stowed, slewing, or tracking.
C. INFORMATION SIDEBAR
The information sidebar lists nearly all of the pertinent information the user needs to
monitor real time observing with the telescope. The sidebar displays from top to
bottom:
Antenna Coordinates:
Command (computer command)
Azel (actual position)
Total Offsets (User input, mapping, etc)
Pointing Corrections (degrees)
Axis Corrections (mechanical, user set)
Galactic Coordinates
RA and DEC (Hrs and Deg)
Time:
Universal Time (UT)
Local Sidereal Time (LST)
Source:
Source Name
RA and DEC
Azimuth and Elevation
Center Frequency:
Input Frequency (MHz)
Spacing:
Bin spacing (MHz)
number of bins:
From input (Integer)
tsys:
degrees K
calcons:
trec:
degrees K
Scan Results:
Max K, offset Az/El Widths (Information Sidebar)
VLSR:
Velocity Local Standard of Rest
Vcenter:
Center velocity of the current observation.
Vpeak:
Velocity of peak signal
Fpeak:
Frequency bin of peak signal
D. SKY MAP
The most obvious feature of the SRT control panel window is the sky map. The map
shows full sky coverage in azimuth and elevation with 10-degree tick marks in both
axes. The azimuth axis is labeled every 20 degrees, the elevation every 10 degrees.
The elevation scale is exaggerated 33% from the azimuth scale.
Plotted automatically and labeled are the sources listed in the srt.cat file. Geosynchronous communications satellites in the catalog are indicated by blue dots. The
galactic equator is plotted. The north galactic pole and the 0, 90, 180 and 270 galactic
longitude quadrants are also plotted since they have been placed in the catalog.
The user can move the pointer to any plotted source and click on that source to select
it from the source list. When the source is selected, the source plot, label and the
telescope "crosshairs" will be colored red. Selecting a source in this manner does not
initiate telescope motion to the source however, only an additional action such as
clicking the track button will engage the telescope controls.
While the SRT is slewing, the right side information box below the map will carry the
message Status; slewing. The sky map will show the telescope crosshairs
superimposed on the selected source and illuminated yellow until the SRT arrives at
the source.
The SRT travel limits are also plotted as square boxes on the screen.
The azimuth travel limits are set in the srt.cat file. In the above illustration, the limits
are approximately 91 to 269 degrees. Coverage of the 271 to 89 degrees azimuth is
achieved by moving the elevation axis through the zenith to the desired elevation and
thus a "plus 180? " azimuth position. A total elevation travel of up to 179 degrees is
possible by setting the ELLIMIT command in srt.cat allowing full sky coverage.
Example:
AZLIMIT 91 269
ELLIMIT 0 179
E. SPECTRAL-LINE AND CONTINUUM DISPLAY
The G.U.I. displays the spectral- line plotting area of the SRT control panel. There are
two spectral windows. The area of the SRT control console above the Sky Map is a
continuously running chart recorder showing relative power of the signal received vs.
time. The plot will continually overwrite as it paints from left to right and will reset to
the bottom of the chart when the plot value reaches the 400K vertical scale maximum.
To minimize confusion when the scale resets (400K steps), the plot is color-coded
(note the color-dot icon to the right of the temperature indicator):
Discrete Spectrum
The right side (black) is the plot of each individual spectrum as it finishes the user
input span in MHz (see "freq" in section 1.3.1). The top of the display lists the input
center frequency and the frequency step. The bottom line lists the difference of the
maximum and minimum values measured during the frequency scan. There is also an
arrow indicator showing the direction of increasing frequency.
Accumulated Spectrum
The left side (red) spectral- line plot shows the accumulated spectra since the selected
observation began. Listed at the top of this window is the title av. Spectrum as well as
the total integration time. The bottom script shows the same max-min difference and
increasing frequency direction.
A snapshot of the accumulated spectrum can be seen in a pull-down window by
moving the mouse pointer to the accumulated spectrum window and clicking the left
mouse button. A sample is seen here:
25-Point Map Display
The third window in the plot area (far left square field) is the output display for 25point spectral and continuum maps. When a 25-point scan is complete, a false color
image of the map area will automatically display.
Continuum Display
The left side box reports information showing the number of observation cycles and
the total integration time above the graphical output.
Below the graph, the average temperature, the RMS and vertical scale are reported.
Total-Power Chart Recorder
black 0-400, blue 400-800, green 800-1200, red 1200-1600
Antenna Drive/Motion Status Display
This box, at the upper left of the control console display, shows the station name,
latitude and longitude as read from the srt.cat file. The second line lists the current
antenna drive status, such as, moving, simulate, stopped
SRT OPERATION
The following section is intended to familiarize the reader with the operation of the
SRT. It is intended as a guide and not as a full working technical manual. For more
information on the workings of the SRT, consult the website:
http://web.haystack.mit.edu/SRT/.
Starting the GUI
Log on to the computer as normal
Go to programs/msdos prompt
When you are in the msdos window type cd.. to get to the root directory.
Type cd telescope/srt-java to get to the srt directory
To get to the G.U.I. type java srt 0.
N.B. There are in fact six modes of executable, including java srt 0. these are as
follows:
Run the SRT java srt 0
Simulate SRT java srt 1 1
Simulate Antenna java srt 0 1
Simulate Radio java srt 1
Simulate (speed time x 10) java srt 1 10
Simulate (with 1 hour advance) java srt 1 -1
Using the G.U.I.
Manual operation
For most purposes, it is sufficient to enter commands such as azel, record etc
manually. To do this the SRT software contains a text input sectio n (section 2.B) to
facilitate manual control. Entering commands is simply a case of clicking in the text
box at the bottom of the screen and typing your text. Next click on the appropriate
command button in the command tool bar (section 2.A) and the SRT will execute the
proper command. For full instructions on the uses of the command tool bar see
section 2.
This section will give a brief overview on the basic commands - along with
syntactical instructions ? to familiarize the user with the basics of the SRT software.
Stow
Instructs the SRT to move to its easterly limit whereupon it hits its mechanical limit
switches. This provides the telescope with a point of reference from which to
calculate all further coordinates. Clicking on stow in the command toolbar will cause
the SRT to go to this position.
Track
Clicking on an object in the Sky Map will cause that object to turn red. Clicking on
track instruct the SRT to track that object as long as it is within the software/hardware
limits of the telescope. It is primarily used in conjunction with the record button to
continuously integrate a signal.
Azel
Entering the azimuth value followed by the elevation value will cause the SRT to
move to that position on the Sky Map, provided that the position entered is within the
limits of the telescope. If the command is out of limits it will be indicated in the top
left corner of the screen in red. The syntax for the command is:
[azimuth][space][elevation], e.g.: 180 90
Freq
Typing the frequency command into the text input box sets the center frequency,
number of frequency steps and size of steps at which the SRT will observe. For
example, typing: 1420.4 25 0.04 sets the center frequency to 1420.4 MHz, the number
of steps to 25, and the step spacing to 40 kHz. This observation would have a span of
25 times 40kHz from 1419.9 to 1420.9 MHz, with a center frequency of 1420.4 MHz.
the syntax is: [center frequency] [space][no. of steps] [space] [step size], then click on
freq. if there is no input for step size, the default is 40kHz.
Offset
Typing an azel type command into the text box and clicking on offset will move the
telescope the appropriate offset distance from its previous position. This is useful
when tracking an object and the user wishes to check if the object is centered on the
SRT. The syntax for the command is identical to the azel command, e.g.: 10 10 will
offset the position of the SRT by 10 degrees in azimuth and elevation. The default is
positive so the user must enter a minus sign to offset in the opposite direction.
Record
Starts recording a command file appropriate to the settings immediately previous to its
execution. The recorded file has the extension .rad and is saved in the telescope/srtjava directory. To operate, click on the record button in the command toolbar to start,
and again to stop. This will default the name of the command file to; yydddhh.rad i.e.
year, date and time of recording. To record to a suitable filename, type the filename,
e.g. stellar.rad, in the text box and click on record.
Cal
Initiates the electronic noise calibrator for one second to calibrate the system and
calculate the system temperature. To start, point at a relatively empty (free from
signals) patch of sky and click on the cal button.
Automatic operation
Although manual commands are useful for simple operations of the SRT, it is clear
that this method is too cumbersome for long operations, such as integrating the
galactic plane. The G.U.I. therefore is equipped with a limited command file structure
capable of reading a 'program' written by the user in which embedded commands such
as track, record, etc can be executed automatically. Its also incorporates time
commands such as integrating over a set period or waiting until a set LST to start
operations. This has obvious advantages over manual control, but has distinct
syntactical preferences which this manual will briefly describe.
The repeated functions are initiated by way of a command file, given the extension
.cmd. the file can be given any name, but it is best restricting the name to something
appropriate to the procedure. No full stops should be used in the file name, and try to
stick to ordinary characters. The file can be written in any text editor but remember to
save to file with the extension .cmd. also the file must be saved in the telescope/srtjava directory in order for the software to find it. To initiate a file, enter the filename
in the text box and click on the rcmdfl button in the command toolbar. The filename
must have the extension .cmd in order to be recognized.
The following are a list of commands to familiarize the reader with the general
structure of the command file. All commands have a colon to start followed by a
space, with the exception of the time commands.
Position commands
There are several ways that the SRT can move in position; azel, radec and galactic
coordinates. The appropriate syntax for each is as follows;
:[space][azel][space][azimuth position][space][elevation postion],
e.g. : azel 180 90
:[space][radec][space][ra position hh:mm:ss][space][dec position hh:mm:ss]
e.g. : radec 23:00:00 06:50:00
:[space][galactic][space][galactic coordinate in l][space][galactic coordinate in b]
e.g. : galactic 0 5
Again, all commands must be within the SRT physical/software limits
Time commands
Time commands are used to integrate/wait over a set period of time, or for the SRT to
perform a command at a set time. This can be either LST or UT. The commands for
these are: LST:[time hh:mm:ss], note no space after the colon. This causes the SRT to
wait until a specified time in LST before continuing with the command file, e.g.
LST:06:00:00 [yyyy:ddd:hh:mm:ss], same as above but in UT, e.g.
2002:074:06:00:00 :[time span in seconds], waits for a specified amount of time
before executing the next command in the file, e.g. :60 (wait 1 min).
Miscellaneous commands
Instructions that are used frequently but do not come under the heading of time or
position commands are record, noisecal, and freq. these commands are written as:
: [record][space][filename.rad]. Integrates a source for a set period of time (assuming
the time instruction is the next command) or until the : roff command is given,
e.g.
: record scan1.rad
:60
: roff
Typing : noisecal will initiate the electronic noise calibrator in exactly the same way
as the manual command.
:[space][freq][space][center frequency, MHz][space][number of steps][space] [step
size, MHz].
This is identical to the manual instruction, e.g. : freq 1420.4 51 0.04.
It is also possible to track objects in the command file. Entering the source name after
the colon : [sourcename] will achieve this, e.g. : Sun. Note that this is case sensitive.
Reading data files
As stated above, the data files are recorded to the telescope/srt-java directory. The
format of these files is confusing, especially where many frequency spacings are used.
The format of this data is in the form of columns, which include commands from the
user, frequency information as well as intensity information in tabular form. These
files are readily int erpreted by Microsoft Excel. With carefully manipulation upon
opening the file in Excel, the user can process the raw data, creating graphs and tables
that are more easily understood.
Command file examples
In order to familiarize the user with the syntax of commands, this manual includes
some basic command files:
Measuring antenna beamwidth
: record filename /Start recording, output filename is optional
: azel 180 90 /calibration position
: freq 1415 5 0.0 /scan frequency, 5 bins (samples) , no frequency step
: noisecal /calibration
: Sun /Source command
* Azimuth Scan /Comment
: offset -30 0 /start offset commands for scan -30 to +30 degrees
: offset -29 0
: offset ? 28 0
: offset -27 0
: offset -26 0
: offset -25 0 /through to offset 30 0
* Elevation Scan /Comment
: offset 0 30 /Start elevation scan (if sun El is <60 degrees!)
: offset 0 29
: offset 0 28
: offset 0 27
: offset 0 26
: offset 0 25 /through to 0 -30
: roff /End recording
Galactic rotation curve
LST:18:00:00 / wait until 1800 LST when Galactic center is above telescope limits
: 1420.4 50 / set radiometer center frequency and a number of frequency bins
: azel 180 90 / point south at 45 degrees
: noisecal / calibrate radiometer
: galactic 0 0 / move telescope to Gala ctic center
: record g00.rad / start data file
:600 / take data for 600 seconds. Note no space after colon
: roff / turn off data recording
: galactic 10 0 / move telescope to Galactic longitude of 10 degrees
: record g10.rad
/ repeat
Bibliography
Undergraduate Research Educational Initiative website:
http://web.haystack.mit.edu/urei/tut4.html
Astrophys-Assist Educational Resources website: www.astrophys-assist.com/educate/
sngldish/dish03.htm
Die kosmische A-Klasse - Beobachtung historischer Radioquellen website:
www.klima- luft.de/steinicke/ Artikel/aklasse/aklasse.htm
Kraus, J.D., 1986, Radio Astronomy 2nd Ed., sec 1-13.
APS news online website: www.aps.org/apsnews/ 1198/119807.html
Undergraduate Research Educational Initiative website:
http://web.haystack.mit.edu/urei/tut5.html
Astronomy 123 website: zebu.uoregon.edu/~imamura/123/ lecture-4/lecture-4.html
The Milky Way, a grand design website:
http://blueox.uoregon.edu/~courses/BrauImages/Chap18/FG18_016.jpg
Radio Astronomy and Interference website:
http://www.aoc.nrao.edu/intro/rfi/spillover.html
Radio Astronomy and Interference website:
http://www.aoc.nrao.edu/intro/rfi/goodbad.html
Undergraduate Research Educational Initiative website:
http://web.haystack.mit.edu/urei/tut3.html
Undergraduate Research Educational Initiative website:
http://web.haystack.mit.edu/urei/tut6.html
Schematic designed by Glynn Summers
Montez Jr., Rodolfo. Electronic Noise Calibrator for the Small Radio Telescope,
University of Texas at Austin, Department of Astronomy
Program created by Hugh Lang
SRT website http://web.haystack.mit.edu/SRT/orien.pdf
Schematics designed by Glynn Summers and Luke Woofenden
Burton, W. B. 1985, Astronomy & Astrophysics Supplement Series, 62, 365
Young, J. S.; Scoville, N. On the origin of molecular cloud rings in spiral galaxies CO observations of NGC 7331 and NGC 2841. Astrophysical Journal, Part 2 - Letters
to the Editor, vol. 260, Sept. 15, 1982, p. L41-L44
SRT software website page: http://web.haystack.mit.edu/SRT/SRTManual.pdf