1
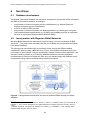
JNCC Report
No. 514
Supplemental Paper
Further development of a spatial framework for mapping ecosystem services
User Manual
Medcalf, K., Small, N., Finch, C., Williams, J., Blair, T.,
Haines-Young, R., Potschin, M. & Parker, J.
March 2014
© JNCC, Peterborough 2014
ISSN 0963 8901
For further information please contact:
Joint Nature Conservation Committee
Monkstone House
City Road
Peterborough PE1 1JY
http://jncc.defra.gov.uk
This report should be cited as:
Medcalf, K., Small, N., Finch, C., Williams, J., Blair, T., Haines-Young, R., Potschin, M.
& Parker, J. 2014. Further development of a spatial framework for mapping ecosystem
services - User Manual. JNCC Report, No. 514 Supplemental Paper, JNCC, Peterborough.
Contents
1
Background .................................................................................................................... 4
1.1
Who is the User Manual for? ............................................................................. 4
1.2
Ecosystem approach .......................................................................................... 4
1.3
Approach ............................................................................................................. 4
1.4
Producing ecosystem service maps ................................................................. 6
2 Data - how to obtain it and assess whether it is fit for purpose for ecosystem
services mapping.................................................................................................................. 7
2.1
Data audit ............................................................................................................. 7
2.1.1 Data collection ............................................................................................ 7
2.1.2 Data suitability considerations .................................................................... 8
2.2
Considerations of scale ..................................................................................... 9
2.2.1 Supply and demand ................................................................................... 9
2.2.2 Mapping and data scale ............................................................................. 9
2.3
Consideration for rule development ............................................................... 10
2.4
Using a GIS to produce ecosystem service maps ......................................... 11
2.4.1 Modelling techniques ............................................................................... 11
2.4.2 Mapping validation ................................................................................... 11
2.4.3 Data certainty ........................................................................................... 12
3
Spatial framework ecosystem service database ...................................................... 13
3.1
Background to the spatial database ............................................................... 13
3.1.1 Rationale .................................................................................................. 13
3.1.2 Ecosystem service classifications ............................................................ 14
3.1.3 Ecosystem services ................................................................................. 14
3.2
How to use the database .................................................................................. 15
3.2.1
3.2.2
3.2.3
3.2.4
4
Stage 1: User selects the ‘option’ they require ......................................... 15
Stage 2: Filling in the requested form for the selected option .................. 16
Stage 3 ..................................................................................................... 18
Stage 4 ..................................................................................................... 18
Next Steps .................................................................................................................... 22
4.1
Database development ..................................................................................... 22
4.2
Incorporation with Bayesian Belief Networks ................................................ 22
Further development of a spatial framework for mapping ecosystem services - User manual
1
Background
1.1
Who is the User Manual for?
This manual has been prepared for users who want to:
•
•
•
understand how to map ecosystem services with the data they have;
know what data to use to map an ecosystem service; and
understand what effect different scales of data will have when mapping ecosystem
services.
It has two key purposes, namely:
•
•
demonstrating linkages between habitat classification systems and ecosystem services
to be modelled; and
providing a framework database which can show:
o
o
1.2
what it is possible to map for a particular ecosystem service; and
what data options are available to map ecosystem services.
Ecosystem approach
The ecosystems approach strongly focuses on the holistic and integrated management of
land, water and living resources to promote conservation and sustainable use. It is a
framework which can be used to look at whole ecosystems during the decision making
process, and for valuing the ecosystem services (ES) they provide, ensuring that society can
maintain a healthy and resilient natural environment for current and future generations.
1.3
Approach
This work further developed approaches set out in an earlier JNCC project ‘Spatial
framework for assessing evidence needs for operational ecosystem approaches’1 which
looked at mapping ecosystem services using existing datasets to model natural resources.
The project formed part of a toolkit to facilitate understanding of the linkage between
biophysical characteristics and ecosystem services (Box 1).
This earlier work examined two habitats in detail, setting out the level of certainty with which
the ecosystem services associated to each of these habitats can be mapped. This project
involved further analysis of the mapping and modelling of ecosystem services drawing on
recently completed practical data driven projects.2
The mapping approach discussed in this document involves utilising a rule base approach to
combine and map multiple thematic layers to display the spatial variance in potential
ecosystem service provision.
The key concepts underpinning this project and previous work are summarised in Figure 1.
1
MEDCALF, K. A., SMALL, N., FINCH, C., & PARKER, J., 2012. Spatial framework for assessing
evidence needs for operational ecosystem approaches. JNCC Report No 469.
2
SMALL, N., MEDCALF, K. A., 2013. Galloway and Southern Ayrshire Biosphere ecosystem services mapping
project: Technical Summary. Report to Scottish Natural Heritage and Southern Uplands Partnership.
4
Further development of a spatial framework for mapping ecosystem services - User manual
Box 1. What the Spatial Framework approach seeks to achieve
The ‘spatial framework approach’ contributes to a broader objective of facilitating users to:
•
describe the biophysical characteristics occurring within a landscape;
•
make links between the physical and biological characteristics of habitats and the major
ecosystems services being provided;
•
identify practical and appropriate ways in which habitat (and other biodiversity) data can be
used to identify and understand ecosystem service provision;
•
identify ways in which habitat data can be used to describe landscape characteristics and
understand how these characteristics vary spatially; and
•
understand how the condition of habitats and the way they are managed impacts on
ecosystem service delivery in different landscape contexts.
Ecosystem services link the functions of the environment to all the goods obtained from the
environment, both those that are immediately obvious in terms of their value (such as the provision of
food crop) and the more hidden value (such as the mitigation of climate change by the binding up of
carbon within soil and vegetation).
Behind the rationale of this work is the basic premise that each parcel of land influences the delivery
of many ecosystem services in some way, even if this contribution is only small (or has a negative
effect on that service).
These services are intrinsically linked to the habitats/land-cover present on any area of land and
further influenced by the key factors of the landform, soil/geology and management of the area.
Understanding how each block of land provides these services is an important step into taking
informed choices about the management of any block of land.
Figure 1. Four key factors to consider during ecosystem service mapping.
5
Further development of a spatial framework for mapping ecosystem services - User manual
The approach adopted in this project recognises that whilst this is a young science with
many unknowns, there is a large body of data already available which can be used to inform
the development of scientific rules to underpin ecosystem service mapping.
1.4
Producing ecosystem service maps
Every part of the earth’s surface provides not just direct benefits such as food and timber or
a building plot, but also indirect benefits such as the regulation of water flow to prevent
flooding and the storage of carbon in the soil which will help mitigate the effects of climate
change. Ecosystem service mapping needs to capture, and reflect as far as possible, the
underlying functional processes and properties.
The spatial framework project considers the background to and concepts underlying a range
of ecosystem mapping techniques.
The mapping approach adopted during the project works by using knowledge of natural
systems to categorise:
•
the importance of a dataset (that can be used for mapping) to the particular ecosystem
services being mapped.
To understand natural processes fully we need up-to-date accurate information on the state
of natural systems. Even with less than ideal data and a less than exact knowledge about
the interactions between a habitat, its location, management and the associated ecosystem
service, it is possible to grade the importance into a simple categorisation. As research
progresses and new data sets are developed it will be possible to further refine these
classifications.
The spatial framework project also considers how different terminologies (such as
ecosystem service classification systems) are used to describe these services and how
these terminologies relate to each other. Intrinsic to such an assessment is the need to
understand:
•
how different habitat mapping systems relate to each other and how they relate to the
different ecosystem services the land provides; and
•
how the different ways of classifying plant communities allows different types of
ecosystem service maps to be developed.
Biophysical features ‘above’ and ‘below’ ground are important in driving the level of
ecosystem service provided. To assist users with their mapping applications, the study
sought to:
•
identify the sort of data that is available to map the seven most often mapped
ecosystem services;
•
examine how the scale of data is related to the precision that it is possible to achieve
when describing the ecosystem service features on the ground; and
•
describe how the scientific literature supports the modelling of services based on current
scientific environmental knowledge.
The mapped outputs from the case studies are a useful resource to help inform land use
decisions because they form part of the evidence base to back up an ecosystem approach
having considered environmental, economic and cultural aspects of the UK’s natural
heritage.
6
Further development of a spatial framework for mapping ecosystem services - User manual
2
Data - how to obtain it and assess whether it is fit for
purpose for ecosystem services mapping
2.1
Data audit
A data audit for mapping ecosystem services comprises two key stages, a data collection
exercise and assessment of ‘fitness-for-purpose’ of the data collected (the spatial
assessment).
2.1.1 Data collection
A key stage when conducting an ecosystem service mapping study is to obtain a selection of
suitable datasets which can be used as indicators to represent services spatially. There are
a number of data providers who make available a good range of candidate datasets
(Table 1).
Table 1. Data providers and associated sources of data for ecosystem services mapping.
Data Providers
Organisation
Website name
Weblink
Scottish Natural
Heritage
Natural Spaces
https://gateway.snh.gov.uk/natural-spaces/index.jsp
Natural England
Data
http://www.naturalengland.org.uk/publications/data/
Environment
Agency
Geo store
http://www.geostore.com/environment-agency/
Ordnance
Survey
Open Data
http://www.ordnancesurvey.co.uk/business-andgovernment/products/opendata-products.html
English
Heritage
Designation data
http://www.englishheritage.org.uk/professional/protection/process/spatial-data/
Historic
Scotland
GIS downloads
http://data.historic-scotland.gov.uk/pls/htmldb/f?p=2100:10:0
Forestry
Commission
Data download
http://www.forestry.gov.uk/datadownload
Data references and online map viewer
MAGIC
Dataset listings
and download
options
http://www.magic.gov.uk/Dataset_Download_Summary.htm
During the data collection phase users may collect a variety of data types to include in the
suitability assessment, for example, tabular, spatial or numerical. Each of these data types
can be manipulated to be included within a spatial framework. To ensure a sound
foundation for mapping, the spatial framework approach suggests that as a minimum users
collect data and information on each of the four key influencing factors (habitat, soil/geology,
landscape and management - see Figure 1). Table 2 suggests datasets that the study team
consider to be ‘exemplar’ data in relation to the four key factors.
7
Further development of a spatial framework for mapping ecosystem services - User manual
Table 2. Sources of high quality datasets for the four key influencing factors.
Factor
Data theme
Habitat type
Habitat
Data Name
Phase 1 Habitat
Survey
Land Cover Map
2007
Substrate type
Landscape
context
Management
and socioeconomic
influences
Source
Natural Resources
Wales
Centre for
Hydrology and
Ecology (CEH)
BAP Priority Habitats
Natural England
Geology
DiGMap-250
British Geological
Survey
Soils
NATMAPVector
Cranfield University
Elevation
Terrain 5
Ordnance Survey
Landform Panorama
Ordnance Survey
NEXTMAP Britain
GETMAPPING
Forestry Commission
Estate recreation
routes
Forestry
Commission
Country parks
Natural England
Cycle routes
Sustrans
Integrated Habitat
System
Somerset
Environmental
Records Centre
Crop data
Bespoke
Recreation
Land use
Water abstraction
Development
Housing
Environment
Agency
Local authorities
Availability
Under restricted
licence
Payable licence
applicable
Open government
licence
Payable licence
applicable
Payable licence
applicable
Payable licence
applicable
OS open data/
Open government
licence
Payable licence
applicable
Open government
licence
Open government
licence
Under restricted
licence
Payable licence
applicable
Bespoke terms
and conditions
may apply
Under restricted
licence
Under restricted
licence
During this stage, it is good practice to record details about the data, perhaps in the form of a
data log so that all users have access to a baseline record document which can be used as
a key reference (e.g. that provides details on data sources, licence types, data contacts,
precision and accuracy of the data). This will ensure all knowledge about the data is
captured and can subsequently be kept up to date to reflect changes or further work being
carried out.
2.1.2 Data suitability considerations
Mapping uses spatial datasets, including both point and polygon vector data and raster data,
collected at a variety of different scales, at different dates and with a variety of accuracies
and resolutions.
The quality of the ecosystem service mapping will to a large extent be as good as the data
that has been fed into the analysis and the supporting rule-base created. Following the data
collection stage, all data should be subjected to a suitability and appropriateness
assessment to address the question ‘is it fit-for-purpose?’ The ‘data log’ document can be
used to record the details from the suitability assessment.
8
Further development of a spatial framework for mapping ecosystem services - User manual
Key factors the user should consider are:
•
•
•
•
•
•
•
Quality (in terms of coverage, topology and projections).
Suitability (whether appropriate information is included within the layer).
Precision and accuracy information.
Availability and licensing (PSMA licensing, Open Government Licensing, under
restricted licence, payable licence applies etc.).
Metadata quality is an important component of identifying data. Attached metadata
explains to the end user how the data was captured, the limitations of the data and the
confidence within the information provided. Caution should be applied for those
datasets which are not provided with sufficient accompanying information.
The age of the dataset and how frequently an update is made.
Geographical variability of datasets e.g. 50m digital terrain map (DTM) would be
suitable in a high terrain environment (e.g. Snowdonia National Park) but would not be
suitable to capture the subtle differences in elevation in areas like Norfolk.
It will become apparent that for any individual ecosystem service, there is no one single
dataset that is readily available, appropriate to use, simple to map and fully representative of
that service.
2.2
Considerations of scale
2.2.1 Supply and demand
Scale is an important overarching factor to consider when mapping ecosystem services.
Natural systems have intrinsic scales of operation, differing across space and time.
Moreover, the services being supplied are available at a range of ecological scales whereby
there is often a mismatch between point of provision and the location it is being received3 4 5
(i.e. where the demand is). Mapping is a useful tool for illustrating the spatial mismatch
between the provision and the demand of the service under examination6.
2.2.2 Mapping and data scale
Data must be fit for purpose; broad scale data is most suitable for use at a national, strategic
level to inform national policy and planning issues at this scale. At a local level, broad scale
data could potentially over simplify the context and does not often include the detail needed
if used in isolation at a local scale. To overcome this, broad scale data can be used if highly
detailed local data on environmental and social assets can be nested in to reflect the
situation. However, the subsequent analysis must be conducted at the resolution of the
broadest scale dataset. Previous studies have shown that regulating and provisioning
services are often mapped at larger scales7. This is often because data resolution dictates
3
HAUCK, J., GÖRG, C., VARJOPURO, R., RATAMAKI, O., MAES, J., WITTMER, H., JAX, K., 2013. Maps have
an air of authority: Potential benefits and challenges of ecosystem service maps at different levels of decision
making. Ecosystem Services, 4: 25-32.
4
HEIN, L., VAN KOOPEN, K., DE GROOT, R.S., VAN IERLAND, E.C., 2006. Spatial scales, stakeholders and
the valuation of ecosystem services, Ecological economics, 21: 39-53
5
PAGELLA, T., 2011. Review of spatial assessment tools for the mapping of ecosystem services. Report 3/11,
Bangor: Wales Environment Research Hub.
6
CROSSMAN, N, D., BURKHARD, B., NEDKOV, S., WILLEMEN, L., PETZ, K., PALOMO, I., DRAKOU, E, G.,
MARTIN-LOPEZ, B., MCPHEARSON, T., BOYANOVA, K., ALKEMEDE, R., EGOH, B., DUNBAR, M, B., MAES,
J., 2013. A blueprint for mapping and modelling ecosystem services, Ecosystem Services, 4: 4-14.
7
EGOH, B., DRAKOU, E.G., DUNBAR, M.B., MAES, J., WILLEMEN, L., 2012. Indicators for mapping ecosystem
services: a review. Report EUR 25456 EN. Publications Office of the European Union, Luxembourg.
9
Further development of a spatial framework for mapping ecosystem services - User manual
the scale of ecosystem mapping. Local proximal8 and site specific service types, such as
pollination, demand higher resolution data, which may not be available. As a consequence,
these services might be mapped less frequently (and therefore poorly represented in
decision making scenarios) due to the absence of this data and the high uncertainty that
surrounds the mapping if lower resolution data is used.
Different scale levels of policy and decision making have different requirements (as well as
different uses) of spatial information9. Ecosystem services are fluid and have no fixed
boundaries and therefore do not neatly fit within operational spatial scales. Mapping
ecosystem services is a constantly evolving arena. When further research and data
becomes available then the mapping models can be updated by utilising this new
knowledge.
2.3
Consideration for rule development
Using a rule base approach to combine and map multiple thematic layers to display the
spatial variance in potential ecosystem service provision provides a stepped approach to
building a representation of the whole or part of a complex ecosystem interaction. It takes
account of:
•
•
•
the specific attribute information of each dataset considered important for mapping that
service;
the relative value to be assigned to each element to enable mapping; and
if applicable, details on weightings required when different datasets are to be combined.
The characteristics of ecosystems can be represented to an extent by the attribute
information available within the spatial datasets. Current scientific knowledge on the
ecological attributes identified to underpin ecosystem services can be linked to measurable
attributes within the datasets. A simple mapping classification using values high, moderate,
low, neutral and negative can be used to split the datasets up for each ecosystem service
being mapped. These values represent the effect that attribute has on the delivery of the
ecosystem service being examined. For example, for soil carbon storage, a peat soil would
be scored ‘high’ in terms of potential soil carbon richness. Whereby a mineral soil, would be
given a ‘low score’.
The rule bases developed are designed to be transferable and they integrate scientific
knowledge and expert interpretation. Because the rule base is an expert system using both
scientific literature and local knowledge the method is iterative in nature (i.e. the rule-base is
revisited and improved upon). Local knowledge input is essential to check that the mapping
and the in situ characteristics match. This could not be done using scientific principles in
isolation.
8
Services which depend on the co-location of the ecosystem providing the service and those who receive the
benefit.
9
HAUCK, J., GÖRG, C., VARJOPURO, R., RATAMAKI, O., MAES, J., WITTMER, H., & JAX, K., 2013. Maps
have an air of authority: Potential benefits and challenges of ecosystem service maps at different levels of
decision making, Ecosystem Services, 4: 25-32.
10
Further development of a spatial framework for mapping ecosystem services - User manual
2.4
Using a GIS to produce ecosystem service maps
2.4.1 Modelling techniques
Overlay analysis is a well-established method available in the GIS toolkit which involves
intersecting a series of thematic layers to create new spatial units whose properties depend
on the combination of factors used to create them (i.e. the input layers of data).
Often existing GIS data sets do not occur at the same scale of mapping or have the same
area of coverage each having been created for its own particular purpose. In order to
overcome this, raster overlay analysis is often utilised. Each dataset (data layer) is turned
into a ‘grid’ data set called a ‘continuous raster dataset’ and each individual grid square
(pixel) within it is given a data value. These raster maps can be used to derive a new data
layer based on combinations of the properties of a series of input layers. Raster grids can be
varied in size to accommodate different dataset scales whilst maintaining consistency of
mapping (Figure 2). It is the combinations of values which determine the overall spatial
variation of importance for the service provided.
Figure 2. Varying raster grids to accommodate different dataset scales.
Overlay methods have been widely used to produce land suitability maps of different kinds.
Their popularity mainly rests on the fact that by relying on ‘standard’ GIS functionality, they
are easy to implement, and easy to understand especially by the non-specialist. The
methods available vary considerably in their sophistication, from simple Boolean overlay
through to more complex ‘map algebra’ techniques, involving combining data layers using
weights and/or mathematical functions. Using map algebra, for example, the strength of
influence of the different input data layers can be varied.
2.4.2 Mapping validation
Verifying the data values assigned and producing the subsequent maps is an iterative
process. The rule-base and mapping exercise should be inclusive and involve stakeholders,
utilising their local knowledge. Validation by stakeholders is crucial and production of these
maps cannot be done in isolation.
11
Further development of a spatial framework for mapping ecosystem services - User manual
2.4.3 Data certainty
The maps of ecosystem services are a modelled approximation of our best estimate of the
situation at the current time with the data available.
The certainty behind the mapping is dependent on the quality of the information which has
fed into the models development, both scientific knowledge and spatial detail.
The user should utilise data which is appropriate to the scale of the analysis. Any proposed
actions on sites below the initial mapping scale (e.g. individual sites) will need to be
assessed at a site level through other means e.g. environmental impact assessment. If
individual sites surveys are undertaken the results should be fed back into the rule base to
help enhance the spatial accuracy of the map.
12
Further development of a spatial framework for mapping ecosystem services - User manual
3
Spatial framework ecosystem service database
This section of the user guide summarises the key stages in operating the JNCC spatial
framework database.
3.1
Background to the spatial database
To encourage discussion and to progress the Framework approach, the project team
produced a ‘structure’ for a decision framework, which is supported by a database.
It helps the user to understand what ecosystem services are mapable, at what scale, and
using which data.
The ecosystems spatial framework database was built using a customised Microsoft Access
2010 database. This customised interface allows users, unfamiliar with MS Access, to easily
interact with the information and generate reports (Figure 3). This customisation was
achieved using ‘MS Access forms’, which limits the user’s interaction with the raw database
to a few simple buttons and selection boxes. The forms are driven by several background
tables that are used in conjunction with SQL queries and VBA scripts. These are used to
create the selections and allow the user to navigate the database. For example, when the
user clicks the report button for Options 1 and 2 (Figure 5) MS Access reports are created
then saved to a location selected by the user. For Option 3, the rule base considerations
report relating to the selected service is copied to a location selected by the user.
Figure 3. Customised user interface of the database.
3.1.1 Rationale
The rationale behind the development of a spatial framework database was to start bringing
together the large body of data already available and demonstrate how these datasets could
be used to inform the development of scientific rules to underpin an ecosystem services
inventory and to facilitate the mapping process.
13
Further development of a spatial framework for mapping ecosystem services - User manual
3.1.2 Ecosystem service classifications
There are a number of different ecosystem service classifications in use, so the spatial
framework database uses the Common International Classification of Ecosystem Services
(CICES) as a pivotal classification to which the UKNEA, MA and TEEB classifications can be
referenced too.
CICES was developed to overcome the problems of multiple classifications and to
understand the correspondence between them10. Within the database there is a translation
table which translates the CICES classification to UKNEA, TEEB or MA (Figure 4). CICES is
a classification of final ecosystem services, which are defined as the biotic ecosystem
outputs that are directly used or consumed by people. It uses a hierarchical structure and
Figure 3 illustrates what the CICES class ‘Flood protection’ (bottom left hand side) translates
to in other ecosystem service classifications (orange box on right hand side).
Figure 4. Spatial Framework ‘translation’ table showing TEEB, MA and NEA equivalents for
the CICES class ‘Flood Protection’.
If the user first selects Regulation and Maintenance’ in the ‘Section’ (broader category) in the
CICES box, followed by the option ‘Mediation of Flows in the ‘Division’, then the option ‘liquid
flows’ from the more defined types of service under the ‘Group’ heading this identifies the
‘Class’ Flood Protection, which when selected translates to ‘hazard regulation’ under the
UKNEA and so forth (in the orange box).
3.1.3 Ecosystem services
The database allows the user to explore seven ecosystem services which were chosen from
the ecosystem service mapping review (discussed in section 2.2 of the final report) and from
two other recent literature reviews11 12. At this stage, the database does not include an
exhaustive list of ecosystem services. However, with further development the database can
accommodate more ecosystem services and data suggestions.
10
HAINES-YOUNG, R. & POTSCHIN, M., 2013. Common International Classification of Ecosystem Services
(CICES). Report to the European Environment Agency (download: www.cices.eu).
11
MARTI´NEZ-HARMS, M.J.,& BALVANERA,P., 2012. Methods for mapping ecosystem service supply: a
review. International Journal of Biodiversity Science , Ecosystem Services & Management, 8: 17–25.
12
EGOH, B., DRAKOU, E.G., DUNBAR, M.B., MAES, J., & WILLEMEN, L., 2012. Indicators for mapping
ecosystem services: a review. Report EUR 25456 EN. Publications Office of the European Union, Luxembourg.
14
Further development of a spatial framework for mapping ecosystem services - User manual
3.2
How to use the database
The database takes into account the main factors and the logical steps that need to be
followed in a process that should facilitate and inform mapping of ecosystem services. Each
of these factors is discussed in more detail in this section.
The database takes into account the scale of the project that the user is considering and the
data available in terms of habitat, soil, geology, landform and management. The data lists
included in the database are not by any means an exhaustive list. The data listed are those
which are familiar to the project team, some of which the project team have experience in
utilising in an ecosystem service mapping project.
There are four stages to follow when using the options within the database:
•
•
•
•
•
Stage 1: The user selects the ‘option’ they require from the main splash screen.
Stage 2: The user fills in the requested form for their selected option.
Stage 3: The database processes the selection to create an output or inform the user
that no output can be created from their selection.
Stage 4: The reports are saved.
Stage 5: Depending on whether option 1 or 2 has been selected, the user then can
move onto option 3.
3.2.1 Stage 1: User selects the ‘option’ they require
The user selects either option 1 or option 2 depending on whether they have data available
or not (Figure 5). Following their selection of option 1 or 2 they carry on to option 3.
Figure 3. Layout of the main database splash screen showing the options available.
•
•
•
Option 1 is selected if the user already has datasets and would like to know what they
could map with their data. Or,
Option 2 is selected if the user doesn’t know what data to collect but has a scale in
mind.
Option 3 is provides a reference document which describes influences to consider when
they come onto creating their rule-base.
15
Further development of a spatial framework for mapping ecosystem services - User manual
3.2.2 Stage 2: Filling in the requested form for the selected option
Option 1
Option 1 is for those users who already have data available and are not sure what they can
map in terms of ecosystem services. This option provides the user with a list of datasets
based on the four factors (Figure 1). The user can then select the datasets they have
available (Figure 6).
Figure 4. Screen for identifying and selecting datasets that are available for the mapping of
ecosystem services under ‘Option 1’.
Option 2
Option 2 is for those users who have an idea of the ecosystem service they wish to map but
do not know what data is suitable for the scale of mapping they are considering (Figure 7).
The user first selects the CICES service they wish to map (using the options in the box
outlined in red in Figure 7).
They then select the scale at which they would like to map (using the options in the box
outlined in aqua in Figure 7).
16
Further development of a spatial framework for mapping ecosystem services - User manual
Figure 5. Screen for selecting an ecosystem service and the scale at which the user wishes
to map it under ‘Option 2’.
Option 3
Option 3 is to be selected when the users have worked out which particular datasets would
be suitable for mapping the ecosystem service of choice. The user selects the service (using
the CICES classification) and then clicks report.
Figure 6. Screen for selecting the rule-base considerations report for the ecosystem service
of the users choice.
17
Further development of a spatial framework for mapping ecosystem services - User manual
3.2.3 Stage 3
Stage three of the database workflow, is where the database calls on the applicable
background ‘look up tables’ to derive relevant information and generate the output reports for
the option that has been selected.
Information within the background tables includes:
•
•
Data and scale information.
Data and descriptive details (e.g. likely source, availability, terms to the data use and
any appropriate contact links).
3.2.4 Stage 4
Reports are generated for each of the three options in the Ecosystems services framework
database. The output options available all require the user to save the reports to a location
on their computer which is familiar to them and is easily accessible. The user is to click on
‘report’ within the option interface.
Option 1
The output report includes information on:
•
•
•
•
•
what ecosystem service the data can be used to map;
the scale of the mapping;
data theme e.g habitat;
dataset name; and
suitability (three labels):
o ‘Suitable level of detail’ – the data is suitable for the scale of mapping.
o ‘Use with discretion’ – the data may not be ideal for the scale of mapping and the
user should use and his/her discretion.
o ‘Bespoke’ – the data the user has selected is bespoke and no assumption can be
made by the spatial framework project team.
Option 2
The output report that is produced details the following information:
•
•
•
•
•
•
The ecosystem service and the scale the user initially selected.
Suitability (as above).
The data theme e.g. habitat.
A list of datasets under the broad data theme type.
The likely source for the information e.g. Ordnance Survey.
Availability e.g. restricted or PSMA licence (see Table 3).
18
Further development of a spatial framework for mapping ecosystem services - User manual
Table 3. Labels used in the database to communicate dataset availability.
Availability
Label
Definition
Costed Licence applicable
The data may be subject to a royalty and/or
licence fee prior to use.
Datashare
Environment Agency Geostore
Downloadable
Dataset available from an online portal
Licence applicable
Licence will be needed to use this dataset.
Open Government Licence
Open government licence for public sector
information.
OS OpenData
OS Open Data is a range of digital map
products freely available to view or download
and can be used in personal and commercial
applications
Potential Restrictions
There could be restrictions in place to the
use of the data. Check with data source.
PSMA
Public Sector Mapping Agreement or in
Scotland it is known as the One Scotland
Mapping Agreement (OSMA)
Restricted
Contact data source to find out whether data
is available to use.
Restricted/Sensitive
Data could contain sensitive information and
is not widely available.
•
•
Terms e.g. check licensing conditions (See Table 4).
Link e.g. how to get more information on the data.
19
Further development of a spatial framework for mapping ecosystem services - User manual
Table 4. Labels used in the database to communicate terms and conditions of data use.
Term and conditions
Label
Definition
Check licensing conditions
The terms and conditions of the licence should be
checked prior to use. Contact the source of the data
for further information.
Commercial or non-commercial purposes
Commercial and non- commercial users can use this
dataset.
Derived from Ordnance Survey MasterMap
product. Check Ordnance Survey MasterMap
licensing terms
This data may have been derived from Ordnance
Survey data. To use a derived data product you will
need to check the appropriate licensing is in place.
Free for commercial, research and public use.
Acknowledge the material.
The data is can be used for commercial, research
and public use purposes. Acknowledgement of
source should be included in any supporting
documentation created.
Must acknowledge source
The source of the data should be included and
where an attribution statement is specified by the
information provider this and a link to the licence
should be provided.
Must acknowledge source and does not
include commercial use
Not for commercial use. The source of the data
should be included in any supporting documentation
created.
Restrictions could apply
Check the licensing or the data owner on whether
restrictions apply to the use of data.
Option 3
These report output summarises key factors to consider when creating an ecosystem
service mapping rule-base (Figure 9).
The example illustrated in Figure 9 shows how the rule-base considerations document is set
out. Each of these documents is framed around the four key influencing factors (Figure 1)
and provides pertinent details to consider when creating a rule base and a reference list is
included if the user wishes to explore some of the detail captured further. There are seven
rule base consideration documents for the following ecosystem services:
•
•
•
•
•
•
•
soil carbon storage;
vegetation carbon storage;
water quality regulation;
water quantity regulation;
food production;
recreation; and
biodiversity.
20
Further development of a spatial framework for mapping ecosystem services - User manual
Figure 7. An example of a report output from Option 3 describing considerations for rulebase development.
21
Further development of a spatial framework for mapping ecosystem services - User manual
4
Next Steps
4.1
Database development
The Spatial Framework Database can be further developed to incorporate further information
and data as it becomes available, for example:
•
•
•
•
4.2
Incorporation of further ecosystem service classifications (e.g. Natural Resource
Wales’s ecosystem service classification).
Inclusion of more CICES services.
Incorporation of further information on dataset attributes e.g. habitat types, soil types.
Link between habitat classifications (e.g. EUNIS) and probable provision of ecosystem
services to accompany Bayesian Belief Networks (BBN).
Incorporation with Bayesian Belief Networks
Bayesian Belief Networks are discussed in the final report13 and the introduction to BBN
document14. The project team considers that the use of BBNs may complement the Spatial
Framework Database.
The existing work has shown that it is possible to move through the different habitat
classification systems using a BBN structure. Figure 10 illustrates conceptually that users
could select a given habitat, using the classification system relevant to their application, and
the result could be passed to an underlying database where the relevant biophysical
characteristics for this kind of habitat are held. As in the existing study this database could
be generated using expert knowledge and/or empirical evidence.
Figure 8. Linking habitat classification and service prediction BBNs through a habitats
database.
13
MEDCALF, K.A., SMALL, N., WILLIAMS, J., BLAIR, T., FINCH, C., HAINES-YOUNG, R., POTSCHIN, M., &
PARKER, J., 2013. Further development of a spatial framework for mapping ecosystem services. Report to
JNCC.
14
HAINES-YOUNG,R., POTSCHIN, M., MEDCALF, K., SMALL, N., & PARKER, J., 2013. Briefing paper 1
Bayesian Belief Networks. Report to JNCC.
22
Further development of a spatial framework for mapping ecosystem services - User manual
Once the biophysical characteristics have been extracted from the database, the system
would pass these data to the BBN that predicts the service profile, and the user would be
able to modify the input to reflect any local knowledge they might have. Alternatively they
may modify the inputs to reflect some management or intervention scenario.
As Figure 10 suggests, these inputs would then be used to make an assessment of the likely
ecosystem service associated with the selected habitats and the relative importance of these
inputs.
23