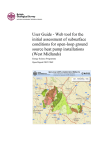
1
Landmark Information Group Envirocheck® User Guide Envirocheck User Guide for the Environmental Professional. A comprehensive guide to Envirocheck reports, products and services. 1 Landmark Information Group Envirocheck® User Guide User Guide Contents 3 Glossary of Terms and Abbreviations Used Within Envirocheck 5 1. What is Envirocheck? 6 2. The Envirocheck Report 8 3. Historical Maps and Aerial Imagery 10 4. Ordering an Envirocheck 12 5. Dataset Descriptions 27 6. Other Envirocheck Services 30 Appendix 1 – The National Grid 31 Appendix 2 – Paper Map Copying Licence 2 Landmark Information Group Envirocheck® User Guide Glossary of Terms and Abbreviations Used Within Envirocheck Government Bodies: Department for Environment, Food and Rural Affairs (DEFRA) Department of the Environment (DoE) European Community (EC) European Economic Community (EEC) Health Protection Agency (HPA) Health and Safety Executive (HSA) Her Majesty’s Industrial Pollution Inspectorate (HMIPI) Her Majesty’s Inspectorate of Pollution (HMIP) Local Education Authorities (LEA) Local Planning Register (LPR) River Purification Board (RPB) United Nations Educational, Scientific and Cultural Organization (UNESCO) Waste Regulatory Authority (WRA) Legislation: Agriculture Act 1986 Ancient Monuments and Archaeological Areas Act 1979 Brine Pumping (Compensation for Subsidence) Act 1891 Cheshire Brine Pumping (Compensation for Subsidence) Act 1952 Control of Major Accident Hazards Regulations 1999 Control of Pollution Act 1974 Dangerous Substances in Harbour Area Regulations 1987 Environmental Permitting Regulations Environmental Protection Act 1990 European Commission Directive on the Conservation of Wild Birds 1979, commonly known as the Wild Birds Directive European Community Agri-Environment Regulations 1994 European Community Nitrate Directive (91/676/EEC) European Economic Community Directive on the Conservation of Natural Habitats and Wild Fauna and Flora (92/43/EEC), commonly known as the Habitats and Species Directive Explosives Act 1875 and 1923 General Quality Assessment Historic Buildings and Ancient Monuments Act 1953 Integrated Pollution Control 3 Landmark Information Group Envirocheck® User Guide Integrated Pollution Prevention and Control National Parks and Access to the Countryside Act 1949 Notification of Installations Handling Hazardous Substances Regulations 1982 Notification of Installations Handling Hazardous Substances Regulations 1982 Planning (Hazardous Substance) Act 1990 as amended for England and Wales, and the Planning (Hazardous Substances) (Scotland) Act 1997 in Scotland Radioactive Substances Act 1993 Ramsar Convention on Wetlands of International Importance (1971) Town and Country Planning Act Waste Management Licensing Regulations 1994 Water Resources Act 1991 Wildlife and Countryside Act 1981 World Heritage Sites designated under set criteria by UNESCO Data Suppliers: British Geological Survey (BGS) Countryside Council for Wales (CCW) Centre for Ecology and Hydrology (CEH) Environment Agency (EA) Jeremy Benn Associates (JBA) Local Authority (LA) Natural England Nigel Press Associates (NPA) Ordnance Survey (OS) Ove Arup Peter Brett Associates (PBA) PointX Natural Resources Wales (NRW) Scottish Environment Protection Agency (SEPA) Scottish Natural Heritage (SNH) The Coal Authority Data: Areas of Outstanding Natural Beauty (AONB) Detailed River Network (DRN) Environmentally Sensitive Areas (ESA) Groundwater Vulnerability (GWV) Local Authority Integrated Pollution Prevention and Control (LAIPPC) Local Authority Pollution Prevention and Controls (LAPPC) 4 Landmark Information Group Envirocheck® User Guide Local Nature Reserves (LNR) Marine Nature Reserves (MNR) National Nature Reserves (NNR) National Scenic Areas (NSA) Nitrate Sensitive Areas (NSA) Nitrate Vulnerability Zones (NVZ) Points of Interest (POI) Risk of Flooding from Rivers and Sea (RoFRS) Sites of Special Scientific Interest (SSSI) Source Protection Zones (SPZ) Special Areas of Conservation (SAC) Special Protection Areas (SPA) 5 Landmark Information Group Envirocheck® User Guide 1. What is Envirocheck? The Envirocheck Report, by Landmark Information Group, is a desk study service providing accurate and up to date environmental site information. Landmark Information Group exhaustively collates disparate data describing potentially contaminative land use, geology, natural environmental hazards and areas of environmental sensitivity from national, regional and local data providers. Subject to rigorous quality control processes and continual update cycles, these data are combined with Ordnance Survey current and historical mapping to provide the most reliable and cost effective environmental information service available in the market. Each report is site specific, as designated by you, the customer, and can be used to undertake: Phase 1 environmental assessments Environmental due diligence reporting Environmental impact assessments IPPC permit applications Asset management Contaminated land assessment Housing stock transfers Data within the Envirocheck report is presented in easy to analyse maps and accompanied by supporting information in referenced datasheets. Detailed site specific analysis can be undertaken using the detailed large scale mapping containing information about features of interest on your site. Contextual information is also provided on medium scale mapping that describes the area surrounding a site and is useful for understanding whether any peripheral features could have an impact. 6 Landmark Information Group Envirocheck® User Guide 2. The Envirocheck Report 2.1 Site Extent and Buffers Each Envirocheck Report starts with a customer defined site; either a point location or boundary. A user defined search distance, or buffer, is then used to search out around the area of interest to identify all features in the vicinity. These data and information are plotted onto a set of maps using different map scales (Table 1 and described in detail below). Different map scales are used because Envirocheck references over 150 datasets, many of which have different levels of accuracy and corresponding mapping scales. Map Scale Recommended Use 1:2,500 (‘large scale’) Suitable for detailed site specific analysis 1:10,000 (‘intermediate scale’) Suitable for site and context analysis 1:25,000 (‘medium scale’) Suitable for regional analysis Table 1: Summary of Envirocheck Mapping Scales 7 Landmark Information Group Envirocheck® User Guide 2.2 Maps Envirocheck maps, regardless of scale, are plotted with a fixed extent. This format ensures that the same spatial extent (per map scale) is always used to aid interpretation of the report. Sites which are larger than the extent of one map are split into a stack of maps. The following maps are included in an Envirocheck: 2.2.1 Index Map An Index Map that shows the number and location of Slices and Segments (explained below) that are included in the order. Individual maps referred to as ‘Slices’ and plotted on A3 Map scale: 1:10,000 Site Sensitivity Maps Map extent: 2.7km x 2.7km Describes Flood Risk, Boreholes, Sensitive Land Uses, Source Protection Zones, EA/BGS Aquifer Designations, Sensitive Land Uses and BGS Soil Chemistry on and around your site Individual maps referred to as ‘Segments’ and plotted on A3 Map Segments Map scale: 1:2,500 Map extent: 675m x 675m Intended for detailed on-site analysis Plotted on A4 Map scale: 1:25,000 Context Maps Map extent: 4.075 km x 4.075 km Describes the site in a wider environmental context; not appropriate for deriving onsite specific conclusions Contain medium scale background mapping 8 Landmark Information Group Envirocheck® User Guide 2.3 Datasheets A Datasheet is produced for each Envirocheck Report Slice and contains detailed information about the features returned by the search and plotted on the maps and contains the following sections: 2.3.1 Contents The Contents page lists the section page numbers to aid navigation through the Datasheet. In PDF versions of the Envirocheck Report these page numbers are included as hyperlinks to the relevant section. Figure 1: Contents page 2.3.2 Summary Table The Summary Table lists the information returned by the search within the defined buffers from the site. A number in the table against the relevant dataset indicates that an entry for that data type has been returned. A value of ‘n/a’ in the table indicates that the relevant data type has not been searched for at that buffer distance. A blank entry in the table indicates that no features have been returned for that data type. The total number of features returned by the search is indicated against each data type. A page number is included for easy reference within the Datasheet and in PDF versions this is included as a hyperlink. For some datasets the presence of a feature is indicated by a ‘Yes’ in the summary table under the appropriate search buffer. Figure 2: Summary Table 9 Landmark Information Group Envirocheck® User Guide 2.3.3 Data Tables The Data Tables include detailed information about the features returned by the search. These tables are grouped into the following sections: Agency & Hydrological Data Waste Data Hazardous Substances Data Geological Data Industrial Land Use Data Sensitive Land Use Data Figure 3: Data Table 2.7 Supporting Information Information on data currency, data suppliers, useful contacts and copyright notices can also be found in the datasheets. 10 Landmark Information Group Envirocheck® User Guide 3. Historical Maps and Aerial Imagery Landmark maintains the UK’s largest and most comprehensive archive of digital historical maps and aerial imagery (photographs) covering England, Scotland and Wales. These maps are ideal for understanding the history of land use on and around your site. There are over 1 million individual maps in the archive including: Ordnance Survey County Series at 1:2,500 and 1:10,560 scales Ordnance Survey National Grid Series at 1:1,250, 1:2,500 and 1:10,000 scales Ordnance Survey SIMs (Survey Information on Microfiche), SUSIs (Supply of Unpublished Survey Information) and Large-scale National Grid Data (Superplans) Historical Town Plans, Historical Building (GOAD) Plans (provided as individual .GIF images), Russian Military Maps and Historical Aerial Imagery Ordnance Survey Colour Raster maps at 1:10,000 scale To enable the full range of information in the Envirocheck Report to be plotted, the Historical Maps are split into ‘Slices’, ‘Segments’ and ‘Quadrants’. Historical Maps and Aerial Imagery at 1:10,000 and 1:10,560 scale: Plotted as ‘Slices’ on A3 Map scale: 1:10,000 Map extent 2.7 km x 2.7 km Larger scale Historical Maps, Russian Military Maps, Historical Town Plans and Aerial Imagery: Plotted as ‘Segments’ on A3 Map scale: 1:2,500 Map extent 675 m x 675 m A Historical Mapping Legends sheet is included for each mapping type and provides further detail on the individual maps contained within the Historical Map Pack. 11 Landmark Information Group Envirocheck® User Guide 4. Ordering an Envirocheck 4.1 Product Options Standard Envirocheck reports are ordered through the www.envirocheck.co.uk website. To offer flexibility and costs savings to you, the customer, Envirocheck reports can be tailored to your requirements by specifying the search buffers and choosing from 3 options of site sensitivity data and historical mapping. The Premium, Essential and Basic options are described below. Note, you can order any Site Sensitivity Data and Historical Map combination; for example, Premium Site Sensitivity data and basic Historical Map data. 4.2 Site Sensitivity Data Index Map Segment Map (1 x 1:2,500 Segment Map using OS MasterMap®)* Premium Slice Map (3 x 1:10,000 Slice Maps using OS Street View®)* Context Map (5 x 1:25,000 Slice Maps using OS 1:50,000 mapping)* Soil Geochemistry Slice Map (BGS Soil Chemistry maps using OS Street View®)* Datasheet Index Map Segment Map (1 x 1:2,500 Segment Map using OS VectorMap Local®)* Essential Slice Map (3 x 1:10,000 Slice Maps using OS Street View®)* Context Map (5 x 1:25,000 Slice Maps using OS 1:50,000 mapping)* Soil Geochemistry Slice Map (BGS Soil Chemistry maps using OS Street View®)* Datasheet Index Map Slice Map (3 x 1:10,000 Slice Maps using OS Street View®)* Basic Context Map (5 x 1:25,000 Slice Maps using OS 1:50,000 mapping)* Soil Geochemistry Slice Map (BGS Soil Chemistry maps using OS Street View®)* Datasheet *Individual maps are delivered as separate pages within a single PDF. 12 Landmark Information Group Envirocheck® User Guide 4.3 Historical Maps and Aerial Imagery 3 x OS 1:10,000 Colour Raster Maps (dated 1999, 2006 & 2011) Premium OS County Series, National Grid, SIMs, SUSI, Superplans, Historical Town Plans, Russian Military Maps and Historical Aerial Imagery as standard 1 x OS 1:10,000 Colour Raster Map (dated 2011) Essential 1 x OS 1:10,000 Colour Raster Map – (your choice of 1999 or 2006) OS County Series, National Grid, SIMs, SUSI, Superplans, Historical Town Plans, Russian Military Maps and Historical Aerial Imagery as standard 1 x OS 1:10,000 Colour Raster Map (dated 2011) Basic OS County Series, National Grid, SIMs, SUSI, Superplans, Historical Town Plans, Russian Military Maps and Historical Aerial Imagery as standard 4.4 Buffer Distances The buffer distance controls how far from the site Landmark search for information. If it is important for you to understand what is in the periphery of your site then a large buffer distance would be appropriate. Conversely, if you only require on-site information then a small buffer distance will ensure unnecessary peripheral information is not included in your report. Options for buffer distances are summarised below: Map Scale Search Buffer 1:2,500 0 m – 250 m 1:10,000 50 m – 1000 m* 1:25,000 50 m – 1000m* *The maximum standard search buffer is 1000m from the site. Water Abstractions are searched to twice the distance of the selected buffer, with the exception of a 50m buffer where they are searched to 250m. Users also have the option to select a different search buffer for the BGS Borehole and Contemporary Trade Directory Entries datasets. This option is offered due to the large number of features that may be returned for these specific datasets. 4.5 Oversize and Linear Sites A standard Envirocheck, ordered through the website (www.envirocheck.co.uk) has a maximum size of 16 map slices, equivalent to an area of 10.8 km2. Envirocheck does offer a bespoke service for large, or linear, sites requiring more than 16 map slices. Bespoke orders are handled offline by our customer services team (see Section 4.6 below). 13 Landmark Information Group Envirocheck® User Guide 4.6 Customer Services Our customer service team is available on 0844 844 9952 to discuss bespoke orders or answer any other questions you may have. Detailed descriptions of the different Envirocheck product options can be found on the www.envirocheck.co.uk website. 5. Dataset Descriptions This section provides detailed descriptions of each dataset included in the Envirocheck report. Datasets are grouped according to the major groupings used in the datasheets; for example, the Environment Agency datasets are in the ‘Agency & Hydrological Section’. 5.1 Agency & Hydrological (including Flood) Data Dataset Description Aquifer designations are classifications of groundwater designed to help the Environment Agency (EA) protect these resources. Bedrock aquifers are used as drinking water supplies and also support surface aquatic ecosystems; the Bedrock Aquifer designation level reflects the importance of the aquifer in these roles. Designations The EA groundwater protection policy was changed on 1st April 2010 to ensure consistency with the Water Framework Directive. As a result the EA and British Geological Survey (BGS) have collaborated to create a new aquifer designations map based on the BGS DiGMap-50 geology layer which constitutes this dataset. Contaminated Land Register Entries and Notices This dataset contains Contaminated Land entries and notices held on the part 2A public register served under section 78R of the Environmental Protection Act (EPA) 1990. Sites are identified as contaminated if the authority identifies a contaminant, a relevant receptor and a pathway linking the two. This data describes the rivers, drains and streams which can be found in England and Wales. The Detailed River Network (DRN) Lines dataset is a drainage centreline dataset captured primarily from the water features theme of Ordnance Survey’s (OS) MasterMap Topography Layer, at three separate Detailed River scales: 1:1,250, 1:2,500 and 1:10,000. DRN geometry is linked back to the contributing OS MasterMap Network Lines topographic water features following the principles of the Digital National Framework (DNF) and is designed to represent a continuous, detailed network of water flows. The DRN Lines dataset is the primary feature class of the DRN dataset - line features that represent the river network. The data contains some features located in Scotland where water features either flow into or originate in Scotland. 14 Landmark Information Group Dataset Envirocheck® User Guide Description This data describes water features that do not connect into the detailed river network. The Detailed River Network (DRN) Offline Drainage dataset is a drainage centreline dataset captured primarily from the Detailed River Network Offline Drainage water features theme of Ordnance Survey’s (OS) MasterMap Topography Layer, at three separate scales: 1:1,250, 1:2,500 and 1:10,000. DRN geometry is linked back to the contributing OS MasterMap topographic water features following the principles of the Digital National Framework (DNF) and includes water features from OS MasterMap that do not connect into the river network and are generally limited in length. The data contains some features located in Scotland where water features either flow into or originate in Scotland. Discharge Consents This dataset contains general details of all consents issued under Section 84(1) of the Water Resources Act (WRA) 1991 to discharge sewage, trade effluent, poisonous, noxious or polluting matter into controlled waters. This dataset contains details of enforcement notices relating to Integrated Pollution Control Enforcement and (IPC)/Environmental Protection Regulations (EPR) processes regulated by the Environmental Protection Prohibition Notices Act (EPA) 1990. If the conditions of an authorised process/license are breached the regulating authority will serve a notice indicating a required improvement or suspension of the process. This dataset provides information regarding location of sensitive water resources and soil classifications. Drift deposits are included where present. Groundwater Groundwater, which is contained within underground strata (aquifers), is usually of high quality, being Vulnerability utilised for potable water and various other industrial and agricultural uses. It is vulnerable to (GWV) contamination from direct discharges into the groundwater and indirect discharges onto or into land, and since decontamination is difficult, expensive and prolonged, it is important to prevent pollution of these resources. This dataset contains details of permits designed to control industrial pollution, specifically the release of Integrated polluting substances to air, land and water. Pollution The permits apply to the most potentially polluting or technologically complex processes as designated Controls (IPC) and licensed by the Environment Agency (EA) under the Integrated Pollution Prevention Control (IPPC) directive of the Environmental Protection Act (EPA). Integrated Pollution This dataset contains details of permits that aim to control the environmental impact of certain industrial Prevention and activities as regulated and licensed by the Environment Agency (EA) under the Integrated Pollution Control (IPPC) Prevention Control (IPPC) directive of the Environmental Protection Act (EPA). This dataset contains details of permits used to regulate industrial and commercial activity that may affect Local Authority the land air, and/or water as determined under the Integrated Pollution Prevention Control (IPPC) Integrated Pollution directive of the Environmental Protection Act (EPA). Prevention and Operators are required to hold a permit specifying operational limitations and pollution control measures, Control (LAIPPC) along with address details and the nature of the regulated process. Local Authority Integrated Pollution Prevention Control (LAIPPC) processes relate to installations that are considered the most polluting. 15 Landmark Information Group Envirocheck® User Guide Dataset Description Local Authority This dataset details notices of enforcement action taken against holders of Local Authority Pollution Pollution Prevention Control (LAPPC) permits regulated by the Environmental Protection Act Prevention and (EPA) 1990. Control Enforcement action is carried out when the conditions of the held LAPPC licence are breached. This Enforcements can include exceeding emission limits or failing to maintain site equipment. This dataset details permits used to regulate industrial and commercial activity that may affect the Local Authority land air, and/or water as regulated and licensed by the Environment Agency (EA) under the Pollution Integrated Pollution and Prevention Control (IPPC) directive of the Environmental Protection Act Prevention and Controls (EPA) 1990. (LAPPC) Operators are required to hold a permit specifying operational limitations and pollution control measures, along with address details and the nature of the regulated process. Nearest Surface Water Feature Surface water features as derived from Ordnance Survey (OS) data. Land-Form PROFILE Air Heights define the height above sea level at a single point. Air Heights are OS Land-Form recorded to the nearest 1.0 m and typically follow Hill tops, valley junctions, low-lying areas and river PROFILE Air crossings. Selected Air Heights are captured from Ordnance Survey’s 1:10,000 scale mapping and Heights this is supplemented by Spot Heights, and high and low water marks from Ordnance Survey 1:1,250, 1:2,500 and 1:10,000 scale digital mapping data. Ordnance Survey’s Land-Form PROFILE contour data is a data set representing the physical shape of the real world within Great Britain. Contained within this data set are height contours, and high and low water marks. Contour data has been captured from Ordnance Survey’s 1:10,000 scale mapping, with high and low water marks from Ordnance Survey 1:1,250, 1:2,500 or 1:10,000 scale digital data. The Ordnance Survey 1:10,000 scale mapping was re-contoured as part of a programme, completed in 1987, using photogrammetric OS Land-Form techniques. Some small areas, which were not visible on the photography, were surveyed by ground PROFILE Contours methods. The height contours are at 5 m intervals, except in mountain or moorland areas where the interval is 10 m. Indexed contours are present at 25 m intervals, 50 m in mountain or moorland areas. Height values are given to a resolution of 1 cm but will have an accuracy dependent on the survey method used to fix the height. In areas with a 5 m vertical interval the accuracy of the contours has been found to be of the order of ±1.0 m root mean square error (RMSE). For areas with a 10 m vertical interval the accuracy is of the order of ±1.8 m RMSE. Land-Form PROFILE is supplied in tiles, each tile covering an area of 5 km by 5 km, with 10,577 tiles in the series. 16 Landmark Information Group Dataset Envirocheck® User Guide Description Land-Form PROFILE Spot Heights define the height above sea level at a single point and were fixed by ground survey methods, mainly spirit levelling, at the time the national bench mark network was established and are normally positioned along the centre of roads (recorded to the nearest 0.1 m). Some additional Spot Heights were surveyed using height traversing techniques to supplement Air OS Land-Form Heights in areas of sparse control. PROFILE Spot Heights Selected Spot heights are captured from Ordnance Survey’s 1:10,000 scale mapping and this is supplemented by Air Heights, and high and low water marks from Ordnance Survey’s 1:1,250, 1:2,500 and 1:10,000 scale digital mapping data. In confined circumstances (for example ancient earthworks) where the topography is depicted by slope symbols instead of contours, a single central Spot height is captured. On extended features, spot heights are captured at intervals of 750 m. Pollution Incidents to Controlled Waters Prosecutions Relating to Authorised Processes This dataset contains details of pollution incidents to controlled waters as detailed in registers held by the Environment Agency (EA). This dataset contains details of prosecutions and enforcement notices relating to Integrated Pollution Control (IPC) authorised processes, which are brought under Section 23 (1) of the Environmental Protection Act (EPA) 1990. This dataset contains details of prosecution actions carried out by the Environment Agency (EA) where controlled waters are affected. Prosecutions Relating to Controlled Waters The Water Resources Act (WRA) 1991 and Environmental Permitting Regulations (EPR) prohibit unlicensed discharges and abstractions of water. Incidents can range from sewage effluent discharge levels exceeding consented amounts to allowing pollutant to enter a watercourse. Registered This dataset refers to licences granted under the Radioactive Substances Act (RSA) 1993. Radioactive This act controls the storage, use and disposal of radioactive substances, through authorisation and Substances registration systems and provides access to information regarding sites holding such consents. Source Protection Zones (SPZ), together with the Groundwater Vulnerability (GWV) Map, have been developed to support the Environment Agency’s (EA) Groundwater Protection Policy in an attempt to protect groundwater sources. Source Protection Zones (SPZ) They represent areas in England and Wales that form the catchments to water supplies that are potentially vulnerable to contamination from polluting activities. Different zones have been assigned to the groundwater source catchments depending primarily upon the time it would take a pollutant to reach the source. 17 Landmark Information Group Dataset Envirocheck® User Guide Description This dataset relates to pollution incidents which have been brought to the attention of the Substantiated Environment Agency (EA) and fall within their responsibility given that they may have an Pollution Incident environmental and/or operational impact. Register Incidents are based on reports from members of the public, emergency services, local authorities, government departments, other regulators, industry, and agency staff. Aquifer designations are classifications of groundwater designed to help the Environment Agency (EA) protect these resources. Aquifers within superficial deposits are used as drinking water supplies and also support surface Superficial Aquifer Designations aquatic ecosystems; the designation level reflects the importance of the aquifer in these roles. The EA groundwater protection policy was changed on 1st April 2010 to ensure consistency with the Water Framework Directive. As a result the EA and British Geological Survey (BGS) have collaborated to create a new aquifer designations map based on the BGS DiGMap-50 geology layer which constitutes this dataset. The Environment Agency (EA) issues licences to users who want to abstract more than 20 cubic metres of water per day from surface water sources such as lakes, rivers, springs or underground Water Abstractions sources. This dataset is collected under the Water Resources Act (WRA) 1963 and 1991 and is supplied already geo-coded (based on 1:50,000 mapping). This dataset contains information on authorised discharges of effluents to controlled waters, Water Industry Act regulated under the Water Industry Act. Referrals The effluent type for this dataset is restricted to 23 highly contaminative substances Areas Benefiting This dataset is derived from the Environment Agency (EA) flood map. from Flood It identifies areas that would otherwise flood in a 1% fluvial (river) or 0.5% tidal flood event, but are Defences protected by flood defences, provided that the defences do not breach. Extreme Flooding from Rivers or Sea without Defences 18 This dataset is derived from Flood Zone 2 of the Environment Agency (EA) flood map, a multi-layered product highlighting areas that could be affected by flooding. Flood Zone 2 shows the additional extent of an extreme flood from rivers or the sea. These outlying areas are likely to be affected by a major flood, with up to a 0.1% (1 in 1000) chance of occurring each year. Landmark Information Group Dataset Envirocheck® User Guide Description This dataset details the Environment Agency’s (EA) holding of Linear Flood Defences and contains all flood defences constructed during the last five years with a standard of protection equal to or better than 1% for rivers and 0.5% from the sea. Flood Defences Some additional defences, which may be older or may have been designed to provide a lower standard of protection, are also shown where the information is currently available. This layer comprises linear flood defences, for example flood embankments and walls. This dataset forms part of the Environment Agency (EA) Flood Map and indicates those areas that act as a balancing reservoir, storage basin or balancing pond. Flood Water Storage Areas Their purpose is to attenuate an incoming flood peak to a flow level that can be accepted by the downstream channel. They may also delay the timing of a flood peak so that its volume is discharged over a longer time interval. Flooding from This dataset is derived from Flood Zone 3 of the Environment Agency (EA) flood map, a multi-layered Rivers or Sea product highlighting areas that could be affected by flooding. without Flood Zone 3 shows areas of land with an annual probability of flooding of 1% (1 in 100) or greater Defences from rivers, and 0.5% (1 in 200) or greater from the sea. River Flood Data Indicative dataset depicting the liability of land to flooding. (Scotland) Only available in Scotland. This dataset relates to Environment Agency (EA) surveys undertaken every 5 years to assess watercourse quality. River Quality Chemistry, biology and nutrients for watercourses are tracked and assessed according to General Quality Assessment (GQA). River Quality Biology Sampling Points The General Quality Assessment scheme (GQA) determines the quality of watercourses in England and Wales. This dataset records biological GQA measurements for a reach of a river or a series of reaches in a single catchment. River Quality The General Quality Assessment scheme (GQA) determines the quality of watercourses in England Chemistry and Wales. This dataset records chemical GQA measurements for a reach of a river or a series of Sampling Points reaches in a single catchment. 19 Landmark Information Group Envirocheck® User Guide 5.2 Waste Data Dataset Description BGS Recorded This dataset relates to a survey of active landfill sites conducted on behalf of the Department of the Environment Landfill Sites (DoE) in 1973. Historical Landfill Sites This data was collated as part of the Environment Agency’s (EA) Historical Waste Data Project and forms the most comprehensive and consistent national dataset of all historical landfill sites known to the EA in England and Wales. Integrated Pollution This dataset contains details of permits that relate to the disposal and recovery of waste, as regulated and Control Registered licensed by the Environment Agency (EA) under the Integrated Pollution Prevention Control (IPPC) directive of the Waste Sites Environmental Protection Act (EPA) 1990. Licensed Waste This dataset contains details of environmental permits for active landfill sites, regulated by the Environment Management Agency (EA) under the Environmental Protection Act (EPA) 1990 and prescribed by the Waste Management Facilities (Landfill Boundaries)Licensing Regulations (WMLR) 1994. Licensed Waste This dataset contains details of environmental permits for active waste management sites, regulated by the Management Environment Agency (EA) under the Environmental Protection Act (EPA) 1990 and the Waste Management Facilities (Landfill Locations) Licensing Regulations (WMLR) 1994. Local Authority Recorded Landfill Sites Local Authority Landfill Coverage This dataset contains landfill records sourced from individual Local Authorities that were able to provide information on sites operating prior to the introduction of the Control of Pollution Act (COPA) in 1974. This dataset identifies the boundaries of Local Authorities who have supplied landfill data. This dataset comprises details of open and closed sites that are licensed for the disposal of waste as landfill. Registered Landfill Sites Consents are issued by the Environment Agency (EA) and the Scottish Environment Protection Agency (SEPA) under the Control of Pollution Act (COPA) 1974 and Section 36 of the Environmental Protection Act (EPA) 1990. This dataset comprises details of open and closed sites that are licensed for the transfer of waste. Consents are Registered Waste issued by the Environment Agency (EA) and the Scottish Environment Protection Agency (SEPA) under the Transfer Sites Control of Pollution Act (COPA) 1974 and Section 36 of the Environmental Protection Act (EPA) 1990. Registered Waste This dataset comprises details of open and closed sites that are licensed for waste treatment or disposal. Treatment or Consents are issued by the Environment Agency (EA) and the Scottish Environment Protection Agency (SEPA) Disposal Sites under the Control of Pollution Act (COPA) 1974 and Section 36 of the Environmental Protection Act (EPA) 1990. 20 Landmark Information Group Envirocheck® User Guide 5.3 Hazardous Substances Data Dataset Description This dataset contains details of industrial sites that use and store toxic, flammable and/or explosive substances. Control of Major Accident Hazards Sites (COMAH) Site operators are required to provide information on the nature of the hazard and action to be taken in the event of an accident. The duties under the COMAH (Control of Major Accident Hazards Regulations 1999) regulations are largely dependent on the type and quantities of substance. This dataset contains information on the location of sites involved in the manufacture and storage of explosive materials. Explosive Sites The dataset is supplied in two distinct categories, Explosive storage and manufacture sites and Explosive storage in harbour areas, as designated by the Explosives Act 1875 and 1923 (as amended) and the Dangerous Substances in Harbour Area Regulations 1987. Notification of Installations Handling Hazardous Substances This dataset contains a register of notices as designated under the Notification of Installations Handling Hazardous Substances (NIHHS) Regulations 1982, where notifiable quantities of a hazardous substance are intended to be used/handled. (NIHHS) This dataset details planning application activity related to the storage and use of hazardous substances that could present a major off-site risk. Planning Hazardous Application controls ensure that hazardous substances, as defined by the Planning (Hazardous Substance Consents Substances) Act 1990 as amended for England and Wales and the Planning (Hazardous Substances) (Scotland) Act 1997 in Scotland, can be kept or used in significant amounts after the responsible authorities have assessed any potential risk. This dataset contains notices of enforcement action carried out by local authorities relating to Planning Hazardous Substance Consents Planning Hazardous planning hazardous substance consents as determined under the Planning (Hazardous Substances) Act 1990 for England and Wales and the Planning (Hazardous Substances) (Scotland) Act 1997, in Scotland. Substance Enforcements The enforcement notices indicate where breaches of consent conditions occur and where action needs to be carried out to ensure safe storage and use of defined substances. 21 Landmark Information Group Envirocheck® User Guide 5.4 Geological Data Dataset Description This dataset was digitised from the 1:50,000 and 1:63,360 Geological Maps of England and Wales produced by the British Geological Survey (BGS). It indicates the bedrock geology of the area in general terms. BGS 1:625,000 Solid Geology Because of the generalisation and simplification used in the compilation of 1:63.360 mapping, the dataset should not be used to determine the detailed geology of any specific sites. It is best used to provide a basic understanding of the geology of the country in general, and for showing the geology of large regions where broad trends are more important than specific details. This dataset represents a compendium of digital records of boreholes and wells systematically BGS Boreholes catalogued by the British Geological Survey (BGS) for the whole of Great Britain, with records dating back to the 1860s. The British Geological Survey (BGS) Estimated Soil Chemistry dataset provides modelled estimates of ambient background concentrations of Potentially Harmful Elements (PHE) in topsoil: Arsenic (As), Cadmium (Cd), Chromium (Cr), Nickel (Ni) and Lead (Pb). BGS Estimated Soil Chemistry The data has been created by combining high resolution geochemical data (from the BGS G-BASE and Imperial College Wolfson geochemical survey database) and the soil parent material maps derived from the BGS DiGMapGB geological data and covers the whole of Great Britain (excluding London). The British Geological Survey (BGS) Estimated Urban Soil Geochemistry provides estimated BGS Estimated concentrations (mg/kg) of the following five Potentially Harmful Elements (PHE) in topsoil: Arsenic Urban Soil (As), Cadmium (Cd), Chromium (Cr), Nickel (Ni) and Lead (Pb). Chemistry These data are derived by spatial interpolation of the BGS Urban Soil Geochemistry and cover 23 UK cities. BGS Recorded This dataset comprises details of mines, quarries and mineral sites operating in England, Wales and Mineral Sites Scotland since 1993 The British Geological Survey (BGS) Urban Soil Geochemistry dataset comprises the location and BGS Urban Soil concentration (mg/kg) of the following five Potentially Harmful Elements (PHE) in topsoil: Arsenic Chemistry (As), Cadmium (Cd), Chromium (Cr), Nickel (Ni) and Lead (Pb). These concentrations were measured in topsoil samples taken by the BGS in 23 UK cities. The British Geological Survey (BGS) Urban Soil Geochemistry Averages dataset provides per city average, minimum and maximum concentrations (mg/kg) of the following five Potentially Harmful BGS Urban Soil Elements (PHE) in topsoil: Arsenic (As), Cadmium (Cd), Chromium (Cr), Nickel (Ni) and Lead (Pb). Chemistry Averages Each value is calculated from measured topsoil samples taken by the BGS in 23 UK cities and is intended to provide context to the BGS Urban Soil Geochemistry data. 22 Landmark Information Group Dataset Envirocheck® User Guide Description This dataset covers an area in Cheshire and Greater Manchester that was set out in the Brine Brine Compensation Areas Pumping (Compensation for Subsidence) Act (1891) and the Cheshire Brine Pumping (Compensation for Subsidence) Act (1952). The area outlined in these acts was deemed to be liable to subside as a result of the salt industry. Any damages as a consequence of these activities are eligible for compensation. Coal Mining Affected Areas Drift Deposits Man Made Mining Cavities This dataset is made up of 1km polygon areas which may be affected by coal mining activity. This dataset provides indicative information regarding the presence of drift deposits based on the British Geological Survey (BGS) 1:625,000 scale geology maps. This dataset contains information on cavities produced by mining activity in the past for the extraction of chalk, flint and other minerals. The dataset refers to a distinct list of mined materials. This dataset is based on the findings of a report commissioned by the former Department of the Environment (DoE) and produced by Ove Arup and Partners. The main objective of the data is to Mining Instability indicate where mining should be borne in mind when considering planning and development of land. The data covers five types of mining activity: Coal, Evaporites, Iron Ore, Metalliferous and Rock. Results can either be conclusive or inconclusive, depending on the evidence available during the survey period. This dataset contains details of naturally formed cavities as produced by the processes of dissolution, Natural Cavities cambering, marine erosion and other processes. The ‘other processes’ include a variety of cavity forms such as soil piping, scour hollows, fault movement and erosion of natural discontinuities in rocks by the action of water. This dataset describes areas with different degrees of potential for the existence of underground working resulting from non-coal mining activities. They are based on a combination of geological factors relating to the known and suspected locations of workings. Non-Coal Mining Areas of Great Britain This dataset does not include mining from coal; coal mining is specifically excluded from this dataset. The polygon outlines are derived from British Geological Survey (BGS) 1:50,000 scale DiGMapGB data, plus additional information derived from expert knowledge and literature to define areas of potential hazard from past underground mining activity. This data does not describe an assessment of mining instability, nor does it attempt to classify a risk of instability. Potential for Collapsible Ground Stability Hazards 23 This dataset constitutes one element of the British Geological Survey’s (BGS) Geosure data that aims to provide detailed ground stability information. Collapsible ground occurs when certain types of ground, that have an open porous structure with large pore spaces, collapse when too great a load is placed on them or when they become saturated when a lesser load is applied. Landmark Information Group Dataset Potential for Compressible Ground Stability Hazards Envirocheck® User Guide Description This dataset constitutes one element of the British Geological Survey’s (BGS) Geosure data that aims to provide detailed ground stability information. Certain types of ground, such as that developed beneath river plains, can contain very soft layers or pockets. These can compress under the weight of overlying structures, such as buildings, resulting in progressive depression of the ground and disturbance of foundations. This dataset constitutes one element of the British Geological Survey’s (BGS) Geosure data that Potential for Ground aims to provide detailed ground stability information. Ground dissolution occurs when certain types of Dissolution Stability bedrock contain layers of material that can dissolve within the ground water. This can cause Hazards underground cavities to develop that, with time, can reach the surface and cause significant ground movement, such as the development of collapse hollows that can directly impinge on buildings. This dataset constitutes one element of the British Geological Survey’s (BGS) Geosure data that Potential for Landslide Ground Stability Hazards aims to provide detailed ground stability information. The potential for slope instability occurs due to particular types of slope becoming unstable under certain circumstances, causing down-slope movement of the ground and disruption to buildings. A combination of factors, including, amongst others, the rock type, the presence of excess water (natural or relating to man-made activity), the angle of the slope, and construction work, for example, cuttings or embankments, can all contribute. This dataset constitutes one element of the British Geological Survey’s (BGS) geosure data that aims Potential for to provide detailed ground stability information. Running sand occurs when loosely-packed sand Running Sand flows (runs) because water flowing through the spaces between the grains reduces the contact Ground Stability between the grains and they are swept along in the flowing water. This may happen where springs Hazards occur at the base of sand outcrops, where excavations in sand go below the water table, around leaking drains or water pipes. Potential for Shrinking or Swelling Clay Ground Stability Hazards This dataset constitutes one element of the British Geological Survey’s (BGS) Geosure data that aims to provide detailed ground stability information. Shrinking or swelling clay can change volume due to variation in ground moisture. This can cause ground movement, particularly in the upper 2 metres of the ground, which may affect foundations. Ground moisture variations can be related to a number of factors, including weather variations (annual or longer term), vegetation effects (particularly growth or removal of trees) and man-made activity. This dataset, created jointly by the Health Protection Agency (HPA) and the British Geological Survey (BGS), provides the current definitive map of Radon Affected Areas in England, Scotland and Wales. The dataset allows an estimate to be made of the probability that an individual property in England Radon Potential and Wales is at, or above, the Action Level for radon. It also contains information relating to which protection measures are required, if applicable. The raw data is created using a combination of detailed geological mapping from the BGS and longterm radon measurements conducted on individual properties by the HPA. 24 Landmark Information Group Envirocheck® User Guide 5.5 Industrial Land Use Data Dataset Contemporary Trade Directory Description This dataset contains current and historic features from the Thomson Business directory that are considered potentially contaminative. Entries This dataset contains records held on the Catalist fuel database, which provides the location of petrol Fuel Station Entries stations, diesel stations, hypermarkets etc. throughout Great Britain. The dataset includes information on the status of the site; whether it is active or obsolete, and the brand of petrol sold. 5.6 Sensitive Land Use Data Dataset Description Green belt is an area of principally open countryside surrounding existing built-up areas, the purpose of which is to check the unrestricted sprawl of the built-up area and to safeguard the surrounding countryside against further encroachment. Areas of Adopted Green Belt The general principle of green belt is a provision against further development. Areas of Adopted Green Belt are extracted from Local Plans and Local Development Plans which have completed the adoption process. The associated dataset Areas of Unadopted Green Belt is extracted from Plans where the adoption process is in progress. This dataset contains areas designated as Areas of Outstanding Natural Beauty (AONB) under the Areas of National Parks and Access to the Countryside Act 1949. Outstanding Natural Beauty (AONB) These areas are landscapes of national conservation importance for their distinctive character and natural beauty. They are generally smaller than National Parks, and are owned by individuals e.g. farmers. Green belt is an area of principally open countryside surrounding existing built-up areas, the purpose of which is to check the unrestricted sprawl of the built-up area and to safeguard the surrounding countryside against further encroachment. Areas of Unadopted Green Belt The general principle of green belt is a provision against further development. Areas of Unadopted Green Belt are extracted from Local Plans and Local Development Plans where the adoption process is still in progress. The associated dataset Adopted Green Belt is extracted from Plans which have completed the adoption process. Environmentally This dataset details areas designated by the Secretary of State under Section 18 of the Agriculture Sensitive Areas Act 1986 to encourage landowners to manage land to safeguard and enhance nature conservation, (ESA) landscape and cultural interest. 25 Landmark Information Group Dataset Envirocheck® User Guide Description This dataset is supplied by the Forestry Commission and identifies Forest Parks within the UK. These Forest Parks areas have various designations dependent on recreational, conservation and scenic interest. This dataset details the location of Local Nature Reserves (LNR). These reserves have been Local Nature Reserves (LNR) designated under the National Parks and Access to the Countryside Act 1949, Section 21, as areas of local importance for nature conservation This dataset contains details of Marine Nature Reserves (MNR). These reserves have been Marine Nature Reserves (MNR) designated under the Wildlife and Countryside Act 1981, Sections 36 and 37, to conserve inter-tidal and shallow-sea ecosystems and coastal features. This dataset contains details of National Nature Reserves (NNR). These reserves have been National Nature designated under the Wildlife and Countryside Act 1981 or the National Parks and Access to the Reserves (NNR) Countryside Act 1949, Section 19, as areas of high national or international importance for nature conservation. This dataset contains details of National Park boundaries. Established under the National Parks and National Parks Access to the Countryside Act 1949, their aim is to provide protection for the countryside and associated ways of life found within them. National Scenic Areas These areas are Scotland’s only national landscape designation and are the equivalent to Areas of (NSA) Outstanding Natural Beauty (AONB) in England and Wales. The Nitrate Sensitive Areas (NSA) scheme was a package of measures introduced under the European Community Agri-Environment Regulations 1994. Nitrate Sensitive Areas (NSA) These are areas where nitrate levels in public drinking water sources exceed, or are at risk of exceeding 50 milligrams per litre and, therefore, areas where nitrate levels in the fluvial environment need to remain at acceptable levels. Designated for the purposes of the European Community (EC) Nitrate Directive (91/676/EEC) Nitrate Nitrate Vulnerability Zones (NVZ) Vulnerability Zones (NVZ) are catchments where nitrate concentrations in sources of public drinking water exceed, or are likely to exceed, the EC limit of 50 milligrams per litre. This dataset details the location of wetlands as designated by the Convention on Wetlands of Ramsar Sites International Importance, signed in Ramsar, Iran in 1971 and ratified by the UK Government in 1976. Sites of Special This dataset contains details of Sites of Special Scientific Interest (SSSI). These sites have been Scientific Interest designated under the Wildlife and Countryside Act 1981 Section 28 to protect areas of important (SSSI) flora, fauna, geological and/or physiographical features. 26 Landmark Information Group Dataset Envirocheck® User Guide Description Special Areas of Conservation (SAC) are designated under the European Economic Community Special Areas of Conservation (SAC) (EEC) Directive on the Conservation of Natural Habitats and Wild Fauna and Flora (92/43/EEC), commonly known as the Habitats and Species Directive. Special Protection Special Protection Areas (SPA) are classified under Article 4 of the European Commission (EC) Areas (SPA) Directive on the Conservation of Wild Birds 1979, commonly known as the Wild Birds Directive. 27 Landmark Information Group Envirocheck® User Guide 5.7 Background/Context Mapping used in Envirocheck Ordnance Survey MasterMap® Topography Layer MasterMap® is a large-scale digital database of Great Britain’s landscape including individual buildings, roads and areas of land. It is continually revised by the OS on a 6-weekly update cycle to capture changes in the natural and built environment. MasterMap® Topography Layer is produced at 1:1,250 scale in urban areas, 1:2,500 in rural areas and at 1:10,000 in moorland and upland areas. The MasterMap® Topography layer is included as background mapping in the Site Sensitivity Map Segment in the Premium Envirocheck product and is always plotted at 1:2,500 scale. Ordnance Survey VectorMap® Local VectorMap® Local is a digital vector mapping product for the whole of Great Britain that is designed to be customised to suit users’ requirements. It is revised by the OS on a quarterly update cycle. The current edition of VectorMap® Local is included as background mapping in the Site Sensitivity Map Segment in the Essential Envirocheck product and is plotted at 1:2,500 scale. Ordnance Survey Street View® Street View® is a generalised and simplified street-level map for the whole of Great Britain. It is revised by the OS on a 6-monthly update cycle. The current edition of Street View® is included as background mapping in the Site Sensitivity Map Slice in all Envirocheck products and is plotted at 1:10,000 scale. Ordnance Survey 1:50,000 Colour Raster Mapping 1:50,000 Colour Raster Mapping (CRM) provides national coverage of Great Britain and mirrors Ordnance Survey’s Landranger® map series. It is revised annually by the OS. The current edition of Ordnance Survey 1:50,000 Colour Raster Mapping is included as background mapping in the Context Map in all Envirocheck Products and is plotted at 1:25,000 scale. 28 Landmark Information Group Envirocheck® User Guide 5.8 Datasets Contained in the Historical Maps and Aerial Imagery Ordnance Survey County Series Historical Mapping (1:2,500 & 1:10,560) The County Series mapping was the first attempt by the Ordnance Survey to systematically survey and map the whole of England, Scotland and Wales at a consistent scale. Each county, or groups of counties, were surveyed independently using the Cassini Projection and updated over the course of several editions and revisions. Early editions were mapped at 1:10,560 scale (6 inches to 1 mile) but by 1854 a scale of 1:2,500 was adopted for cultivated rural and urban areas, with the 6 inch scale remaining the largest scale at which uncultivated areas were mapped. In the late 1940’s a Provisional Edition was produced with all military camps and other strategic sites removed. The 1:10,560 County Series maps were revised and re-plotted as 1:10,000 National Grid maps from circa 1948 until they were completely superseded by maps that were surveyed and plotted entirely using the National Grid. Ordnance Survey County Series Town Plans (various scales) A number of towns and cities were mapped by the Ordnance Survey at scales larger than 1:2,500. Town Plans are available at scales of 1:500, 1:528, 1:1,056, 1:2,640 and 1:5,280; however the 1:5,280 scale mapping covers London only. In most cases these maps were surveyed using the Cassini Projection but some were surveyed independently and follow their own local projection system. Historical Building Plans (1:500) Envirocheck Historical Building Plans give access to over 10,000 plans, primarily at 1:500 scale, that have been scanned and geo-referenced by Landmark. They were produced by the London based firm Charles E. Goad Limited as fire insurance plans. Dating from 1886 to 1970, they cover 54 major UK towns and cities. The plans identify the occupants of buildings with very detailed information including building materials, industrial building uses, on site tanks, engines, stores and asbestos. This product is available where any Historical Building Plan intersects with the site. The plans are supplied as gif images, which extend out to 100m beyond the site boundary. A single order may have several plans that intersect the site and each plan extract will be supplied as a separate gif image. Ordnance Survey National Grid Historical Mapping (1:2,500 & 1:10,000) The National Grid was introduced as a single reference system for maps of the whole country, as opposed to the individual County Series maps that had previously been used. The National Grid is a metric grid system based on the Transverse Mercator projection and maps using this system were first published from 1948 at scales of 1:2,500 and 1:10,000. National Grid maps were also published at a scale of 1:1,250 in built up areas. Gradually the National Grid printed maps were phased out with the introduction of large scale digital mapping. 29 Landmark Information Group Envirocheck® User Guide Ordnance Survey SIMs (Survey of Information on Microfilm) (1:1,250 & 1:2,500) The SIM cards (Survey of Information on Microfilm) are further editions of mapping which were produced and published in between the main editions as an area was updated. They date from 1947 to 1994, and contain detailed information on buildings, roads and land-use. These maps were produced at both 1:2,500 and 1:1,250 scales. Ordnance Survey SUSI (Supply of Unpublished Survey Information) (1:1,250 & 1:2,500) The SUSI (Supply of Unpublished Survey Information) maps were produced between 1972 and 1977, mainly for internal use at Ordnance Survey. These were more of a `work-in-progress’ plan as they showed updates of individual areas on a map. These maps were unpublished, and they do not represent a single moment in time. These maps were produced at both 1:2,500 and 1:1,250 scales. Ordnance Survey Large-Scale National Grid Data (Superplans) (1:1,250 & 1:2,500) Superplans superseded SIM cards in 1992, and continued to be produced until 1999. These maps were the forerunners of digital mapping and so provide detailed information on houses and roads, but tend to show less topographic features such as vegetation. These maps were produced at both 1:2,500 and 1:1,250 scales. Russian Military Mapping These maps were produced by the Russian military during the Cold War and cover 103 towns and cities throughout the U.K. The maps were produced at 1:25,000, 1:10,000 and 1:5,000 scale and show detailed land use, including strategic military sites and transport hubs, with a numbered key describing their use in more detail. They were produced by the Russians for the benefit of navigation if they were to have invaded the U.K. The detailed information contained in these maps indicates that they were created using information from contemporary mapping sources, as well as ground-based surveying personnel. All Russian Military Maps are reproduced at 1:10,000 scale. Ordnance Survey 1:10,000 Colour Raster Mapping Raster mapping comprises a series of digital image files that can be printed like traditional maps or used electronically using Geographical Information Systems (GIS) and software. The 1:10,000 Colour Raster Mapping (CRM) is the Ordnance Survey’s most detailed raster mapping product and has been produced from 1995 to the present day. Selected historical editions of the 1:10,000 Colour Raster Mapping are included as part of the Historical Maps and Aerial Imagery Section of the Envirocheck report. 30 Landmark Information Group Envirocheck® User Guide Ordnance Survey Historical Aerial Photography (1:1,250 & 1:10,560) Historical Aerial Photos were produced by the Ordnance Survey at a scale of 1:1,250 and 1:10,560 from Royal Air Force photography. They were produced between 1944 and 1951 as an interim measure, pending preparation of conventional mapping, due to post war resource shortages. The original editions were withdrawn and only made available again after a period of fifty years. Security measures in the 1950’s meant that every photograph was re-checked for potentially unsafe information with security sites replaced by fake fields or clouds. Because of the accuracy of this editing, without viewing both revisions it is not easy to spot the edits. Where available, both revisions are included in the Historical Maps and Aerial Imagery Section of the Envirocheck report. 31 Landmark Information Group Envirocheck® User Guide 6. Other Envirocheck Services Envirocheck also offers a wide range of specialist services to assist environmental professionals with a full service of comprehensive, accurate and high quality environmental information to aid site assessments. These services are highlighted below; full details can be found on www.envirocheck.co.uk 6.1 Envirocheck Analysis Desktop and Envirocheck Analysis mobile app Envirocheck Analysis is a smart online application designed to considerably improve and simplify your historical map and environmental data analysis as part of the site assessment process. Envirocheck Analysis enables you to assess and analyse our extensive archive of Envirocheck historical maps and environmental data faster and more accurately than ever before, ultimately delivering more enhanced reports to your client, faster. The Envirocheck Analysis mobile app, used in conjunction with the Envirocheck Report and Envirocheck Analysis, is specifically designed to seamlessly connect and streamline all your Phase 1 activities – from desktop review, to site walkover and back again. The Envirocheck analysis mobile app enables you to: Geo-locate notes, photos, videos and audio recordings while conducting your site walkovers, without the need for 3G or Wi-Fi. At just the click of a button, securely send information back into your Envirocheck Analysis desktop to be viewed alongside all your mapping (historical and current) and environmental data. Hold everything you need in one place to feed content directly into your client report. For more information visit http://www.envirocheckanalysis.co.uk or call 0844 844 9952 6.2 Envirocheck Export Envirocheck Export is an innovative online service providing fast and flexible access to Landmark’s extensive collection of mapping and geospatial data. Landmark understands that large or complex projects require the flexibility and functionality that only digital formats can offer and Envirocheck Export offers the means to access and download digital data ready for use in GIS and CAD systems. 6.3 Flood Screening Report The Envirocheck Flood Screening Report is aimed at Flood Risk Assessments and contains flooding information from several sources including the Environment Agency, JBA Risk Management Ltd, Environmental Simulations International (ESI) and the British Geological Survey. Each Envirocheck Flood Screening report contains a datasheet providing full descriptions of the information in the report and pack of maps at 1:10,000 and 1:50,000 showing spatial representation of the data at first glance. Envirocheck Flood Screening Report is your one stop shop for flood risk assessments, covering the leading flood information source that is easy to read and comprehensive in nature. 32 Landmark Information Group Envirocheck® User Guide 6.4 Mining and Ground Stability The Mining and Ground Stability Report provides an accurate picture of ground stability issues surrounding a site. This report contains MotionMap data which gives a precise picture of historical subsidence, heave or potential seismic activity. The Envirocheck Mining and Ground Stability report includes 1.8 million features relating to mining and ground stability from Landmark's unrivalled Historical Land Use database, with access to private archives including Wardell Armstrong brine pumping data for Staffordshire and Droitwich, Brine Compensation Areas and Potential non coal mining areas. 6.5 Site Location Plans Site Location Plans are high quality, site-centred location plans designed specifically to aid consultants in the production of desk studies. The report provides three maps which clearly identify your site. Site Location Plans are available for two site sizes: 0-15 hectares 15 hectares or greater 6.6 Envirocheck Historical Data Report The Envirocheck Historical Data Report includes data captured from Landmark’s comprehensive archive of Historical Maps and Historical Building Plans. This report identifies Potentially Contaminative Industrial Land Uses, Potentially Infilled Land, Historical Tanks and Energy Facilities, as well as Areas Cleared due to Enemy Action (potential bomb damage) and Potentially Contaminative Features from Historical Building Plans (including asbestos). 6.7 Envirocheck 10k Geology Report The Envirocheck Geology report contains geological map extracts taken from the BGS Digital Geological Map of Great Britain at 1:10,000 scale. It includes four A3 maps showing the following geological layers: Artificial Ground and Landslip Superficial Geology Bedrock and Faults Combined ‘Surface Geology’ Map 33 Landmark Information Group Envirocheck® User Guide 6.8 Envirocheck 50k Geology Report The Envirocheck Geology report contains geological map extracts taken from the BGS Digital Geological Map of Great Britain at 1:50,000 scale. It includes four A4 maps showing the following geological layers: Artificial Ground and Landslip Superficial Geology Bedrock and Faults Combined ‘Surface Geology’ Map 6.9 Envirocheck Utilities Report The Envirocheck Utilities Report provides valuable information which consultants and engineers should obtain before any excavations, designs or developments commence as it will help reduce the risk of: Expensive litigation if damage is caused Delayed project design Increased foundation costs Added danger for the workforce involved The report outlines sub-surface features such as gas and oil pipelines, electricity cables, telecommunication wires, mains water supplies, sewers and fibre-optic cables. 6.10 Bomb Search Bomb Search will help you determine the risk of Unexploded Ordinance (UXO) on your site. Available as either a Preliminary or a Detailed UXO Risk Assessment, Bomb Search analyses over 40 different datasets from a nationwide geospatial database of UXO threats. Risk Assessments are provided by 6 Alpha, who are renowned experts in the field of UXO and are independent consultants, with no vested interest in follow-on contracting work. The reports conform to current best practice developed and recommended by CIRIA and endorsed by the HSE. 6.11 Coal Authority and Brine Report The Coal Authority Coal Mining and Brine report identifies the environmental and stability risk arising from any past, current and future underground and surface coal mining activity that affects a property. This includes subsidence claims, reported hazards and mine gas emissions. This report also includes information from the Cheshire Brine Subsidence Compensation Board (CBSCB), identifying if the property has been the subject of a claim for subsidence damage caused by brine extraction. This report covers the area of your digitised site only. 34 Landmark Information Group Envirocheck® User Guide 6.12 Cranfield Full Soil Report The Soils Site Report, produced by Cranfield University’s National Soil Resources Institute, identifies and describes the properties and capacities of the soil at your specified location as recorded in the National Soil Map for England and Wales. The National Soil Map represents the most accurate and comprehensive source of information about the soil at national coverage. It maps the distribution of soil mapping units (termed Soil Associations) which are defined in terms of the main soil types (or Soil Series) that were recorded for each Soil Association during field soil surveys. Each of these Soil Associations have differing environmental characteristics (physical, chemical and biological) and it is by mapping these properties that the range of thematic maps in this report have been produced. 6.13 Bluesky Old Aerial Photography Bluesky’s Old Aerial Photo (OAP) archive is a unique archive of over a million historical aerial images ranging from 1917 to 2004. Sourced from a number of disparate archives, the OAP collection is the largest commercial archive in the UK. 35 Landmark Information Group Envirocheck® User Guide Appendix 1 – The National Grid The National Grid provides a unique reference system that can be used to locate the easting and northing coordinates of any point in Great Britain. All references in the Envirocheck report are given as six figure numeric National Grid References (NGR) e.g. 393200,224400. More information on the National Grid is available from the Ordnance Survey: http://www.ordnancesurvey.co.uk/oswebsite/gps/information/coordinatesystemsinfo/guidetonationalgri d/index.html 36 Landmark Information Group Envirocheck® User Guide Appendix 2 – Paper Map Copying Licence Why do you need a Paper Map Copying Licence? Landmark and the Ordnance Survey work together to ensure that mapping is protected under Crown copyright by virtue of the Copyright, Designs and Patents Act 1988. Copying of mapping can only be authorised under the appropriate copyright licenses which are dependent upon the intended use. Organisations traditionally used to obtain a Licence to Copy which allowed them to produce a certain number of copies of Landmark report products; this has now been superseded by a more comprehensive Paper Map Copying Licence (PMCL) enabling the customer to make un-restricted multiple copies of mapping in paper or electronic form. It is purchased on a per office basis and covers all copying of OS maps by that office irrespective of the number of copies. Purchasing a PMCL will allow you to: Copy unlimited amounts of original Ordnance Survey mapping to support your day-to-day administration and operations. Make copies of mapping in either paper or electronic form – although electronic copies are subject to some specific rules (as set out in Terms and Conditions). Include copies of mapping in leaflets, brochures and display on web pages, subject to the rules set out in the license. Use copies of mapping as part of a professional service, subject to the rules set out in the license. Copy all Ordnance Survey mapping in all offices where that business operates, subject to the applicable fee payable for the number of offices. Copy mapping based on Ordnance Survey mapping produced by another publisher, subject to obtaining permission to copy the mapping involved directly from that publisher. How to order a PMCL? Envirocheck customers are able to purchase a PMCL directly through the Product Offers section of Envirocheck.co.uk. If you do not have a PMCL to cover the mapping you require you will be prompted to obtain a valid version before you will be able to progress to the final stages of your order. How much does a PMCL cost? Licences are purchased on a per office basis and cover all copying of OS maps by that office irrespective of the number of copies. The licence cost can be calculated using the table below: The cost of a PMCL for more than 5 offices should be calculated cumulatively. A working example is shown below to reflect the calculation process for 8 offices: 37 One office = (1 x £54.75) = £54.75 Three offices (3 x £54.75) = £164.25 Two offices = (2 x £54.75) = £109.50 Eight offices = (5 x £54.75) + (3 x £53.25) = £433.50 Landmark Information Group 38 Envirocheck® User Guide