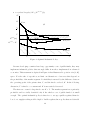
1
Infrastructure and Public Utilities Privatization in Developing Countries Emmanuelle Auriol∗ and Pierre M. Picard† Abstract Should governments in developing countries promote private ownership and deregulated prices in non-competitive sectors? Or should they run publicly owned firms and regulate prices at the expense of rents to insiders? We develop a theoretical model to answer these questions which are normative. The analysis focuses on the governments’ trade-off between fiscal benefits and consumer surplus in the privatization reforms that occurred in non-competitive sectors. Under privatization, the control rights are transferred to private interests and public subsidies are eliminated. This benefit for tax-payers comes at the cost of a price rise for consumers. We show that, in developing countries where budget constraints are tight, privatization and price liberalization may be optimal for low profitability industries. However for more profitable industries, privatization and price liberalization are suboptimal. Finally, once a market gives room for more than one firm, governments prefer to regulate the industry. In the absence of a credible regulatory agency, regulation is achieved through public ownership. ∗ † Emmanuelle Auriol: Toulouse School of Economics, ARQADE and IDEI. E-mail: [email protected] Pierre M. Picard: SoSS, University of Manchester and CORE, Universit´e catholique de Louvain. E-mail: [email protected] 1 1 Introduction Over the last 25 years low-income countries have drastically reduced their share of state ownership.1 In most cases, governments have privatized public assets because of critical budgetary conditions. While international financial organizations, like the World Bank or the IMF, made privatization programs a condition for economic assistance during the 1980s debt crisis, governments have been keen on using privatization proceeds to relax their budget constraints.2 The fiscal benefits of privatization are not limited to the divesture proceeds of state owned enterprises (S0E), which has been estimated around $50 billion per year in non-OECD countries (Mahboobi, 2000; Gibbon, 1998, 2000). They also encompass the possible termination of recurrent, inefficient subsidies to the latter. The paper studies the impact of macroeconomic fiscal balancing objectives on the privatization decision in regard to infrastructure and public utilities in low-income countries. Privatization brings well-known economic costs when industries are characterized by strong economies of scale. Infrastructure and utilities owners benefit from market power. By giving up the direct control of firms’ operations, governments lose control over prices to the disadvantage of consumers. In theory this could be avoided by auctioning off markets on the basis of the lowest product/service price (see Estache, Foster and Wodon 2002). However Guasch (2003) shows in a survey of 600 concession contracts from around the world that, in practice, the contracts are tendered for the highest transfer or annual fee. Because fee payments rise with the profitability of the privatized firms, many governments choose policies that increase the firms’ profitability such as exclusivity periods and price liberalization.3 Prices are sometimes increased ahead of privatization in order to reduce 1 2 Megginson and Netter (2001) estimate that between 1980 and 1996 it went from 16% to 8% of GDP. Using a panel of 18 developing countries, Davis et al. (2000) show that budgetary privatization proceeds have been used to reduce domestic financing on a roughly one-for-one basis. 3 Wallsten (2001) studies the impact of the exclusivity period on the privatization price of twenty telecommunication firms in fifteen developing countries. Two thirds of the countries chose to allocate exclusivity periods for an average of 7.42 years. Exclusivity more than double the price private investors 2 the SOE financing gaps and attract buyers. This has been for instance the case in Zimbabwe, Kenya and Senegal, where governments increased electricity prices by 10 % after reaching an agreement with Vivendi Universal (see AfDB-OECD 2003). An unaccounted part of price increases stems from the termination of illegal connections (Birdsall and Nellis 2002, Estache, Foster and Wodon 2002, AfDB-OECD 2003). The present paper studies the privatization decision as the result of the government’s cost-benefit analysis. The social benefit obtained from the cash-flows generated by the public firms’ divesture and from the termination of subsidies to unprofitable public firms are balanced against the loss in consumer surplus induced by the higher prices in privatized industries and the foregone revenues from profitable public firms. Since our model is static, it is not designed to study the transition regime between public and private ownership. It compares social welfare under private and public ownership in industries/market segments where some investments need to be sunk. To get clear-cut results privatization corresponds to a case where ownership is private and prices are free. It is close but not equivalent to laissez-faire because entry remains regulated (i.e. through license and entry fees). Public ownership corresponds to a case where entry and prices are regulated. This approach is robust from a theoretical point of view. Indeed if, as we show, privatization with laissez-faire dominates state ownership with benevolent regulation, privatization also dominates in situations where prices are liberalized to a lesser extent and regulation is not benevolent.4 The dominance of privatization over benevolent regulation is not obvious. Indeed, the deadweight loss created by monopoly pricing is the rationale for setting up public ownership in the first place. Under perfect information, governments are able to mimic pay for the firm, but comes at the cost of high prices and lower network growth for consumers. 4 Developing countries have generally failed to establish credible regulatory bodies because of governments’ inability to commit. For instance, the concessions granted to private operators following the divestiture of Latin America public firms were renegotiated after an average 2.1 years only (Laffont 2001). See also Guash (2004). 3 the outcomes of private monopolies so that privatization is never optimal. However, under asymmetric information between governments and firms, privatization may dominate public ownership because the presence of information rents makes subsidies socially more costly. In the paper, a main factor in privatization decisions is the opportunity cost of public funds, which captures the tightness of government budget constraint. We show that the privatization decision is a monotone function of this opportunity cost of public funds when the profitability of a market is low, as it is for instance the case of infrastructure such as roads or of utilities service to the poor. For low opportunity costs (i.e. for wealthy governments) public ownership dominates privatization, whereas the reverse holds for large opportunity costs (i.e. for financially strapped governments). To illustrate this result consider the specific case where the government cannot finance an infrastructure project (e.g., a water distribution network in a poor neighborhood). Privatization is an appealing alternative as it is better to have a privately owned and operated infrastructure, even with monopoly distortion, than no infrastructure at all. By continuity the result still holds when the government is able to finance the infrastructure. Nevertheless, the above monotonic relationship between privatization and tightness of budget constraint breaks down when natural monopolies are sufficiently profitable and when governments are not able to recoup large enough franchise fees or divestiture proceeds. Such situations often stem from the difficulty met by developing countries to attract investors when they auction off profitable SOEs.5 We show that, with underpriced public assets, the privatization decision is optimal only for intermediate values of the opportunity cost of public funds. The intuition goes as it follows: as before, when opportunity cost of public funds is small, the bailouts of firms by governments are cheap and it is optimal to keep firms public, to set prices close to marginal costs and to subsidize the 5 According to Trujillo, Quinet and Estache (2002), there exist rarely more than two bidders who participate in developing countries’ auctions for major concession contracts. Therefore, SOEs are often sold at a discount to avoid the embarrassment of unsuccessful sales (see Birdsall and Nellis 2002). 4 firms to guarantee a break-even situation. For intermediate value of the opportunity cost of public funds, bailout becomes costly and governments prefer to privatize the public firms, cash the divesture proceeds and let private entrepreneurs manage firms. Yet, for high enough opportunity costs of public funds, the privatization decisions differ as government finds it valuable to ‘hold-up’ on industries’ rents. Government does not privatize profitable segments; it prefers to operate them, and to set private monopoly prices to reap maximal revenues. This non-monotonicity result has potentially important policy implications. That is, while divestiture of profitable public firms may be optimal in advanced economies, it is not necessarily so in developing countries where budget constraints are tight and market institutions are weak. More specifically, the model suggests that public utilities in developing countries should focus on market segments where incomes and willingness to pay are high. They also should set prices high so that the government can used the public firms’ profit to subsidize new connections or other public goods. Finally, when firms’ profitability substantially rises, the market leaves room for more than one firm. We show that, for large, profitable markets, regulation of duopoly always dominates privatization with price liberalization. Market liberalization hence corresponds to the divestiture of a historical monopoly and the introduction of new entrants according to a regulatory scheme. It does not correspond to laissez-faire. This is a major concern in developing countries because they usually lack the human resources and the institutions to implement an effective regulation. 1.1 Relationship with the literature It is well-known that public ownership generates inefficiencies because it encourages governments to bail out or subsidize money-losing firms. Such inefficiencies were first coined by Kornai (1980) as the ‘soft budget constraint’ problem. This problem explains many inefficiencies occurring in socialist economies such as shortages or low price responsiveness.6 6 Interesting surveys are available in Kornai (2000) and Kornai, Maskin and Roland (2002). 5 Since less efficient firms are allowed to rely on government funding, they lack the financial discipline required for efficient management. For instance, under contract incompleteness, soft-budget constraints affect the level of investments made by public managers. By hardening the firm’s budget constraint, privatization helps restore investment incentives. The transfer of public to private ownership is therefore often advocated as a remedy for the poor economic performance of public enterprises (see for instance Dewatripont and Maskin (1995), Schmidt (1996) and Maskin (1999)). Another concern about public ownership is the governments’ lack of economic orientation. For instance in Kornai and Weibull (1983), Shleifer and Vishny (1997), Debande and Friebel (2003), governments demonstrate ‘paternalistic’ or political behaviors as they seek to protect employment; in Shapiro and Willig (1990), governments are malevolent. The main conclusion of the above two strands of literature is that privatization improves the internal efficiency of firms. Megginston and Netter (2001) in a literature review covering 65 empirical studies at the firm level confirm that private firms are generally more productive and more profitable than their public counterparts. However, in increasing returns to scale industries, the efficiency gains are not automatically passed along to consumers.7 Changing the ownership structure does not solve the problem of lack of competitive pressure (see Nellis 1999). The present paper belongs to the traditional literature on regulation with adverse selection (see Laffont and Tirole 1993). It ignores the moral hazard issue that is discussed at length in the aforementioned papers about soft budget constraint, to focus on allocative efficiency and macro-fiscal balancing issues. A utilitarian government maximizes a weighted sum of consumer surplus and transfers from/to firms. The weight on transfers is the opportunity cost of public funds. As it is standard in the regulation literature we assume that the government is able to commit and to offer complete contracts so that 7 Estache (2002) shows that technical/productive efficiency gains generated by Argentina’s 1990s util- ities privatization have not been transmitted to consumers. The benefits were captured by the industry because of inefficient regulation. 6 private or public ownership is irrelevant.8 The paper hence draws the line between public and private ownership as the choice between regulated public firms and unregulated private ones. Since the government is residual claimant of the public firms’ profit and loss, and since it wants to avoid the threat of service interruption, under asymmetric information money loosing firms are subsidized while more productive firms earn informational rents. Production is distorted to reduce these information costs which in turn diminishes consumer surplus. Privatization reduces the need to subsidize low profitability firms and to distort their production below the monopoly level (due to the adverse selection problem). Privatization is used for projects that have low profitability or low social benefits. To avoid the technicality of an additional principal agent problem, the private owner is assumed to be the firm’s manager. The welfare comparison is hence between a benevolently regulated firm and a private monopoly charging the standard monopoly price. Finally our model can be related to the theory of public-private partnerships (PPP) that has deserved a recent attention in national and international funding institutions (see Vaillancourt Rosenau 2000, IMF 2004). The idea behind PPP is to make governments purchase the service rather than the asset that is associated to the provision of a public good or of a good for which there is a potential market failure. On the one hand, PPPs are seen by governments as a vehicle to shift investment costs out their books and/or safeguard the execution of projects that would otherwise hardly materialize given their budget constraints. On the other hand, PPPs are praised for their potential benefits in terms of productive efficiency.9 As we rule out the possible productivity inefficiencies to focus on 8 When government is able to offer the same contracts to public and to private firms, as in Baron- Myerson (1982) and in Laffont-Tirole (1986), or in the form of bribes to private firms as in Kornai (2001), both structures have the same degree of contract completeness so ownership is irrelevant. 9 Public-private partnerships (PPP) can be used to harden the firms’ budget constraints as we discussed earlier and can be used to bundle complementary tasks such as the construction and the operation of infrastructure projects (see Hart 2003, Martimort and Pouyet 2006). 7 the allocative inefficiencies, it is therefore no surprise that the benefits of privatization are aligned to this first view that emphasizes the fiscal benefits of privatization. The paper is organized as follows. Section 2 presents the model and the main assumptions. Section 3 compares the performance of private and regulated monopolies while Section 4 briefly discusses the duopoly case. Section 5 derives the optimal industrial policy. Section 6 summarizes our results and offers some concluding remarks. For the sake of conciseness, all proofs are set out in an Appendix that is made available on the website of the World Bank Economic Review. 2 The model The government has to decide whether an industry characterized by increasing returns to scale should be under public or private control. We call regulation regime the regime in which the government controls the production of a public firm. The government’s control rights are associated with accountability on profits and losses. That is, it must subsidize the firm in case of losses whereas it taxes the firm in case of profits. In contrast, we call private regime the regime in which the government imposes no control on the operations of a private firm, and it takes no responsibility for the firm’s profits or losses. That is, no transfer is possible between the government and the private firm once production has begun. This is of course a simplification. In practice government might subsidize the private sector. However subsidies are lower under private than under public ownership, which is what matters for the results.10 Similarly private firms do not pay tax on profit but they can pay an entry fee.11 10 For instance, in Burkina Faso government subsidies to SOEs went from 1.42 percent of GDP in 1991 to 0.08 percent of GDP in 1999 as a result of privatization (AfDB-OECD 2003). 11 This is an artifact of the formalization. In the static model below it is optimal for the government to sell the firm ex-ante (i.e. while it is in a position of symmetric information vis ` a vis the firm) rather than to tax its profit ex-post (i.e. once the firm has learned its cost parameter and has an informational 8 Demand: We consider a normal good. The inverse demand function for Q ≥ 0 units of the commodity is given by12 P (Q) = a − bQ (1) where a > 0 and b > 0 are common knowledge. The gross consumer surplus is therefore S(Q) = Z 0 Q b P (x)dx = aQ − Q2 . 2 (2) Firms: We focus on infrastructure and utilities. These industries require to sink large investments. Technically they involve increasing returns to scale technology so that cost functions are sub-additive. As in Baron and Myerson (1982), this is simply modeled by assuming that the cost function includes a fixed cost K > 0, and an idiosyncratic marginal cost βi . To produce qi units of the commodity, firm i = 1, ..., N has the following cost function: C(βi , qi , K) = K + βi qi . (3) Firm i must make the investment K before discovering βi . The βi s are independently ¯ according to the density and cumulative and identically distributed on the interval [β, β] distribution functions g(·) and G(·). This law is common knowledge. We denote the expectation operator by E, the average marginal cost by Eβ, and the variance of marginal cost by σ 2 =var(β). Neither the government nor the competitors of firm i observe βi . The fixed cost K is large so that the maximal number of firms N that can survive under laissez-faire is small. To be more specific we make the following assumption: A0 K≥ (a − Eβ)2 σ 2 + . 16b 4b advantage). Empirical evidence shows that developing countries rely on entry fees to raise revenues from firms (see Auriol and Warlters 2005). 12 To keep the analysis simple we consider a linear product demand. However the results are robust to more general demand function. For instance models with iso-elastic demand functions require numerical simulations but yield similar results. Computations are available on request. 9 Assumption A0 implies that N ≤ 2.13 The firms are profit maximizers. The profit of firm i = 1, ..., N is Πi = P (Q)qi − C(βi , qi , K) + ti (4) where ti is the net transfer that the firm gets from the government (subsidy minus tax and franchise fee). Government: It is utilitarian and maximizes the sum of consumer and producer surpluses minus the social cost of transferring public funds to the firm(s). The transfer to the firm(s) can either be positive (i.e. a subsidy), or negative (i.e. a tax). The government’s objective function is W = S(Q) − N X C(βi , qi , K) − λ i=1 N X ti (5) i=1 where λ is the opportunity cost of public funds. For λ close to 0, the government maximizes the consumer surplus; for larger λ, the government puts more weight on taxpayers surplus (i.e., on transfers). Opportunity cost of public funds: Term 1 + λ measures the social cost of transferring one unit of money from the government to the firm. That is, government pursues multiple objectives, such as the production of public goods, the regulation of non competitive industries or the control of externalities, under a single budget constraint. The opportunity cost of public funds is the Lagrange multiplier of this constraint. It tells how much the social welfare can be improved if the budget constraint is relaxed by one dollar. It includes foregone benefits of alternative investment choices and spending.14 In practice, any additional investment in infrastructure or public utilities implies a reduction of the production of essential public goods such as national security, law enforcement or any other commodities that generate externalities such as health care and education. It may 13 14 To find out how A0 is computed, see the Appendix made available in WBER Website. It is different from the marginal cost of public funds (MCF) which measures the dead weight loss created by a marginal increase of a specific tax rate (see Warlters and Auriol 2005). 10 also imply a rise in the level of taxes or public debt. All these actions have a social cost, which must be traded off with the social benefit. Symmetrically when the government is able to tax an industry, the social benefit generated by the additional revenue must be compared with the reduction in consumer surplus. In advanced economies, λ is usually assumed to be equal to the deadweight loss due to imperfect income taxation. It is assessed to be around 0.3 (Snower and Warren, 1996). In developing countries, low income levels and difficulties in implementing effective taxation programs are strong constraints on the government budget. The tax revenue-GDP ratio for 1995, for example, was 36.1 % for OECD countries (see the OECD website) versus 18.2 % for developing countries (based on a sample Tanzi and Zee 2001). Since the opportunity cost of public funds is higher when, everything else being equal, government revenue is lower, the opportunity cost of developing countries should be higher than 0.3. As a benchmark case the World Bank (1998) suggests an opportunity cost of 0.9. However the value is much higher in countries that are heavily indebted. 3 Privatization of natural monopoly When K is large, a natural monopoly emerges: N ∈ {0, 1}. Regulation aims at correcting the distortion associated with monopoly pricing. Theory suggests that welfare should never be smaller under regulation than under laissez-faire because, at worse, a benevolent regulator should be able to mimic the choice of a private firm. We show that it is not always the case under asymmetric information. 3.1 Private monopoly The production level of a private monopoly (henceforth P M ) is not controlled by the government. The government can nevertheless control the entry of the firm by auctioning the right to operate. Let F (λ) ≥ 0 be the (exogenous) franchise fee that the private firm 11 pays to the government in order to operate in the product market. This franchise fee depend on the economic condition of the country through the value of λ. The private monopoly contemplates the following sequential choices. First, the monopoly chooses to enter the market by paying the franchise fee F (λ) and by making the investment K. If it enters, then nature chooses the marginal cost β according to the distribution G(·). The private firm learns β and chooses a production level Q. After the realization of β the private firm never pays or receives a transfer from the government.15 The private monopoly’s profit is ΠP M = max P (Q)Q − βQ − K − F (λ). Q The optimal production is independent of K and F (λ): QP M = a−β . 2b (6) If a is smaller than the firm’s marginal cost β, the production level falls to 0. In order to rule out corner solution in the sequel of the paper, we assume that a is not too small: A1 a ≥ max 2β, β + G(β) g(β) . Substituting QP M in equations (4) and (5), we get the ex-ante profit and welfare of a private monopoly, EΠP M = V − K − F (λ), EW P M (λ) = 3 V − K + λF (λ) 2 (7) (8) where V = E(a − β)2 4b (9) is the profit of operating the firm after the fixed investment is made. A monopoly is privately feasible if it is ex-ante profitable. This requires that V ≥ K and that F (λ) ∈ 15 Auriol and Picard (2005) discuss the privatization of a monopoly with ex-post renegotiation and endogenous franchise fee. 12 [0, V − K]. Similarly a monopoly is socially valuable if it brings ex-ante positive welfare. Comparing (7) and (8), it is easy to check that monopolies are socially valuable but privately infeasible if V < K < 32 V . Decreasing franchise fees: Because public funds are costly, the ex-ante welfare, EW P M (λ), increases linearly with F (λ). The maximal entry fee that the government can collect is the maximum price a risk neutral entrepreneur would agree to pay for the monopoly concession: F ∗ = max{0, V − K}. In practice international capital flows depend on country risk ratings so that developing countries’ government do not collect F ∗ (see Brewer and Rivoli 1990).16 Because of the service of their debt, the perception of corruption in the administration, the social instability, the lack of transparency and predictability of their political and judicial institutions, private investors, especially foreign ones, are very reluctant to invest in developing countries.17 In the context of our model a bad rating translates into a large λ. That is, countries characterized by a large λ are also countries that get low privatization proceeds. To capture this idea we make the following assumption.18 A2 16 F (λ) ∈ [0, F ∗ ] is non-increasing and weakly convex in λ ≥ 0. The ratings reflect the ability and willingness of a country to service its financial obligation. See for instance Global Risk Assessments web site, www.grai.com/links.htm. 17 For instance in 1999 foreign direct investment (FDI) inflows to the 49 least developed countries (10% of the world population) was 0.5% of total world FDI flows. Since less than 10% of this investment was cross-border merger and acquisition (including privatization), privatization proceeds are lower in poor countries than in rich ones, despite sometimes a large number of privatizations. 18 The theory of predatory governments provides another justification for the assumption A2 (see for instance Evans 1989). 13 3.2 Regulated monopoly Under public ownership, the government, which is accountable for the profits and losses of the firm, monitors the production of the regulated monopoly (RM hereafter). The timing is as follows: The government first decides to make the investment K. Second, nature chooses the marginal cost β according to the distribution function G(·). Third, the firm’s manager learns β, but the government does not. The government proposes a production and transfer scheme (Q(·), t(·)). Finally the regulated firm reveals the information βb b t(β)). b and production takes place according to the contract (Q(β), We first study the benchmark case of regulation under symmetric information. 3.2.1 Symmetric information When the government observes the realization of β, it solves max{Q,t} W s.t. Π ≥ 0 with W and Π defined in (5) and (4). Since λ is positive, transfers to the regulated firm are costly and must be reduced down to the break-even point, Π = 0. That is, tRM ∗ = −P (Q)Q + K + βQ. Substituting this expression in (5) and maximizing W with respect to Q yields QRM ∗ (β) = 1+λ a−β . 1 + 2λ b (10) Inserting QRM ∗ in (5) and computing the expected value of W, gives the ex-ante welfare under symmetric information EW RM ∗ 1+λ (λ) = (1 + λ) 2 V −K 1 + 2λ ! (11) where V is defined in equation (9). The government invests K in a regulated firm only if (11) is positive. The ex-ante welfare increases linearly in V and is non-monotone in λ if V > K: it decreases for small λ and increases for large λ. This deserves a comment. For small λ, the government incurs small social costs of transferring money to the regulated firm. It then chooses quantities that are close to the first best level which means a price that is close to marginal cost. That is, limλ→0 QRM ∗ = (a − β) /b and 14 therefore P ( a−β ) = β. At this price, the regulated monopoly cannot recover its fixed b cost. The loss is compensated by a public transfer to the firm t = K > 0. By continuity, the government will subsidize the regulated firm as long as λ remains small enough. In contrast, for large λ, the government is more interested in receiving transfers from the public firm than in maximizing consumer surplus. In the limit it seeks the maximal revenue from the state-owned firm so that it chooses the production level of a private monopoly: limλ→∞ QRM ∗ = (a − β) /2b = QP M . It mimics the private firm behavior. 3.2.2 Asymmetric information Under asymmetric information, β is not observed by the government. To entice the firm to truthfully reveal its cost, incentive compatibility constraint must be added to the problem. Taking this constraint into account implies that in the government objective function the marginal cost β is replaced by the virtual cost (see Laffont and Tirole, 1993): c(β, λ) = β + λ G(β) . 1 + λ g(β) (12) The virtual cost includes the marginal cost of production, β, and the marginal cost of information acquisition, λ G(β) . 1+λ g(β) To avoid the technicalities of ‘bunching’ we make the classical monotone hazard rate assumption:19 A3 G(β)/g(β) is non decreasing. We deduce that c(β, λ) ≥ β, and by A3, that c(β, λ) increases in β and λ. Let V 19 RM E(a − c(β, λ))2 (λ) = . 4b (13) When the hazard rate is not monotone increasing, the virtual cost (12), and thus the regulated output (14), are not monotone. Then output is not an invertible function of the type β and the government is unable to infer the type of each firm by observing its output level. Being unable to ’separate’ the types of firms, it is obliged to ’bunch’ various types in a same contract. 15 It is the function V in (9) evaluated at c(β, λ) instead of β. This implies that V RM (λ) decreases in λ. Following the Baron and Myerson’s (1982) approach, we deduce the following lemma, which proof is standard (see Laffont and Tirole, 1993). Lemma 1 Under asymmetric information, the optimal production and the ex-ante welfare of a regulated monopoly are those of the symmetric information case evaluated at the virtual cost c(β, λ): QRM (β) = QRM ∗ (c(β, λ)), (14) ! EW RM (λ) = (1 + λ) 2 + 2λ RM V (λ) − K . 1 + 2λ (15) Since c(β, λ) ≥ β, we deduce that QRM (β) ≤ QRM ∗ (β) for any β. Moreover, since c(β, λ) increases in β, the distortion is higher at larger marginal costs. Indeed by lowering the production of inefficient firms, the government reduces the overall incentive to inflate cost report. This strategy lowers the firm’s informational rent and the cost of information revelation. Comparing (9) and (13) it is easy to verify that V RM (λ) ≤ V for all λ ≥ 0. Hence, the ex-ante welfare of a regulated monopoly is lower under asymmetric information than under symmetric information: EW RM (λ) ≤ W RM ∗ (λ). 3.3 Regulation versus privatization We are now ready to compare the welfare level generated by a private monopoly with that of a regulated monopoly. We first consider the symmetric information case. Proposition 2 Under symmetric information, public regulated monopoly dominates privately feasible monopoly, whether the latter is franchised or not. Proposition 2 is intuitive. Under symmetric information a benevolent government cannot do worse than a private monopoly because, for any realization of β, it can always replicate the outcome of the private firm. Nevertheless, for large opportunity costs of public funds, a regulated monopoly under symmetric information does not bring much 16 more welfare than a private monopoly when the latter pays the maximal franchise fee, F ∗ .20 In other words, the welfare of a regulated monopoly coincides with the welfare of a private monopoly for large λ. From this argument, we can infer that the additional cost introduced by the asymmetry of information in the regulated monopoly gives a welfare advantage to the private monopoly for sufficiently large λ. That is, under asymmetric information, the welfare function of the regulated monopoly has an asymptote with (negative or positive) slope limλ→+∞ EW RM (λ)/λ. It is easy to check that EW RM (λ) = V RM (∞) − K λ→+∞ λ (16) lim is smaller than V − K. We deduce that privately feasible monopolies can dominate regulated monopolies. Let the fixed cost K satisfy the following condition. C0 q V ≥K≥V 2 B+V RM (∞) V − B+V V with B = E q The interval defined in condition C0 is non empty. Indeed, 2 B 2 ) + equivalent to ( 2V V −V RM (∞) V h a−β G(β) b g(β) B+V RM (∞) V i − . B+V V < 1 is > 0, which is always true since V > V RM (∞). The left hand side of condition C0 implies that the fixed cost is small enough so that a monopoly is privately feasible (see (7)). The right hand side implies that the fixed cost is large enough so that the monopoly is not too profitable. Proposition 3 presents the main result of the paper: Under condition C0 privatization dominates benevolent regulation for at least some value of the opportunity cost of public funds. Proposition 3 Suppose that assumptions A0 to A3 hold and that the fixed cost, K, lies in the non-empty range defined by Condition C0. Then two cases are possible: b such that privati(i) limλ→+∞ F (λ) ≥ V RM (∞) − K: there exists a unique threshold, λ, b zation dominates regulation if and only if λ > λ. b and λ, e λ b < λ, e such that (ii) limλ→+∞ F (λ) < V RM (∞) − K: there are two thresholds λ b λ]. e privatization dominates regulation if and only if λ ∈ [λ, 20 When F = F ∗ , EW RM ∗ (λ) = ((1 + λ)/ (1 + 2λ)) V +(1 + λ)(V − K), whereas EWFP∗M (λ) = V /2 + (1 + λ)(V − K). The two functions have a common asymptote with slope V − K (see figure 1). 17 In other words, for any value of the franchise fee function F (.) (which includes the case F (.) ≡ 0), there exists a range of fixed costs K and of costs of public funds λ so that the government prefers privatization. Figure 1 illustrates Proposition 3. The bold solid curve represents the ex-ante welfare of regulated monopoly under symmetric information (RM ∗ ) and the bold dotted curve displays ex-ante welfare under asymmetric information (RM ). The ex-ante welfare of regulated monopoly is non-monotone in λ. It is higher for low or high values of λ than for intermediate ones. The thin solid straight lines represent the two boundaries of the ex-ante welfare of a private monopoly (P M ) (i.e. for F (λ) ≡ F ∗ and for F (λ) ≡ 0 ∀λ ≥ 0). Depending on the franchise fee function, F (λ), the welfare function associated to a private monopoly varies between these two bounds. EW 6 2V − K EW (( (((( ( ( ( PM ((( RM ∗ EWF ∗ ( ((( (((( ((( ( ( ( ((( 3 V 2 −K (((( (((( EW0P M EW RM b λ ˜0 λ ˆ0 λ Figure 1: Welfare for Private and Regulated Monopoly 18 λ Proposition 3 establishes that privatization with price liberalization dominates a benevolent regulation under public ownership for (at least) intermediate values of opportunity costs of the public funds. On the one hand, when the franchise fee F (λ) is large (i.e. F (λ) ≥ V RM (∞) − K, ∀λ ≥ 0), the opportunity costs supporting privatization belong to b +∞). The optimal industrial policy is monotone in λ. On the an unbounded range [λ, other hand, when the franchise fee falls below the threshold V RM (∞) − K, the optimal industrial policy is non monotone in λ. For intermediate values of λ privatization with price liberalization dominates regulation under public ownership. The opposite conclusion holds for lower and larger value of λ. Observe that the preference for private feasible monopolies is not explained by the possibility of collecting franchise fees. As shown in b λ e the Appendix, even with no fee, F (λ) ≡ 0, the interval [λ 0, 0 ] where privatization dom- inates regulation is non empty (see figure 1). The intuition for this result is as follows. A private entrepreneur enters the business if his/her firm is ex-ante profitable. After the investment, the private firm makes a large or a low operating profit depending on the realization of technical/demand uncertainties. A private entrepreneur, who bets her own assets (or the shareholders’ ones) in the firm, is accountable for these profits and losses. In contrast, under regulation, accountability lies on the government side; the business risk is borne by the government that has to grant ex-post subsidies to unprofitable firms. Under asymmetric information, the regulated firm uses the transfers to acquire a positive informational rent. The government prefers that the private sector takes over when the social cost associated with the rent outweighs the social benefit of controlling the firm’s operation. As suggested by condition C0 and shown Section 5 this ultimately depends on the profitability of the industry market segment. 3.4 Numerical Assessment for λb Proposition 3 shows that independently of the privatization proceeds and fees, privatization with prices liberalization dominates a benevolent regulation under public ownership 19 for intermediate value of λ. The relevance of this result depends on what ’intermediate’ value means. If λ is very high, in practice privatization will never be optimal. The lowest b for which privatization becomes attractive, is obtained value of the opportunity cost, λ, when the highest franchise fee F ∗ applied (see figure 1). It solves EW RM (λ) = EWFP∗M (λ). This equation is equivalent to 4(1 + λ)2 V RM (λ) = (3 + 2λ)(1 + 2λ)V. (17) b we make the assumption of a uniform distribution of β over To get explicit value for λ, [β, β].21 Using (12) and (13), under the uniform distribution, equation (17) is equivalent to: 4E((1 + 2λ)(a − β) − λ(a − β))2 = (3 + 2λ)(1 + 2λ)E(a − β)2 . One can divide the right b depends on β/a and β/a only. hand side and the left hand side by a2 and check that λ Since under the uniform specification the demand intercept a satisfies A1 if and only if b for the various admissible a ≥ 2β, we get that 0 ≤ β/a < β/a ≤ 0.5. Table 1 displays λ values of β/a and β/a. b λ β/a = 0.0 0.1 0.2 0.3 0.4 ¯ = 0.1 β/a 1.14 - - - - 0.2 0.71 1.07 - - - 0.3 0.52 0.66 0.99 - - 0.4 0.42 0.48 0.60 0.90 - 0.5 0.35 0.38 0.44 0.54 0.81 b above which privatization can be preferred Table 1: Minimal opportunity costs λ The opportunity cost of public funds is generally assessed to be around 0.3 in industrial countries (see for instance Snower and Warren (1996)) and higher in developing countries. We conclude that if demand and cost functions are reasonably approximated b lies below the by linear functions and satisfy assumption A1, which is an empirical issue, λ 21 The simulation results are robust to other statistical specifications (e.g. normal distribution). 20 range of the opportunity costs prevailing in developing countries. The results in Table 1 also highlight that privatization is more likely as technological uncertainty rises (i.e. b decreases with (β − β)/a). Indeed larger cost uncertainty implies stronger informaλ tion asymmetry between firms and governments and hence larger information rent in the regulated structures. 4 Liberalization reform: the duopoly case We next briefly explore the optimal industrial organization when the fixed cost K becomes smaller or equivalently, when the value of operating the firm after investment, V , becomes larger.22 We compare a regulated duopoly `a la Auriol and Laffont (1993), with a private duopoly, modeled as Cournot duopoly with asymmetric information between firms.23 To simplify the exposition, franchising is ruled out in the sequel. F (λ) ≡ 0 . A4 In the present model, the benefit of choosing a regulated duopoly (henceforth RD) originates from the sampling gain as first analyzed by Auriol and Laffont (1993). That is, variable costs are lower in a duopoly because the regulator is able to choose the most efficient supplier among two firms. Monitoring a regulated duopoly then is equivalent to monitoring a regulated monopoly for which the investment level is 2K and the marginal cost is min{β1 , β2 }. Since we assumed that β1 and β2 are independently and identically distributed, min{β1 , β2 } is distributed according to gmin (β) = 2(1 − G(β))g(β). Let V RD (λ) = Z β¯ β 22 (a − c(β, λ))2 gmin (β)dβ. 4b (18) In the last two decades some industries such as telecommunication have experienced dramatic tech- nological and/or demand changes resulting both in a decrease in fixed costs and an increase in demand. 23 For the sake of conciseness, we exclude the case of mixed duopolies with a regulated and a private firm. See Cremer et al. (1989) and Picard (2001) for a policy discussion about mixed duopolies. 21 It is the monopoly expression V RM (λ) in (13) where the density function g(β) has been replaced by gmin (β). For the sake of exposition, the next result is established under the assumption that G(β) is the uniform distribution. The Proposition applies for a more general distribution.24 Proposition 4 Assume that the firms’ marginal cost are independently and uniformly distributed over [0, β] and that assumption A1 and A4 hold, then a private duopoly is never optimal. In a regulated duopoly only the firm with the lowest marginal cost produces. This maximizes productive efficiency. By contrast, in private duopoly equilibrium there is excessive entry and inefficient allocation of production. The advantage of private structures hence disappears once the market allows the entry of more than one firm.25 For very profitable market segment, the optimal choice is thus between regulated monopoly and regulated duopoly. Let K RM/RD (λ) be the value of the fixed cost such that the govern- ment is indifferent between a regulated monopoly and a regulated duopoly (i.e. such that EW RM (λ) = EW RD (λ)) : RM/RD K (λ) = 1 + λ RD V (λ) − V RM (λ) 1 + 2λ (19) RM/RD Under asymmetric information, the sampling gain is measured by K (λ) so that marRM/RD ket liberalization is optimal whenever the entry fixed cost K is lower than K 24 25 (λ).26 See the Appendix on WBER Website. This result may look at odds with theories where private structures perform better with larger number of entrants (see for instance Vickers and Yarrow (1991) and Segal (1998)). A basic difference in our model lies in the intensity of competition that exists within private and regulated structures. Private firms compete in quantities so that the addition of a firm does not fully eliminate market power and profits. In contrast, information costs dramatically fall when a second firm is added in the regulated market (see Auriol and Laffont 1993). 26 Since the distribution function g min (β) stochastically dominates g(β) and since (a − c(β, λ))2 /4b decreases in β we deduce that V RD (λ) ≥ V RM (λ). However the larger λ is, the lower is the impact of the sampling gain and the smaller is the government’s preference for regulated duopoly. 22 5 Optimal industrial policy Under complete information, the government can always replicate the production decisions of private firms so that privatization is never optimal. The optimal industrial policy varies from no production, regulated monopoly to regulated duopoly according to whether the investment cost K is large, medium or small. Under asymmetric information, information costs alter this result. Still the optimal decision depends on the fixed cost K. Let K RM (λ) be the threshold such that the government is indifferent between a regulated monopoly and no production (i.e. such that EW RM (λ) = 0). It is easy to check that K RM (λ) = 2 + 2λ RM V (λ) 1 + 2λ where V RM (λ) is defined equation (13). Similarly let K (20) RM/P M (λ) be the value of the fixed cost such that the government is indifferent between a regulated monopoly and a private monopoly (i.e. such that EW RM (λ) = EW P M ). It is easy to check that RM/P M K (λ) = 2(1 + λ)2 RM 3V V (λ) − . λ(1 + 2λ) 2λ (21) The next result is presented under the assumption that G(β) is the uniform distribution. This result nevertheless applies to more general distribution.27 Proposition 5 Assume that the firms’ marginal cost are independently and uniformly distributed over [0, β] and that assumption A1 and A4 hold. Then the optimal industrial policy under asymmetric information is to set: n • no production if K > max V, K • a private monopoly if K RM/P M • a regulated monopoly if K 27 RM o (λ) (λ) < K ≤ V n RM/RD (λ)< K ≤min K See the Appendix on WBER Website. 23 RM/P M (λ), V o or if V ≤ K < K RM (λ) • a regulated duopoly if K ≤ K RM/RD (λ). K 6 2V K RM ∅ 3 V 2 V K RM (∞) RM 2V min , , PM K RM/P M − 2V @ @ @ @ @ @ @ @ @ @ @ @ @ RD @ @ @ RM/RD @ @ K @ @ @ @ @ @ @ @ @ @ @ @ @ @ @ @ @ @ @ @ @ @ @@ @ b λ λ Figure 2: Optimal Industrial Policy Because developing countries have large opportunity costs of public funds, they may implement industrial policies that strongly differ from those implemented in advanced economies. This statement is depicted in Figure 2 that illustrates Proposition 6 in (λ, K) space. For the sake of exposition, we limit our discussion to four cases that depend on the profitability of the market segment. Profitability is assessed by the difference between the operating profit of the private firm, V , and the fixed cost level, K. In the following discussion, V is fixed to a constant and K is successively decreased. The first case occurs for large fixed costs K > V . The market segment is not privately profitable and is socially beneficial only if the shadow cost of public funds λ is small enough. The optimal industrial policy is therefore to set up a public regulated firm for low λ or to supply nothing at all for high λ. Public regulated monopolies that are desirable 24 under asymmetric information are depicted by the white area denoted RM while the case for no production corresponds to the area denoted ∅. This is a case for public provision and ownership of firms in unprofitable segments. Examples are rural infrastructure projects (e.g., a secondary road, rural electrification) that are supplied only by wealthy nations and that are usually used at marginal cost by rural population. Poor countries face an opportunity cost of subsidizing such infrastructure that is higher than their social returns. As a result, they choose not to offer such infrastructure or try to get rid of the unprofitable public firms in charge of them. The second case occurs for smaller fixed costs that belong to the range [K RM (∞), V ]. In this case, a private firm finds it profitable to enter and supplies its output at the monopoly price. In contrast to the first case, countries now have the alternative to organize supply through the use of a private firm. The optimal industrial policy is monotone in the opportunity cost of public funds λ: a public regulated firm is preferred if λ is small enough and privatization is preferred otherwise. In Figure 2, the case for public regulated firm is still represented in the white area and denoted RM and the case for privatization is represented by hatched area above the curve K RM/P M and denoted P M . Here privati- zation becomes an appealing alternative compared to public provision. Indeed, consider the situation of a poor country’s government that is unable to finance an infrastructure project, as in the case of small water networks or generation facilities (i.e. K lies above the curve K RM and below V ; λ is high enough). If a private firm proposes to invest in the infrastructure in exchange for the freedom to charge monopoly pricing it is optimal to let this firm do so. Indeed, it is better to have a privately owned and operated infrastructure with monopoly price distortion than no infrastructure at all. By continuity this conclusion still holds when the government gets a (not too large) benefit from financing the infrastructure. Developing countries offer many examples of such privatization processes through their use of concession, lease, or greenfield contracts. For instance many developing countries have started build-operate-and-transfer (BOT) programs where private 25 firms finance the sunk costs associated to highways, in exchange for a 10-30 years licence to exploit it in a monopoly position.28 Similarly China, Malaysia, Thailand implemented such programs in water, and Chile, Mexico, in sanitation (World Bank 1997). In many places, the privatization process is less formal. For instance, in Sub-Saharan Africa, water and electricity services are offered by an informal sector made of thousands of small scale private and unregulated providers (see Auriol and Blanc 2007). As predicted by the theory they serve the middle class and the poor at prices that are much higher than the public utilities’ prices. A recent survey estimates that nearly half of urban dwellers in Africa rely on such private services for water (Kariuki and Schwartz 2005). We can now discuss our third case where K is lower than K RM (∞). Observe at the out- set that, contrary to the second case, the optimal industrial policy is no longer monotone in λ. This property, which has already been discussed in Proposition 3, is reflected in Figure 2 by the fact that the curve denoted K tion, let us define K RM/P M RM/P M is non monotone in λ. For the sake of exposi- as the minimum of K RM/P M (i.e. K and let us discuss fixed costs belonging to the interval [K RM/P M RM/P M = minλ K ,K RM RM/P M (λ)) (∞)]. Then, as the shadow cost of public funds λ increases, the optimal industrial structure successively switches from a public regulated firm to a private firm and then switches back to a public regulated firm. The difference with the second case above lies in the fact that when λ is sufficiently large the government seeks to extract the maximal revenue from the public firm by setting high prices. This case shows that whereas the divestiture of a profitable public firm may be optimal in countries with intermediate costs of public funds, it is not necessarily optimal in developing countries where budget constraints are tight and market institutions are weak. The fixed-line and long distant segment of the telecommunication industry illustrates the non monotonicity result: “A PTT’s yearly revenues (especially charges from international call) were used by governments to subsidize mail service, or to ease yearly budget deficits. Given this public convenience and necessity, the interests 28 Trujillo et al. (2003) show that transport privatization leads to a reduced need for public investment. 26 of third world governments are often diametrically opposed to telecom policies of privatization and network deregulation favored by wealthy nations.” (Anania 1992). Although advanced economies also care for the revenues generated by their utilities,29 their effective taxation systems make them less greedy to the potential revenues of natural monopoly markets.30 The paper shows that in poor developing countries, privatization of public utilities profit centers is socially inefficient. By eliminating cross-subsidies between various market segments or industries, privatizations have hence generally increased the fiscal costs related to unprofitable segments and have reduced political support from harmed (usually poor) consumers (Estache and Wodon 2006, Trujillo et al. 2003). The final case in our discussion takes place at sufficiently low fixed costs. With a large surplus at stake, Proposition 4 shows that a private Cournot duopoly is never optimal. Governments choose between regulated public structures with one or two firms depending on whether shadow costs of public funds are small or large. In Figure 2, a regulated duopoly is preferred to regulated monopoly in the hatched area below the curve K RM/RD denoted RD. This last case sheds light on the relationship between market liberalization on the one hand, and technological improvement and/or product demand growth, illustrated by a fall in the ratio K/V , on the other hand. Market liberalization corresponds to the divestiture of the historical monopoly and the introduction of new entrants, but is not equivalent to laissez-faire. Prices and entry should remain regulated to protect consumers against firms’ tendency to reduce competition by setting their capacity levels or even to organize collusion and exert predatory behavior (not modeled in this paper). With a large surplus at stake, ownership is not the key to the allocative efficiency problem; regulation 29 In the USA a federal excise tax on telephony services was created in 1898. Tax’s opponents argue that it is distortive, while its proponents insist on the revenues need. It is hard to get around this argument: At a tax rate of 3% tax collection reached USD 5.185 billions in year 1999 (USA government budget). 30 On the whole this non-tax revenue is more important for developing than opposed to industrial countries, comprising about 21 percent compared to 10 percent of total revenue (Burgess-Stern 1993 pp 782). 27 is the key. Empirical evidence supports this result.31 6 Conclusion In this paper we compare the welfare of a public firm with regulated prices to the welfare of a private firm with liberalized prices for different values of opportunity costs of public funds. We show that the privatization decision non-trivially depends on the value of opportunity costs of public funds and on the profitability in the market segment where the firm operates. Since the opportunity cost of public funds is higher in developing countries than in developed countries, optimal privatization policies are likely to differ between those countries. We have highlighted four cases. First, a market segment can have a so low profitability that no private firm is able or willing to cover it. Such a situation is typically encountered in secondary road or electrification projects in a low density area. A public firm is then the natural option provided that the opportunity cost of public funds is not too high. Otherwise, the service is not offered. Empirical evidences are consistent with this result. The fraction of people in poor, rural areas that do not have access to any service is larger in developing countries than in advanced economies. Second, the market segments can be sufficiently profitable to allow the entry of a private firm. We show that privatization with price liberalization then dominates regulation if and only if the opportunity cost of public funds is large enough. As a result, the provision of utility services and infrastructures is more market oriented in developing countries than in developed ones. This is consistent with factual evidences. For instance Kariuki and Schwartz (2005) estimate that nearly half of urban dwellers in Africa (i.e., the middle class and the poor) rely on private providers for water service. The private (informal) 31 For instance, in telecommunication industry in African and in Latin America, Wallsten (2001) found that privatization does not yield improvements but that privatization combined with an independent regulator does. For more on telecommunication reforms in developing countries see Auriol (2005). 28 providers are bridging the utilities service gap at a high cost; their prices are up to 10 times the prices of public providers. The result is also consistent with developing countries use of concession, lease, or greenfield contracts, such as build-operate-and-transfer (BOT) programs for highways, sanitation or water networks. Third, when market segments are even more profitable, we show that privatization choice is restricted to intermediate opportunity costs of public funds. The government finds it optimal to set up a public firm for large enough opportunity costs of public funds. Very poor countries are plagued with financial problems and welcome the potential revenues that can be extracted from a public firm. Privatization of profitable public utilities, such as fixed lines or international telecommunication services, is therefore not efficient. Finally, the market segment can be so profitable that a second firm is able to enter the market. Then, privatization with price liberalization is not optimal. As shown in the booming mobile telecommunication industry, regulation is a keystone for successful liberalization reforms. In contrast to many contributions on privatization, our discussion has focused on the two issues of allocative efficiency and macroeconomic financial constraint. The empirical literature in development studies provides replete evidence of the relationship between those two issues in natural monopoly and oligopoly markets located in developing countries. Nevertheless, as noted in the Introduction, improvements in productive efficiency associated to privatization have also been highlighted in the theoretical and empirical literature. We hope that the present contribution may help the reader to find a balance between those issues. 29 References AfDB-OECD (2003), ”African Economic Outlook”, OECD. AFD-Hydroconseil-SEURECA (2005), ”Projecto de Reabilitaao das Redes de Agua Potavel da Aglomeraao de Maputo”, rapport. ANANIA, L. (1992), “The Protean Complex: Are Open Networks Common Markets?”, in the Economics of Information Network Ed by C. Antonelli, North-Holland. AURIOL, E. and J.J. LAFFONT (1993), “Regulation by Duopoly”, Journal of Economics and Management Strategy, 3, 507-533. AURIOL, E. (2005), ”Telecommunication Reforms in Developing Countries”, Communication & Strategies, special issues WSIS, November 2005, pp 31-53. AURIOL E. and P.M. PICARD (2005), ”Government Outsourcing: Contracting with Natural Monopoly”, CEPR DP 5643. AURIOL, E. and M. WARLTERS (2005), ”Taxation Base in Developing Countries”, Journal of Public Economics, 89(4), 625-46. BARON, D. and R. MYERSON (1982), “Regulating a Monopolist with Unknown Costs”, Econometrica, 50, 911-930. BIRDSALL, N. and J. NELLIS (2002), ”Winners and Losers: Assessing the distributional impact of privatization”, the Center for Global Development, Working Paper Number 6. BREWER, L.T., and P. RIVOLI (1990), ”Politics and Perceived Country Creditworthiness in International Banking”, Journal of Money, Credit and Banking, 22(3), 357-369. BURGESS and STERN (1993), ”Taxation and Development”, Journal of Economic Literature, vol 31 (2), pp. 762-830. CREMER H., MARCHAND M. and THISSE J-F. (1989) ‘The Public Firm as an Instrument For Regulating an Oligopolistic Market’, Oxford Economic Papers, 41, 283-301. DEBANDE, O. and G. FRIEBEL (2003), ”A Positive Theory of Insider Privatization”, WDI, University of Michigan, DP 37. DEWATRIPONT M. and MASKIN E. (1995), “Credit and Efficiency in Centralized and Decentralized Economies”, Review of Economic Studies, 62(4), pp 541-56. 30 DAVIS, J., OSSOWSKI, R., RICHARDSON, T. and BARNETT, S. (2000), “Fiscal and Macroeconomic Impact of Privatization”, I.M.F. Occasional Paper, 194. ESTACHE A., V. FOSTER, and Q. WODON (2002), ”Accounting for Poverty in Infrastructure Reform, Learning from Latin America’s Experience”, World Bank Institute Development Studies. ESTACHE A. (2002), ”Argentina’s 1990’s utilities privatization: a cure or a disease”, Working Paper World Bank. ESTACHE A. and Q. WODON (2006), ”Infrastructure and Poverty in Africa”, mimeo World Bank. EVANS P.B. (1989) ”Predatory, Developmental and Other Appartuses: A Comparative Political Economy Perspective on the Third World State” Sociological Forum, 4(4), p. 561-87. GUASH, J-L. (2004), ”Granting and Renegociating Infrastructure Concessions”, the World Bank Institute of Development Studies, Washington D.C. GIBBON H. (1998),“Worldwide Economic Orthodoxy”, Priv. International, 123, p4-5. GIBBON H. (2000),“Editor’s Letter”, Privatization Yearbook, London: Thomson Financial p1. HART, O. (2003) ”Incomplete Contracts and Public Ownership: Remarks, and an application to Public-Private Parterships”, Economic Journal, 113, p. C69-C76. KARIUKI, M. and J. SCHWARTZ (2005), ”Small-Scale Private Service Providers of Water Supply and Electricity - A Review of Incidence, Structure, Pricing and Operating Characteristics”, World Bank Working Paper n WPS3727. KORNAI J. (1980), ”Economics of Shortage”, Amsterdam, North-Holland. KORNAI J. (2000), ”What the Change of System from Socialism to Capitalism Does and Does Not Mean”, Journal of Economic Perspectives, 4(1), 27-42. KORNAI J. (2001), “Hardening the Budget Constraint: The experience of the post-socialist countries”, European Economic Review, 45, 1573-99. KORNAI J., MASKIN E. and ROLAND G. (2002), ”Understanding the Soft Budget Constraint’, Discussion Paper, University of California, Berkeley. KORNAI J. and J. WEIBULL (1983), ”Paternalism, Buyers’ and Sellers’ Markets”, Mathematical Social Sciences, 7:153-69. 31 LAFFONT, J.J. (2001), “Enforcement, Regulation and Development”, mimeo IDEI Toulouse. LAFFONT, J.J. and J. TIROLE (1993), A Theory of Incentives in Procurement and Regulation, MIT press. MAHBOOBI L. (2000), “Recent Privatization Trends”, OECD, Financial Market Trends, 76, p. 43-64. MARTIMORT, D. and J. POUYET (2006), ”Build it or not: Normative and Positive Theories of Public Private Parnerships”, CEPR Discussion Paper No. 5610. MASKIN, E. (1999), “Recent Theoretical Work on the Soft Budget Constraint”, American Economic Review, 89(2), 421-25. NELLIS, J. (1999), “Time to Rethink Privatization In Transition Economies?”, International Finance Corporation, Discussion Paper 38. PICARD P.M. (2001) “Optimal Employment Subsidies in Industries with Unemployment: Complete Information”, Oxford Economic Papers, 53(2), 352-72. SCHMIDT, K (1996), “Incomplete Contracts and Privatization”, European Economic Review, Vol. 40 569-580. SEGAL, I (1998), “Monopoly and Soft Budget Constraint”, Rand Journal of Economics, 29(3), 569-609. SHAPIRO C. and WILLIG R. (1990), “Economic Rationale for the Scope of Privatization”, DP 41, Princeton University. SHLEIFER, A. and R. VISHNY (1997), ”A survey of Corporate Governance”, Journal of Finance, vol 52 (2) pp. 737-83 SNOWER A. and WARREN R. (1996), “The Marginal Welfare Cost of Public Funds: Theory and Estimates”, J. of Public Economics, 61, 289-305. TRUJILLO, L., E. QUINET and A. ESTACHE (2002), ”Dealing with Demand Forecasting Games in Transport Privatization”, Transport Policy, 9, pp. 325-334. VICKERS J. and YARROW G. (1991), “Privatization: an Economic Analysis”, MIT Press. WALLSTEN, S. (2001), ”An econometric analysis of Telecom Competition, Privatization and Regulation in Africa and Latin America”, Journal of Industrial Economics 49 (1), 119. VAILLANCOURT ROSENAU P. (2000): PublicPrivate Policy Partnerships. MIT Press, Cam- 32 bridge. WORLD BANK (1997), Toolkits for Private Participation in Water and Sanitation. Washington D.C. World Bank. WORLD BANK (1998), ”World Development Indicators”, Washington D.C. World Bank. Acknowledgement We are very grateful to the editor of the World Bank Economic Review and three anonymous referees for their comments and suggestions. We also thank Amann E., Amir R. and M. Warlters for improvements of the paper. We are especially indebted to Antonio Estache for detailed and insightful comments. Any remaining errors are our own. 33 Supplementary Section This supplementary section presents the proofs of Proposition 2, 3, 4 and 5 as well as the formal description of the duopoly case set out in Section 4 of the paper ”Infrastructure and Public Utilities Privatization in Developing Countries” by Auriol E. and Picard P. M. Figures and mathematical expressions referred in this supplementary section are to be found in the latter paper. Appendix 1: Proof of Proposition 2 1+λ We have to show that (1+λ) 2 1+2λ V − K ≥ V −K +λF (λ) ∀λ ≥ 0. The maximal franchise fee, denoted F ∗ , is equal to the firm’s ex-ante profit, i.e. F ∗ = V − K. Therefore the above 1+λ inequality is satisfied if ∀λ ≥ 0 (1 + λ) 2 1+2λ V − K ≥ 23 V − K + λ (V − K) , or equivalently if 4 (1 + λ)2 ≥ (3 + 2λ) (1 + 2λ) which is always true ∀λ ≥ 0. Appendix 2: Proof of Proposition 3 We prove this proposition in four steps. Step 1: Regulation is preferred to privatization if and only if EW RM (λ) ≥ EW PM (λ). By virtue of equation (15) this inequality is equivalent to 2 Developing V RM (1 + λ)2 RM 3 V (λ) − (1 + λ)K ≥ V − K + λF (λ). 1 + 2λ 2 (22) (λ) defined in equation (13) one can check that: V RM (λ) = 1 + 2λ λ2 λ RM V + V (∞) − B (1 + λ)2 (1 + λ)2 2(1 + λ)2 where terms V = E (a − β)2 /(4b) , and V RM (∞) = E h (a − β − G(β) 2 g(β) ) (23) i /(4b) , and B = E [G(β)(a − β)/(g(β)b)] are all positive by virtue of assumption A1. Substituting (23) in (22) and dividing the right and left hand side by λ, we get after some straightforward computations: Reg P riv ⇔ V B 2λ ≥ − V RM (∞) + K + F (λ). 2λ 1 + 2λ 1 + 2λ 34 (24) It is easy to check that the left hand side of (24), denoted LHS(λ), is a decreasing and convex function of λ. Similarly, under the assumption A2 the right hand side of (24), denoted RHS(λ), is decreasing and convex. The following proof relies on the property that two decreasing and convex functions can intersect only once, twice or none. Step 2: For λ = 0, expression (24) is equivalent to V ≥ 0 which is always true. We deduce that for λ small enough regulation dominates privatization. For λ → +∞ two cases hold: either limλ→+∞ LHS(λ) > limλ→+∞ RHS(λ), which is equivalent to F (+∞) < R∞ , or limλ→+∞ LHS(λ) ≤ limλ→+∞ RHS(λ), which is equivalent to R∞ ≤ F (+∞) where R∞ = V RM (∞) − K. Consider first the case R∞ ≤ F (+∞). This condition implies that for λ large enough privatization is preferred to regulation. Since it is the reverse for λ low enough, we deduce that LHS(λ) and RHS(λ) cross once and only once. This proves part (i) of proposition 3. Step 3: Consider next the case R∞ > F (∞). This condition implies that for large enough λ, regulation is preferred to privatization. Since this is also true for low enough λ, we deduce the following possibilities: first, LHS(λ) and RHS(λ) never cross, in which case regulation is always preferred to privatization, second, they cross twice which yields part (ii) of proposition 3. This ultimately depends on K. Step 4: To complete the proof of proposition 3 we need to show that there are at least some values of the parameters such that LHS(λ) and RHS(λ) cross twice. Since privatization is less attractive for smaller franchise fees, a sufficient condition is that LHS(λ) and RHS(λ) crossing twice for F = 0. Simplifying expression (24) and using F (λ) ≡ 0, we get that privatization is preferred to public ownership if and only if P (λ) = 2(V RM (∞) − K)λ2 + (V − B − K) λ + V /2 < 0. b λ) e with 0 < λ b<λ e under three conditions: Inequality (25) is satisfied for λ ∈ (λ, (a) (V − B − K)2 > 4V (V RM (∞) − K). (b) V − B − K < 0 (c) V RM (∞) − K > 0 35 (25) Condition (a) yields a positive discriminant for P (λ) = 0 and thus implies the existence of b and λ; e condition (b) and (c) imply positivity for both roots of P (λ) = 0; finally two roots λ b λ). e since P (0) > 0 and limλ→+∞ P (λ) > 0 under (c), we have that P (λ) < 0 for λ ∈ (λ, Conditions (b) and (c) are satisfied if and only if K ∈ (V − B, V RM (∞)). This interval is not empty since V RM (∞) = V − B/2 + E (G(β)/g(β))2 /(4b) > V − B. Then, observe that the left hand side of condition (a) is equal to zero at K = V −B and increases for larger K. Similarly the right hand side of condition (a) decreases with K and is equal to zero at K = V RM (∞). Hence c ∈ (V − B, V RM (∞)) such that (V − B − K)2 = 4V (V RM (∞) − K). there exists a unique K Solving this equation one can check that s c = V 2 K B+V RM (∞) V − B+V V (26) To conclude we have just shown that conditions (a), (b) and (c) are satisfied for any K ∈ c V RM (∞)), which is a non empty set. Finally note that, because F (∞) ≥ 0, K ≤ V RM (∞). (K, That is, condition (c)) is implied by the condition R∞ > F (∞) (i.e., condition (ii) in Proposition 3). The complementary case, K > V RM (∞), is implied by condition (i) in Proposition 3. We c Finally the project is privately feasible if V − K ≥ 0. This implies an deduce that K ≥ K. c V ). upper bound K ≤ V . Putting the pieces together yields condition C0: K ∈ (K, This complete the proof of proposition 3. It is independent of the cost distribution. Appendix 3: The Duopoly Case In this appendix we derive the optimal industrial organization presented in Section 4 of the paper. When the fixed cost K is sufficiently low private and regulated duopolies are feasible and may be optimal. We compare two market structures. First we study the welfare properties of the duopoly under laissez-faire and asymmetric information between firms. Under the private regime, duopoly is modeled as Cournot quantity setting duopoly with asymmetric information between firms. Second we study the nature of the ’sampling gain’ in the regulated duopoly structure under asymmetric information. Indeed many contributions in procurement and regulation theory emphasize that despite sub-additive cost functions, it can be optimal to 36 have several producers in a regulatory setting. A regulated duopoly can be better than a regulated monopoly because it reduces prices through (yardstick, sampling) competition. In the present model, the firms’ marginal cost are independent and identically distributed. The benefit of choosing a regulated duopoly originates from the sampling gain as first analyzed by Auriol and Laffont (1993). The sampling gain results from the government’s ability to choose the least cost technology out of the two possible technologies offered by the duopoly. Under the regulated regime, managers of duopoly are offered incentive compatible contracts with asymmetric information between the two firms and between firms and goverment. Finally we derive a sufficient condition that guarantees that regulated public duopolies dominates laissez-faire private duopoly. Note that we restrict our attention to the situation in which all firms are either regulated or privatized. The restriction that the same ownership structure applies for all the firms in the market, is made for the sake of simplicity. It indeed helps the exposition by avoiding cumbersome comparison with an additional industry structure. The ’mixed oligopoly’, where some firms are regulated while other are run by private investors, has been partially studied in the case of complete information by Cremer, Marchand and Thisse (1989) and Picard (2001). They show that the presence of a single (high cost) regulated firm can be used to increase welfare by raising output and lowering prices in oligopolistic markets. Here we go further by deriving sufficient conditions under which a regulated duopoly always bring more welfare than a private duopoly. Private duopoly leads to excessive entry and productive inefficiency (both firms produce although one is more efficient than the other). By contrast in the regulated duopoly only the most efficient firm produces. The ’mixed duopoly’ cannot bring the benefit of this sampling gain. It suffers from the same drawback as the private duopoly in the sense that it leads to productive inefficiency. In what follows we leave aside the study of mixed duopoly to focus on the sampling gain. As presented in the paper, we rule out franchising. The results are nevertheless robust to more favorable specifications of the franchise fee.32 32 Considering F > 0 would reinforce the bias in favor of the private monopoly in the sequel because franchise fees are higher with a private monopoly than with a private duopoly (i.e., K 37 P D/P M would F (λ) ≡ 0 . A4 Private duopoly Private duopoly (P D here after) is modeled as Cournot duopoly with asymmetric information between firms. Each firm gets private information on its own marginal cost but it is not informed about the competitor’s marginal cost. As in any Cournot game, each firm maximizes its profit taking the other firm’s output as given. The timing of the game is as follows: First both firms simultaneously make the investments K. Second, each firm i ∈ {1, 2} learns the realization of its own marginal cost βi and chooses its production level qi . The equilibrium concept is Bayesian Nash equilibrium: h qi∗ ∈ arg max Eβj (a − b(qi + qj∗ ))qi − βi qi i qi ∀i = 1, 2, j 6= i. Due to the linear shapes of the demand and cost functions, firm i’s optimal strategy is equal to qi∗ (βi ) = (2a + Eβ − 3βi ) /6b.33 The existence of a duopoly with both firms producing at the equilibrium requires that a ≥ 3β¯ − Eβ /2, which is true under assumption A1. Substituting (q1∗ (β1 ), q2∗ (β2 )) in (4) and (5), we compute the ex-ante firm profit and the industry welfare of the Cournot duopoly EΠP D = EW P D = 4 5 σ2 V + − K, 9 18 2b 16 11 σ 2 V + − 2K. 9 18 2b (27) (28) A duopoly is privately feasible if the two firms are ex-ante profitable. It means that expression (27) should be positive.34 A private duopoly is socially desirable if it brings more welfare than decrease). Empirically Wallsten (2001) finds using panel data of 17 developing countries that exclusivity periods (i.e., temporary monopoly position) can double the firm’s sale price (i.e., F ) in telecommunication industry. 33 For more on Cournot competition under asymmetric information see Sakai (1985), Shapiro (1986) and Raith (1996). 34 The expected profit of N firms playing a generalized Cournot competition is EN Πi = 2 (N −1)(N +3) σ 2(N +1)2 2b − K with N ≥ 1. We deduce that if V 4 yields assumption A0. 38 + 2 3σ 8 2b ≤K≤ 4V 9 + 2 5 σ 18 2b 4V (N +1)2 + then N ∈ {0, 1, 2}. This a private monopoly. That is, if EW P D ≥ EW P M . Let K P D/P M be the level of fixed cost such that the government is indifferent between a private duopoly and a private monopoly, i.e. EW P D = EW P M . From (8) and (28), we compute K P D/P M = 5 11 σ 2 V + . 18 18 2b (29) Walras (1936) and Spence (1976) have shown in a context of symmetric information that industries with increasing returns to scale were characterized by excess entry. The next result shows that the presence of asymmetric information does not alter this result of wasteful competition. Lemma A1 Under asymmetric information there is excessive entry. Privately feasible duopolies are socially undesirable whenever 5 18 V + 11 σ 2 18 2b ≤ K ≤ 49 V + 5 σ2 18 2b . The set of values of fixed costs defined by the condition in Lemma A1 is not empty. One can √ indeed show that that condition is equivalent to a > Eβ + 3σ which is true under assumption A1. Therefore, the ex-ante welfare is higher if a private monopoly is legally set and if entry is prevented. Indeed, firms do not internalize the social cost of the investment duplication in their entry decision. As a result they enter too often in the industry. Regulated duopoly Under the regulated regime, managers of duopolies are offered incentive compatible contracts with asymmetric information between the two firms and between firms and goverment. We first examine the case of symmetric information and the sampling gain benefiting to the government. We next turn to the case of asymmetric information. The sampling effect under symmetric information The timing is the same as for a regulated monopoly with the following differences: the investment K is made in the two regulated firms (henceforth RD) and the marginal cost parameters βi with i ∈ {1, 2} are independently drawn. Under symmetric information the transfers t∗i to 39 the regulated firms i ∈ {1, 2} which are socially costly, are reduced until firms break even: t∗i = −(a − bQ)qi + βi qi + K. Substituting this expression into the welfare function yields W RD∗ = S(Q) + λP (Q)Q − (1 + λ)(β1 q1 + β2 q2 + 2K). The welfare function is linear in q1 and q2 . Optimizing it with respect to qi we deduce that qi∗ = QRD > 0 if βi = min{β1 , β2 } and qi∗ = 0 otherwise. The optimal production level coincides with the level of the regulated monopoly defined in equation (10): QRD∗ (β1 , β2 ) = QRM ∗ (min{β1 , β2 }). Monitoring a regulated duopoly is equivalent to monitoring a regulated monopoly for which the investment level is 2K and the marginal cost is distributed as βmin = min{β1 , β2 }, that is, with the law: gmin (β) = 2(1 − G(β))g(β). (30) The ex-ante welfare of the regulated duopoly under symmetric information is EW RD∗ (λ) = 2(1 + λ) 1 + λ min V −K 1 + 2λ (31) where V min Z β¯ = β (a − β)2 gmin (β)dβ. 4b (32) The facts that gmin (·) stochastically dominates g(·) and that (a − β)2 /(4b) decreases in β imply that V min > V . Then comparing (11) and (31), the ex-ante welfare is larger under a regulated duopoly than under a regulated monopoly if the sampling gain, measured by 2 V min − V (1 + λ) / (1 + 2λ), is larger than K, the duplicated investment.35 Asymmetric information Under asymmetric information, the two regulated firms must be enticed to reveal their private information to the government. By the revelation principle, the analysis is restricted to direct 35 Only one firm produces at the equilibrium. This is an artifact of the assumption of constant mar- ginal costs which is used to isolate the sampling effect. Models with non-constant marginal costs yield qualitatively similar results (see Auriol and Laffont 1993). Finally we assume that the government shuts down the least efficient regulated firm for the sake of readability. It could instead transfer the best technology to all regulated firms and share the optimal production QRD∗ among them. The analysis would be unaltered. 40 revelation mechanisms. The equilibrium is defined as truthful Bayesian Nash equilibrium. Each firm i ∈ {1, 2} sets its revelation strategy βbi such that it maximizes the expected profit given λ G(β) the cost distribution of the competitor j 6= i. Let c(β, λ) = β + 1+λ g(β) be the virtual cost. Let V RD (λ) = Z β¯ β (a − c(β, λ))2 gmin (β)dβ. 4b (33) The following lemma presents the structure of production and the welfare level of the duopoly under asymmetric information. Lemma A2 Under asymmetric information, only the firm with the lowest marginal cost produces. Output and welfare levels are the levels obtained under symmetric information evaluated at the virtual cost: QRD (β1 , β2 ) = QRM (c(βmin , λ)) , EW RD (λ) = 2(1 + λ) (34) 1 + λ RD V (λ) − K . 1 + 2λ (35) Proof: The proof is similar as in Auriol and Laffont (1993) Proposition 2. Monitoring a regulated duopoly is equivalent to monitoring a regulated monopoly for which the investment level is 2K, the marginal cost is c(βmin , λ) and βmin is distributed according to gmin (·). Let K RM/RD (λ) be the value of the fixed cost such that the government is indifferent between a regulated monopoly and a regulated duopoly, i.e. such that EW RM (λ) = EW RD (λ): RM/RD K (λ) = 2 1 + λ RD V (λ) − V RM (λ) 1 + 2λ (36) RM/RD Under asymmetric information, the sampling gain is measured by K (λ). We can write (36) as RM/RD K (λ) = 1 1+λ 2b 1 + 2λ Z β¯ (a − c(β, λ))2 [gmin (β) − g(β)] dβ (37) β The function is integrated by part which yields after straightforward computations: RM/RD K (λ) = 1 1+λ 2b 1 + 2λ Z β¯ −2(a − c(β, λ)) β 41 dc(β, λ)) [Gmin (β) − G(β)] dβ dλ (38) RM/RD The function K (λ) is positive because the distribution function Gmin (β) stochastically dominates G(β), because (a − c(β, λ)) is a positive function under A1, and because the virtual cost is a decreasing function. dc(β, λ) 1 G(β) =− ≤ 0. dλ (1 + λ)2 g(β) We deduce that: RM/RD K 1 1 (λ) = b (1 + 2λ)(1 + λ) Z β¯ (a − c(β, λ)) β G(β) [Gmin (β) − G(β)] dβ. g(β) RM/RD It is easy to check that K (λ) is a decreasing function of λ: both 1 (1+λ)(1+2λ) (39) and the virtual cost, c(β, λ), decreases with λ. In other words, the larger λ is, the lower is the impact of the sampling gain and the smaller is the government’s preference for regulated duopoly. Private versus regulated duopoly We have seen in Section 3 that private monopoly can be preferred to regulated monopoly. By extension, private duopoly could also be preferred to monopoly or regulated duopoly. However, excess entry and weak competition in private Cournot duopolies will generally preclude this structure from being socially desirable. To be more specific let K RD/P D (λ) be the value of the fixed cost such that the regulated duopoly yields the same welfare level as the private duopoly, i.e., such that EW RD (λ) = EW P D . The government prefers a regulated duopoly to a private duopoly if and only if K ≤ K RD/P D (λ). On the other hand, if K ≥ K P D/P M defined in equation (29), the government prefers a private monopoly to a private duopoly. We deduce that if C1 K RD/P D (λ) ≥ K P D/P M a private duopoly is never optimal. Indeed, if the government prefers a private duopoly over a private monopoly (i.e., K < K P D/P M than the private duopoly (i.e., K < K ), under C1 it also prefers a regulated duopoly rather P D/P M implies that K < K RD/P D (λ)) so that the private duopoly is never optimal. Condition C1 is likely to be satisfied because the Cournot equilibrium presents larger inefficiency than the equilibrium in regulated duopolies where the government set the output levels. 42 To illustrate this point, suppose that there is no information asymmetry and no uncertainty (β = β) so that there is no sampling gain. Then the welfare under a regulated duopoly is equal to W RD (λ) = 2(1 + λ) (28) is equal to 8 9V 1+λ 1+2λ V − K whereas the welfare under private Cournot duopoly − 2K and the welfare under private monopoly is equal to 3 2V − K. Ob- viously private duopolies dominate private monopolies for small enough fixed costs, that is for K< 16 9 V − 32 V = 10 36 V . However, if fixed costs are small, the welfare under regulated duopoly is also large. It is then easy to check that, 2(1 + λ) 1+λ 1+2λ V − K ≥ 89 V − 2K ∀λ ≥ 0 if K < 10 36 V . In words, the welfare under regulated duopoly is larger than the welfare under private duopoly for any value of the opportunity cost of public funds when the private duopoly dominates the private monopoly. This implies that a private duopoly is never optimal. Now, let us introduce information asymmetry and uncertainty. In this case, two additional and opposite effects are at work: on the one hand, sampling gains raise the welfare under regulated duopolies and on the other hand, the increase in the cost variance increases the output and the welfare of Cournot private duopolies (see (28)). In the case of uniform distribution or of large demand, the first effect dominates so that a private duopoly is never preferred by the government. Lemma A3 Condition C1 is satisfied if the cost β is uniformly distributed over [0, β] or if a is large enough. Proof: Condition C1 is equivalent to 18(1 + λ)2 1 + 2λ 11σ 2 V RD (λ) ≥ V + . (1 + 2λ)(16 + 5λ) 16 + 5λ 4b (40) Simplifying by 4b, (40) is equivalent to: h i h i (1 + 2λ)11σ 2 18(1 + λ)2 Eβmin (a − c(β, λ))2 ≥ Eβ (a − β)2 + . (1 + 2λ)(16 + 5λ) 16 + 5λ 2 2 18(1+λ) 2−λ+8λ Let h(λ) = (1+2λ)(16+5λ) − 1 = (1+2λ)(16+5λ) > 0 ∀λ ≥ 0. Let Φ(λ) = Eβmin c(β, λ)2 + E [c(β,λ)]−Eβ Eβmin [(c(β,λ)2 ]−Eβ [β 2 ] (1+2λ)11σ 2 − (16+5λ)h(λ) . Let also ξ(λ) = Eβmin [c(β, λ)]+ βmin h(λ) . The condition h(λ) C1 defined in (40) is equivalent to: a2 − 2ξ(λ)a + Φ(λ) ≥ 0. 43 This condition, which requires that a is large enough, is not very strong. For instance, one can check that with a uniform distribution over [0, β], and with the convention that a = αβ, condition C1 is equivalent to: H(α, λ) = 12α2 (8λ2 − λ + 2) + 12α(4 − 7λ)(1 + 2λ) + (1 + 2λ)(44λ − 59) ≥ 0. Under the assumption A1 (i.e. α ≥ 2), it is easy to check that H(α, λ) is increasing in α for all λ ≥ 0. We deduce that H(α, λ) ≥ H(2, λ) = 136λ2 − 98λ + 133 > 0 ∀λ ≥ 0. So, for a uniform distribution, assumption A1 is a sufficient condition to get C1. More generally, let o1/2 n al = ξ(λ) + ξ(λ)2 − Φ(λ) . (41) If a is larger than al condition C1 is satisfied. QED Lemma A3 yields the following, more general version of Proposition 4. Proposition A4 Under assumption C1 a private duopoly is never optimal. Proposition 4 shows that a private Cournot duopoly is never optimal. The negative impact of market power and excessive entry are too strong compared to the positive effects (here the ‘sampling gains’) of a regulated duopoly. In other words, the advantage of private structures with liberalized prices disappears once the market allows the entry of more than one firm (i.e. when it is very profitable). This result may look at odds with theories where private structures perform better with larger number of entrants (see for instance Vickers and Yarrow (1991) and Segal (1998)). A basic difference in our model lies in the intensity of competition that exists within private and regulated structures. Under privatization, private firms compete in quantities so that the addition of a firm does not fully eliminate market power and profits. In contrast, under the regulation regime, information costs dramatically fall when a second firm is added in the regulated market. Regulation is then more attractive. This result is congruent with the theory of adverse selection in which a rise in the number of agents reduces the cost of information revelation (see Auriol and Laffont (1993)).36 The case where regulated duopoly is preferred to 36 If we had considered that firms operating in the same industry have correlated costs, we would have used this correlation to implement yardstick competition, reducing further the cost of information revelation (see Auriol and Laffont 1993). 44 regulated monopoly is depicted in Figure 2 by the hatched area below the curve K RM/RD denoted RD. The fact that a private duopoly is not optimal sheds light on the link between market liberalization, on the one hand, and technological and/or product demand changes, on the other hand. Market liberalization, often referred to as ‘deregulation’, corresponds to the divestiture of the historical monopoly and the introduction of new entrants. As shown in Proposition 5 this is not equivalent to laissez-faire. In practice prices and entry remain regulated to protect consumers against collusion and predatory behavior (through licences and price caps for instance). This is important because in profitable industry the consumer surplus is high. Monopoly pricing then has more impact on welfare than it has on low profitability industry. In the framework of our model the divestiture of the historical monopoly is motivated by a drop of the ratio K/V . That is, by smaller fixed costs and/or by larger product demand. In figure 2 this corresponds to a downward shift, where industry structures move from regulated monopoly to regulated duopoly. The mobile and internet segment of the telecommunication industry provides an example of such a drop. Introduction of wireless technologies has significantly reduced the fixed costs to operate networks whereas the demand for communication has steadily increased. Consistently with our model, many developed and developing countries have deregulated their domestic telecommunication industry. Wallsten (2001), who studied telecom reforms in Africa and Latin America, found that privatization by itself does not yield improvements but that privatization combined with an independent regulator does.37 Similarly Estache (2002), shows that technical/productive efficiency gains generated by Argentina’s 1990s utilities privatization have not been transmitted to consumers. According to the author the benefits were captured by the industry because of inefficient regulation. The lesson to be drawn here is that privatization, being defined as a move from regulation to laissez-faire, is not optimal. When the ratio K/V is low, the consumer surplus is large.38 Regulation then is a key component of successful privatization reforms. 37 38 For more on the telecommunications reforms in developing countries see Auriol (2005). For instance Fuss, Meschi and Waverman (2005) estimates that in a typical developing country, an increase of ten mobile phones per 100 people boosts growth by 0.6 percentage points. The growth dividend is similar to that of fixed-lines phones in developed countries in the 1970s. 45 Appendix 4: Proof of Proposition 5 In this appendix we prove the general version of proposition 5 (i.e., for general distribution of cost parameter). Proposition 6 Suppose that assumptions A0 to A4 hold. Under condition C1, the optimal industrial policy under asymmetric information is to set: n • no production if K > max V, K • a private monopoly if K RM/P M • a regulated monopoly if K o (λ) ; (λ) < K ≤ V ; RM/RD • a regulated duopoly if K ≤ K RM n (λ) < K ≤ min K RM/RD RM/P M (λ), V o or if V ≤ K < K RM (λ); (λ). Condition C1 implies that a private duopoly is never optimal. The choice is between, no production, private monopoly, regulated monopoly or regulated duopoly. First of all recall that K RM/RD (λ), defined equation (36), is the value of the fixed cost such that the govern- ment is indifferent between a regulated monopoly and a regulated duopoly (i.e. such that EW RM (λ) = EW RD (λ)). A regulated monopoly is preferred to a regulated duopoly if and only if K ≥ K K≤K RM RM/RD (λ). Similarly a regulated monopoly is preferred to no production whenever (λ), defined equation (20). It is preferred to privatisation whenever K ≤ K RM/P M defined equation (21). Comparing equations (20) and (21) one can check that K RM/P M K RM (λ) > ˆ defined equation (17) (for λ < λ ˆ privatization is never an option so (λ) for all λ ≥ λ RM/P M that K (λ), (λ) is not defined). Moreover using the fact that gmin (β) ≤ 2g(β), one can check that V RD (λ) < 2V RM (λ) so that K RM (λ) > K RM/RD (λ). We deduce that if K > K RM (λ) regulation is never optimal. On the other hand if K > V privatisation is not possible. Putting all the pieces together yields the result. 46 Additional References FUSS, M., M. MESCHI and L. WAVERMAN (2005), ”The Impact of Mobile Phones on Economics Growth in Developing Countries”, The Economist, March 12th, p.p. 78. PICARD P.M. (2001) Optimal Employment Subsidies and Market Structures in Industries with Unemployment, Oxford Economic Papers, 53 (2), p 352-72 RAITH M. (1996), “A General Model of Information Sharing in Oligopoly”, Journal of Economic Theory, 71(1), pages 260-88. SAKAI, Y. (1985), “The Value of Information in a Simple Duopoly”, Journal of Economic Theory, 36(1), 36-54. SHAPIRO C. (1986), “Exchange of Cost Information in Oligopoly”, Review of Economic Studies, 53(3), p 433-46. SPENCE M. (1976), “Product Selection, Fixed Costs, and Monopolistic Competition”, Review of Economic Studies, 43(2), 217-35. WALRAS, L. (1936), “Etudes d’Economie Politique Aplliqu´ee: Th´eories de la Richesse Sociale”, Lausannes F. Rouge. 47