1
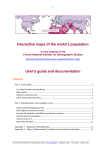
World population atlas. User's guide
The world population atlas is based on the latest United Nations statistics published
in 2007 (World Population Prospects, the 2006 Revision). It provides a range of data
on 230 different countries and regions, and for the whole world.
You can use its different windows to travel from one country to another, to see how
the situation changes over time, to rank countries or to compare them with each
other.
The world population atlas presents data in five different ways:
• The population pyramid provides a snapshot of the population of a selected
country or region for every year between 1950 (when the United Nations statistics
were first published) and 2050 (time horizon of their projections). Only the
medium projections, corresponding to the medium scenarios for fertility and life
expectancy trends, are given for the years after 2000;
• A series of demographic indicators give the values of the following indicators for
a selected year: population, population density, number of children per woman,
annual birth rate, annual death rate, annual growth rate, infant mortality, mean
length of life, population aged 65 and over;
• Curves showing the changes in a country or region of the world between 1950
and 2050 are presented for the ten following indicators: population size,
population density, mean number of children per woman, annual number of births,
annual birth rate, annual death rate, annual growth rate, annual infant mortality
rate, mean length of life, population aged 65 and over;
• Changes in a selected indicator in two different countries or regions can be
compared using a function which displays the two curves on the same graph;
• The general rankings of all the countries of the world classified in ascending or
descending order can be viewed for each selected indicator.
World population atlas. User's guide (cont’d)
Two examples of ways to use the world population atlas:
• First example: to see when the Indian population overtakes that of China. With a
population of over one billion, India is currently the world's second most populous
country after China. But India has a higher birth rate, with around three children
per woman on average, compared with below two in China. India's population
could catch up with that of China over the next twenty years and then overtake it.
By then, these two "population giants" will total 3 billion inhabitants between them,
around one-third of the world total!
• Second example: to find out which countries will have the highest populations in
the twenty-first century by looking at those with the highest birth rates today. The
rankings of the world's most populous countries will change radically in the years
to come. By observing in the atlas the annual number of births today, we can
identify the giants of tomorrow. Countries such as Pakistan, Indonesia and Nigeria
will move up the rankings, behind India and China, reaching the same level as the
United States, ahead of Europe.
Statistical data source: United Nations, World Population Projections (http://esa.un.org/unpp/)