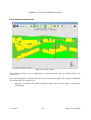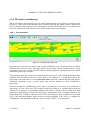
1
ARMINES / ECOLE DES MINES DE PARIS
–oOo–
FLUMY Project
Version 3.5
User's guide
December 2013
13/12/2013
-1-
flumy3.5_usersguide
ARMINES / ECOLE DES MINES DE PARIS
Table of contents
1
Introduction: the model ............................................................................................................ 5
2
Preamble .................................................................................................................................... 6
2.1
2.2
2.3
3
Download and install the software ...................................................................................... 6
Credits ................................................................................................................................. 7
Further information ............................................................................................................. 7
Input parameters ...................................................................................................................... 8
3.1
Overview ............................................................................................................................. 8
3.2
Initialization ...................................................................................................................... 10
3.2.1 Non-expert user ............................................................................................................. 11
3.2.2 Domain.......................................................................................................................... 11
3.2.3 Default parameters ....................................................................................................... 12
3.3
Topography ....................................................................................................................... 13
3.3.1 Surface .......................................................................................................................... 14
3.3.2 Graphical ZCut option .................................................................................................. 15
3.4
Wells ................................................................................................................................. 16
3.4.1 Input Wells .................................................................................................................... 17
3.4.2 User classes .................................................................................................................. 18
3.5
Channel ............................................................................................................................. 19
3.5.1 Erodibility ..................................................................................................................... 20
3.5.2 Channel ......................................................................................................................... 22
3.6
Avulsions .......................................................................................................................... 25
3.7
Aggradation....................................................................................................................... 27
3.7.1 Equilibrium Profile ....................................................................................................... 28
3.7.2 Flood ............................................................................................................................. 28
3.8
Seed ................................................................................................................................... 30
3.9
Status bar ........................................................................................................................... 31
4
Simulation: visualisation and results .................................................................................... 32
4.1
Launch............................................................................................................................... 32
4.1.1 Direct launch ................................................................................................................ 32
4.1.2 Reset and journal file .................................................................................................... 32
4.1.3 Saving a Project ............................................................................................................ 33
4.1.4 Message windows.......................................................................................................... 33
4.2
Settings menu .................................................................................................................... 34
4.2.1 Facies Colours .............................................................................................................. 34
4.2.2 Refreshment period ....................................................................................................... 35
13/12/2013
-2-
flumy3.5_usersguide
ARMINES / ECOLE DES MINES DE PARIS
Visualisation of simulation ............................................................................................... 36
4.3
4.3.1 Graphical views ............................................................................................................ 36
4.3.2 General operators ......................................................................................................... 37
4.3.3 2D Aerial view .............................................................................................................. 38
4.3.4 Vertical section view ..................................................................................................... 40
4.3.5 3D aerial view ............................................................................................................... 42
4.3.6 2D views in conditioning .............................................................................................. 43
4.3.6.1 Cross-sections ....................................................................................................... 43
4.3.6.2 Aerial view ............................................................................................................ 44
4.4
Output ............................................................................................................................... 45
4.4.1 Project Folder ............................................................................................................... 45
4.4.2 Exported files ................................................................................................................ 46
4.4.3 General statistics .......................................................................................................... 46
4.4.3.1 Vertical proportion curve (VPC) .......................................................................... 47
4.4.3.2 Proportion Matrix.................................................................................................. 49
4.4.3.3 Wells Vertical Proportion Curve .......................................................................... 50
4.4.3.4 Wells Histogram ................................................................................................... 51
4.4.3.5 Conditioning Statistics .......................................................................................... 52
5
Files formats ............................................................................................................................ 53
5.1
General comments ............................................................................................................ 53
5.2
Grid files ........................................................................................................................... 55
5.2.1 Flumy Generic Grid format .......................................................................................... 55
5.2.2 Topography (IN/OUT) .................................................................................................. 56
5.2.3 Erodibility map (IN/OUT)............................................................................................. 57
5.2.4 3D block (OUT) ............................................................................................................ 58
5.3
Channel centerline (IN/OUT) ........................................................................................... 59
5.4
Well file (IN/OUT) ........................................................................................................... 60
5.4.1 Format for a vertical well ............................................................................................. 62
5.4.2 Format for a non-vertical well...................................................................................... 63
5.4.3 Format for a non-standard well.................................................................................... 64
5.5
Journal file (IN/OUT) ....................................................................................................... 65
5.6
Colours file (IN/OUT) ...................................................................................................... 68
6
Additional information ........................................................................................................... 69
6.1
6.2
6.3
6.4
6.5
6.6
7
Range of values ................................................................................................................. 69
Usual range of values ........................................................................................................ 72
Some sensibility analysis .................................................................................................. 74
Additional hints................................................................................................................. 75
Facies and Grain Size........................................................................................................ 76
Some references ................................................................................................................ 77
User’s comments ..................................................................................................................... 78
13/12/2013
-3-
flumy3.5_usersguide
ARMINES / ECOLE DES MINES DE PARIS
13/12/2013
-4-
flumy3.5_usersguide
ARMINES / ECOLE DES MINES DE PARIS
1 Introduction: the model
This FLUMY software (follow-up of MCRC) is a modelling tool, both process-based and
stochastic, for a meandering channel and its associated deposits at the scale of the reservoir. The
model is based on the evolution in time of the channel by migration, cut-off and avulsion, and on
the deposition of point-bar sand, mudplug, crevasse splays, overbank alluvium and organic matter.
In the FLUMY working space (after a possible 2D rotation around an origin from the geographical
space), the floodplain is discretized as a rectangular 2D grid. The channel can flow in any direction.
The flow direction is parallel to a slightly deeping reference plane with a given global floodplain
slope. Time is discretized into iterations, or time steps. At every time step, e.g. year (and except for
a few punctual events), migration is performed. This is favoured by the erodibility, either constant
over the domain, or defined as a map on the discretized grid (optionally 3D). When overbank flood
occurs, alluvium is deposited on the floodplain, with thickness and granulometry decreasing
exponentially from the channel. The aggradation (or on the contrary the incision) may be
constrained by the distance between the elevation of the floodplain, and an equilibrium profile
parallel to the reference plane and also varying in time. Peat (or wetland) may be deposited in the
lowlands, the lower parts of the domain with respect to the reference plane. At some times
(coinciding with overbank floods or not), a levee breach may occur within the domain, producing
either a chute cut-off, or a crevasse splay of type I, that may evolve into a crevasse splay of type II,
and possibly into an avulsion. In addition to such local avulsions, regional avulsions may be caused
by levee breaching upstream of the domain, resulting in a change of the entry point.
All this meandering sedimentation may take place within given sedimentary units defined by
topographic surfaces (possibly planes with given elevation). Facies other than resulting from
meandering sedimentation may be deposited between two topographic surfaces. Imported surfaces
may be used to replace, erode, or aggrade the current topography. An imported surface may also
correspond to an upper stratigraphic surface, to which the deposition will tend.
A conditioning process is used to honour vertical well data. It aims at reproducing at each iteration
the local conditions of deposition (assuming that the system is aggrading, or at least not incising),
so that the process deposits preferentially (but not 100%) what is expected at data points. The
process is thus expected to provide plausible realizations of the model when the density of the wells
is reasonable (typically 1 to 10 wells).
The basic output block model consists, at each node of the 2D grid, in successive deposition units
with variable height, informed in facies, age and granulometry.
13/12/2013
-5-
flumy3.5_usersguide
ARMINES / ECOLE DES MINES DE PARIS
2 Preamble
2.1 Download and install the software
The last demo version of the Flumy software is available in the web site www.cg.ensmp.fr/flumy.
The trial, standard or full version is available on demand. - Download the Flumy archive file to
your local computer: windows 32 bits, windows 64 bits, linux 32 bits or linux 64 bits (with your
linux distribution doesn’t have the 32 bits support).
Extract the contents of the archive file in a directory of yours, ex: C:\Program Files (windows),
/home/user (linux)
A new directory flumy_W.XYZ should be created (where W.XYZ is the Flumy software version
number). You will find in this directory a bin directory in which there is a program named flumy
(or flumy.exe depending on your Windows Explorer settings).
Double-click on it to start the program.
The program will ask you to register the software (needed only one time). If you don’t want to
register the software yet, you can launch the demonstration version, otherwise:
Send us by email the activation code, the release version and the program name displayed and we
will send back to you the corresponding serial number. Each [activation code, serial number] pair is
unique by computer. Once the software is unlocked the “about software” window indicates details
of the current running version.
The full set of parameters is only available in the full version. The trial version is limited for a
period of one month and has no exportation feature.
Supported operating systems are the followings:
-
Windows 32 or 64 bits
Linux 32 or 64 bits
Delivery folder description:
-
bin: executable files
data: sample files for importation features (centerline, well, topography and erodibility
map) and color palettes
doc: this usersguide and tutorials
13/12/2013
-6-
flumy3.5_usersguide
ARMINES / ECOLE DES MINES DE PARIS
2.2 Credits
The Flumy software is the property of ARMINES / MINES ParisTech. The free demonstration
software is for an academic used only. The Flumy standalone software is given without any
guarantee. ARMINES / MINES ParisTech is not responsible of any damage that this software
could do to your data or to your computer.
Figure 1 : About the software
2.3 Further information
If problems remain, please contact [email protected]
13/12/2013
-7-
flumy3.5_usersguide
ARMINES / ECOLE DES MINES DE PARIS
3 Input parameters
3.1 Overview
When running the program, an interface window opens. Parameter values, and names of possible
data files, are to be entered through the tabs of the interface window: these are described in this
Section 3. Alternatively, they can be entered by launching the journal file from a previous
simulation (see Section 4.1), or by opening an existing Project Folder to re-use a previous
simulation (see Section 4.4.1). Note that when running the program, all the inputs, as well as the
saved simulation results are stored within a Project Folder, including the journal files.
Remark: The subdirectory data initially contains examples of channel centerline and erodibility
maps, as well as examples of journal files and well file.
Parameters units are:
-
Lengths: in meters
Time:
- either in seconds (ex: erodibility coefficient 2 E-8, corresponding to velocity in m/s)
- or in iterations, assuming 1 iteration = 1 year.
In the interface window, decimal numbers must be entered with a decimal point, or a decimal
comma, according to the environment (in files, only decimal point is to be used, see chapter 5).
The interface window contains several tabs described below.
Each tab (except the Summary tab which gives a summary of the key parameters) contains several
fields corresponding to the parameters to be informed.
For some fields, a choice of options is proposed by using the Edit button.
A table giving possible values for key parameters is provided in chapter 6.
13/12/2013
-8-
flumy3.5_usersguide
ARMINES / ECOLE DES MINES DE PARIS
Figure 2 : Summary
13/12/2013
-9-
flumy3.5_usersguide
ARMINES / ECOLE DES MINES DE PARIS
3.2 Initialization
Figure 3 : Initialization
13/12/2013
- 10 -
flumy3.5_usersguide
ARMINES / ECOLE DES MINES DE PARIS
3.2.1 Non-expert user
The non-expert user pre-calculator uses 3 input key parameters:
* The Channel maximum depth (in m)
* The horizontal Sandbodies extension (in m) OR its ratio to maximum channel depth
(characterizing the type of channels, from 30 for ribbon-type, through 100 for standard, to 250 for
sheet-type)
* The Net-to-gross % (i.e. sand proportion)
Default values are proposed. When applying these 3 parameters, the values of all main Flumy
parameters are computed automatically by a pre-calculator. The user has the possibility to
compute/update also the grid size.
The user always keeps a direct access to the usual Flumy parameters. In particular he can use the
non-expert user facilities for a first guess of the parameters.
Note that the pre-calculator (like the forecast tool, section 3.8) is based upon formula developed for
Flumy that aim at giving only orders of magnitude.
3.2.2 Domain
* Grid Lags (mesh size) of the grid along Flumy Ox and Oy axes (real numbers, in meters)
(default, 20, 20).
* Size of the 2D grid: the user has the possibility to enter the size, through one of the two options:
-
Give Grid Sizes (in meters) along Ox and Oy axes (default 2000, 1600),
Give Number of Nodes along Ox and Oy axes (default nx = 101, ny = 81).
- Note:
- When choosing one option, the data of the other option will be automatically
calculated and displayed on the dialog window.
- Simulations with a number of nodes (nx*ny) above 500 000 may be slow. The
maximal number of nodes (nx*ny) is 1 000 000.
* Grid Location (in m): real numbers in meters giving the Longitude and the Latitude coordinates
of the origin of the 2D grid (standard way: southwestern point of the grid - equivalently cell center)
(default, 0, 0).
* Grid Elevation (in m) at the origin, giving the elevation reference level (default = 0). This is
displayed as a black horizontal line in vertical section views.
* Grid Rotation: angle in degrees (default 0), counted anticlockwise, giving the rotation around
the grid location origin to be applied to go from the geographical x-axis (West to East) to the new
x-axis of the working space.
13/12/2013
- 11 -
flumy3.5_usersguide
ARMINES / ECOLE DES MINES DE PARIS
Bounding box = Simulated domain
x
y
2
2
Grid rotation equal to +30°
1
O
Geographic x axis
(West to East direction)
Figure 4 : Grid convention
Determination of the floodplain 2D grid in the geographical space
-
Note:
- Numbering corresponds to the numbering of x or y sections (visible in section views)
(origin of the 2D grid is at the intersection between x-section 1 and y-section 1.)
- For x- and y-lags equal to 100 m, the above 2D grid size is 600m (along x) and 300m
(along y) and the simulated domain size 700m (along x) and 400m (along y). Number of
nodes nx = 7, ny = 4
3.2.3 Default parameters
All Flumy default parameters can be restored by the button “Restore default parameters”.
13/12/2013
- 12 -
flumy3.5_usersguide
ARMINES / ECOLE DES MINES DE PARIS
3.3 Topography
Figure 5 : Topography
13/12/2013
- 13 -
flumy3.5_usersguide
ARMINES / ECOLE DES MINES DE PARIS
3.3.1 Surface
* Whenever he wants, the user can choose to use a surface (topography), defining its Surface type:
-
None (No input surface is used)
either as a Constant Elevation, with the Elevation in m (including grid elevation – see
section 3.2.2);
or as a File (ASCII file at F2G Format, see chapter 5.2.1)
* Then the user has to choose between one of these Operations:
-
Replace the current topography by the Imported Surface;
Aggrade the current topography up to the Imported Surface;
Erode the current topography down to the Imported Surface;
Erode the lower part of the simulation up to the Imported Surface;
Stop the simulation when the Imported Surface is exceeded (Upper limit).
The 4 first cases correspond to a punctual operation (the program runs 1 iteration, and the user has
to switch off this operation to be able to do something else, see section 4.1.1). The fifth option is
not a punctual operation. The user can display the upper limit topography in 2D aerial view and
vertical section views by pushing the Key “u”. The upper limit is used as long as the user doesn’t
change the Surface Type parameter to None.
* The Filling Facies is used to fill possible gaps up to the imported surface for the two first
options. The user has the choice between:
-
either Undefined;
or Draping.
Figure 6 : Imported topography and upper limit
In the example above, at startup, the user replaces the topography to load initial basement, then
setup the upper limit during the simulation run.
13/12/2013
- 14 -
flumy3.5_usersguide
ARMINES / ECOLE DES MINES DE PARIS
3.3.2 Graphical ZCut option
* Graphical ZCut option: this is a purely visual tool (not recorded in the journal file) that allows
displaying the simulation as intersected by a given surface, when using the key “/” or the icon: .
-
File: contains the intersection surface (ASCII at F2G format,, see chapter 5)
5).
Elevation offset (m): value to be added to the elevation values of the intersection surface
(including grid elevation – see section 3.2.2).
Figure 7 : Vertical section view with ZCut option
Figure 8 : 3D view with ZCut option (vertical scale exaggerated)
This option is the best tool to understand the observed outcrops on a fossil reservoir.
13/12/2013
- 15 -
flumy3.5_usersguide
ARMINES / ECOLE DES MINES DE PARIS
3.4 Wells
Figure 9 : Wells
13/12/2013
- 16 -
flumy3.5_usersguide
ARMINES / ECOLE DES MINES DE PARIS
3.4.1 Input Wells
The Wells can be added before the first iteration (before simulation has started). Each well should
be described in one ASCII file. The format of a well ASCII file is given in the section 5.2.9.
* Well list: list of the wells loaded for the conditional simulation. The user can Add well(s) to the
list, Delete well(s), or Clear (delete all wells from the list). In the case a well is not vertical, it will
be kept as a single well, but will be split automatically into pseudo-vertical bits corresponding to
the intersections of the well with the cells of the 2D Flumy grid (grid points being centered in
cells).
* Relaxation (in %, between 0 and 100, default 10%):
-
a high relaxation will result in a more rapid simulation, less constrained by the deposition of
sand exactly at sand data
a low relaxation will be constrained by the deposition of sand exactly at sand data, but may
deposit too much sand globally.
In details:
Relaxation = probability of unblocking aggradation in the conditioning process. Aggradation
is being blocked when for instance Point Bar sand must be deposited at a well location, and
when channel is getting too high (see Section 4.3.5). While attraction of the channel to the
well data is simultaneously favoured, the process may run a too long time and deposit a too
large quantity of sand at this level, before sand data at the well is honoured. A compromise
between exactness at well data and better reproduction of facies Vertical Proportion Curves
can then be obtained by relaxing the process, i.e. allowing aggradation with a given
probability. Aggradation is never blocked if relaxation = 100%.
* The Closure limit (in m, default is 0.1m) can be defined to allow Flumy ignoring the little non
sand interval. If used, Flumy will ignore each non sand interval where vertical thickness is less than
the Closure limit. This is a way to improve the conditioning process by grouping successive sand
interval all together.
-
Note: Another transparent operation is dynamically applied by Flumy to improve
conditioning process. It consists in virtually replacing all small sand interval (where
thickness is less than half the maximum channel depth) by a less constraining facies CS1. It
implies that small sand interval wouldn’t be honoured by Flumy.
* The Fill Nexus button is a way to automatically fill the three nexus parameters deduced from the
well data analysis (see Section 3.1.1). The Channel maximum depth is deduced from the analysis of
the sand well sample thicknesses. The extension ratio is deduced by a heuristic formula and the Net
to Gross corresponds to the sand proportion observed in the wells.
13/12/2013
- 17 -
flumy3.5_usersguide
ARMINES / ECOLE DES MINES DE PARIS
3.4.2 User classes
* The User classes feature is a way to convert non standard wells into Flumy facies well. Either
discrete or continuous well can be used. In case of discrete well, the user must associate each
discrete attribute observed into the well (the value) to the corresponding Flumy facies (see section
5.1). In case of continuous well (i.e. porosity property), the user muse defines for each interval
(min/max) the corresponding Flumy facies. The user can choose a name and a colour for each class.
These information are used by the Histogram feature in Attribute mode (see section 4.4.3). The
classes must be ordered in decreasing grain size. The Master check box indicates which class will
be used when converting back simulation Flumy facies into a user class (see exporting the
simulation result at section 4.4.2)
13/12/2013
- 18 -
flumy3.5_usersguide
ARMINES / ECOLE DES MINES DE PARIS
3.5 Channel
Figure 10 : Channel
13/12/2013
- 19 -
flumy3.5_usersguide
ARMINES / ECOLE DES MINES DE PARIS
3.5.1 Erodibility
The higher the erodibility, the more rapid the migration of the channel and the thickner the
PointBar deposits. Hence the erodibility is used to control (eg favoring or slowing down) the
channel migration (the migration of the channel at a given location is proportional to the velocity
perturbation at its outer bank and to the erodibility). The erodibility can be constant over the
domain, or variable (2D or 3D map).
Seismic block could be input into Flumy as erodibility map (assuming that sand probability
property coming from the seismic block can be assimilated to an erodibility coefficient:
-
low probability => low erodibility => less sand to be deposited
high probability => high erodibility => more sand to be deposited
The user can give:
* Emap (Erodibility map) mode:
-
Constant: the erodibility is constant over the domain, equal to the erodibility coefficient
Loaded from file (absolute values [0, 1.E-7] – possibly an Erodibility map built from the
Centerline, see section 4.4.2)
Loaded from file (relative values – each value is converted into absolute value, see
further)
Dynamic (upper limit) (the upper limit is used as a conditioning stratigraphic top surface)
* Erodibility coefficient: (real number ≤ 1.E-7), default = 2.E-8 ; this value was found to produce
a realistic channel evolution (after Sun, 1996). (A velocity perturbation of 1 m/s then gives a
migration of 2.E-8 m per s, i.e. 0.3156 m per year.) This value is preferably not to be changed, as
this is used by the pre-calculator (favoring migration can still be obtained by reducing aggradation
and avulsions).
-
Note: erodibility values can vary from 0 to a maximum of 1.E-7. Negative values will be set
to 0. Values larger than 1.E-7 are set to this value. An erodibility value of 0 corresponds to
locations where no migration is desired.
* Emap File:
For the 3 last options, the Emap is read from an ASCIII file. The file must have the F2G format
(see section 5.2.2).
* Emap with absolute values:
In this case, absolute values [0, 1.E-7] of erodibility are read. The Erodibility coefficient is ignored.
13/12/2013
- 20 -
flumy3.5_usersguide
ARMINES / ECOLE DES MINES DE PARIS
* Emap with relative values:
This option is to be used when the input values are not absolute erodibility values (i.e. seismic
block assumed as sand probability). The user then can input:
-
The Erodibility Coefficient (default E = 2.E-8)
The Offset (default e0 = 0)
The relative values on the domain ei will be transformed into absolute values Ei, first by subtraction
of the offset, then by rescaling their mean to the Erodibility Coefficient.
Hence the offset corresponds to 0 erodibility, and the Erodibility Coefficient corresponds to the
mean erodibility over the domain (unless resulting values smaller than 0 or larger than 1.E-7 are
found, that are set to these).
It is preferable not to change the default Erodibility Coefficient, as this is used by the precalculator.
An offset equal to (or larger than) the minimum of the input relative values corresponds to a very
high confidence in the input Emap, as strictly 0 erodibility values will be present.
Ei = E
ei − e0
mean of ( ei − e0 )
* Emap “Dynamic (Upper limit)”
In Flumy, it is possible to introduce an imported surface so that the simulation will stop when this
is exceeded everywhere. In the case this imported surface represents an erosional surface, the user
then has just to replace the actual topography by the imported one. In the case the imported surface
represents an upper limit to be approximately reached by the sedimentation (i.e. a stratigraphic
surface), an Emap “Dynamic” is to be used during the simulation, that favours at any time new
location of channel and so deposition preferentially where the imported surface to be reached is the
highest above the actual topography.
13/12/2013
- 21 -
flumy3.5_usersguide
ARMINES / ECOLE DES MINES DE PARIS
3.5.2 Channel
Channel cross-section: is parabolic, defined by its width and mean depth. Recommended values are
given in section 6.1.
* Width (in meters) (default, 40 m)
* Maximum depth (in meters). This is the maximum channel depth over a normal cross-section
(default, 4 m). The maximal depth is 1.5 the mean depth for a parabolic cross-section.
* The Auto buttons permit to automatically calculate the Width (resp. the Maximum depth) from
the Maximum depth (resp. the Width) using the following formula:
W = 10 × Dmax
Dmax =
W
10
* Import centerline: Unless a centerline data file is given, a centerline will automatically be
generated (similarly to a regional avulsion, see section 3.6). The user has the possibility to load a
given channel (ASCII file including discretization points of the channel centerline in 2D or 3D in
geographical coordinates; see format in section 5.3). The first point must be upstream of the
domain, the last point must be downstream of the domain. Loading a centerline corresponds to a
punctual operation (the program runs 1 iteration, and the user has to switch off this operation to
be able to do something else, see section 4.1.1).
The Channel Centerline is saved within the Project Folder, when using Save Project in the menu
File at the current iteration. Further running of the simulation will use the 3 coordinates to locate
the channel on top of the previously saved simulation.
When importing a pre-existing Channel Centerline, the z coordinate of centerline channel points is
not used. The channel centerline is placed at the surface of the floodplain topography and the
channel cuts through the underlying volume.
Initial centerline
Floodplain surface
channel section
Figure 11 : Channel section
The channel is vertically positioned by the elevation of its centerline. Changing the width and the
depth of the channel cross-section does not change this elevation. An important exception is when
reducing both width and depth to less than ¼ of their previous values. Then the elevation of the
new centerline corresponds to the bottom of the previous channel: this allows building nested
channels, with the small channel located at the bottom of the previous large channel.
13/12/2013
- 22 -
flumy3.5_usersguide
ARMINES / ECOLE DES MINES DE PARIS
* Domain margin: longitudinal and lateral extensions of the domain, used to remove artificial
border effects within the domain when the channel migrates or aggrades, given as a multiple of the
channel width. Default is fixed to 10: this corresponds to the development of one meander
according to the relationship (Leopold, Wolman, Miller, 1964): Lm = 10.9 × w1.01 where Lm is the
meander wavelength and w the bankfull width.
* Flow Direction: direction of the slope of the reference plane, given in degrees clockwise from
South to North direction (default, 90°, i.e. from West to East). 0° is South to North direction. (See
next figure)
* Slope along Flow Direction: value of the slope of the reference plane, dipping in the direction of
the flow direction (default, 0.001).
* Friction Coefficient: friction of the substratum. The higher this coefficient, the greater the
meander wavelength is important. (default, 0.01)
13/12/2013
- 23 -
flumy3.5_usersguide
Geographic y axis
(South to North direction)
ARMINES / ECOLE DES MINES DE PARIS
Flow direction
equal to +120°
Domain margin
x
y
Grid rotation equal to +30°
Geographic x axis
(West to East direction)
Extended domain
Figure 12 : Flow direction toward grid orientation
13/12/2013
- 24 -
flumy3.5_usersguide
ARMINES / ECOLE DES MINES DE PARIS
3.6 Avulsions
Figure 13 : Avulsions
13/12/2013
- 25 -
flumy3.5_usersguide
ARMINES / ECOLE DES MINES DE PARIS
* Regional avulsion (default is periodic 2200) (upstream of the domain): four options are offered
for its period (never, always, periodic or Poisson). These avulsions can be considered to be caused
by successful levee breaches upstream of the domain, and result in a new path within the domain
(extended with its lateral margins to avoid border effects, see previous section).
* Local avulsion (default is periodic 1300) (within the domain): four options are offered for the
period of levee breaches that occur independently from overbank floods (never, always, periodic or
Poisson).
The user has to click on the Edit button to customize the period value.
* Levee breaches During Aggradation: select this option to make levee breaches during overbank
floods. (default is false)
In the model, a levee breach occurs preferentially at banks where the velocity and erodibility are
higher. It produces:
-
either a chute cut-off (reconnecting the channel at a distance less than 10 times the channel
width),
or a Crevasse Splay of type I “CSI” (erosive and elongated). CSI may evolve into a CSII
(non-erosive Crevasse Splay of type II), on which CS Channels may be automatically and
iteratively added. The user can specify:
* The Probability for transition from CSI to CSII (default 0.5)
* The Probability for adding a new CS Channel on CSII (default 0.9)
Finally CSII may lead to a successful local avulsion (new path), with the probability:
S=
S1
( S0 + S1 )
where S1 and S0 are the slopes of the old path and new path downwards.
13/12/2013
- 26 -
flumy3.5_usersguide
ARMINES / ECOLE DES MINES DE PARIS
3.7 Aggradation
Figure 14 : Aggradation
13/12/2013
- 27 -
flumy3.5_usersguide
ARMINES / ECOLE DES MINES DE PARIS
3.7.1 Equilibrium Profile
The equilibrium profile corresponds to a plane parallel to the reference plane and its elevation can
vary in time.
The equilibrium profile controls the rate of aggradation/incision. Test on the potential
aggradation/incision is made at every overbank flood. Then, the aggradation will be limited by the
distance of the equilibrium profile above the floodplain topography (the system is free if the
distance exceeds the overbankflood intensity - see section 3.7.2.2). Incision will occur if the
equilibrium profile is lower than the floodplain topography.
* Elevation (in meters): elevation (including grid elevation – see section 3.2.2) of the equilibrium
profile above the reference plane, at the beginning of the sequence of iterations. By default it is
inherited from the elevation of the Equilibrium Profile at the end of the previous sequence, if any.
* Changes (in number of iterations): changes of the equilibrium profile elevation can occur: never,
at each iteration, periodically, or randomly following a Poisson process. (default is never)
* Variation (in meters): variations of the elevation when changes occur can be constant or follow a
probability distribution whose parameters are to be chosen: uniform (between a min and a max),
normal (with given mean and standard deviation), lognormal (with mean and standard deviation of
this, not of its log).
-
Note: Variations can be positive or negative.
The elevation of the Equilibrium profile is output in the Status bar (see section 3.9).
To deactivate the equilibrium profile, set a very high elevation and never change its value.
3.7.2 Flood
* The options for Aggradation type are:
-
None
No aggradation
Draping
At each occurrence a constant Draping layer thickness is deposited everywhere on the
floodplain:
- to build a basement at the beginning of the simulation (with a thickness
exceeding the maximal channel depth) or
- to protect a (imported) topography surface from being incised by the channel
(with a thickness exceeding the maximal channel depth)
- to simulate external sediment deposition
- Note:
- Draping is not affected by the Equilibrium Profile.
- Wetland Proportion is inactive when draping is used
13/12/2013
- 28 -
flumy3.5_usersguide
ARMINES / ECOLE DES MINES DE PARIS
-
Overbank Floods
At each occurrence, alluviums are deposited on the floodplain starting from the channel to
the maximal distant.
* Occurrence (default is periodic 60) (in number of iterations): draping or overbank floods can
occur: never, at each iteration, periodically, or randomly following a Poisson process.
-
Note: This period also rules the control on aggradation as well as incision when equilibrium
profile is used (see section 3.7.1).
* Thickness (default 0.281 m) (in meters): maximum thickness deposited on levees during an
overbank flood. It can be constant or follow a probability distribution whose parameters are to be
chosen: uniform (between a min and a max), normal (with given mean and standard deviation),
lognormal (with mean and standard deviation of this, not of its log).
* Wetland proportion (default 0%) (in percentage): extension of lowlands, to be covered by peat
in between two successive overbank floods, entered as a maximal proportion of the floodplain area.
-
Note: the aerial view, it may be partly covered by the overbank sediment deposited just
afterwards.
* Draping Facies: only active when using Draping mode. Indicates which facies (“Draping” or
“Undefined”) will be deposited
* Thickness Exponential Decrease (default 1000 m) (in meters): scaling distance of the negative
exponential distribution which rules the decreasing of alluvium thickness away from the channel.
The deposited thickness is thus 37%, 14% and 5% of the maximum thickness, respectively at one,
two or three times this scaling distance from the channel.
* Levee Width (as a multiple of channel width, default 6): define the distance from the channel
centerline of the frontier between Levee and Overbank facies.
Look at section 6.5 to see grain size distribution for Levee and Overbank facies.
13/12/2013
- 29 -
flumy3.5_usersguide
ARMINES / ECOLE DES MINES DE PARIS
3.8 Seed
Figure 15 : Seed
* Seed: the simulation is stochastic and the seed value (typically a natural number with several
digits) is used to generate the series of random numbers that are used. 0 is forbidden.
A given simulation can be reproduced by taking the same seed value at the beginning of the
simulation (while keeping the other parameters unchanged). On the contrary, changing the seed
value results in a different, equiprobable, simulation.
13/12/2013
- 30 -
flumy3.5_usersguide
ARMINES / ECOLE DES MINES DE PARIS
3.9 Status bar
The status bar located at the bottom of the interface window shows several launching options for
the simulation (see section 4.1)
Under the control buttons, the following parameters are output:
-
status (ready, simulating),
current iteration (updated at every refreshment loop),
current elevation of the equilibrium profile,
the current sinuosity (approximated as full channel length divided by its curvilinear length),
when using an upper limit, the percentage of surface that is above this upper limit,
the forecast of sand proportion in % and aggradation rate in m/10000 iterations (these are
supposed to give an order of magnitude for Net to Gross and for aggradation rate, according
to heuristic formulas; the values are updated using the current parameters only when the
simulation has been launched).
13/12/2013
- 31 -
flumy3.5_usersguide
ARMINES / ECOLE DES MINES DE PARIS
4 Simulation: visualisation and results
Outputs are available:
-
through the status bar at the bottom of the interface window (see section 3.9)
as text, giving the list of simulated events and actions (on Linux, in the terminal from which
the software is run; on Windows or Linux, in the Messages Window);
in one or several graphic windows;
as output files.
4.1 Launch
4.1.1 Direct launch
Directly from the interface window (lower tool bar), or from the File menu, the user can:
-
Launch the simulation
Pause the simulation
Launch until a given iteration number (default: the next iteration). The window opens,
giving the elapsed time and the remaining time for the launched simulation.
use Refreshment loop to launch the simulation for a number of iterations equal to the
Refreshment period (which can be modified in Settings, default 100 iterations)
Exit from the program.
Note: this procedure combined with a Refreshment period of 1 allows to see every step of
the simulation. However, it is slowing down the calculations.
Remark: some operations are punctual events, each one being performed exclusively from all
other operations in 1 iteration only. After this iteration, the program pauses whatever was asked and
the user has to switch off the operation just performed to do something else. These punctual events
are, in the order they are to be performed:
import topo in order to replace (or aggrade or erode) current topography by the imported surface
(then a new channel is generated);
import a centerline. (a new channel is also generated).
4.1.2 Reset and journal file
Each Launch (Launch, Launch until, or Refreshment loop) corresponds to a sequence of 1 or more
iterations. The simulation is thus processed by sequences of time iterations (make a distinction
between: - a sequence of iterations; - and a geological sequence, which can for instance be
simulated with several sequences of iterations). Some of the parameters, sequence parameters, can
be changed at every sequence. The other parameters are initial parameters, and will be valid all
along the simulation (typically the domain to be simulated and conditioning wells). The list of the
operations performed (initial parameter values and the different sequences of iterations with their
parameter values) is automatically recorded in a journal file, stored in the Project Folder (see
section 4.4.1).
13/12/2013
- 32 -
flumy3.5_usersguide
ARMINES / ECOLE DES MINES DE PARIS
From the interface window (lower tool bar), or from the File menu, the user can also:
Reset the simulation to start a new simulation. Then the user has the possibility to replay the
sequences that were automatically recorded in the old journal file. The options are the same than
when launching a journal file, see just further.
-
Note: When using the Reset button, the saved results within the Project Folder are deleted.
From the File menu, the user can also:
-
Launch journal file to launch a simulation according to the parameters stored in a previous
journal file.
Then, from either the interface window (lower tool bar), or the File menu, the user can:
-
Choose Batch to execute the journal file with no stop
Choose Iter. Sequence to execute the next sequence of iterations of the journal file
Skip sequence of the journal file, and
Jnl Exit from the journal (jnl) file.
Of course, the user can also introduce additional Launch between the sequences that were recorded
in the journal file.
4.1.3 Saving a Project
The user can save the project at the current iteration using the menu option File / Save Project.
Each time the user save a project, a “simulation snapshot” is stored into the project folder (see
section 4.4.1).
The user can save the current project to a new one using the Save Project As option in the File
menu.
The user can navigate forward or backward step by step (snapshot to another snapshot) using the
corresponding options in the File menu.
Finally an existing project can be reloaded to continue a previous work using the Open Project
menu option. Flumy automatically loads the last available snapshot in the project folder (see
section 4.4.1)..
By default, Flumy starts within the last used project.
4.1.4 Message windows
The File menu contains also a check box which permits to open/close a Messages Window
containing information about simulated events, warnings and errors. This window can be emptied
using the Clear button.
13/12/2013
- 33 -
flumy3.5_usersguide
ARMINES / ECOLE DES MINES DE PARIS
4.2 Settings menu
4.2.1 Facies Colours
Use the menu Change facies colours to display the different facies with their default colours, and
possibly to change these. The user can also Load facies colours or Save facies colours. (see file
format section 5.7)
Figure 16 : Facies
Look at section 6.5 to see more details on the Facies handled by Flumy.
13/12/2013
- 34 -
flumy3.5_usersguide
ARMINES / ECOLE DES MINES DE PARIS
4.2.2 Refreshment period
All graphical views are refreshed every N iterations where N is the Refreshment period. Default is
N = 100 iterations. Choosing N = 1 enables to see each iteration.
-
Note: However that a low value may increase considerably computation time.
13/12/2013
- 35 -
flumy3.5_usersguide
ARMINES / ECOLE DES MINES DE PARIS
4.3 Visualisation of simulation
When running the program, a first graphic window opens at the same time as the interface window.
More New graphic window can be opened with the File menu. This allows visualizing
simultaneously different
erent views of the simulation at the same time.
-
Note: Each window is independent from the others. Closing the first graphical window,
will close all others.
The key ‘h’ permits to display in the Message Window (File menu) all the keyboard shortcuts
available in graphical views.
4.3.1 Graphical views
The different graphical views and associated shortcuts are the following:
Key a
To display the 2D aerial view
Key x
To display the vertical cross section in the (y,z) plane (Looking in upstream
direction – x decreasing))
Key y
direction)
To display the vertical cross-section, in the (x,z) plane (Looking in y increasing
Key 3
To display a 3D aerial view of the top topography
13/12/2013
- 36 -
flumy3.5_usersguide
ARMINES / ECOLE DES MINES DE PARIS
4.3.2 General operators
These operators are available in all graphical views:
Key r
To reset the view
iew to the default graphical parameters
Key d
To display current deposits using facies colours
Key g
To display current deposits using grain size colour
colours (see section 6.5)
Finest grain size class
0
1
2
3
4
5
6
7
8
9
10
11
Coarsest grain size class
12
13
14
15
Figure 17 : Grain size colour scale
Key G
To display current deposits using facies colour darkening with grain size increasing
Key A
To display current deposits using facies colour darkening with old age and grain size
increasing. The colors for PB, LV and OB change with grain size and age of deposits. The PB
deposit is yellow, getting red when older. The LV/OB deposits vary from yellow to red away from
the channel, becoming red to black when older.
Key c
To display or to hide the grid-discretized
grid discretized channel within the modelled domain
Key C
To display or to hide the real channel.
Key s
To display or to hide the location of the red cursor (vertical
vertical sections
sections)
Key z
To decrease the vertical exaggeration
Key Z
To increase the vertical exaggeration
Key /
To display the simulation eroded from the top by a ZCut surface
surface, see section 3.3
Key f
To make a screenshot of the graphic window (tiff file)
Arrows
To move the red cursor location (vertical sections)
13/12/2013
- 37 -
flumy3.5_usersguide
ARMINES / ECOLE DES MINES DE PARIS
4.3.3 2D Aerial view
Figure 18 : 2D aerial view
13/12/2013
- 38 -
flumy3.5_usersguide
ARMINES / ECOLE DES MINES DE PARIS
Keys used to control the 2D aerial view within a window:
Key e
To display the erodibility map. When displaying the erodibility map, the facies are
hidden. The erodibility has the following colour scale:
0
1.E-7
1.E
Figure 19 : Scale of erodibility, from 0 (black) and
and low values (red) up to 1.E
1.E-7 (dark green)
Key $
To display ann horizontal section ((Z-slice). The user must indicates the elevation of
the horizontal section in the popup Window
Window. Press Close to return to 2D aerial view
view.
Key C
To display or to hide the real channel. In 2D aerial view, grey arrows at centerline
points indicate 500 times the migration assuming an erodibility equal to 2e-8.
2e
In presence of
conditioning wells, blue arrows are increased by a factor of 2, corresponding to forced migration.
Red arrows are reduced, corresponding to forced repulsion. See also section 4.3.
4.3.6.
Key u
To display the current upper limit
limit. Only the part of the simulation above this
topography is displayed. The rest of the deposits is white. See section 3.3.
Key w
To display the well labels
labe (Well locations are always displayed as a red cross)
The LMB (Left Mouse Button) can be used in 2D aerial view to zoom on a rectangular area.
13/12/2013
- 39 -
flumy3.5_usersguide
ARMINES / ECOLE DES MINES DE PARIS
4.3.4 Vertical section view
Figure 20 : Vertical X section
The elevation reference level is displayed as an horizontal black line in vertical sections. See
section 3.2.2.
The current topography, if distinct from this level, is represented with a line colored as undefined
facies where there is no deposit yet.
-
Note: For convenience the global floodplain slope of the reference plane is neglected in
visualisation.
13/12/2013
- 40 -
flumy3.5_usersguide
ARMINES / ECOLE DES MINES DE PARIS
Keys used to control the vertical section view within a window:
Key u
To display as a black line the upper limit
Key p
To display the equilibrium profile as a blue line on the section
Key w
To display the well labels (see section 4.3.6 for specific well description in vertical
section views)
Key n
To display the interpreted facies for well data (see
(see Closure limit in section 3.4.1)
Key X
To choose the number of the vertical cross section in the (y,z) plane
Key Y
To choose the number of the vertical cross-section
cross
in the (x,z) plane
The LMB (Left Mouse Button) can be used in vertical section views to zoom on a rectangular area.
The RMB (Right Mouse Button) can be used to chang
changee the section displayed.
13/12/2013
- 41 -
flumy3.5_usersguide
ARMINES / ECOLE DES MINES DE PARIS
4.3.5 3D aerial view
Figure 21 : 3D aerial view
Keys used for 3D aerial viewing within a window:
Key v
To display the xOy base as a 3D empty cube
Key R
To rotate the camera
Key C
To display or to hide the real channel. In 3D aerial view the whole channel is
displayed as it goes inside and outside the domain.
The LMB (Left Mouse Button) to vary the 3D point of view.
The RMB (Right Mouse Button) can be used to zoom in/out.
13/12/2013
- 42 -
flumy3.5_usersguide
ARMINES / ECOLE DES MINES DE PARIS
4.3.6 2D views in conditioning
When well labels is activated (Key w) a grey label means that the well is inactive (no impact on the
processes); a blue label means that the well is currently attracting the channel (sand is requested at
well); a red label means that the well is repulsing the channel (all but the sand is to be deposited at
the well); a pink label means that the well is totally honoured (no more impact).
4.3.6.1 Cross-sections
Figure 22 : Vertical section with a well
In the relevant vertical cross-sections, each vertical conditioning well is pictured with two columns
delimited by vertical red lines. The right column represents the current simulation that is being
represented in the cross-section. The left column (actually graphically superimposed on the current
simulation) pictures the well data.
The horizontal white line across the well indicates the “active level” under which all data have been
validated. One desirable reason for a facies data to be validated is its being honoured by the
deposition of the same facies or of an equivalent facies (point bar, channel lag and sand plug are
considered equivalent; levee, crevasse splays and crevasse channel are also considered as
equivalent).
However, though the conditioning process aims at reproducing at best the local conditions of
depositions, it is not 100% exact. This results in some facies data to be validated while not being
honoured. For instance, an OverBank sediment data where a different facies would have been
deposited is automatically validated (for not being a replacement facies, OverBank cannot be any
further honoured). Similarly, when the active level is becoming too deep (in practice at more than
80% of the maximum channel depth from the current topography at the well), it is updated by
validating the corresponding data. But the data is possibly “misfit”, i.e. not honoured.
13/12/2013
- 43 -
flumy3.5_usersguide
ARMINES / ECOLE DES MINES DE PARIS
4.3.6.2 Aerial view
Figure 23 : Attractive well (left) and repulsive well (right)
The conditioning process is essentially based on temporary modifications of parameters like the
erodibility, in order to attract (in migration or avulsion) the channel to well data where for instance
sand should be deposited, or to “repulse” the channel, keeping it away from well locations where
OverBank should be deposited.
Facies data (at each well active level) considered as attractive:
- Point bar, channel lag, sand plug and mud plug, when the channel elevation is becoming
too high (channel bottom getting higher that the active level, or channel top reaching the
level of non replacement facies such as OverBank). Then the aggradation is also blocked
to favour deposition of sand (though not completely, see Relaxation section 3.4.1)
- Levee and equivalent facies data, if too far from channel.
Facies data considered as locally repulsive:
- OverBank or Wetland;
- Levee and equivalent facies if very close to channel;
- well completely honoured.
In the aerial view, a red cross indicates the location of each well. When representing the “true” (not
pixelized) channel, a line joins each well to its closest channel point. The colour of this line gives
the status of the well in term of migration:
-
-
blue when the well is attractive (then the closest channel point is defined in term of Von
Mises distance d/exp(-dx/d), favouring upstream points);
red when the well is repulsive (the distance is limited to 6 times the channel width for
OverBank and Wetland, 2 times it for Levee and equivalent facies, and 4 times it for a
completely honoured well);
grey when the well is inactive.
13/12/2013
- 44 -
flumy3.5_usersguide
ARMINES / ECOLE DES MINES DE PARIS
4.4 Output
Different types of output are available:
-
output files of the parameters and the simulation saved within the Project Folder, through
Save Project in the menu File;
output files generated through Export… in the menu File;
general statistics about the simulation
4.4.1 Project Folder
All the inputs, as well as the states of the simulation that the user has saved at different iterations
are stored within the Project Folder.
The user can define a New Project, or Open Project in the case he wants to continue a previously
saved simulation (per default, a Project Folder is created, named FlumyDefaultW.XYZ.prj, and
located into the home folder).
The user can Save Project to save the results at the current iteration (simulation snapshot), and thus
can save the results at different iterations. The user can navigate within the sequence of saved
results using Project Navigate Backward and Project Navigate Forward. Thus the user can for
instance go back to a previously saved simulation, and rerun the simulation with a new choice of
parameters (note that the sequence of saved results will be updated only by a further Save Project).
The Project Folder is a directory which includes several directories and files.
-
centreline directory: this includes the channel centerline files used.
erodibility directory: this includes the erodibility map files used.
topography directory: this includes the topography files used.
wells directory: this includes the well files used.
Directories “ite_#” include the snapshot of the simulation as saved at iteration no #. Each such
directory includes in particular:
-
-
Centerline (current centerline at this iteration)
Current parameters:
SEED (current seed)
EP (equilibrium profile elevation)
Journal file Journal_#.jnl
Simulation
The project folder includes also three (or four) files:
-
the current journal file Flumy.jnl and its backup (if so)
the Flumy version number
the graphical parameters for each views
13/12/2013
- 45 -
flumy3.5_usersguide
ARMINES / ECOLE DES MINES DE PARIS
4.4.2 Exported files
These are:
-
-
-
individual well
vertical well, located at the intersection of the X and Y cross-sections of the main
graphical view
topography
current topography
erodibility map
current 2D erodibility map
centreline
current centreline
simulation block
a 3D regular (sub)grid for each variable (facies, grain size and age) with a given
vertical discretization step, that can be directly imported into any software that
import ascii files
erodibility map built from the centreline
to reproduce the channel belt. The Emap is obtained by locating anisotropic bumps
at channel centerline points, making use of the input Extension from channel points
(as multiple of channel width) along X and along Y and around the given mean
value.
Formats of these export files are given in chapter 5.
-
Note: The global floodplain slope is not taken into account in the output files (nor in the
input files), as it is easier to go directly between the horizontally flat reference system of
Flumy simulation and the geographical system of the actual reservoir.
4.4.3 General statistics
These are available through the menu Compute:
13/12/2013
- 46 -
flumy3.5_usersguide
ARMINES / ECOLE DES MINES DE PARIS
4.4.3.1 Vertical proportion curve (VPC)
Figure 24 : Vertical Proportion Curve
It corresponds to a cumulative histogram of the proportions of the different facies, calculated level
by level (parallel to the reference plane).
Several options are available on the window Vertical proportion curve. The VPC is computed over
a given interval (default - overall thickness of deposits), specifying:
- Either
- Or
- and
number of levels: discretization of the interval
thickness: thickness of each unitary level
use elevation limits: to give the limits of the selected interval (can be used
with the option number of levels or thickness)
By default, the graphic window displays VPC including all facies present in the simulation, with
same colors as in the simulation.
13/12/2013
- 47 -
flumy3.5_usersguide
ARMINES / ECOLE DES MINES DE PARIS
On the graphic window Vertical proportion curve:
Through the menu Graphics one can:
- Remove data - to remove a facies from the histogram,
- Concatenate data - then a new name has to be given to the new facies,
- Classify data - opens the window Classify Dialog, where facies order can be changed by
using the up down buttons, choice to be validated before closing the window,
- Switch orientation - vertical <=> horizontal (the proportions are still calculated vertically)
- Show removed data - removed data are displayed in white
- Show unavailable data - by default in black - VPC is presented as 100% of the present
facies, including the possible proportion of level which is not informed
- Change data colors - new facies colors do not apply to simulation (only VPC),
- Background color - color of the background on which the diagram is displayed.
Through the menu File, one can:
- Save the proportions in a text file
- Update the proportions
- Cancel previous operations made by using 3 first Graphics menu options (operations
remove / concatenate / classify are cancelled one by one)
- Change parameters go back to the parameters window Vertical proportion curve
- Proportion slices save a slice ASCII file giving the VPC of each grid cell for a given
vertical interval
- Statistics display the proportions for each VPC level where user can then saves it into an
ASCII file
- Print print or save the image in postscript format.
The global statistics (whole simulation) can be edited by choosing a number of levels equal to 1
through the overall thickness of the deposits.
The bottom and top elevation can be used to crop the VPC so that a full filled block will be
considered. In the previous example, setting bottom to 0m and top to 21m will remove all
unavailable data from the VPC (black).
Another way to obtain a cropped simulation without any empty space, is to erode the simulation
with a constant surface from the bottom to 0m, and from the top to 21m using the Surface eroion
punctual operations (see section 3.3.1).
13/12/2013
- 48 -
flumy3.5_usersguide
ARMINES / ECOLE DES MINES DE PARIS
4.4.3.2 Proportion Matrix
Figure 25 : Vertical Proportion Matrix (domain split 8x8)
The overall 2D domain can be divided along Ox and Oy axes. VPC is then computed within each
sub-domain. Options are similar to Vertical proportion curve (see section 4.4.3.1).
13/12/2013
- 49 -
flumy3.5_usersguide
ARMINES / ECOLE DES MINES DE PARIS
4.4.3.3 Wells Vertical Proportion Curve
Figure 26 : Wells Vertical Proportion Curve
When input wells have been added (see section 3.4.1), the user can calculate VPC onto well data. If
the wells are non standard (discrete or continuous), the data displayed are interpreted Flumy facies.
Options are similar to Vertical proportion curve (see section 4.4.3.1).
This tool can be used:
-
to identify the different geological units if so, and
to analyse the facies proportions along wells
13/12/2013
- 50 -
flumy3.5_usersguide
ARMINES / ECOLE DES MINES DE PARIS
4.4.3.4 Wells Histogram
Figure 27 : Wells histogram
When input wells have been added (see section 3.4.1), the user can build the well samples
histogram. Options are similar to Vertical proportion curve (see section 4.4.3.1). The difference
with VPC is that the orientation is switched and the user cannot show the removed data and hide
the unavailable data (which corresponds here to the empty white space).
The wells histogram is a way to analyse the distribution of the well samples according their height.
In the example above, there is only one sample of Point Bar (yellow) which height is 15m. This
sample is probably an amalgamated Point Bar channel deposit. Most Wetland (purple) samples
have a really thin thickness.
The closure limit option is a way to see the impact of the closure feature in the Well tab (see section
3.4.1). The histogram is then recalculated using the limit set by the user.
13/12/2013
- 51 -
flumy3.5_usersguide
ARMINES / ECOLE DES MINES DE PARIS
4.4.3.5 Conditioning Statistics
Statistics are computed on the part of well(s) that has been simulated (possibly including undefined
facies). They give, out of this part, the proportion of a given facies: on data (“Data”), on simulated
values (“Simu”), as well as the proportion of the same part where the facies is both present on data
and on simulation (“Matching”) (hence the “Matching” proportion cannot exceed the “Data”
proportion, nor the “Simu” proportion). The proportion of exactly honoured data is then given by
the “Matching” proportion when considering all facies. The listed facies represent the families of
the facies considered as equivalent for the conditioning process (see section 4.3.6.1).
13/12/2013
- 52 -
flumy3.5_usersguide
ARMINES / ECOLE DES MINES DE PARIS
5 Files formats
In, the following, we are giving some general comments on the built-up of the files and examples
of all file formats. These are intended to help the user in building its own files and in exchanging
these with other software.
5.1 General comments
Important note:
-
All ASCII files must be encoded with either UTF-8 or ANSI (ISO8859).
-
(x, y) coordinates:
In all imported or exported data files (except imported surfaces or imported erodibility maps
when using the simple ASCII file format), the (x,y) coordinates correspond to the
geographical coordinates, not the coordinates in the Flumy system related through an origin
and a rotation around it, see Section 3.1.2.
-
z coordinate:
In imported or exported data files, z is consistent with the input elevation of the reference
level (which does not take into account the global floodplain slope), as it is easier to go
directly between the horizontally flat reference system of Flumy simulation and the
geographical system of the actual reservoir.
Some rules have to be strictly followed otherwise there might be some problems during the file
exchange with other software.
-
Symbol #: any line starting with this symbol corresponds to a comment line
Decimal numbers: to be entered with a decimal point
Field name: to be exactly as in the model (capital letter, underscore, ….)
The thickness of each deposition unit is rounded to the cm.
13/12/2013
- 53 -
flumy3.5_usersguide
ARMINES / ECOLE DES MINES DE PARIS
In the different output files, the Flumy facies deposits are represented by abbreviation or number as
follows:
No
0
1
2
3
4
5
6
7
8
9
10
11
12
Abbr.
UDF
CL
PB
SP
CSI
CCh
CSII
LV
OB
MP
CF
WL
DR
Type of deposit
Undefined
Channel Lag
Point Bar
Sand Plug
Crevasse Splay I
Crevasse Splay II Channels
Crevasse Splay II
Levee
Overbank alluvium
Mud Plug
Channel Fill
Wet Land
Draping
Facies other than NA correspond to the different units that are iteratively deposited at each point of
the 2D grid. As the beginning and the end elevations of the deposited material may vary with the
2D grid point, facies NA is added below and above, in the 3D regular grid outputs.
See the section 6.5 for more details regarding the facies list.
13/12/2013
- 54 -
flumy3.5_usersguide
ARMINES / ECOLE DES MINES DE PARIS
5.2 Grid files
Grid files are used to import/export surfaces and erodibility map (2D grid) and to export simulation
regular block (3D Grid). All grid files have the same ASCII format whose name is Flumy Generic
Grid (F2G).
5.2.1 Flumy Generic Grid format
The Flumy Generic Grid format handles regular grid localization (3D location as Longitude,
Latitude and Elevation in the geographical system) and rotation (2D rotation around vertical axis).
This format indicates the order description in which the grid values are dumped. It permits also to
dump more than one variable column by column. An ASCII file with the Flumy Generic Grid
Format is composed first by a header with several keywords in the appropriate order (see below),
then, all grid cell values (one grid cell by line where different variable values are separated by the
space character on the same line).
Keyword
F2G_DIM
F2G_VERSION
F2G_LOCATION
Value
2 or 3
1 or more
X Y Z (m)
F2G_ROTATION
Rotation (°)
F2G_ORIGIN
Ox Oy Oz (in m)
F2G_NB_NODES
Nx Ny Nz
F2G_LAGS
Dx Dy Dz
F2G_ORDER
±A ±B ±C
F2G_NB_VARIABLES Nb variable
F2G_VARIABLE_#
Name
F2G_UNDEFINED_#
Undefined value
F2G_VALUES
Comment
2D or 3D grid
F2G format version
Grid location in the geographical system (Z is
ignored for 2D grid)
Rotation in degrees counter clockwise around
vertical axis (West => East direction is 0°)
Offset of the origin of the grid (Keep it to 0, 0, 0)
(Oz is ignored for 2D grid)
Number of node along X-axis, Y-axis and Z-axis
(Nz is ignored for 2D grid)
Lag between nodes along X-axis, Y-axis and Z-axis
(Dz is ignored for 2D grid)
The order in which cells are dumped. A B C must be
replaced by X or Y or Z. For example, the order
+Z +X +Y means that the cells first are dumped
along increasing Y-axis (faster index), then along
increasing X-axis, finally increasing Z-axis
Number of variables… and for each variable
Name of the variable
Value to be considered as undefined
Indicates that next line is the first grid cell values
The ‘#’ above as to be replaced by the variable index starting from 1 for the first variable.
13/12/2013
- 55 -
flumy3.5_usersguide
ARMINES / ECOLE DES MINES DE PARIS
5.2.2 Topography (IN/OUT)
The topography file must use the F2G format. The topography values are in meters. Such file has
only one variable: the Elevation.
The topography must cover the floodplain area entirely. The topography values must include the
grid elevation (see section 3.2.2).
Here is an example of a 2D topography file using the F2G format:
F2G_DIM 2
F2G_VERSION 1
F2G_LOCATION 447100 -527300 0
F2G_ROTATION 0
F2G_ORIGIN 0 0
F2G_NB_NODES 211 166
F2G_LAGS 20 20
F2G_ORDER +Z +X +Y
F2G_NB_VARIABLES 1
F2G_VARIABLE_1 Elevation
F2G_UNDEFINED_1 NA
F2G_VALUES
81.74
81.78
…
79.64
The file above has 35026 lines (211x166 cell values) plus 12 header lines (compulsory keywords).
13/12/2013
- 56 -
flumy3.5_usersguide
ARMINES / ECOLE DES MINES DE PARIS
5.2.3 Erodibility map (IN/OUT)
The erodibility map (Emap) file must use the F2G format. Input Emap values can be Absolute
(E=[0,1.E-7]) or Relative (any value) (see section 3.5.1). Output Emap values generated by Flumy
are Absolute. The Emap file has only one variable: the Erodibility.
The grid of the Emap file could partially cover the floodplain area. Missing values are
automatically calculated from proximal erodibility values found into the Emap file.
Here is an example of a 2D erodibility map file using the F2G format with absolute values:
F2G_DIM 2
F2G_VERSION 1
F2G_LOCATION 447100 -527300 0
F2G_ROTATION 0
F2G_ORIGIN 0 0
F2G_NB_NODES 211 166
F2G_LAGS 20 20
F2G_ORDER +Z +X +Y
F2G_NB_VARIABLES 1
F2G_VARIABLE_1 Erodibility
F2G_UNDEFINED_1 NA
F2G_VALUES
2e-08
2e-08
…
2e-08
The file above has 35026 lines (211x166 cell values) plus 12 header lines (compulsory keywords).
13/12/2013
- 57 -
flumy3.5_usersguide
ARMINES / ECOLE DES MINES DE PARIS
5.2.4 3D block (OUT)
The simulation ASCII file uses the F2G format. This is a 3D regular grid (vertically discretized at a
given discretization step). The user must indicate the following fields before exporting the
simulation:
* The Minimum/Maximum X/Y grid indices: This is a way to export a sub-block of the
simulation (not the whole grid)
* The Vertical discretization step (in m): because Flumy internally stores vertical irregular pillar
in each domain cell, the exportation procedure must upscale the simulation content at a regular
discretization step.
* The variables the user wants to export:
-
The Facies variable is an integer (see section 6.5).
The grain size variable is a value between 0 (finest grain) and 1 (coarsest grain) (see
section 6.5),
The age variable is an integer indicating the iteration number of the deposit
Here is an example of a 3D sub block of the simulation exported into a file using the F2G format
with the 3 variables:
F2G_DIM 3
F2G_VERSION 1
F2G_LOCATION 449100 -525300 0.48
F2G_ROTATION 0
F2G_ORIGIN 0 0 0
F2G_NB_NODES 10 10 79
F2G_LAGS 20 20 1
F2G_ORDER +Z +X +Y
F2G_NB_VARIABLES 3
F2G_VARIABLE_1 Facies
F2G_UNDEFINED_1 NA
F2G_VARIABLE_2 Grain_Size
F2G_UNDEFINED_2 NA
F2G_VARIABLE_3 Age
F2G_UNDEFINED_3 NA
F2G_VALUES
2 0.6875 3969
2 0.6875 3967
…
9 0.125 123101
The file above has 7900 lines (10x10x79 cell values) plus 12 header lines (compulsory keywords).
13/12/2013
- 58 -
flumy3.5_usersguide
ARMINES / ECOLE DES MINES DE PARIS
5.3 Channel centerline (IN/OUT)
Data for the channel centerline are given as an ASCII file containing the discretization points of the
channel in 2D or 3D. The first point must be upstream of the channel; the last point must be
downstream of the channel. Comments are not allowed after the “~Ascii” line delimiter.
Coordinates are given in the geographical system.
# Centerline saved by MCRC
#
# Dimension of points ( 2D or 3D)
N_DIMENSIONS=3D
# Number of points in the centerline
N_POINTS=178
# Channel centerline path (x,y,z)
~Ascii
-4535 -2808.11 0
-4486.97 -2792.14 0
-4437.86 -2779.01 0
-4387.76 -2768.73 0
…
4359.50 1255.74 0
The file above has 178 lines (178 channel points) plus 8 header lines.
13/12/2013
- 59 -
flumy3.5_usersguide
ARMINES / ECOLE DES MINES DE PARIS
5.4 Well file (IN/OUT)
There is one separate file per well to be imported (exported). Imported wells can be vertical or nonvertical but then with an elevation decreasing along hole. Non-vertical wells are automatically
identified by the presence of the (x,y,z) of each sample (see below). Only vertical wells can be
exported.
The file format is inspired from the well known LAS format. Unfortunately, LAS format does not
include well location. The Flumy file header contains well location, the elevation of the top and the
bottom of the well. The header contains also additional keywords indicating which columns are to
be extracted from the data part.
The data part must follow the separator line (~Ascii).
-
Note: to import wells from Petrel©: In Petrel© export logs using LAS format, then for each
file remove all the lines before “~Ascii” line and add the compulsory keywords at the
beginning.
It is possible to extract vertical wells from the simulated block.
-
Caution: the well must be extracted at the intersection of the S-N and W-E cross-sections of
the first window opened by the program (since sections displayed on the different windows
are independent).
13/12/2013
- 60 -
flumy3.5_usersguide
ARMINES / ECOLE DES MINES DE PARIS
Keyword
X_WELL=
Comment
Well location abscissa (longitude) in the
geographical system
Y_WELL=
Y
Well location ordinate (latitude) in the
geographical system
Z_BOTTOM=
Zb
Bottom elevation of the well (including grid
elevation – see section 3.2.2)
Z_TOP=
Zt
Top elevation of the well (including grid
elevation – see section 3.2.2)
ATTRIBUTE_COLUMN= Attribute column The attribute is the Facies identifier for a
index (Interest
standard Flumy well, the custom discrete value
variable)
for a non standard discrete well or the
continuous property for a non standard
continuous well
DISCRETE_ATTRIBUTE= 0 or 1
Indicate whether attribute is discrete (1 = Flumy
facies identifiers or custom categories) or not (0
= continuous variable)
STANDARD_FACIES=
0 or 1
If attribute is discrete, indicate if the attribute
corresponds to standard Flumy facies identifiers
(1) or custom category (0)
AGE_COLUMN=
Age
Age of the sample (number of iterations since the
simulation beginning) (only for extracted well)
DEPTH_COLUMN=
Depth column
Depth are defined relative
Used only in
index
to the top of the well
vertical well
XS_BOT=
X sample bottom Sample bottom abscissa in
column index
geographical system
YS_BOT=
Y sample bottom Sample bottom ordinate in
Used only in noncolumn index
geographical system
vertical well
ZS_BOT=
Z sample bottom Sample bottom elevation in
column index
geographical system
13/12/2013
Value
X
- 61 -
flumy3.5_usersguide
ARMINES / ECOLE DES MINES DE PARIS
5.4.1 Format for a vertical well
Only the facies identifier and the depth are necessary. Other variables are ignored in a vertical well.
The vertical output well file contains the following variables:
-
integer facies code (compulsory)
facies short name
depth from well top (compulsory)
deposit thickness
age of deposit (iteration number – only for output)
File example of an extracted well:
# =====================================================================
# Well extracted from Flumy simulation (ix=1,iy=1)
# Coordinates, depth and thickness are expressed in meters
#
# =====================================================================
# Well Location
X_WELL=10000
Y_WELL=-20000
#
# Bottom elevation
Z_BOTTOM=-100
# Top elevation
Z_TOP=-81.62
# =====================================================================
#
# Deposits From top to bottom
# Facies_id Facies Depth Thickness Time
#
Warning : Depth from top of deposit basis
ATTRIBUTE_COLUMN=1
DEPTH_COLUMN=3
DISCRETE_ATTRIBUTE=1
STANDARD_FACIES=1
~Ascii
7
LV
5.68
5.68
8401
2
PB
8.45
2.77
8347
1
CL
8.84
0.39
8347
2
PB
10.57
1.73
8231
1
CL
10.88
0.31
2366
8
OB
11.07
0.19
2279
11
WL
11.10
0.03
2279
...
8
OB
17.18
0.22
93
8
OB
17.38
0.20
2
0 UDF
18.38
1.00
1
The two red values are always the same as the first sample thickness corresponds to the first sample
cumulative depth from the top. The green value always corresponds to Z_TOP – Z_BOTTOM.
13/12/2013
- 62 -
flumy3.5_usersguide
ARMINES / ECOLE DES MINES DE PARIS
5.4.2 Format for a non-vertical well
The format for an imported non-vertical well is close to the format of a vertical well. A well is
identified as a non-vertical well if columns XS_BOT, YS_BOT, ZS_BOT (representing the (x,y,z)
of the bottom of each sample) are defined and informed. The values of ZS_BOT must decrease; the
last one should equal Z_BOTTOM value.
File example of an input deviated well:
# Well Location
X_WELL=6500
Y_WELL=3800
#
# Bottom elevation
Z_BOTTOM=18.3
# Top elevation
Z_TOP=115.0
#
# Attribute description: Flumy facies identifiers
ATTRIBUTE_COLUMN=1
DEPTH_COLUMN=3
DISCRETE_ATTRIBUTE=1
STANDARD_FACIES=1
# Sample bottom point coordinates
XS_BOT=5
YS_BOT=6
ZS_BOT=7
~Ascii
8
OB
6.60 6.60 6497 3803 108.4
3
PB
8.00 1.40 6496 3803 107
etc
96.70 2.10 6418 3818 18.3
8
OB
The green value always corresponds to Z_TOP – Z_BOTTOM.
The columns number 2 (Flumy facies short name) and 4 (sample thickness) are ignored.
13/12/2013
- 63 -
flumy3.5_usersguide
ARMINES / ECOLE DES MINES DE PARIS
5.4.3 Format for a non-standard well
The format for a non-standard well is almost the same than a standard one. The user must only
indicates whether the attribute (the interest variable) is discrete (DISCRETE_ATTRIBUTE=1) or
continuous (DISCRETE_ATTRIBUTE=0). A non standard well has the following keyword set
to 0: STANDARD_FACIES=0
Here is an example of a vertical non standard discrete well:
# Well Location
X_WELL=3450
Y_WELL=2650
#
# Bottom elevation
Z_BOTTOM=0
# Top elevation
Z_TOP=25
#
# Deposits From top to bottom
# Facies_id Facies Depth Thickness Time
#
Warning : Depth from top of deposit basis
ATTRIBUTE_COLUMN=2
DEPTH_COLUMN=3
DISCRETE_ATTRIBUTE=1
STANDARD_FACIES=0
~Ascii
1
Silt
2.00
0.005
2
Sand
6.00
0.006
3
Gravel 7.00
0.012
4
Shale
14.75 0.024
5
Sand
20.00 0.007
6
Shale
25.00 0.003
The green value always corresponds to Z_TOP – Z_BOTTOM.
The columns number 1 (sample index) and 4 (a sample property) are ignored.
All values of a discrete attribute are collected comparing the characters (case sensitive). In the
example above, the different possible categorical values of the discrete attribute are: Silt, Sand,
Gravel and Shale.
The user will have to indicate the Flumy facies associated to each categorical value found in the
input wells (see section 3.4.2).
For continuous attribute, the user will have to create “user classes” defining which interval of the
continuous variable corresponds to a Flumy Facies (see section 3.4.2).
13/12/2013
- 64 -
flumy3.5_usersguide
ARMINES / ECOLE DES MINES DE PARIS
5.5 Journal file (IN/OUT)
Each line of the journal (excepting blank lines and lines starting with #) contains a parameter value.
A description of the parameter can be found after the # sign (all characters following # are
comments). The parameters order is significant and must not be changed.
The first section (sections are separated with blank lines) corresponds to initial values of the
parameters before the first launch. The other sections correspond to a simulation sequence. The last
parameter of the sequence corresponds to the number of iterations.
Here is an example of a Journal File for a simulation having only one sequence of 10 000 iterations:
165426
Default
0
0
101
81
50
50
0
0
none
exceed
0
none
undefined
0
0
10
false
0.1
none
100
4
-1
10
90
0.001
0.01
15
1
2e-008
constant
none
false
periodic
13/12/2013
#
#
#
#
#
#
#
#
#
#
#
#
#
#
#
#
#
#
#
#
#
#
#
#
#
#
#
#
#
#
#
#
#
#
#
Simulation / Seed Value
Floodplain / Name
Floodplain / Origin / X (m)
Floodplain / Origin / Y (m)
Floodplain / Dimensions / Number of nodes along X
Floodplain / Dimensions / Number of nodes along Y
Floodplain / Lags / Lag X (m)
Floodplain / Lags / Lag Y (m)
Floodplain / Grid Direction (degrees)
Floodplain / Z Reference Level (m)
Surface / Surface type
Surface / Import option
Surface / Constant Surface Elevation (m)
Surface / Surface File
Surface / Facies
Wells / Count
Wells / Nb Classes
Wells / Relaxation Parameter
Wells / Closure activated
Wells / Closure limit
Channel / Centerline file
Channel / Width (m)
Channel / Mean Depth (m)
Channel / Wave Length (m)
Channel / Domain Margin (multiple of channel width)
Channel / Flow Direction (degrees)
Channel / Slope along flow direction
Channel / Friction coefficient
Channel / Depth to width factor
Channel / Depth to width power
Erodibility / Coefficient
Erodibility / From
Erodibility / Erodibility Map File
Avulsions / Levee breach during overbank floods
Avulsions / Levee breach / Frequency
- 65 -
flumy3.5_usersguide
ARMINES / ECOLE DES MINES DE PARIS
2200
periodic
3800
0.5
0.9
1000
never
constant
0
overbankfloods
1000
6
periodic
100
constant
0.359
0
draping
#
#
#
#
#
#
#
#
#
#
#
#
#
#
#
#
#
#
Avulsions / Levee breach / Period
Avulsions / Regional / Frequency
Avulsions / Regional / Period
Avulsions / Probability CSI to CSII
Avulsions / Probability CSII to CSIII
Equilibrium Profile / Initial Elevation
Equilibrium Profile / Frequency / Frequency
Equilibrium Profile / Intensity / Distribution type
Equilibrium Profile / Intensity / constant […/…]
Flood / Type
Flood / Thickness exp. decrease (m)
Flood / Levee width (multiple of channel width)
Flood / Frequency / Frequency
Flood / Frequency / Period
Flood / Intensity / Distribution type
Flood / Intensity / constant distribution value
Flood / Peatland proportion (%)
Flood / Draping Facies
true
165426
none
exceed
0
none
undefined
10
false
0.1
none
100
4
-1
10
90
0.001
0.01
15
1
2e-008
constant
none
false
periodic
2200
periodic
3800
0.5
0.9
1000
#
#
#
#
#
#
#
#
#
#
#
#
#
#
#
#
#
#
#
#
#
#
#
#
#
#
#
#
#
#
#
Define a new sequence
Simulation / Seed Value
Surface / Surface type
Surface / Import option
Surface / Constant Surface Elevation (m)
Surface / Surface File
Surface / Facies
Wells / Relaxation Parameter
Wells / Closure activated
Wells / Closure limit
Channel / Centerline file
Channel / Width (m)
Channel / Mean Depth (m)
Channel / Wave Length (m)
Channel / Domain Margin (multiple of channel width)
Channel / Flow Direction (degrees)
Channel / Slope along flow direction
Channel / Friction coefficient
Channel / Depth to width factor
Channel / Depth to width power
Erodibility / Coefficient
Erodibility / From
Erodibility / Erodibility Map File
Avulsions / Levee breach during overbank floods
Avulsions / Levee breach / Frequency
Avulsions / Levee breach / Period
Avulsions / Regional / Frequency
Avulsions / Regional / Period
Avulsions / Probability CSI to CSII
Avulsions / Probability CSII to CSIII
Equilibrium Profile / Initial Elevation
13/12/2013
- 66 -
flumy3.5_usersguide
ARMINES / ECOLE DES MINES DE PARIS
never
constant
0
overbankfloods
1000
6
periodic
100
constant
0.359
0
draping
100000
13/12/2013
#
#
#
#
#
#
#
#
#
#
#
#
#
Equilibrium Profile / Frequency / Frequency
Equilibrium Profile / Intensity / Distribution type
Equilibrium Profile / Intensity / constant […/…]
Flood / Type
Flood / Thickness exp. decrease (m)
Flood / Levee width (multiple of channel width)
Flood / Frequency / Frequency
Flood / Frequency / Period
Flood / Intensity / Distribution type
Flood / Intensity / constant distribution value
Flood / Peatland proportion (%)
Flood / Draping Facies
Number of iterations for this sequence
- 67 -
flumy3.5_usersguide
ARMINES / ECOLE DES MINES DE PARIS
5.6 Colours file (IN/OUT)
It is used to save the current facies colours from “Settings” menu. Colours are stored as RGB (Red
Green Blue) values. Each component is coded between 0 and 1.
-
Note: In the data directory, you can find two files named mcrc_xxx_colors. These files can
be directly used in Gocad© or Isatis© in order to display Flumy facies, it contains default
colours for all facies. Its format is slightly different.
Output Colours File example:
# Facies Colourmap
# Number of facies
13
# Colour of facies with RGB components
# Undefined
0.60 0.60 0.90
# Channel Lag
1.00 0.50 0.00
# Point Bar
1.00 1.00 0.00
# Sand Plug
0.75 0.75 0.55
# Crevasse Splay I
0.80 0.50 0.20
# Splay II Channels
0.80 1.00 0.20
# Crevasse Splay II
0.80 0.80 0.20
# Levee
0.40 0.80 0.20
# Overbank
0.00 1.00 0.00
# Mud Plug
0.00 0.80 0.50
# Channel Fill
0.50 0.50 0.50
# Wetland
0.85 0.45 0.85
# Draping
0.60 0.80 0.90
13/12/2013
- 68 -
flumy3.5_usersguide
ARMINES / ECOLE DES MINES DE PARIS
6 Additional information
6.1 Range of values
When starting a new sequence by using either launch/launch until/refreshment period, an error
window may show the parameters out of their range. In that case, the user must change the value of
the parameter before launching the new sequence.
Parameters
Non-expert user
Channel Maximum depth (m)
Sand bodies extension ratio
Net to gross (%)
Update grid size when apply
Domain
Grid Lags (m) [DX]
Grid Lags (m) [DY]
Grid Number of Nodes [NX]
Grid Number of Nodes [NY]
Grid Location (m) [Longitude or Latitude]
Grid Elevation (m)
Grid Rotation (degrees counterclockwise)
Topography
Surface Type
Constant Elevation (m)
Topography File
Operation
Filling Facies
Graphical ZCut
Topography File
Elevation offset (m)
Wells
Relaxation (%)
Closure limit activated
Closure limit (m)
13/12/2013
- 69 -
Minimum
Default
Maximum
1
1
1
-
4
30
20
No
15
250
99
-
0.01
0.01
2
2
-∞
-∞
-360
20
20
101
81
0
0
0
+∞
+∞
1000
1000
+∞
+∞
360
-0
-∞
-
None
0
None
Upper limit
Undefined
+∞
-
-0
-∞
None
0
+∞
0
0.01
10
No
0.1
100
100
flumy3.5_usersguide
ARMINES / ECOLE DES MINES DE PARIS
Parameters
Erodibility
Emap mode
Erodibility coefficient (m/s)
Offset (m/s)
Channel
Width (m)
Maximum depth (m)
Domain Margin (multiple of channel width)
Flow direction (degree clockwise)
Slope along Flow Direction
Friction Coefficient
Avulsions
Regional Avulsion frequency
[Periodic]
Period (#it)
[Poisson]
Average period (#it)
Local Avulsion frequency
[Periodic]
Period (#it)
[Poisson]
Minimum
Default
Maximum
0
-∞
Constant
2.E-8
0
1.E-7
+∞
5
1
1
-360
0.0001
0.005
40
4
10
90
0.001
0.01
500
15
100
360
0.1
0.02
1
1
1
Periodic
2200
2200
Periodic
+∞
+∞
+∞
Average period (#it)
1
Levee Breaches During Aggradation
Probability for transition from CSI to CSII
Probability for adding a new CS Channel
0
0
13/12/2013
- 70 -
1300
1300
No
0.5
0.9
+∞
1
1
flumy3.5_usersguide
ARMINES / ECOLE DES MINES DE PARIS
Parameters
Equilibrium Profile
Elevation (m)
Changes frequency
[Periodic]
[Poisson]
Variation distribution
[Constant]
[Uniform]
[Uniform]
[Normal]
[Normal]
[Lognormal]
[Lognormal]
Flood
Aggradation type
Occurence frequency
[Periodic]
[Poisson]
Minimum
Default
Maximum
Constant value (m)
Minimum (m)
Maximum(m)
Mean (m)
Standard deviation(m)
Mean (m)
Standard deviation(m)
-∞
1
1
-∞
-∞
-∞
-∞
0
-∞
0
1000
Never
100
100
Constant
1
0
1
0
1
0
1
+∞
+∞
+∞
+∞
+∞
+∞
+∞
+∞
+∞
+∞
Overbank Floods
Periodic
Period (#it)
1
+∞
Average period (#it)
1
Period (#it)
Average period (#it)
Thickness distribution
[Constant]
Constant value (m)
[Uniform]
Minimum (m)
0.02
0.02
[Uniform]
Maximum(m)
0.02
[Normal]
Mean (m)
0.02
[Normal]
Standard deviation(m)
[Lognormal] Mean (m)
0
0.02
[Lognormal] Standard deviation(m)
Wetland Proportion (%)
Draping Facies
Thickness Exponential Decrease (m)
Levee width (multiple of channel width)
0
60
60
Constant
0.281
0.28
+∞
+∞
+∞
+∞
1
0.28
+∞
+∞
1
0.28
+∞
+∞
0
1
0.05
1
0
Draping
1000
6
1
165426
2^32 - 1
99
+∞
+∞
Seed
Seed
13/12/2013
- 71 -
flumy3.5_usersguide
ARMINES / ECOLE DES MINES DE PARIS
6.2 Usual range of values
When starting a simulation by using either launch/launch until/refreshment period, a warning
window may show the parameters out of the usual range of values. The warning is intended to:
-
help the user to choose adequate parameters,
inform the user that the obtained results may not be realistic. Nevertheless, the simulation
can be run with these parameters.
Floodplain slope
Global Floodplain slope
Channel geometry
Width to depth relation:
From E. Held PhD, 2011
W = 10 Hmax = 15 Hmean
Grid size
Grid number of nodes (NX x NY)
Observed values in natural and experimental systems
Minimum
Warning message if greater
0.001
0.016
Compiled from natural and experimental observations, the ratio
between channel width and depth must be realistic
Width
Mean depth
Max depth
50 m
3.3 m
5m
100 m
6.7 m
10 m
150 m
10 m
15 m
200 m
13.3 m
20 m
300 m
20 m
30 m
400 m
26.7 m
40 m
500 m
33.3 m
50 m
Too much grid nodes makes the simulation slow down
Warning message if greater
Maximum
500 000
1 000 000
Relationship between overbank intensity and overbank frequency
From Bridge, 2003, p. 268
Floodplain aggradation rate per year
r ≈ 10 t-0.33
t time interval between event recurrence
In the model
Overbank intensity ≈ r*time interval*2
I ≈ 20 t0.67
13/12/2013
Deposited thickness varies with the average time interval between
event recurrence
OB every 10 years
Intensity: 0.10 m
OB every 20 years
Intensity: 0.15 m
OB every 30 years
Intensity: 0.20 m
OB every 40 years
Intensity: 0.24 m
OB every 50 years
Intensity: 0.28 m
OB every 75 years
Intensity: 0.36 m
OB every 100 years
Intensity: 0.43 m
- 72 -
flumy3.5_usersguide
ARMINES / ECOLE DES MINES DE PARIS
Relationship between channel width and floodplain grid
If channel width < lag(x or/and y)
Channel width / Grid lag
Channel discretization will give a dotted line
Channel width should be ≥ 2 lag (max of x or y)
Channel width / Floodplain width
If floodplain is too narrow then meander loops will not be fully
displayed on screen.
Floodplain width should be ≥ 40 channel width
Channel width / Floodplain length
If floodplain is too short then meander loops will not be fully
displayed on screen.
Floodplain length should be ≥ 40 channel width
Relationship between exponential thickness decrease and channel width
To preserve appropriate alluvium lateral extension toward the global
Exponential thickness decrease /
channel shape
Channel width
Channel width should be < exponential thickness decrease
Relationship between domain margin and domain size
If the margin is too big toward the floodplain width, the simulation
Domain margin / Floodplain width
will be slow down for nothing (no deposit)
Domain margin should be ≤ floodplain width
Domain margin / Floodplain length
If the margin is too big toward the floodplain length, the simulation
will be slow down for nothing (no deposit)
Domain margin should be ≤ floodplain length
Relationship between exponential thickness decrease and channel width
To preserve appropriate alluvium lateral extension toward the global
Exponential thickness decrease /
channel shape
Channel width
Channel width should be < exponential thickness decrease
13/12/2013
- 73 -
flumy3.5_usersguide
ARMINES / ECOLE DES MINES DE PARIS
6.3 Some sensibility analysis
In the following we are presenting the major role of parameters. As there are many cross
influences, the table is just intended to show the influence of the variation of one parameter, the
others remaining unchanged.
Process influenced
Channel migration,
Global Floodplain slope
Length of meander loops
Erodibility
Channel migration
Channel width
Channel migration
Channel depth
Channel migration
Equilibrium profile
Aggradation
Incision
Overbank floods
occurrence
Overbank floods
thickness
Overbank thickness
parameter
Aggradation
Incision
Aggradation
Aggradation
Aggradation
Avulsion
(regional or local)
Meandering pattern &
mudplug frequency
Proportion of point bar
13/12/2013
- 74 -
Consequence
Steeper slope slightly increases the velocity
of migration and the length of meander loops
Migration is faster with larger erodibility,
favouring sand, its horizontal connectivity,
sinuosity and mudplug.
Migration is faster with larger width,
favouring sand, its horizontal connectivity,
sinuosity and mudplug.
Channel depth favours sand, its vertical
connectivity, wavelength and mudplug
When EP elevation is just above floodplain,
aggradation is reduced, favouring sand and
horizontal connectivity. An EP elevation high
above floodplain favours aggradatation,
shale, and vertical connectivity of sand.
When EP is below floodplain
Frequent OB favour aggradation, shale, and
vertical connectivity of sand
Frequent OB favour incision since test on
accommodation are made at each OB event.
High OB intensity favours aggradation, shale,
and vertical connectivity of sand
High OB intensity favour aggradation, shale,
and vertical connectivity of sand
High frequency of avulsions decreases the
rate of aggradation of the floodplain
High frequency of avulsions gives less time
to meander loops to develop (ribbon like
channels with small sinuosity, and less mud
plugs).
Avulsion favours sedimentation over the
whole floodplain and increases point bar
proportion as several channel deposits are to
be at the same elevation.
flumy3.5_usersguide
ARMINES / ECOLE DES MINES DE PARIS
6.4 Additional hints
Wavelength:
The wavelength λ of the channel is, in the model, proportional to the channel depth H,
approximately: λ ≃ 800 H .
Sinuosity:
The actual sinuosity is output in the Status Bar in the bottom of the Interface Window.
When the meanders are developing, the sinuosity increases with
wE
H 2 f av
g I
.
cf
Here:
-
w = channel width,
H = channel mean depth,
E = mean erodibility coefficient,
I = floodplain global slope,
g = 9.81 (the gravity)
Cf = friction coefficient
fav = frequency of avulsions (not a direct parameter in Flumy, as it must take into
account local avulsions in addition to regional ones).
For a given channel geometry, the meanders develop and the sinuosity increases when the
avulsion period(s) is larger.
Sand proportion (N/G):
The Net to Gross forecast is output in the Status Bar in the bottom of the Interface Window.
Aggradation rate
The aggradation rate forecast is output in the Status Bar in the bottom of the Interface
Window.
13/12/2013
- 75 -
flumy3.5_usersguide
ARMINES / ECOLE DES MINES DE PARIS
6.5 Facies and Grain Size
Crevasse Splay II
Crevasse Splay Channel
Crevasse Splay I
Channel
Fill
Wetland Mudplug
Sand Plug
Channel Lag
Levee
Overbank
16
8
Cobble (-6,-8)
0.9375
Pebble (-3,-5)
0.875
Gravel (-2)
0.8125
1
Very Coarse Sand (-1)
0.75
2
Coarse Sand (0)
0.6875
3
Medium Sand (1)
0.625
4
Fine Sand (2)
0.5625
5
Very Fine Sand (3)
0.5
6
Silt (4)
0.4375
7
Silt (5)
0.375
9
Silt (6)
0.3125
10
Silt (7)
0.25
11
Clay (8)
0.1875
12
Clay (9-10)
0.125
13
Clay (11-12)
0.0625
14
Clay (13-14)
0
15
Point Bar
0
1
2
3
4
5
6
7
8
9
10
11
12
13
14
15
CL
1
1-4
0.875
PB
2
4-8
0.6875
SP
3
5-8
0.625
Facies
Facies ID
Classes
Grain size
13/12/2013
CS1
4
5-8
[0.5, 0.75]
CCH
5
6-9
[0.4375, 0.6875]
CS2
6
8-11
[0.3125, 0.5625]
- 76 -
LV
7
8-11
[0.3125, 0.5625]
OB
8
12-16
[0.3125, 0]
MP
9
15
0.125
CF
10*
15
0.125
1
WL
11
16
0.0625
flumy3.5_usersguide
ARMINES / ECOLE DES MINES DE PARIS
6.6 Some references
Bridge, 2003: Rivers and Floodplains, Blackwell Publishing, 491p.
Leopold, Wolman, Miller, 1964: Fluvial processes in geomorphology. Freeman and Company.
Sun, 1996: A simulation model for meandering rivers. Water Resources Research 32(9).
Karssenberg, Törnqvist, Bridge, 2001: Conditioning a process-based model of sedimentary
architecture to well data. Journal of Sedmientary Research, Vol 71
13/12/2013
- 77 -
flumy3.5_usersguide
ARMINES / ECOLE DES MINES DE PARIS
7 User’s comments
Any comments are welcome by sending an email to [email protected]
Please join the Project file (or the set of journal file and input files) when reporting any problem.
Note however that zip files cannot be routed to us, as they will be blocked by Ecole des Mines mail
server. If possible change manually the .zip file extension, for instance into .zap. Or use another
archive format, for instance rar.
13/12/2013
- 78 -
flumy3.5_usersguide