1
ENERGY MANAGEMENT SOFTWARE
POWERSTUDIO
(Standard, SCADA, Deluxe)
Version 3.4
USER MANUAL 2 / 4
(M98232201-03-12B)
CIRCUTOR S.A.
PowerStudio
Contenido
ENERGY MANAGEMENT SOFTWARE ......................................................................................................... 1
USER MANUAL 2 / 4 ........................................................................................................................................... 1
1
RUNNING THE PROGRAM FOR THE FIRST TIME ........................................................................... 4
2
MENU BAR ................................................................................................................................................... 6
2.1
FILE MENU ............................................................................................................................................... 6
2.2
SET UP MENU ........................................................................................................................................... 9
2.2.1
Devices ............................................................................................................................................ 9
2.2.2
Groups of Devices ......................................................................................................................... 16
2.2.3
Units. ............................................................................................................................................. 18
2.2.4
Filters ............................................................................................................................................ 19
2.2.5
Calculated variables ..................................................................................................................... 19
2.2.6
Styles ............................................................................................................................................. 20
2.2.7
Image manager ............................................................................................................................. 21
2.2.8
Reports .......................................................................................................................................... 24
2.2.9
Screens .......................................................................................................................................... 24
2.2.10 Events timetables ........................................................................................................................... 24
2.2.11 Events groups ................................................................................................................................ 24
2.2.12 Events ............................................................................................................................................ 24
2.2.13 Preferences .................................................................................................................................... 24
2.3
EDIT MENU ............................................................................................................................................ 35
2.3.1
Save ............................................................................................................................................... 35
2.3.2
Save as........................................................................................................................................... 35
2.3.3
Undo .............................................................................................................................................. 35
2.3.4
Cut ................................................................................................................................................. 35
2.3.5
Copy .............................................................................................................................................. 35
2.3.6
Paste .............................................................................................................................................. 35
2.3.7
Delete ............................................................................................................................................ 36
2.3.8
Select All ....................................................................................................................................... 36
2.3.9
Find ............................................................................................................................................... 36
2.3.10 Replace .......................................................................................................................................... 36
2.4
SEE MENU.............................................................................................................................................. 37
2.4.1
Back............................................................................................................................................... 37
2.4.2
Devices .......................................................................................................................................... 37
2.4.3
Display options.............................................................................................................................. 39
2.4.4
Toolbar .......................................................................................................................................... 39
2.4.5
About ............................................................................................................................................. 40
3
VARIABLE SELECTION.......................................................................................................................... 41
4
FILTERS...................................................................................................................................................... 44
4.1
FILTER CONFIGURATION ......................................................................................................................... 44
4.1.1
Types of hours ............................................................................................................................... 46
4.1.2
Day types ....................................................................................................................................... 47
4.1.3
Calendar........................................................................................................................................ 50
5
CALCULATED VARIABLES ................................................................................................................... 52
6
REPORTS .................................................................................................................................................... 55
6.1
6.2
ADD, MODIFY AND DELETE REPORTS. ..................................................................................................... 55
REPORT DESIGN WINDOW ....................................................................................................................... 56
2
PowerStudio
6.2.1
6.2.2
6.2.3
6.2.4
6.2.5
6.2.6
7
Action tools ................................................................................................................................... 58
Position tools” ............................................................................................................................. 66
Pages tools .................................................................................................................................... 67
Zoom tools”................................................................................................................................... 67
Miscellaneous tools” ..................................................................................................................... 68
"Editing" tools. .............................................................................................................................. 69
SCADA ......................................................................................................................................................... 70
7.1
ADD / REMOVE SCREEN ......................................................................................................................... 70
7.2
EDITING SCADA SCREENS..................................................................................................................... 71
7.2.1
Action tools ................................................................................................................................... 73
7.2.2
Positioning tools............................................................................................................................ 79
7.2.3
Editing Tools ................................................................................................................................. 79
8
ERROR DETECTION ............................................................................................................................... 80
9
EVENTS ....................................................................................................................................................... 81
9.1
EVENTS SCHEDULES ............................................................................................................................... 82
9.1.1
Daily .............................................................................................................................................. 83
9.1.2
Weekly ........................................................................................................................................... 84
9.1.3
Annual ........................................................................................................................................... 85
9.2
EVENT GROUPS ...................................................................................................................................... 86
9.3
EVENT CONFIGURATION ......................................................................................................................... 88
9.3.1
Annotation ..................................................................................................................................... 92
9.3.2
Actions ........................................................................................................................................... 94
9.4
EVENT VARIABLES ................................................................................................................................. 97
10
APPENDICES ......................................................................................................................................... 98
10.1 EXPRESSIONS AND CONDITIONS.............................................................................................................. 98
10.1.1 Expressions and Conditions Creation Wizard............................................................................. 101
3
PowerStudio
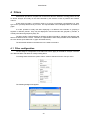
1
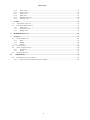
Running the Program for the First Time
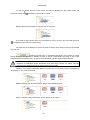
When running for the first time the program will ask if you want to add devices.
section.
By selecting ‘Yes’, you can proceed to add devices as explained further on in the 1.1.1 Devices
When the device is added, you will be asked if you want to add any more devices.
If ‘Yes’ is chosen then a new device will be added, otherwise, the program will start as normal.
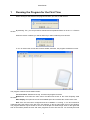
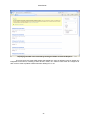
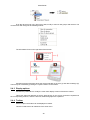
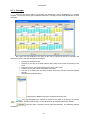
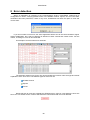
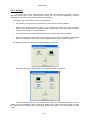
The program consists of three distinct areas:
The main menu: Situated at the top. Accesses all program functions.
Button bar: Just below the main menu. Provides fast access to the most frequently used
functions.
Main display: Occupies the rest of the available space and contains the current active view.
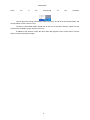
N.B. Once this has been configured and the installation is running, it can and should be
minimized using the button to the left of the four buttons on the top right-hand corner of the window.
The program will then only be shown as an icon in the shape of a small orange arrow on the right hand
side of the toolbar (where the time and other programs such as anti-virus etc. can normally be found
4
PowerStudio
which
run
in
the
background
on
the
machine).
This will prevent its being permanently visible on screen, as well as its accidental closure and
the temptation of other users to use it.
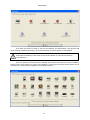
To return to PowerStudio again, double click on the icon or select the “Restore” option from the
context menu available by right clicking on the icon.
In addition to the "Restore” option the “Exit” option also appears on the context menu. Use this
option to leave the program outright.
5
PowerStudio
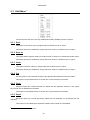
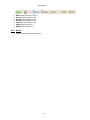
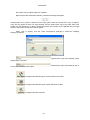
2 Menu Bar
2.1 File Menu
‘New: This option allows you to create a new application and edit it.
‘Open’: Use this option to open any existing application for editing.
6
PowerStudio
‘Remove’: This option deletes any existing application.
‘Modify’: Use this option to change the name of the application being edited.
name.
‘Save as’: Use this option to make a copy of the application being edited and assign it another
‘Engine preferences’: This option configures the address and port of the communications
engine. You may also indicate user and password if authentication is required. These parameters are
used to import/export the application.
‘Import’: Allows configuration of the communications engine to be imported for subsequent
modification.
7
PowerStudio
You may Import:
-
The active application: The engine configuration is imported into the active application. The
contents of the active application are overwritten.
-
A new application: The engine configuration is imported into a new application. The name
of the new application will be requested.
-
Another of the existing applications. The engine configuration is imported into an existing
application. The contents of the selected application are overwritten.
Export: Exports the active application to a communications engine.
The default options are shown in ‘Engine preferences’, but can be modified to send the
application to any other communications engine. If the ‘Verify application’ option is selected before
export the application is verified to be correct or invalid elements are reported. If the ‘Configure
communication speeds with the devices’ option is selected, it will try to communicate with the devices
before sending the application and display a summary of the devices it could not communicate with.
‘Exit’: Terminates the program.
8
PowerStudio
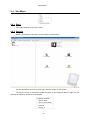
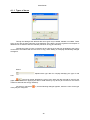
2.2 Set up menu
The main software parameters can be configured using this menu.
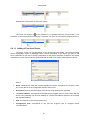
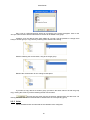
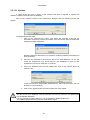
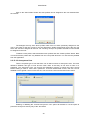
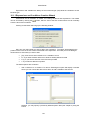
2.2.1 Devices
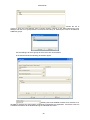
Clicking on this option will bring up the following dialogue:
Here a list with configured devices can be seen, laid out just as they are physically connected.
2.2.1.3 On clicking the ‘Accept’ button the software will try to configure, on those converters
and devices that can be configured, the communication speeds configured in the corresponding
advanced configuration window, see section 2.2.1.3 Advanced Configuration of Devices.
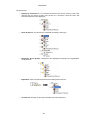
Devices have been classified into those which have a direct connection and converters and
those devices which must be connected to others so that the software can connect with them. The
former appear on the list at the left of the dialogue, and will be called first-level devices from now on,
the second type can be found on the right, and from now on will be termed second-level devices.
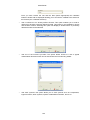
Click “Add” and the following dialogue box will appear to the left:
9
PowerStudio
From here the device we wish to add can be selected. As stated earlier, only devices with
direct network or RS232 connections, and communication converters appear in this dialogue.
Remember that deleting a first-level device will also delete any second-level devices
connected to it..
Once the first-level device has been selected, the devices connected to it may be added by
clicking on the ‘Add’ button to the right of the dialogue. In this case only those devices which can be
connected to a first-level device appear in the dialogue selection.
10
PowerStudio
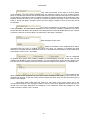
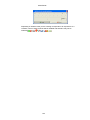
The ‘Check device operation when added’ options tells the software to verify the connection
and send an error message if the device is not working correctly or is absent. Deselect this option f a
check is not required, either because the device has not been installed yet or for any other reason.
Communication may not be possible while adding or modifying devices whose
communication speed varies from the connection, but this will be resolved once the software
finalizes the speed configuration process.
Generic TCP 3
Generis
ModubsTCP 3
X
X
X
X
X
X
Generic UDP 3
X
X
X
X
X
X
X
X
X
X
X
X
TCP50-Alarm
X
X
X
X
X1
X
X
X
X2
X
X2
X
X2
X
X
X
TCP2RS
QNA RS485
TCP2RS
Modbus TCP
X
X
X
X
X
X
X
X
X
X
X
X
X
X
X
X
X
X
X
X
X
X
X
X
X
X
LM50-TCP
Modbus TCP
X
X
X
X
X
X
X
X
X
X
X
X
X
X
X
X
X
X
X
X
X
X
X
X
X
X
X
X
X
X
X
X
LM50-TCP
C-14d
CBS-4
CBS-8
CDR-8
CIRWATT
COMPUTER PLUS
CVM-144
CVM-96
CVM-B/BD
CVM-BC
CVM-K
CVM-K2
CVM-K HAR
CVM-MINI
CVM-NET
CVM-NRG96
CVM-R8
CVM-SP
DH-96
EDMk
Generic MODBUS
LM-24
LM-4
MK-LCD
Mk D
POWERNET
QNA-412
QNA-413
QNA-PT
RGU-10
RRM-C
TR8
TCP2RS
RS232/485
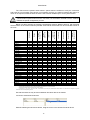
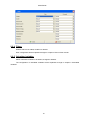
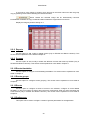
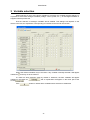
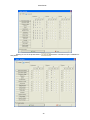
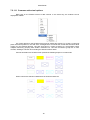
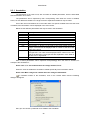
Below is a table showing the possible combinations between different devices, with first-level
devices shown in the columns and the possible second-level devices that can be connected to them in
the rows.
X
X
X
X
X
X
X
X
X
X
X
X
X
X
X
X
X
X
X1
X
X
X
X2
X
X2
X
X2
X
X
X
X
X
X
X
X1
X
X
X
X2
X
X2
X
X2
X
X
X
X
X
X
X
X
X
X
X
X
X
X
X
X
X
X
X
X
X
X
X
X
X
X
X
X
X
X
X
X
X
X
X
X
X
X
X
X
X
X
X
X
X
X
X
X
X
X
X
X
X
X
X
X
X
X
X
X
X
X
X
X
X
X
X
X1
X
X
X
X2
X
X2
X
X2
X
X
X
X
X
X
X
X
X
X
X
X
X
X
X
X
X
X
X
X
X
X
X
X
X
X
X
X
X
X
X
X
X
X
X
X
X
X
X
X
X
X
X
X
X
X
X
X
X
X
X
1
Downloading data using IEC 870-5-102 with Modbus TCP protocol is not recommended.
Restricted to reading values. Configuration is not possible.
Depending on the generic converter used, communication errors may be produced with other devices. To learn how to configure the generic
converters see the corresponding manual.
2
3
Second-level devices may be moved between first-level devices as follows:
Left click to select desired devices.
Without releasing the left mouse button, drag the cursor to the desired first level device
11
PowerStudio
Release the mouse button to effect the change.
The cursor will change to
if the operation is not possible because communication is not
permitted, or second-level devices cannot be connected, or there is an inconsistency between devices.
2.2.1.1 Adding a First-level Device
The device screen can vary depending on the device type being added. The typical first-level
device configuration screen is displayed below, however depending on the device you want to add
some parameters do not exist or specific parameters for the device should be configured. The special
parameters for each first-level device will be dealt with in detail in the section dealing with the device.
Where:
•
Name: Alphanumeric field that uniquely identifies the device throughout the program. There
are no two devices in the configuration with the same name.
•
Description: Enter a brief description of the device using alphanumeric type data.
•
Converter address: Corresponds to the address the program uses to communicate with the
device. This parameter can be an IP address or a name.This address should not be confused
with the MAC address.
•
Port: Corresponds to the communication port.
•
Configuration port: Corresponds to the port the program uses to configure device
communications.
12
PowerStudio
•
Parameters: General communication parameters configuration.
•
Advanced Configuration: Advanced device configuration. See section 2.2.1.3 .
Depending on the device added there may be more or fewer parameters. For more
information see the section on the corresponding device.
2.2.1.2 Adding a Second-level Device
The configuration of second-level devices will be easier because communication configuration
is not required. Second-level devices communicate with the program through the first-level devices
they are connected to.
Where
•
Name: Alphanumeric field that uniquely identifies the device throughout the program. There
are no two devices in the configuration with the same name.
•
Description: Alphanumeric type data to enter a brief description of the device.
•
Peripheral Number: Number identifying the device in communications. Two second-level
devices connected to the same first-level device may not have the same peripheral number.
13
PowerStudio
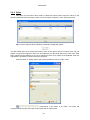
2.2.1.3 Advanced Configuration of Devices
On devices with direct connection features, such as converters, the configuration of certain
communication aspects will be possible. Below is the configuration dialogue of device RS232/485
showing the button used to configure these parameters.
Clicking the ‘Advanced setup” button enables the configuration of these additional parameters.
Depending on the device being configured, some of these parameters may not appear.
•
Delay: Value in milliseconds. This value known as “Timeout” is used to control the time
that software will await the response from a device. The value entered will be added to the
default waiting time for a response from the device.
•
Speed of Communication: Allows communication speed between the software and the
device to be selected. This speed is automatically assigned by default, but it may also be
forced to the desired speed. "Automatic" means the software configure the devices using
the maximum speed common to them all. If specific speed is selected, the software will
configure the devices at this speed, and devices unable to communicate at that speed no
longer communicate.
Speeds are configured to accept changes in the device screen (see 2.2.1 Devices section)
appear.
Once speeds are configured, if there have been any problems the following dialogue will
14
PowerStudio
Devices not configured due to unmatched speeds are shown here. There are two types of
warnings
•
when there have been errors in communication with the device. Once the problems have been
resolved speed configuration can be attempted once more by clicking the ‘Re-try ’ button.
•
When the characteristics of the device make it impossible to change its speed by
communication.
The user is responsible for manually configuring the proper speed on those devices where it
is not possible to configure the speed by communication. To learn how to change the speeds
on the devices, consult the corresponding manual.
15
PowerStudio
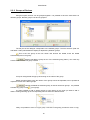
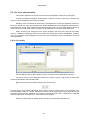
2.2.2 Groups of Devices
Using this option, devices can be grouped together. It is possible to have the same device in
different groups; likewise groups can also be grouped.
The left part of the dialogue corresponds to the defined groups. The tree structure (with son
and father nodes) will facilitate the display of dependency between groups.
This is the root group of the tree. When new devices are added, these are added
automatically to this root group.
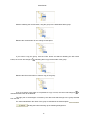
Clicking will add the group as son of the selected group (father). You need only
enter the name of the new group created.
It may be changed later simply by left clicking on the name of the group.
Within the same father group the names of son groups cannot be repeated, but it is possible to
repeat the names of the father groups.
Clicking will delete the selected group, as well as all the son groups. It is possible
(root group).
to delete any group except
It is also possible to add or delete groups by right clicking on the node you want to add or
delete. Clicking will bring up the corresponding menu to select the desired action.
Lastly, it is possible to move or copy a group. Left click on the group you want to move or copy.
16
PowerStudio
Without releasing the mouse button, drag the group to the destination father group.
Release the mouse button for the change to take place.
If you want to copy the group, click the CTRL button and without releasing the left mouse
button, the cursor will change to
indicating that a copy will be made of the group.
Release the left mouse button to make a copy of the group.
If you try to drag a group which is not possible to copy or move, the cursor will change to
indicate that the action is not allowed.
to
The right part of the dialogue is formed by the device list that belongs to the group selected
from the tree.
For easier identification the name of the group is indicated in the list description
Clicking the button will bring up the following dialogue box:
17
PowerStudio
Here a list of configured devices which do not belong to the group will appear. Click on the
“Accept” button and the devices selected from the list will be added to the group.
Likewise, once the devices have been added to a group it will be possible to change them
easily to another group or copy them by selecting them and then left clicking.
Without releasing the mouse button, drag to the target group.
Release the mouse button for the change to take place.
If you want to copy devices to another group, proceed in the same manner as with the group
copy, clicking the CTRL key before releasing the left mouse button.
This will only be active if there are devices selected from the device list. On
clicking the button the devices selected will be deleted from the corresponding group.
2.2.3 Units.
Allows the default units and decimals of the variables to be configured.
18
PowerStudio
2.2.4 Filters
Enables filters to be added, modified or deleted.
Filter configuration will be explained at length in chapter 4 Filters of this manual.
2.2.5 Calculated variables
Allows calculated variables to be added, changed or deleted.
The configuration of calculated variables will be explained at length in chapter 5 Calculated
variables.
19
PowerStudio
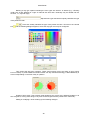
2.2.6 Styles
This option can be used to add, modify or delete font styles used to show the values on the
different SCADA screens and reports. Each one of the styles comprises a color and a font format.
Right click the style list ad the following contextual message will appear.
This will enable styles to be pasted and copied. Some of the options from the context menu may not
appear. Copy will only appear if there is a style selected, and the paste option only if the styles have
been copied onto the clipboard. If no style is selected or there are no styles on the clipboard, when the
right button is pushed the context menu will not appear.
Press the ‘New’ or ‘Modify’ button and it will be possible to add or modify a style.
Corresponds to the name of the style. This name will
uniquely identify the style; there are no two styles with the same name.
20
PowerStudio
Will correspond to the type of font used for the style.
Corresponds to the style of the font. Depending on the font selected,
you can choose bold and / or italics.
Corresponds to the size of the font. The size may be
between 1 and 90. The size can be either keyed in or selected from the dropdown menu which shows
the options available.
Corresponds to the text direction. The orientation
(expressed in degrees) could be between 0 and 350. The size can be either keyed in or selected from
the dropdown menu which shows the options available.
Click the button to select the style color.
Shows an example of how the style will appear.
The ‘Delete’ button will only be active if there are styles selected from the style list. Click the
button to delete the styles selected.
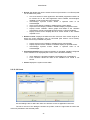
2.2.7 Image manager
Use this option to add, modify or delete images created for a SCADA screen or a report.
Images are organized in the form of a tree, and can be classified into three different categories to be
chosen by the user.
21
PowerStudio
The left side of the dialogue corresponds to the categories defined. The representation in tree
form (with son and father nodes ) facilitates display of the dependency between categories.
This will be the root group of the tree. When adding new images, they are automatically
added to this root group.
Click here to add a son to the selected group (father). Then enter the group
name into the new node created.
To change the group name, select the group and left click on its name.
Within the same father group the names of the sons cannot be repeated, but it is possible to
repeat the names of groups in different father groups.
Click this to delete the selected group as well as all its sons. It is possible to
(root group).
delete any group except the
It is also possible to add or delete groups by right clicking on the node you want to add or
delete. Clicking will bring up the corresponding menu to select the desired action.
or copy.
Lastly, it is possible to move or copy a particular group. Left click the group you want to move
Without releasing the mouse button, drag to the destination group.
Release the mouse button for the change to take place.
22
PowerStudio
To copy the group, click the CTRL button and without releasing the left mouse button, the
cursor will change to
indicating the group will be copied.
Release the left mouse button to make a copy of the group.
If you want to drag a group where it is not possible to copy or move it, the cursor will change to
to indicate that the action is not permitted.
The right side of the dialogue is formed by a list of images which belong to the group selected
from the tree.
Clicking here will bring up a dialogue that allows you to select an image
stored on the PC for later use in SCADA screens or reports. PowerStudio will create a copy of the
image and will work with the copy, at no time will PowerStudio use the original image selected.
The images that can be added should have a maximum size of 2 Mbytes and a maximum
resolution of 2048x2048 pixels. Remember that when larger images are added, the load
times from the SCADA screens or reports client, also increase.
Likewise, once images have been added to a group they can be easily copied or changed, by
left clicking on one of those selected.
Without releasing the left mouse button, drag to the destination group.
Finally, release the left mouse button for the change to take place.
23
PowerStudio
If you want to copy images in another group proceed in the same manner as with the group
copy by pressing CTRL before releasing the left mouse button.
When clicked the selected image will be automatically removed.
PowerStudio will delete the copy created and will not delete the original stored on the PC.
Display the image by double clicking on it:
2.2.8 Reports
Use this option to add, modify or delete reports (only en SCADA and Deluxe versions). This
section will be explained in more detail in Chapter 6.
2.2.9 Screens
Use this option to add, modify or delete the different screens that make up SCADA (only in
SCADA and Deluxe versions). This section will be explained in more detail in Chapter 7.
2.2.10 Events timetables
Use this option to configure event disabling timetables. This section will be explained in more
detail in Chapter 9.
2.2.11 Events groups
Use this option to configure events grouping. This section will be explained in more detail in
Chapter 9.
2.2.12 Events
Use this option to configure a series of events in the software, configure an event disable
timetable, or carry out a series of actions when the event comes about, while it is active and when the
event finishes (only in SCADA and Deluxe versions). This section will be explained in more detail in
Chapter 9.
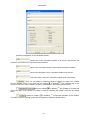
2.2.13 Preferences
This option can be used to configure a series of general parameters for the application.
24
PowerStudio
Using this selector, the application language can be selected
Will indicate to the software if an events log should be saved or not. To save
system events, a table, with the various activities taking place in the system can be displayed, such as
when a user accesses a SCADA screen or is denied access.
Allows the mail server to be configured to make it possible to send emails during events (see section 9.3.2.3 Sending Mail)
Here the ‘E-mail address’ of the sender,' and the Mail server address (SMTP) 'should be
indicated and the mail server authentication enabled if necessary.Once configured it is possible to test
whether the configuration is correct by pressing the ‘Test configuration…’ button, which sends and
email to the sender or displays an error message.
Contact your system administrator for the parameters need to configure the mail server.
Using this option software property updates can be easily made. This
preference will be explained in more detail in section 2.2.13.1 Updates.
25
PowerStudio
Similarly, using ‘Activate User Authentication’, the name and password
of the user trying to access on a remote PC can be requested, in order to allow access to some of the
resources of the application and deny access to the rest of the resources. The ‘Configure users’ button
will allow the resources that each one of authorized users can access to be configured. User
configuration will be explained in detail in section 2.2.13.2.2 Users. If the ‘Save system events’ option is
enabled, user actions will be saved, whether they have been granted access to the resource or if they
have been denied it.
Permits the menu display and toolbar on the Java Client to be enabled
or disabled
. It also enables initial screen setup when the application is displayed through the
Java Client (only in SCADA and Deluxe versions).
The engine can be configured as a RSS content producer so that we
can generate news related to the events which can be consulted by any RSS news reader (available
free for almost any platform and environment).To do so activate the corresponding box in the
‘Configuration of the RSS feed’ window and configure the two required fields. In the ‘URL server’ field
the address to which the HTML server is configured is added and in the 'Number of news feeds’ we
add the maximum number of news stories we want to publish (stories are published in a circle, so that
when the maximum number of stories are published the oldest are removed to continue publishing new
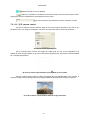
stories). Typically browsers detect that the server contains an RSS feed and allow access thereto
(subscribe).
Message on Internet Explorer about the RSS FEED found
For example, the RSS newsreader provided by Internet Explorer would allow us to consult the
news published by the engine, and is displayed as follows:
26
PowerStudio
Displaying the RSS news released by the Engine/ Editor on Internet Explorer
Of course there are other RSS readers that display the news in different ways for almost any
imaginable environment, including mobile devices, PDAs, etc. Observe what must be configured in
each event in order to publish a RSS news item relating to it or not.
27
PowerStudio
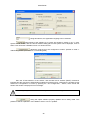
2.2.13.1 Updates
In cases where you have a version of the software and want to upgrade or expand this
limitation, updates should be from the USB key.
appear.
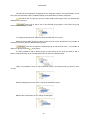
Click on the ‘Updates’ button in the 'Preferences' dialogue and the following window will
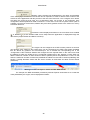
To update follow these steps
1. Click on the ‘Generate file’ button. This button will generate a file with the
information required to perform the update. Once the file has been generated the
following message will appear:
Reporting where the file with the c2v extension containing software information has
been generated.
2. Send the file produced in the previous step to its usual distributor, so you can
create the updated file. You should wait for your distributor to send you the
updated file, with the v2c extension, to continue.
3. Once your distributor has sent the updated file, click on the ‘Search’ button to
select the file.
In this case the file is ‘HaspUpdate_89553109.v2c’, which can be found in the root
directory on your hard drive.
4. Click on the ‘Update’ button and wait until the end of the update.
Whenever necessary an update should be made carrying out the steps described previously.
The file sent by your distributor, with the extension v2c will only serve for one update and
may be deleted afterwards.
It is only possible to update USB keys. It is not possible to update parallel keys.
The USB key update must be done with Administrator rights.
28
PowerStudio
2.2.13.2 User authentication
This section explains how remote user access to the application resources is configured.
A series of profiles are defined. These profiles contain the resources that can be accessed; a
resource can be assigned to more than one profile.
Similarly, users are defined as those who are authorized to access the application resources.
Each user will have a name and a password to enable identification by the application and avoid nonauthorized user access. Each authorized user will be assigned one or more profiles, allowing access to
all the resources contained in profiles. A profile can be assigned to more than one different user.
Finally, access by an anonymous user may be enabled. This anonymous user will not have a
name or a password, allowing access to any remote user without the need for identification. Similarly,
one or more profiles will be assigned to the rest of the users, allowing access to the different resources
of the application.
2.2.13.2.1 Profiles
Use this dialogue box to define profiles used for remote access to application resources.
The list to the left of the dialogue contains the profiles, while the right-hand list shows the
resources permitted to the selected profile.
Right click on the list of profiles to display the context menu,
to enable styles to be copied and pasted. Some options from the context menu may not appear; copy
will only appear if there is a profile selected on the list, and the paste option only if styles have been
previously copied onto the clipboard. If no profile is selected and there are no styles on the clipboard
when the right button is pushed, the context menu will not appear.
Clicking on ‘Add profile’ or ‘Modify profile’ will bring up the following dialogue box:
29
PowerStudio
In this dialogue box the name and resources of the profile may be added or modified
depending on the button chosen. This name is used to identify the profile must be unique; two profiles
with identical names are not permitted.
The list situated to the left of the dialogue box shows the resources added to the profile that
can be used by the users who have that profile assigned, while the left-hand list shows the resources
that the profile user does not have access to.
To add resources to the profile, "Not Permitted" should be selected from the resource list and
button. To delete resources from the profile do
passed onto the "Permitted" resource list using the
the opposite, select "Permitted" from the list and click the
button to pass over to the "Not
Permitted" list.
The resources that can be added to a profile are:
Devices: Devices configured on the software.
View: Allows the chosen devices to be viewed.
Force variables: This allows device variables values to be forced. Only
devices where it is possible to force one or more variable can be shown,
for example digital outputs.
Configure Allows certain device parameters to be configured. Only
devices where parameter configuration is possible will be displayed.
Screens: Will show the various SCADA screens available to configure the
application. See section 2.2.9 Screens.
View: Enables the chosen screen to be viewed.
Force variables: Permits variables to be forced using the "force variable"
controls on the SCADA screens.
Reports: Shows the defined reports. See section 2.2.8.
30
PowerStudio
Events: Will display the various events resources (see section 2.2.12 Events) that
can be added to a profile:
Remote events: Displays the different event resources from remote engines to
which the engine application may be connected (See section 2.2.12 Events).
These events may be added to a profile:
Display active events. Enables or disables active events display.
Display reported events. Enables or disables display of reported events.
Acknowledge reported events. Allows a reported event to be
acknowledged.
Calculated Variables Allows graphs and tables of calculated variables configured
on the software to be displayed (see section 2.2.5 Calculated variables)
Run event actions in client application. Will enable programmed actions to
be carried out on the client application when enabled, acknowledged,
disabled or while events are being produced.
Acknowledge reported events. Allows a reported event to be
acknowledged.
Active events display. Enables or disable active events display.
Reported events display. Enables or disables display of reported events.
Display events variables: Allows graphs and tables of the variables
generated by events to be displayed (see section 9.4 Event Variables)
Display event browser. Displays the list of events stored on file, whether
reported or not.
View: Allows the calculated variables to be displayed or not displayed.
Force variables: Allows the value of the variables to be forced or not
forced.
Others Displays the system events table.
2.2.13.2.2 Users
Use this dialogue box to define the users who will have access to application resources.
The list to the left of the dialogue contains the profiles, while the right-hand list shows the
resources permitted to the selected profile.
31
PowerStudio
Right click the user list and following contextual message will appear:
Allowing users to be copied or pasted. Some of the options from the context menu may not appear.
Copy will only appear if there is a style selected, and the paste option only if the styles have been
copied onto the clipboard. If no user is selected and there are no users on the clipboard when the right
mouse button is clicked the context menu will not appear.
To add or modify a user, click on the button corresponding to ‘Add user’ or ‘Modify user’.
Where:
•
User name: Will be an alphanumeric field which uniquely identifies the user. This field will be
used to identify the user when necessary.
•
Full name: Corresponds to the user's Full name.
•
Description: Field which permits a brief description of the user to be entered.
•
Password: Password which serves to avoid unauthorized users accessing the application
resources.
•
Confirm password: Field which serves to validate the password entered in the previous field.
The values entered in the ‘Password’ and ‘Confirm Password’ must be the same in order to
consider the password valid.
•
Enable menu and toolbar: Enables the menu and the application toolbar for the user.
•
Start screen: Allows the start screen viewed by the user from the client to be configured.
To delete one or more users, select those users we wish to delete from the user list and click
"Delete User" button.
32
PowerStudio
Click on the "Add Profiles" button and new profiles can be assigned to the user selected from
the user list.
The dialogue will only show those profiles which have not been previously assigned to the
user. In this case for the user "jburgos" only the "Supervisor" profile will be shown as it is the only one
which has not been assigned to the user. On choosing "Accept" the profiles selected from the list will
be assigned to the user.
To delete a user profile, select the desired user profiles and click "Delete profiles" button. Bear
in mind that these profiles are only deleted from the user profile list and in no case are they deleted
from the application.
2.2.13.2.3 Anonymous User
There is a special type of user that from now on will be known as anonymous user. The main
difference between this type of user and the other users is that they do not have a name or a
password. The anonymous user can access the application resource to which they have access
without having to enter a name and a password. To avoid unauthorized access, this user can be
disabled to have greater control over those who can access the resources and those who cannot.
Enabling or disabling the "Activate anonymous user" option will activate or not the option to
permit the anonymous user by way of the Java Client.
33
PowerStudio
2.2.13.2.2 UsersThe list will show the profiles assigned to the anonymous user, with the "Add
profile" and "Delete profile" buttons working the same as those of any other user (see section
2.2.12.2.2 Users)
34
PowerStudio
2.3 Edit Menu1
The options from this menu are only enabled when editing SCADA screens or reports.
2.3.1 Save
This option is used to save any change made to a SCADA screen or report.
This option will only be enabled if a change has been made to a SCADA screen or report.
2.3.2 Save as
This option allows changes made to a SCADA screen or report to be saved with another name.
This option will only be enabled if a change has been made to a SCADA screen or report.
2.3.3 Undo
This option is used to undo any change made to a SCADA screen or report.
This option will only be enabled if a change has been made to a SCADA screen or report.
2.3.4 Cut
Use this option to copy selected controls to the clipboard and delete them from the editor.
This option is only enabled if there is at least one control selected on the editor.
2.3.5 Copy
Using this option the controls selected are copied onto the clipboard. Unlike the "Cut" option
the controls are not deleted from the editor.
This option is only enabled if there is at least one control selected on the editor.
2.3.6 Paste
Using this option the controls previously copied from the clipboard can be pasted onto the
clipboard.
This option is only enabled if the clipboard contains valid controls for PowerStudio.
1
Only in SCADA and Deluxe versions
35
PowerStudio
2.3.7 Delete
Use this option to delete the selected controls.
This option is only enabled if there is at least one control selected on the editor.
2.3.8 Select All
Using this option all the SCADA control screens or a report can be selected.
2.3.9 Find
This option is used to find any text in a SCADA screen or report.
This option will only be enabled when editing a SCADA screen or report.
2.3.10 Replace
This option is used to replace any text in a SCADA screen or report.
This option will only be enabled when editing a SCADA screen or report.
36
PowerStudio
2.4 See Menu
2.4.1 Back
This option displays the previous screen.
2.4.2 Devices
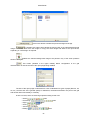
Clicking on the devices will open a screen similar to the following:
It is also possible to view this by clicking the "Devices" button on the toolbar.
The tree on the left of the window shows the status of all configured devices. Right click the
tree and the following context menu will appear:
37
PowerStudio
The options are:
o
Display by Connection: 2.2.1 DevicesThe devices are shown as they have been
entered onto the device screen (see section 2.2.1 Devices), where the first and
second-level devices are displayed.
o
Show by device: The devices are classified according to their type.
o
Display by device groups: The devices are displayed according to the organization
set by the user.
o
Expand all: Click to expand the entire tree showing all the devices.
o
Contract all: Clicking on this option will hide second-level devices.
38
PowerStudio
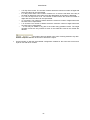
From the device group view, right click to add, modify or remove new groups and devices. The
context menu will change in the following manner:
The information found on the right side of the window:
Contains general information about the device selected on the tree (1) and device settings (2).
These may be accessed by pressing the ‘Options’ button on the toolbar.
2.4.3 Display options
Contains the parameters to modify the Java client display screens of the device values.
This menu option will depend on what is being shown on the screen, and will be explained in
the corresponding sections, when the devices, tables and graphs are explained.
2.4.4 Toolbar
With this option the toolbar can be displayed or hidden.
This bar contains the main elements of the View menu.
39
PowerStudio
Back: See section 2.4.12.4.1
Devices: See section 2.4.2
Screen: See section 2.2.9
Reports: See section 2.2.8
Options: See section 2.4.3
Import: See section 2.1
Export: See section 2.1
2.4.5 About
Shows information about the software.
40
PowerStudio
3 Variable selection
When selection of one or more device variables is necessary, the variable selection dialogue. It
is possible to select both analogue variables (voltage, current, power, etc...), as well digital variables on
equipment which permits this.
First the selection of analogue variables will be detailed. This dialogue will depend on the
device connected, the explanation corresponding to CVM-96 can be used for this section.
Where the desired variables may be checked. If any variable is already selected it will appear
and may not be unchecked.
marked as
If a filter has been selected, either by default or otherwise, the filter variables will appear
and an explanation will appear on the lower part of the
marked on the button as
screen
If the
button is clicked all the variables will be selected or deselected.
41
PowerStudio
Clicking on one of the phase buttons
that phase.
will select or deselect only the variables for
42
PowerStudio
Click on one of the variables, for example
be selected.
Finally, click on
and all boxes for this variable will
phases 1, 2 or 3, and instant, maximum or minimum, are selected
according to the button pressed. If all three phases are selected the button switches to
pressed the 3 phases are deselected.
43
and when
PowerStudio
4 Filters
PowerStudio provides a complete set of tools that allow the definition of energy filters as well
as further analysis and study on the data collected by the devices in both a powerful and intuitive
manner.
A filter study provides a consistent result in an energy consumption representation for each
type of hour (counter) defined at any moment. This representation can be displayed either as a table or
graph.
It is also possible to study this data displaying it at different time intervals or grouping it
together in different periods. They may be displayed in annual intervals and grouped by months, in
monthly intervals and grouped by days, etc.
The filter studies consist basically of defining the filters (typically a calendar) and applying said
filter to the data stored in a device. Therefore, a representation of the study realized can be obtained as
the user desires (and visible both in graph and table format.)
The time bands defined in the filters are in the editor's local time.
4.1 Filter configuration
The first stage is configuration of the filters we want to apply to the data for analysis. The user
can add new filters and delete or modify existing filters.
To manage these actions the option "Filters" must be selected from the "Set up" menu.
The following dialogue will appear:
44
PowerStudio
Here filters can be added, deleted or modified.
Right click the filter list and the following contextual message will appear.
enabling filters to be copied or pasted. Some of the options from the context menu may not appear.
Copy will only appear if there is a style selected, and the paste option only if the styles have been
copied onto the clipboard. If no filter is selected and there are no filters on the clipboard when the right
button is clicked the context menu will not appear.
When “Add” or “Modify” from the "Filter Configuration" dialogue is clicked the following
dialogue will appear:
Alphanumeric type data enabling unique
identification of the filter.
Alphanumeric type data enabling user to
enter a brief description of the filter.
Configures the different types of hours defined in the filter.
Configures the different types of days defined in the filter.
Configures the filter calendar.
45
PowerStudio
4.1.1 Types of hours
Through this dialogue the different filter hour types may be added, deleted or modified. These
types of hour are the basic elements of the definition of the filters. Here the registered consumption is
distributed in accordance with the calendar (maximum energy and demand).
Typically the types of hours correspond to the various prices that can be applied to the energy
consumed in accordance with the time zone or day). When adding or modifying the following dialogue
will appear:
Where:
hour.
Alphanumeric type data for uniquely identifying the type of rate
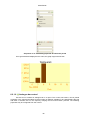
Color that visually identifies the type of hour within the filter and will be used for the
graph which results from applying this filter to data stored by any device (all counters for the various
maximum demand and energy variables).
Left click on colored box
of day may be configured.
1, and the following dialogue appears, where the color for the type
46
PowerStudio
Clicking the “Delete” button, will delete all the selected hour types from the list.
Once defined they are distributed to each day defining the various day types that will make up
our filter.
4.1.2 Day types
Use this dialogue to add, delete or modify the various day types. On adding or modifying the
following dialogue will appear:
47
PowerStudio
Defining a day type implies indicating the hour types into which it is divided (e.g. a Sunday
could have all day defined as a type of reduced rate time and a weekday may be divided into two
sections, i.e., day and night)
of day within the filter.
Alphanumeric type data which uniquely identifies the type
Color that visually identifies the type of day within the rate. Left click on the colored
box
and the following dialogue appears, where the day type color may be configured.
Time zones that day types configure. These zones should occupy the entire 24 hour period,
but not overlap. In practice different sections within one day indicate that energy is billed differently in
each one depending on the time of day in question.
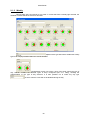
Graphs of time zones. This provides visual guidance how such a day is defined (enabling us to
see at a glance, among other things, if any time zone throughout the day needs to be confirmed)
Adding or modifying a zone will bring up the following dialogue:
48
PowerStudio
This corresponds to the hour type within the slot. 4.1.1 Types of
hoursThe hour types will be those configured in section 5.1.1. Hour types
Use this button to add new hour types to the filter.
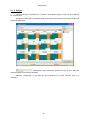
Numerical selection of a time zone.
Graph of the time zone. Each column
represents one hour of the day, each row is a period of 15 minutes. For the slot selection proceed as
follows:
start of the time zone.
•
Left click on the
•
Without releasing the button, drag it
•
Release the button and the time zone will have the color for the time of day
until the end of the time zone.
The zone can be defined manually in a numerical way but this is only useful if one wants to
accurately define any slot precisely in minutes (for instance a zone from 10:10 to 15:40).
This dialogue only allows a continuous time zone to be defined.
49
PowerStudio
4.1.3 Calendar
Once the day types making up the filter are defined they will be distributed in a complete
calendar. To this end, the day types created beforehand in the filter process will be distributed on these
calendars.
Day types may be assigned to the days of the year in course as well as to previous and
forthcoming years. Day selection is done as follows:
•
•
•
•
•
•
Pressing on the desired day.
Pressing on the day of the week selects all the days of the month for that day of the
week.
Pressing on the month name selects all the days of the month.
Pressing on the year selects all the days of the year.
Left click on a starting day and drag to select all the days that the cursor has passed
through.
Using the fast selection option.
Listing with the different day types configured under the rate.
Day type assigned to the calendar if selections are made. If no day type is selected
will appear, indicating that the days on the calendar will be selected rather than deleted.
will appear.
with this option, selections will be made automatically. The following dialogue
50
PowerStudio
In this case every working day of 2005 will be checked with the "Winter Day" type.
Eliminate the selection by pressing on the day with the same selected day type.
51
PowerStudio
5 Calculated variables
There are certain situations where it is necessary to obtain the results of an operation between
the variables of the different devices, for example the sum of energies. PowerStudio has this type of
feature available for the so-called calculated variables. The values of these variables will be the result
of formulas comprising variable values from other devices or other calculated variables.
For a better organization, the calculated variables will be divided into groups of calculated
variables.
Use this dialogue to define the groups and variables calculated to be used in the software.
The list situated on the left contains the different groups of variables calculated, while the list
on the right will show the variables calculated from the selected group.
Right click on the group list and the context appears.
Allowing calculated groups of variables to be copied or pasted. Some of the options from the context
menu may not appear. Copy will only appear if there is a style selected, and the paste option only if the
styles have been copied onto the clipboard. If no group is selected and there are no groups on the
clipboard when the right button is clicked the context menu will not appear.
When adding or modifying a group the following dialogue will appear:
Here the calculated variables group name and a brief description may be entered for better
identification within the software.The calculated variables may also be saved along with the capture
time in minutes.
When adding or changing a calculated variable this dialogue appears:
52
PowerStudio
permitting configuration of the calculated variable.
Allows each of the calculated variables to be used in expressions and
conditions, see section 10.1 Expressions and conditions
Name of the calculated variable, used to better identify the variables.
Allows a text description of the calculated variable to be entered.
Text of the units in which the calculated variable value is expressed.
Here you may enable or disable the ability to change the value of the variable
from the SCADA screen, or an event may be enabled
or disabled
. Only variables that do not
contain references to other variables, devices or calculations in the formula may be forced.
Allows for enabling
or disabling
the possibility of recalling the
last forced value of the variable. This field is useful for rebooting the software using the last forced
value.
Allows for enabling
or disabling
incremental calculation of the variable.
This field is useful for viewing incremental, as opposed to absolute variable values.
53
PowerStudio
Enables the grouping criteria for virtual values in graphs, tables and
reports to be selected. For example, if a value is given every 5 minutes (e.g. 10, 12 and 7), and the
values are grouped every 15 minutes, i.e., all three values expressed at once, the value obtained will
be:
• Maximum value: The maximum value of the 3 (12) will be shown.
• Minimum value: The minimum value of the 3 (7) will be shown.
• Average value: The average value of the 3 ((10 + 12 + 7) / 3 = 9.66) will be shown.
• Last value: The last value (7) will be displayed
• Sum of the values: The sum of the values will be shown (10 + 12 + 7 = 29).
calculated variable.
This permits selection of the number of decimal places for the
Here the formula which will give the result of
the virtual variable is shown. It can be entered manually or using the “wizard”
(see 10.1.1
Expressions and Conditions Creation Wizard). Once entered the formula will be automatically analyzed
and where it can be used will be shown. For example:
It can be used on SCADA screen and reports, to make graphs and tables with the values
obtained, it can be used in the event conditions, but a filter cannot be applied.
The calculated variables are codified for their use in formulas and expressions like
R$CAL_group.variable
Using the prefix R$CAL tells the program that this is a calculated variable rather than a device
variable, group is the name of the group to which the calculated variable belongs and finally, variable to
the identifier entered in the field corresponding to the calculated variable.
54
PowerStudio
6 Reports2
The "Reports" option from the ‘set up ‘ menu enables templates for reports to be designed.
6.1 Add, modify and delete reports.
Click the "Reports" option from the ‘Configure ‘ menu to create, modify or delete reports.
Several options will appear if reports have been previously created.
The ‘New ’ option will appear and a new report may be created, followed by the name of the
reports that have already been created (if any). Right click on any of the already existing reports to
modify names and eliminate reports.
Selecting the ‘New’ option brings up a window where the name of the new report to be created
can be chosen.
Selecting ‘New’ or clicking an already existing report brings up a report design window.
2
Only in SCADA and Deluxe versions
55
PowerStudio
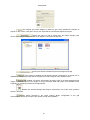
6.2 Report design window
The report design window looks like this:
The window is divided into three areas:
•
•
•
Tools (1)
Information panel (2)
Report page (3)
These tools allow the report design to be configured more easily.
The information panel enables access to all the configuration options of a control, which is
added to the report design and may be selected at that time.
The report sheet is the report design view.
Therefore, using the tools (1) controls can be inserted in the report sheet (3) whose properties
can be configured in the information panel (2).
When a new report is being created, the configuration properties will appear by default in the
information panel at the bottom of the report. These are the same properties that appear when no
control selected.
The ‘Display grid’ option displays or hides the grid, which indicates the position of
objects on the screen. If the grid is shown, the object will be automatically aligned to the grid.
Select this option to add an image from the image manager (see
section 2.2.7 Image manager) so that it can appear in the report background.
56
PowerStudio
Click on this button to delete the present background image.
If enabled, this option will maintain the aspect ratio of the selected background
image. If disabled, it will force the image to occupy the entire length and width of the report sheet,
expanding or contracting it as required.
Enables the selected background image to be placed in any of the seven positions
shown in the figure.
This button (situated in the upper toolbar) allows configuration of the grid
characteristics as well as the size of the report page being detailed:
The size of the report page is selected from a list of standards for types of paper (DIN-A4, A3,
A2, etc.) and the size of the grid will specify in millimetres, the distance between one point of the grid
and another either horizontally or vertically.
In terms of tools, there are several grouped according to their use:
- “Action”
- “Positioning”
- “Page”
- “Zoom”
- “Various”
- “Editing”
tools
tools
tools
tools
tools
tools
57
PowerStudio
6.2.1 Action tools
6.2.1.1
Select controls
This tool allows the user to edit the properties of one or more controls that have been placed
on the report page or to apply any other tool. Left click the control to select it. To select more than one
control hold down the left mouse button and draw a selection box covering the desired controls. The
controls outside of the selection box remain unchecked or cease to be selected if previously checked.
The behaviour of this tool can be changed by holding down the "Control" key or the "Shift" key.
Select the desired Controls while holding down the "Control" key and the current selection is reversed,
i.e. unselected Controls are selected and all selected controls are deselected. Holding down the "Shift"
key will add controls that have not been selected to those which already have been.
6.2.1.2
Text control
This tool will allow fixed text strings to be included in the report. Select this tool and draw a
selection box on the report by keeping the left mouse button pressed. The properties than can be
configured from this control are:
one.
Choice of a previously created text style or creation of a new personalized
The style will apply to the font type used for the text.
Depending on the font selected, bold and / or italics may be chosen.
Corresponds to the size of the font. The size may be between 1 and
90. The size can either be entered manually or selected from the dropdown menu showing the
options available.
Corresponds to the text orientation. The orientation (expressed in
degrees) may be between 0 and 350. The size can either be entered manually or selected
from the dropdown menu showing the options available.
Clicking on this allows the text color to be selected.
58
PowerStudio
This allows positioning of the text within the rectangle defined in the report sheet.
The text to be displayed is written here.
•
Use this button to add the personalized configuration created for the active text control as a
style for use with other controls.
6.2.1.3
Image control
Use this tool to insert still pictures into the report. Select this tool and draw a selection box on
the report by keeping the left mouse button pressed. The properties than can be configured from this
control are:
Use this option to select an image from the image manager, see
section 2.2.7 Image manager, to select an image to assign to the control shown in the report.
Click on this button to delete the present background image.
If enabled, this option will maintain the aspect ratio of the selected background
image. If disabled, it will force the image to occupy the entire length and width of the rectangle
defined in the report, expanding or contracting its measurements as required.
This will help decide on which side of the rectangle defined on the report sheet the
image will be placed.
6.2.1.4
Date Control
This tool allows a date to be entered in the report (current or not). Select this tool and draw a
selection box on the report by keeping the left mouse button pressed. The properties than can be
configured from this control are:
59
PowerStudio
This option enables the type of date shown on the report to be
chosen. The following choices are available:
•
•
•
•
Any date: Any date defined by the user.
Present date: The date at the moment the report is made.
Start date: The start date of the information used in the report.
End date: The end date of the information used in the report.
The previously created text style may be selected or a new personalized
one created for the date.
This corresponds to the type of font used for the date text.
Depending on the font selected, bold and / or italics may be chosen.
Corresponds to the size of the date text font. The size may be
between 1 and 90. The size can either be entered manually or selected from the dropdown
menu showing the options available.
Corresponds to the orientation of date text. The orientation
(expressed in degrees) may be between 0 and 350. The size can either be entered manually or
selected from the dropdown menu showing the options available.
Click the button to select the date text color.
This will allow us to decide on which part of the rectangle defined in the report sheet
the date text will be placed.
Here the date format may be established. Several are pre-defined
and can be manually entered from the keyboard. The different models defined are:
o
o
y year. If the number of letters is 3 or more the full year is represented (2006) and if
not the abbreviated value (06).
M Month of the year. If the number of letters is 3 or more it will be interpreted as the
name of the month, if not the number of the month.
60
PowerStudio
o
o
o
o
o
o
d Day of the month. The number of letters will be the minimum number of digits with
which the value can be represented.
E Day of the week. If the number of letters is 4 or more the full name of the day of
the week is displayed. If the value is less the abbreviation of the name is displayed.
H Time of day from 0 to 23. The number of letters will be the minimum number of
digits with which the value can be represented.
m minutes. The number of letters will be the minimum number of digits with which
the value can be represented.
s seconds. The number of letters will be the minimum number of digits with which
the value can be represented.
‘ Text may be added to any part of the model using quotation marks. The single
quotation marks are only needed if some of the characters used in the models are
desired.
This option will only appear in the case of having selected ‘Any date’.
Wherein a specific date can be chosen to show in the report.
•
Use this button to add the personalized configuration created for the active text control as a
style for use with other controls.
61
PowerStudio
6.2.1.5
Formula control
This tool will permit a formula to be included in the report (the final result will be seen in the
report). Select this tool and draw a selection box on the report by keeping the left mouse button
pressed. The properties than can be configured from this control are:
The previously created text style may be selected or a new personalized
one created for the date.
This corresponds to the type of font used for the formula text.
Depending on the font selected, bold and / or italics may be chosen.
Corresponds to the size of the formula text font. The size may be
between 1 and 90. The size can either be entered manually or selected from the dropdown
menu showing the options available.
Corresponds to the orientation of text formula. The orientation
(expressed in degrees) may be between 0 and 350. The size can either be entered manually or
selected from the dropdown menu showing the options available.
Click the button to select the formula text color.
This will permit us to decide on which part of the rectangle defined in the report sheet
the text formula will be situated.
Using these selectors the number of whole and decimal numbers shown
by the result value of the formula calculation can be specified.
This option will only be available if a specific number of whole numbers has been
specified in the previous option. If the value resulting from the formula does not reach the
specified whole number, the remaining spaces will be padded with zeros
This option will be available only in the event that a specific number of decimal
places has been selected in the previous option. If the value resulting from the formula does
not reach the specified whole number, the remaining spaces will be padded with zeros
62
PowerStudio
Will display a thousands separator in the value resulting from the formula. This
separator will depend on the regional configuration of the system where the program is
running.
Here the formula that will produce the result to be displayed on the report
button (see 10.1.1
page is specified. It can be entered manually or using the “wizard”
Expressions and Conditions Creation Wizard).
cannot be evaluated.
6.2.1.6
This will display a zero instead of a dash if the expression
Conditioned control
This tool will allow us to include both a control and the previously defined data (text label,
image, formula ,date ) in the report, that will be shown only during specified conditions. The properties
that can be configured for this tool will depend on the type of control which has been chosen in
. The common options will be:
Here the condition which gives rise to the appearance of the chosen
control on the report page is specified. It can be entered manually or using the “wizard”
(see 10.1.1 Expressions and Conditions Creation Wizard)
Once the condition has been specified, click the ‘New’ button and the
condition will be added to the condition list. To delete a condition from the list just select it and
push the ‘Delete’ button. When there is more than one condition on the list, the control will
activate when one of more of them is complied with.
Right click on the report page to cut, copy, paste, delete, select all the controls or show or hide
the toolbar.
63
PowerStudio
6.2.1.7
Embedded Graph Control
Use this tool to embed a graph in a report. This control, like others, can be placed anywhere in
the report and enables a large number of variables to be viewed.
The style of the text, axes and keys (i.e., font, size, color, etc.), may also be configured. The
variable keys, axis color, background color (it can also be transparent) and the variables to be
represented may be displayed or hidden.
Embedded graph control properties and control representation
The color and type of representation for each variable may be chosen. The choices are bar
graph, lines or points. For scatter type representations we can select between dots, circles (5x5),
squares (5x5), diamonds (5x5), X (5x5), Crosses (5x5), Xs (3x3) and Crosses (3x3). Also, for the line
representation, the style can be chosen (solid, dashed, dotted, line-dot and line-dot-dot) as well as
thickness (between 1 and 10 points).
The most important parameter, apart from the variables to be represented, and that will
determine the final aspect of the graph (and, most importantly, the amount and distribution of
information to show), is the period of time.
The period can be automatic, 5 minutes, 10 minutes, 15 minutes, 20 minutes, 30 minutes, 1
hour, 1 day and 1 month. In the event that the period is automatic we can choose the number of values
of the variables that make up the graph we want to see.
There is a fundamental difference between choosing the automatic period and any other
period. The automatic function groups the data according to the graph period. So, for example, if the
graph period is one week, the values of all variables to be represented will be grouped into a single
value for the graph. It is therefore necessary to indicate the number of periods to be displayed, and
these periods must always be prior to the report period. Thus, a monthly report with an embedded
graph, an automatic period and 6 values, will produce a graph with values grouped by month,
displaying the month of the report (last value) and the previous five months. If automatic is not chosen,
the values represented will be grouped according to the period specified, and only those included in the
period of the report will be included. For example, a weekly report with an embedded graph that has a
one day period, will produce a graph of the week's report with the values grouped by days (typically 7
values). With a period other than automatic, values that are not included in the report period are not
shown, whereas the automatic option allows the display of values prior to the report period.
64
PowerStudio
Properties of an embedded graph with an automatic period
Once generated and displayed in the client, the graph might look like this:
6.2.1.8
Analogue bar control
Use this tool to include an analogue bar in a report. This control, like others, can be placed
anywhere in the report and enables a large number of different variables to be viewed.Select this tool
and draw a selection box on the report by keeping the left mouse button pressed. The following
properties may be configured from this control:
65
PowerStudio
minimums or both.
vertical.
left or right.
Selection of values to be viewed in the control, maximums,
Indicates the orientation of the control between horizontal or
Indicates where to display the control value label: above, below,
Select the variable that the control will monitor.
Indicate the maximum value the control can display.
Indicate the minimum value the control can display.
Indicate the maximum prealarm value the control can display.
Indicate the maximum alarm value the control can display.
Indicate the minimum prealarm value the control can display.
Indicate the minimum alarm value the control can display.
Indicate whether or not messages relating to alarm and pre-alarm values
are displayed in the control.
6.2.1.9 Common options for action tools
Any control entered in the report sheet can be re-sized and moved. To re-size a control just
place the mouse pointer on one side of the rectangle which surrounds the control and keep it pressed
down while moving it in the desired direction. To move a control left click and hold while dragging the
mouse in the desired direction. Move multiple controls by grouping them inside a selection box. Left
click and hold to group two or more controls, drawing a selection box including the desired controls
within.
6.2.2 Position tools”
Horizontally center: This function requires at least one control to be selected. Using the
selected control as reference, one or more other controls situated on the report sheet can be aligned
horizontally. The control or controls will move to the left or the right to end up completely aligned on the
page. If this option is used with the “Control” button pressed each of the controls selected will be
aligned independently.
66
PowerStudio
Vertically center: This control requires at least one control to be selected. Using the selected
control as reference, one or more other controls situated on the report sheet can be aligned vertically.
The control or controls will move up or down to end up completely aligned on the page. If this option is
used with the “Control” key pressed each of the controls selected will be aligned independently.
Horizontally re-size: This function requires at least two controls to be selected. The
horizontal size of a control can be aligned to another existing one using this tool. Hold down the
‘Control’ key while left clicking the controls to be re-sized. The last control selected will used as a
reference for re-sizing the others, i.e., all the selected controls will end up with a horizontal dimension
equal to the last control selected.
Vertically re-size: This tool operates in the same manner as horizontal re-sizing but with
reference to the vertical size of the last control selected.
Re-size vertically and horizontally. This tool will re-size horizontal and vertical dimensions
simultaneously.
Redistribute space horizontally: This function requires at least three controls to be selected.
The horizontal position of selected controls can be adjusted to place them equidistant from each other.
I.e., controls to which this tool has been applied will be spaced evenly left to right.
Re-distribute space vertically: This tool operates in the same manner as the horizontal space
redistribution but with reference to the vertical re-distribution.
Align left: This function requires at least two controls to be selected. Aligns controls
according to the left most part. Hold down the ‘Control’ key while left clicking the controls to be realigned. The last control selected will used as a reference for re-aligning the others, i.e., all the
selected controls will end up aligned to the last control selected..
direction.
Align right: This tool operates in the same manner as the left align but in the opposite
Align top: This function requires at least two controls to be selected. This function enables
alignment of the upper edges of controls. Hold down the ‘Control’ key while left clicking the controls to
be re-aligned. The last control selected will used as a reference for re-aligning the others, i.e., all the
selected controls will end up aligned with the top edge of the last control selected..
Align bottom: This tool operates in the same manner as top align but with reference to the
bottom edges of controls.
6.2.3 Pages tools
Add page: Use this tool to add a new page to the report. Reports can have multiple pages
with separate content. Each of these pages is linked to a single report and the only common element
between different pages are formulae.
Delete page: Use this tool to delete the active page.
Forward / Back: Use these tools navigate through a report containing more than one page.
Using this control will directly show a page of the report without having to progress
page by page with the tools described above. Clicking the control opens up a list of pages available for
the active report.
6.2.4 Zoom tools”
Zoom in/Zoom out: Using these tools you can zoom in or out from the image that is
currently defined for the report page display.
67
PowerStudio
Use this control to indicate a specific zoom to implement on the report page. The
values range from 50% to 1000%. Use ‘Fit to page’ mode to adapt the zoom to the report sheet being
displayed, to appear as large as possible given the screen resolution where the program is running.
6.2.5 Miscellaneous tools”
Configure formulas: Use this tool to define formulas, which may be applied to or referenced
in any of the report pages for which they have been defined. The following window will appear when the
button is clicked:
Right click the list of formulas and the following contextual message will appear
enabling cutting, copying, or pasting variables in the active report, as well as enabling formulae to be
copied between different reports or SCADA screens. Some of the options from the context menu may
not appear. Copy will only appear if there is a style selected, and the paste option only if the styles have
been copied onto the clipboard. If no formulae are selected and there are no formulae on the clipboard
when the right button is clicked the context menu will not appear.
Click ‘Delete’ to eliminate the selected formula. Click ‘Add’ or ‘Modify’ to open the formula
modification window:
10.1 Expressions and conditionsUse to name and detail formulae (see appendix 14.2
Expressions and conditions). Formula names cannot contain certain types of special characters nor
contain reserved words. 10.1 Expressions and conditionsReserved words are those that match the
name of an available function (see appendix 14.2 Expressions and conditions).
68
PowerStudio
Horizontal/Vertical Orientation: This tool enables the orientation of the report sheet to be
defined. Controls do not reorganize when changed from horizontal to vertical or vice versa. So some
may end up invisible by virtue of being covered by another. However, these controls have not been
deleted, and if the change is reversed they will become visible again.
6.2.6 "Editing" tools.
2.1 File Menu 2.3 Edit MenuThese tools carry out the same operations as the options from the
‘File’ and ‘Edit’ menus. See sections 2.1 File Menu and 2.3 Edit Menu.
Save. Use this tool to save changes made to the report.
Save as: Use this tool to save a copy of the report with a different name.
Cut: Use this tool to copy selected controls to the clipboard and delete them from the report.
The same operation may be performed using the “Control” + “x” keyboard command
Copy: Use this tool to copy selected controls to the clipboard. The same operation may be
performed using the “Control” + “c” keyboard command
Paste: Use this tool to paste the clipboard contents to the report. The same operation may
be performed using the “Control” + “v” keyboard command
Undo: Use this tool to revert recent changes to a previous state. The same operation may
be performed using the “Control” + “z” keyboard command
Delete: Use this tool to delete controls in the report.
Select all: Use this tool to select all report controls at once. The same operation may be
performed using the “Control” + “e” keyboard command
Search: Use this tool to find specific text in report.
Replace Use this tool to replace specific text in a report with different text.
69
PowerStudio
7 Scada3
SCADA allows display of one or more windows, with or without a background image,
incorporating display control, turning the PC into a powerful and versatile synoptic panel of the
installation.
The aim is to generate an application, consisting of one or more screens, which can run
independently in a designated facility.
A standard application would consist of a main screen serving as a basis for others that will
appear according to given requirements. The number of screens is only limited by the conditions
existing on the PC where the program is running.
7.1 Add / Remove screen
To create, modify or delete screens in the SCADA Click the ‘screen’ option in the 'Setup' menu.
Several options will appear, depending on whether or not SCADA screens have been previously
created.
As can be observed in the figure, the option ‘New’ will appear, which will enable a new screen
to be created, followed by the name of the screens that have been created until the present (if any).
Right clicking on any of the screens already in place will display options for modifying names and
removing the screens.
In the case of selecting the ‘New’ option a window will appear where the name of the new
report to be created can be chosen. This name will uniquely identify the screen in the SCADA system.
Select ‘new’ or any already existing screen and a SCADA screen design window will open.
3
Only in SCADA and Deluxe versions
70
PowerStudio
7.2 Editing SCADA screens
Use this function to add, change or delete screen controls. Use these controls to display the
value of a variable, perform an action, paint an area of the screen, and so on.
The purpose of the screen is to display the status of the installation in a simple manner,
allowing the situation on the different lines in the plant to be viewed, display the installation electricity
variables, etc. The screen controls make this possible.
The edit window of the SCADA screen looks like this:
The window is divided into three areas:
•
•
•
Tools (1)
Information panel (2)
SCADA screen (3)
The tools permit a simpler configuration of the SCADA screen design.
The information panel allows access to all the configuration options of a selected control being
added to the design of the SCADA screen.
The SCADA screen is the design view from which the controls are implemented.
Thus, using the tools (1) controls may be entered on the SCADA screen (3) whose properties
may be configured in the information panel (2).
When creating a new SCADA screen, its background configuration properties will appear by
default on the information panel.These properties are the same as those which appear when no control
selected.
71
PowerStudio
The ‘Display grid’ option displays or hides the grid, which indicates the position of
objects on the screen. If the grid is shown, the object will be automatically aligned to the grid.
Select this option to add an image from the image manager (see
section 2.2.7 Image manager) so that it can appear in the report background.
Click on this button to delete the present background image.
If this option is enabled, the background image is displayed in its actual size. If
disabled the background image will be stretched or fit to the margins of the SCADA screen.
If enabled, this option will maintain the aspect ratio of the selected background
image. If disabled it will force the image to occupy the entire width and height of the SCADA screen
expanding or shrinking its measures as appropriate.
Enables the selected background image to be placed in any of the seven positions
shown in the figure.
This button (situated in the upper toolbar) allows configuration of the grid
characteristics as well as the size of the SCADA screen being detailed:
72
PowerStudio
The width and height of the screen is measured in pixels and the size of the grid will specify, in
pixels, the distance between a point on the grid and another in horizontal or vertical. If a background
image has been selected, the size of the SCADA screen can be adapted to the size of this background
by checking box
In terms of tools, there are several grouped according to their use:
•
•
•
Action tools
Positioning tools
General tools
7.2.1 Action tools
6 ReportsThe following action tools actions have already been explained in Chapter 7 Reports.
•
•
•
•
•
•
•
•
•
Select controls: See section 6.2.1.1
Text control : See section 6.2.1.2
Image control: See section 6.2.1.3
Date Control : See section 6.2.1.4
Formula control: See section 6.2.1.5
Conditioned control: Operates in the same way as conditioned control in the reports
but also lets the IP camera control be added. See section 6.2.1.6
Embedded graphic control: see section 6.2.1.7
Analogue bar control: see section 6.2.1.8
Configure formulae: See section 6.2.5
In the date control, please note that it is not possible to select ‘Initial date and End date' as they
are meaningless on the SCADA screens.
7.2.1.1
Screen control
This tool creates access to one SCADA screen from another SCADA screen. The following
properties may be configured from this control:
Here the destination screen which will be accessed by clicking on
the control entered on the SCADA screen is specified.
Here the appearance of the control on the SCADA screen is
specified. Select ‘button’, ‘image’ or ‘text’.
73
PowerStudio
7.2.1.2
Report control
6By selecting this option, the control will become direct access to a previously defined report
(see Chapter 7). The options available are:
Select the report to be displayed from the client screen.
The group type for the data to be displayed in the report can be
chosen. If the "User Defined" option is selected, the following fields will appear
Here the report period is specified.
Here the appearance of the control on the SCADA screen is
specified. Select ‘button’, ‘image’ or ‘text’.
7.2.1.3
Device Control
When this option is selected, the control will become a direct access to the screens that show
the variables of a device. The options available are:
Use the drop-down menu to select the device whose variables
screen will be displayed upon clicking on the control from the client screen.
Here the appearance of the control on the SCADA screen is
specified. Select ‘button’, ‘image’ or ‘text’.
7.2.1.4
Graph / Table Control
Use this option to make a graph or a table of one or more variables from one or more devices. The
options available are:
A choice between graph and table.
Choose the desired graph or table type.
can be chosen.
tables.
The group type for the data to be displayed in the graphs or tables
In the same way the sample period can be specified for graphs or
74
PowerStudio
Here the variables that are represented by a graph or a table can
be added. Clicking the ‘add’ button to select the desired variables.
Once selected, the variables will appear on the list and may be deleted by the
button
Here the appearance of the control on the SCADA screen is
specified. Select ‘button’, ‘image’ or ‘text’.
7.2.1.5
Active Events Control
Use this option to make the control a short cut to the active events display window.
Here the appearance of the control on the SCADA screen is
specified. Select ‘button’, ‘image’ or ‘text’.
7.2.1.6
Event Viewer Control
Use this option to make the control a short cut to the stored active events display window. The options
available are:
This corresponds to the event group records to be filtered.
The group type for the data to be displayed in the events viewer
can be chosen.
The list may be displayed either complete or not.
Here the appearance of the control on the SCADA screen is
specified. Select ‘button’, ‘image’ or ‘text’.
7.2.1.7
Run control
Use this tool to include access from the SCADA screen to another application in the system.
The properties than can be configured from this control are:
Specify the complete path to the application that will be called up
when
the
control
entered
on
the
SCADA
screen
is
clicked.
For
example:
C:\WINDOWS\SYSTEM32\CALC.EXE.
indicated in ‘Program’.
Specify parameters (if needed) to be added to the application call
Here the appearance of the control on the SCADA screen is
specified. Select ‘button’, ‘image’ or ‘text’.
75
PowerStudio
7.2.1.8
Force Variable Control
Use this tool to force variable values that can be forced, as in equipment with digital outputs.
The properties than can be configured from this control are:
Here the variable whose value will be forced is specified. It can be
button (see10.1.1 Expressions and Conditions Creation
entered manually or using the “wizard”
Wizard).
Once the variable has been specified, click the ‘New’ button to this
variable to the list of forced variables. To delete a variable from the list just select it click ‘Delete’. All
variables on the list at the moment the control is clicked from the client will be forced to the status
established in each of them, which is defined below.
Specify what action to take when the control is enabled from the
client (open or close). This selector will appear if there is a specific value list for the variable values to
that are possible to force, (e.g., for digital output the options will be open or close). If on the contrary,
the variable may be forced to any value (for example a counter) a field will appear to permit manual
entry of that value. This selector will only be enabled when the following box is checked
. if this box is not checked the value that will appear in the control will be that
defined by the user from the screen in the Java Client
Here the appearance of the control on the SCADA screen is
specified. Select ‘button’, ‘image’ or ‘text’.
7.2.1.9
Fill Control
Fill control allows color changes to homogeneous backgrounds, or background images, (with
mark the pixel point where fill area will begin in edit
all the same color pixels) regular or irregular.
mode. Chang the color of the area starting with the pixel marked by the point during the creation of the
control. It will not be displayed from the client. The properties than can be configured from this control
are:
Here the condition that has to be met is specified so that the
application paints the area with the chosen color. It can be entered manually or using the del “wizard”
(see Expressions and Conditions Creation Wizard).
Once the condition has been specified, click the ‘New’ button and the
condition will be added to the condition list. To delete a condition from the list just select it or press the
‘Delete’ button. When there is more than one condition on the list, the control will activate when one of
more of them is complied with.
76
PowerStudio
Will allow the fill color to be applied.
If this box is enabled, a simulation of the final outcome of the fill control will be shown,
painting the area to be painted as it would appear from the client.
The control tolerance may also be set, with a maximum of 1000.
7.2.1.10
IP camera control
Use the IP camera control to add an image of one of the system cameras in any area of any
SCADA screen. The image is refreshed in real time. The properties of this control are as follows:
IP camera control property area
Use to indicate which camera will supply the image feed, as well as the properties to be
applied to those images relative to the control size (these properties are equivalent to those available
for controlling still pictures).
IP camera control representation in the SCADA screens editor
Use the "refresh image" button to obtain and display the last available table of the camera, to
verify the image arrives properly and that the image adjustment properties are properly configured.
IP control camera representation with the image refreshed.
77
PowerStudio
7.2.1.11 Common action tool options
Right click on the SCADA screen to add controls. In the same way, the toolbars can be
displayed or hidden:
Any control placed on the SCADA screen may be resized and moved. To re-size a control just
place the mouse pointer on one side of the rectangle which surrounds the control and hold down while
moving it in the desired direction. Left click and hold on a control to drag it to a new position. Move
multiple controls by grouping them inside a selection box. Left click and hold to group two or more
controls, drawing a selection box including the desired controls within.
Controls entered into a SCADA screen present the following aspect in normal mode:
When controls are selected a dashed line is shown around them:
78
PowerStudio
7.2.2 Positioning tools
6.2.2 Operation of positioning tools is the same as that explained in Chapter 7.2.2 but applied
to SCADA screen controls.
7.2.3 Editing Tools
6.2.6 Operation of positioning tools is the same as that explained in Chapter 7.2.2 but applied
to SCADA screen controls.
79
PowerStudio
8 Error detection
When an application is exported to the communications engine, PowerStudio verifies that its
configuration is correct, verifying possible errors in the SCADA screens, reports, etc. Once the entire
verification has been performed, if there is any error, PowerStudio will offer the option to view and
correct them.
If you do not want to see errors, the active application will be sent to the communications engine
without modification, but it may not behave as desired on those controls that contain errors. For this
reason, checking for errors is recommended.
An example of a screen with errors would be:
The list below shows errors found. The report includes the resource name and type and a brief
explanation of the error found. The different types of resources are
SCADA Screens
Reports
Events
Double left click an error line to display the SCADA screen, report or event where the error was
found. If it is a SCADA screen control it will select the control where that error was detected.
80
PowerStudio
9 Events4
You may add, modify or delete various events of use in warning of possible dangerous or
exceptional states in the installation.
The events may be reported. In this case the events will be shown from a Java client by means
of a pop-up screen when enabled, and remain on screen until they have been acknowledged and
disabled.
In addition for each event a disabled schedule may be defined. That is, periods during which the event
is disabled can be defined, and the software will ignore them during that time.
You may also associate a note each time that the event is enabled, for example to save the
value of a variable which has caused the event.
Finally, for each of the possible states of the events, a series of actions can be defined that the
software will execute while the event is found in each one of these states. Possible states are:
•
Activation: Will be produced when the event condition occurs. For example, where a value has
exceeded a certain limit.
•
While enabled: This will be produced while the condition is in force, once the event has been
enabled.
•
Acknowledgement: Occurs when the operator acknowledges an event. This state is only
possible if the incident is reported.
•
Disable or restore: Occurs when the event condition in force. For example: If the condition is
defined as a variable exceeding a certain value, disabling will occur when it ceases to exceed
that value.
The system event set up consists of event disabled schedules, event groups and the events
themselves. 9.3 Event configurationIf you have no need to define groups of events or event disabled
schedules go directly to section 10.3 Event Configuration.
Both schedules and groups can be defined before or after the definition of the events
themselves. However if you need to define calendars we recommend this be done first so they can be
assigned to the events when creating them for the first time. Similarly, if you know which groups of
events are to be configured, they should be defined before creating the events, so they can be
assigned directly on creating each event.
4
Only in SCADA and Deluxe versions
81
PowerStudio
9.1 Events schedules
For each event a disabled schedule can be defined. In this schedule the times when the event
will be ignored are marked. 9.3 Event configurationIf you do not want to disable the events you can go
directly to 10.3 Event configuration.
In this schedule the times when the event will be ignored are marked. If no disabled
calendar is configured the event will be taken into account and the program will monitor its
status, assessing the condition configured in the event.
To configure events click the ‘Events timetables’ option in the ' Setup ' menu. The following
dialogue box will appear:
Here the different configured schedule periods are displayed.
can be configured
3 different types of timetable
Daily: The disables periods for one day are configured.
Weekly: The disabled periods for one week are configured. For selection of different days of
the week the previously configured “Daily” types are used.
Annual: The disabled periods are configured using a calendar. As with the ‘Weekly’ type, the
days are selected from the previously configured “Daily” types.
Right click on the schedule list and the context menu will appear,
allowing schedules to be copied or pasted. Some of the options from the context menu may not
appear. Copy will only appear if there is a style selected, and the paste option only if the styles have
been copied onto the clipboard. If there are no timetables selected on the clipboard right clicking will
not bring up the context menu.
Click “Add” and the following dialogue box will appear:
82
PowerStudio
Here the desired schedule type to be added is selected. Once added, the schedule type cannot
be changed; that is if “Daily" is chosen, clicking the 'Modify' allows modification of the “Daily” type,
which cannot be converted to' Weekly 'or' Annual'.
9.1.1 Daily
This schedule type corresponds to a day. In events that have a daily type selected, the
disabled schedule will be the same for all days.
4.1.2 Day typesDay type configuration works in the same way as explained for filter day types
(see section 5.1.2 Day types), except that there are no different hour types, but rather the schedule
interval is established without taking into account the events (zones marked in red when showing the
day).
83
PowerStudio
9.1.2
Weekly
This schedule type corresponds to one week. In events that have a weekly type selected, the
disabled schedule will be the same for all weeks.
Alphanumeric type data which enables the weekly
type to be uniquely identified within the events timetable.
Configuration of each one of the 7 days of the week, where the ‘type of
day’ selector contains the different types of days configured (see 9.1.1 Daily), showing the
representation of the type of day selected. It is also possible not to select any day type
, in which case the event will not be disabled during the day.
84
PowerStudio
9.1.3 Annual
This schedule type corresponds to a calendar, where different types of days can be configured
for several years.
As with the weekly type, the different types of day that may be selected correspond to different
configured daily types.
Alphanumeric type data which permits the type of year within the
events timetable to be uniquely identified.
Calendar configuration is the same as that explained for the filter calendar (see 4.1.3
Calendar).
85
PowerStudio
9.2 Event groups
For a better display when it comes to showing the event viewer, allowing us to filter and show
only one type of event, the events can be classified into groups, allowing a single event to be allocated
to more than one group. The option ‘Event groups’ from the ‘Set up menu will allow the different event
groups to be configured.
On the left-hand list all the configured event groups will be displayed, while on the right hand
list events that have been assigned to the group selected from the list of groups will be displayed.
Allows us to add, modify or delete groups of events. On adding
or modifying the following dialogue will appear:
Here the name of the event is entered. This name uniquely identifies the group.
Allows events from the group of selected events in the list of groups to be added or
deleted. Deleting a group event will only delete it from the group and in no case will it be removed
entirely from the event set up. When you click the ‘add’ button a list with the events outside the group
will appear, where events to be added can be selected.
86
PowerStudio
87
PowerStudio
9.3 Event configuration
To add, modify or delete events, the ‘Events’ option from the “Set up" menu should be
selected. The following dialogue box will appear:
Here are shown configured events, the disabled schedule, and whether or not it will be
reported and recorded.
Right click on the list of events and the context menu appears.
Allowing events to be copied or pasted. Some of the options from the context menu may not appear.
Copy will only appear if there is a style selected, and the paste option only if the styles have been
copied onto the clipboard. If no event is selected and there are no events on the clipboard on right
clicking will not bring up the context menu.
Clicking ‘Delete’ will delete the events that are selected in the list of events.
Clicking ‘Add’ or 'Modify' to create a new event or modify an existing event. The following
dialogue box will serve to create or modify an event.
88
PowerStudio
The functions of this dialogue are as follows:
Name that uniquely identifies the event in the application.
Allows switching between different event set up parameters.
The previous image shows the general configuration of an event.
Event condition. The event will become enabled
when the condition is true and will otherwise remain disabled. This can be entered manually or using
button (see 10.1.1 Expressions and Conditions Creation Wizard)
the “wizard”
A condition for deactivation of the event
can be added. Checking
or unchecking
this box this will enable or disable event conditioning. In
this case the event will be enabled when the voltage exceeds 240 and is disabled at less than 220.
Checking
or unchecking
this box enables or disables event
reporting. If the event is reported when the program is active a pop-up display will appear.
Checking
or unchecking
may be displayed in the events browser.
this box enables or disables event recording, which
89
PowerStudio
Shows the list of
groups to which the event belongs (see 9.2 Event groups). Clicking on the ‘Add’ button brings up a
dialogue with the list of groups that the event does not belong to, allowing the event to be added to
additional groups.
Use this dialogue to select groups to which the event can be added.
In the Advanced tab the following parameters appear
Allowing the event disabled schedule to be selected. If no
timetable is selected, the event will be continuously monitored by the application. If an active event has
a disabled schedule it will be disabled during the indicated time frame.
90
PowerStudio
This value corresponds to the delay in seconds before
event activation. The event will be enabled when the activation condition is met for at least the time
taken to calculate the equation entered in this field at the time the event becomes valid. For example: if
the equation for triggering the event is fulfilled, the delay in activation equation will be evaluated. If this
equation provides a result of five seconds, the system will wait for this length of time to activate the
event. If, during this delay in activation period, the event trigger condition is not met, the event will not
be activated.
This value corresponds to the delay in seconds before
event deactivation. The event will be deactivated, if active, when the activation condition is not met for
at least the time indicated in the equation in this field (the time will be calculated based on the moment
in which the event is no longer valid), in a similar way to the delay in activation.
Brief description of the event.
Allows an annotation to be configured which will be
calculated when the event is enabled and which may serve, for example, to ascertain the value
detected of a variable that has enabled the event. 9.3.1 AnnotationThe annotations will be explained in
more detail in section 10.3.1 Annotation.
Can be configured
to generate Rss reports when enabling, disabling or acknowledging the event. In this case only the
enabling and disabling of the event will appear. 2.2.13 PreferencesThis option will only appear if the
Rss of events on the software preference screen has been enabled (see section 2.2.12 Preferences)
The arguments will
allow formulas to be configured for their use in event annotation and actions. These formulas are
calculated at the time of their use, being useful to display the value which has provoked the event as
shown in the example.
The engine actions tabs allow the actions for each state of the event carried out by the
communication engine to be configured, while for actions in the client application those actions to be
carried out by the client application are configured. 9.3.2 ActionsThe actions are explained in more
detail in section in section 10.3.2. Actions
91
PowerStudio
9.3.1 Annotation
The annotation of an event is text, with a number of variable parameters, which is associated
with the activation of an event.
The parameters will be replaced by their corresponding value when the event is enabled,
hence, for two different activations of a single event two separate annotations may be made.
One of the uses of annotations is to record the value of a specific variable at the time the event
is enabled, extra information can be displayed in the event viewer.
Below are the different parameters that may be used in the annotation.
Parameter
%n
%c
%s
%b
%e
%d
%t
%gx
%ax
%%
Description
Name of event
Event condition.
Deactivation condition
Delay in enabling
Delay in disabling
Name of disabled schedule
Text associated with the event
Group Name x, where x is the order of the group within the list of
groups. The order will be displayed with a number to the left of the
name of the group.
Argument x, where x will be the order of the argument within the list
of arguments. The order will be displayed with a number on the left
side of the argument. The arguments are explained in more detail in
section 9.3.1.1 Arguments.
Character%
Each of these parameters will be replaced correspondingly when the event is enabled, for
example if the annotation is:
Event name ‘% n’ was enabled when the voltage marked %a1 V.
When the event is enabled the annotation created specifically for this activation will be:
Event name Main voltage was enabled when the voltage marked 256 V.
To facilitate creation of the annotation, click on the ‘wizard’ button and the following
dialogue will appear:
Here you can choose a parameter to be added to the annotation.
92
PowerStudio
9.3.1.1 Arguments
For the creation of the annotation a series of arguments can be defined. Each argument will
consist of a formula and formula value representation format, as can be seen in the following dialogue:
control.
Both the formula and the numerical format were previously described in 6.2.1.5
Formula
When the event is enabled, if the argument is used to create the annotation, the program will
assess the formula and represent it in accordance with the configured format.
93
PowerStudio
9.3.2 Actions
For each event a series of actions to be taken in each event status may be defined. You may
formulate actions both in the communications engine and for the client application. However,
depending on the action, it will only be possible on one of them.
According to the event state the actions are divided into:
•
On activating: These actions are executed only once when the event is enabled.
•
While active: While the event is active, it will continuously execute this group of actions.
Caution must be exercised in configuring actions, because they are running continuously they
may block the system or connected devices.
•
On deactivating: These actions are executed only once when the event is disabled.
•
When acknowledged: These actions are executed only once when the operator acknowledges
the event. This group of actions will only be available when the event must be reported.
By adding an action in the engine the following dialogue will appear:
Whereas if you want to add an action to the client the following will appear:
As can be seen actions that can be made by the engine are different from those that can be
made by the client application. Bear in mind when adding actions, where they will be carried out. Once
the action has been selected the corresponding window will appear for the configuration of these
actions.
94
PowerStudio
Because there are incompatibilities between actions, (e.g., it is not possible to show a device
and a screen at once), adding non-compatible actions to the existing ones is not possible.
9.3.2.1 Forcing a variable
This action can only be done on the communications engine. It allows the value of a variable,
such as a digital output or a counter to be changed.
To configure the action one expression must be entered for the variable to be forced, and
another for the value to which we wish to force the it.
Both the variable expression and the value may be entered either manually or using the
corresponding ‘wizard’
9.3.2.2 Running an external program
This action may take place in both the communications engine and on the client application.
Allows an external application, such as an audio file, which is present in the system to be executed.
For correct operation it is advisable to indicate in the “Program” field the complete to the
program so that the engine and the client application can find and execute it.
In the ‘parameters’ field the parameters necessary for the execution of the external application
are entered, using the arguments configured in the event (see 9.3.1.1 Arguments)
95
PowerStudio
9.3.2.3 Sending Mail
This action can only be done on the communications engine. It enables an electronic mail to be
sent to the selected addressees.
In this dialogue the message to be sent in the mail is entered. The format of this message is
similar to the event annotation (see 9.3 Event configuration) allowing any of the arguments configured
in the event to be used. To facilitate entering the message the wizard can be used by clicking the
button.
At the bottom a list of recipients to whom the mails will be sent appears.
For more information on how to configure the mail server see section 2.2.13 Preferences.
9.3.2.4 Show a device
This action can only be done on the client application. In conducting the action, the client
application will automatically display the selected screen monitoring device.
9.3.2.5 Show a SCADA screen
This action can only be done on the client application. In conducting the action, the client
application will automatically display the selected SCADA screen. Only in SCADA en Deluxe versions.
9.3.2.6 Show a report
This action can only be done on the client application. In conducting the action, the client
application will automatically display the selected report. Only in SCADA and Deluxe versions.
9.3.2.7 Sound Alarm
This action can only be done on the client application. On conducting the action, the application
will emit a bleep.
96
PowerStudio
9.4 Event Variables5
Each of the events has an associated series of variables that can be used in SCADA screens,
reports, graphs and tables.
Using these variables it is possible, for example, to know the status of the event on a SCADA
screen, or the number of activations of the event in a report.
The number of variables associated with each event may vary depending on whether the event
is reported or is stored in the event log.
The event variables are coded for use in formulas and expressions such as
R$EVE_variable. name
Using the R$EVE prefix tells the program that this is an event variable rather than a device
variable.
This coding can be used in formulas, graphs and tables, although in the case of reports, graphs
and tables only the variables of those events that are recorded on file can be displayed.
5
Only in SCADA and Deluxe versions
97
PowerStudio
10 Appendices
10.1 Expressions and conditions
Many parts of the program allow the inclusion of terms or conditions. To enter these there is a
standard text control available accompanied by a help button that will guide you through editing them.
Real numbers can be used in an expression or condition (in accordance with the IEEE 7541985 standard, where among other aspects, it stipulates that the decimal separator is the “.”) symbol,
parentheses (“(” and “)”), addition operators (“+”), subtraction operators (“-“), multiplication operators
(“*”), division operators (“/”) and exponential operators (“^”). Thus, some valid examples would be:
2*(4.56^2)
1-(2.12-4)/2
The following mathematical functions can also be used:
sqrt(exp): Square root of the expression "exp
log(exp): Natural logarithm of the expression "exp
exp(exp): Number “e” to the power of expression “exp”
sin(exp): Sine of the expression "exp" (in radians)
cos(exp): Cosine of the expression "exp" (in radians)
tan(exp): Tangent of the expression "exp" (in radians)
asin(exp): Arcsine of the expression "exp"
acos(exp): Arccosine of the expression "exp" (in radians)
atan(exp): Arctangent of the expression "exp"
atan2(exp1, exp2): Extended arctangent of the expression “exp1/exp2”
log10(exp): Base 10 logarithm of the expression "exp
round(exp): Rounding off to whole number nearest to the expression "exp"
trunc(exp): Truncation to the whole number of the expression "exp"
pi() : Returns the number PI (3.1415927…).
e() : Returns the number E (2.7182818…).
mod(exp1, exp2): Return the modulus "exp2" of expression "exp1
max(exp1, exp2): Returns the maximum of the two expressions
min(exp1, exp2): Return the minimum of the two expressions
abs(exp): Returns the absolute value of the expression "exp"
rand(): Returns a real random value between 0.0 and 1.0
if(cond, exp1, exp2): Evaluates the condition “cond”. If the condition is true it returns
the expression "exp1" if false it returns the expression "exp2
bit(exp1, exp2): Returns the value of the positioning bit "exp2" for the number "exp1".
setbit(exp1, exp2, exp3): Returns the value obtained by placing the positioning bit
"exp2" the value "exp3" to the number "exp1".
normalize(exp1, exp2): Returns “exp1” if “exp1” can be evaluated, otherwise it returns
“exp2”.
We should remember some details about these functions. The square root function will return
an error if the expression is negative. The logarithmic functions ( "log" and "log10")will return and error
if the expression is less than or equal to zero. The Arctangent function ( “atan”) assesses a range that
goes from -π/2 to π/2 and returns zero if the expression is zero. The extended Arctangent function (
"atan2") assesses a range that goes from –π to π and returns zero if both expressions are zero. The
Arcsine functions ( "asin"), Arccosine ( "acos"), Arctangent ( "atan") and extended Arctangent (
"atan2") return the result in radiants. The functions that return the number pi ( "pi") and e ( "e") have no
parameters, so they can be used with or without parentheses. The functions are not case sensitive.
Examples of valid formulas are:
2*pi()-sqrt(10)
round(exp(2)+atan2(1.2)-e*pi)
98
PowerStudio
It is also possible to use certain time functions:
sunrise(exp1, exp2): Returns the number of hours from 00:00 hours until sunrise, the
longitude being expression “exp1” and the latitude expression “exp2”. Parameters “exp1” and “exp2”
are in degrees.
sunset(exp1, exp2): Returns the number of hours from 00:00 hours until sunset, the
longitude being expression “exp1” and the latitude expression “exp2”. Parameters “exp1” and “exp2”
are in degrees.
sunrisehours(exp1, exp2): Returns the time of the sunrise, the longitude being
expression “exp1” and the longitude expression “exp2”. Parameters “exp1” and “exp2” are in degrees.
sunriseminutes(exp1, exp2): Returns the minute of the sunrise, the longitude being
expression “exp1” and the longitude expression “exp2”. Parameters “exp1” and “exp2” are in degrees.
sunriseseconds(exp1, exp2): Returns the second of the sunrise, the longitude being
expression “exp1” and the longitude expression “exp2”. Parameters “exp1” and “exp2” are in degrees.
sunsethours(exp1, exp2): Returns the time of the sunset, the longitude being
expression “exp1” and the longitude expression “exp2”. Parameters “exp1” and “exp2” are in degrees.
sunsetminutes(exp1, exp2): Returns the minute of the sunset, the longitude being
expression “exp1” and the longitude expression “exp2”. Parameters “exp1” and “exp2” are in degrees.
sunsetseconds(exp1, exp2): Returns the second of the sunset, the longitude being
expression “exp1” and the longitude expression “exp2”. Parameters “exp1” and “exp2” are in degrees.
sunshinehours(exp1, exp2): Returns the number of hours between the sunrise and the
sunset, the longitude being expression “exp1” and the longitude expression “exp2”. Parameters “exp1”
and “exp2” are in degrees.
sunshineminutes(exp1, exp2): Returns the number of minutes between the sunrise
and the sunset, the longitude being expression “exp1” and the longitude expression “exp2”.
Parameters “exp1” and “exp2” are in degrees.
sunshineseconds(exp1, exp2): Returns the number of seconds between the sunrise
and the sunset, the longitude being expression “exp1” and the longitude expression “exp2”.
Parameters “exp1” and “exp2” are in degrees.
getsecond(exp): Returns the second of the date "exp".
getminute(exp): Returns the minute of the date "exp".
gethour(exp): Returns the hour of the date "exp".
getday(exp): Returns the day of the date"exp".
getmonth(exp): Returns the month of the date "exp".
getYear(exp): Returns the year of the date "exp".
second() : Returns the second of the current date.
minute() : Returns the minute of the current date.
hour() : Returns the hour of the current date.
day() : Returns the day of the current date.
month(): Returns the month of the current date.
year() : Returns the year of the current date.
These functions return values relating to the date in the local time of the engine when viewed
from the client, and values relating to the local date of the editor when editing a SCADA screen or
report. The functions that do not contain parameters can be used with or without brackets. The
"second" function returns a value between 0 and 59, like the "minute" function. The "hour" function
returns a value between 0 and 23. The "day" functions returns a value between 1 and 31. The "month"
function returns a value between 1 and 12.
The following time functions are only available in reports.
secondsinperiod(): Returns the number of seconds in the current period of the report
minutesinperiod (): Returns the number of minutes in the current period of the report
hoursinperiod (): Returns the number of hours in the current period of the report
daysinperiod (): Returns the number of days in the current period of the report
99
PowerStudio
beginsecond (): Returns the initial second in the actual period of the current report
beginminute (): Returns the initial minute in the current period of the report
beginhour (): Returns the initial hour in the current period of the report
beginday(): Returns the initial day in the current period of the report
beginmonth(): Returns the initial month in the current period of the report
beginyear(): Returns the initial year in the current period of the report
endsecond(): Returns the final second in the current period of the report
endminute(): Returns the final minute in the current period of the report
endhour(): Returns the final hour in the current period of the report
endday(): Returns the final day in the current period of the report
endmonth(): Returns the final month in the current period of the report
endyear(): Returns the final year in the current period of the report
Both for the expressions and the conditions reference can be made to device variables added
to the system. To make reference to one of these variables its name must be entered between the
square brackets ( "[" and "]"). The name of a device consists of two parts separated by a period (".")
the left side is the name of the device and the right side is the variable code of the device (to consult
variable codes allowed consult the corresponding appendix for each device). Some examples are:
2*[CVM144.VI1]
[CVM K 1.AE]+[CVM K 2.AE]+[CVM K 3.AE]
In some parts of the program it is possible to apply a filter to the variable that is, to see the
value of the filtered variable in accordance with a calendar. This is possible, for example, in reports or
graphs and only in some specific variables, such energy variables.
In order to refer to the filtration of a variable we should indicate to the left of the variable, the
name of filter plus the extension. XDCT " followed by "@"and the type of hour we want to access. For
example, if we have defined a filter with the name "Rate" that contains two types of hours "H1 and H2,"
we can refer to both as follows:
[Tarifa.XDCT@H1:CVMK.AE]
[Tarifa.XDCT@H2:CVMK.AE]
It should be emphasized that after the name of the rate we should always find the ".XDCT,"
extensions followed by "@", the name of the type of hour and the symbol ":". Remember that not all
variables of the devices can be filtered; see the variables code appendix for details on which variables
of each device can be filtered.
In some parts of the program, such as in the reports and the SCADA screens, you can also
refer to variables previously defined in the formula list. Both in the reports and in the SCADA screens
there is a list of expressions each identified by a text that, can be used in controlling formulas or in the
conditional control. So, an expression with the identifier "F1", be used in other expressions:
F1*2.0-1.3
1-sqrt (F1)
It should be emphasized that the identifier of an expression (name of the variable) cannot start
with a numerical digit, although it may contain them.
Finally, in those places where a condition is required, it is possible to use the operators less
than ("<"), greater than (">"), less than or equal to ("<="), greater than or equal to ( ">="), equal to
("=="), different to ("!="), logical "AND" ("&&"), logical "OR" ("||") and logical "NOT" ( "!").
Remember that the comparison operators require the terms to the left and right be numerical,
while the logical operators require expressions to be conditions. Thus, examples of correct conditions
would include:
[CVMK.VI1]>(240-F1)
(F1!=10 && [CVMK.VI3]<=20)
100
PowerStudio
Expressions and variables are always of the numerical type (real) while the conditions are the
Boolean type.
10.1.1 Expressions and Conditions Creation Wizard
PowerStudio has an assistant, or wizard, for creating conditions and expressions. This wizard
button, which is next to the text controls where we can manually
can be accessed by clicking the
enter the terms and conditions.
Clicking on this button will bring up the following window:
Here you may select what you wish to add to the expression. The option will be added in the
position of the cursor in the text control associated to the expression. The lower part of the dialogue
shows where to enter what you want to add:
•
•
•
•
[Vx]. If we want to add a reference to a variable of a unit
Fx. If you want to add a reference to another already defined formula
F (x). If you want to add one of the functions provided
x. If you want to add other symbols.
The wizard options are as follows:
o
Add a reference to a variable of a device: Selecting this option will display a window
where you can choose the device from which to add a variable to the formula.
Likewise, you may specify a previously defined specific filter (see chapter 3) using the
control:
101
PowerStudio
Once you have chosen the unit and the filter (where appropriate) the variables
selection window will be displayed allowing you to choose the variable to be entered in
the formula (see 3 Variable selection)
o
Add a reference to an already defined formula: This option enables you to enter a
reference to another previously defined formula. This option is only available in reports
and SCADA screens. Selecting this option will display a window where a previously
defined formula can be selected:
o
Add one of the functions provided: This option allows access to a list of typical
mathematical functions which can be entered into the formula being edited:
o
Add other symbols: this option allows you to enter symbols such as comparators,
logical functions, basic symbols, specific mathematical numbers, and so on.
102
PowerStudio
Depending on whether what you are creating corresponds to an expression or a
condition, some of these symbols will be disabled and therefore may not be
selected.
103
PowerStudio
Technical Service
For questions, contact CIRCUTOR's Technical Service or your nearest CIRCUTOR distributor.
CIRCUTOR, S.A. – Technical Departament
Vial Sant Jordi s/n
08232 – Viladecavalls
(Barcelona) Spain
Fax. +34 93 745 29 14
E-mail: [email protected]
For software actualization please view CIRCUTOR´s web page:
Web: www.circutor.com
104