1
ENERGY MANAGEMENT SOFTWARE
POWERSTUDIO SCADA
Version 2.7
USER MANUAL
( M98227501-03-09A )
© CIRCUTOR S.A.
PowerStudio / PowerStudio Scada
1
RUNNING THE PROGRAMME FOR THE FIRST TIME .................................................................... 8
2
MENU BAR................................................................................................................................................. 10
2.1
FILE MENU............................................................................................................................................. 10
2.2
SET UP MENU ......................................................................................................................................... 10
2.2.1
Devices .......................................................................................................................................... 10
2.2.1.1 Adding a First-level Device ...................................................................................................... 14
2.2.1.2 Adding a Second-level Device.................................................................................................. 15
2.2.1.3 Advanced Configuration of Devices ......................................................................................... 15
2.2.2
Groups of Devices ......................................................................................................................... 17
2.2.3
Discriminators .............................................................................................................................. 19
2.2.4
Calculated variables ..................................................................................................................... 20
2.2.5
Styles ............................................................................................................................................. 20
2.2.6
Image manager ............................................................................................................................. 23
2.2.7
Reports .......................................................................................................................................... 25
2.2.8
Screens .......................................................................................................................................... 25
2.2.9
Events Timetables.......................................................................................................................... 26
2.2.10 Groups of events............................................................................................................................ 26
2.2.11 Events ............................................................................................................................................ 26
2.2.12 Preferences.................................................................................................................................... 26
2.2.12.1
Updates.................................................................................................................................. 29
2.2.12.2
User Authentication. ............................................................................................................. 30
2.2.12.2.1 Profiles ............................................................................................................................. 30
2.2.12.2.2 Users................................................................................................................................. 32
2.2.12.2.3 Anonymous User.............................................................................................................. 34
2.2.13 Operating mode: ........................................................................................................................... 35
2.3
EDIT MENU ............................................................................................................................................ 36
2.3.1
Cut................................................................................................................................................. 36
2.3.2
Copy .............................................................................................................................................. 36
2.3.3
Paste.............................................................................................................................................. 36
2.3.4
Delete ............................................................................................................................................ 36
2.3.5
Select All ....................................................................................................................................... 36
2.4
SEE MENU.............................................................................................................................................. 37
2.4.1
Back............................................................................................................................................... 37
2.4.2
Devices .......................................................................................................................................... 37
2.4.3
Display options ............................................................................................................................. 39
2.4.4
Toolbar.......................................................................................................................................... 39
2.4.5
Status Bar...................................................................................................................................... 40
2.4.6
About ............................................................................................................................................. 40
3
DEVICES..................................................................................................................................................... 41
3.1
DRIVERS OPTION CONFIGURATION ........................................................................................................ 41
3.1.1
Driver Parameters ........................................................................................................................ 41
3.1.2
Variable Units ............................................................................................................................... 43
3.1.3
Variable limits............................................................................................................................... 44
3.2
C-14D .................................................................................................................................................... 45
3.2.1
Driver options ............................................................................................................................... 45
3.2.1.1 Device parameters ..................................................................................................................... 45
3.2.2
Displaying Values ......................................................................................................................... 46
3.3
IP CAMERA ............................................................................................................................................ 47
3.3.1
Adding an IP Camera ................................................................................................................... 47
3.4
CBS-4 /CBS-4 RA................................................................................................................................. 49
3.4.1
Driver options ............................................................................................................................... 49
3.4.1.1 Device Parameters..................................................................................................................... 49
3.4.1.1.1 CBS-4 ................................................................................................................................. 49
3.4.1.1.2 CBS-4 RA .......................................................................................................................... 51
3.4.2
Displaying values .......................................................................................................................... 53
3.5
CBS-8.................................................................................................................................................... 55
2
PowerStudio / PowerStudio Scada
3.5.1
Driver options ............................................................................................................................... 55
3.5.1.1 Device parameters ..................................................................................................................... 55
3.5.2
Displaying values .......................................................................................................................... 58
3.6
CDR-8 ................................................................................................................................................... 60
3.6.1
Driver options ............................................................................................................................... 60
3.6.1.1 Device parameters ..................................................................................................................... 60
3.6.2
Displaying values .......................................................................................................................... 64
3.7
CIRWATT ............................................................................................................................................ 66
3.7.1
Download with protocol IEC 870-5-102...................................................................................... 66
3.7.2
Driver options ............................................................................................................................... 66
3.7.2.1 Driver Parameters...................................................................................................................... 67
3.7.2.2 Device parameters ..................................................................................................................... 67
3.7.2.3 Contracted power ...................................................................................................................... 68
3.7.3
Displaying Contracts .................................................................................................................... 69
3.8
CONVERTER RS232/485 ........................................................................................................................ 70
3.9
CONVERTER TCP2RS: ........................................................................................................................... 71
3.10 CONVERTER TCP2RS MODBUSTCP...................................................................................................... 74
3.11 CONVERTER TCP2RS QNA RS485 ....................................................................................................... 77
3.12 GENERAL UDP CONVERTER .................................................................................................................. 78
3.13 GENERIC TCP CONVERTER .................................................................................................................... 79
3.14 MODBUSTCP GENERIC CONVERTER ..................................................................................................... 80
3.15 CVM-144 .............................................................................................................................................. 81
3.15.1 Driver options ............................................................................................................................... 81
3.15.1.1
Device parameters ................................................................................................................. 81
3.16 CVM-96 ................................................................................................................................................ 85
3.16.1 Driver options ............................................................................................................................... 85
3.16.1.1
Device parameters ................................................................................................................. 85
3.17 CVM-B/BD........................................................................................................................................... 88
3.17.1 Connection with Modbus TCP ...................................................................................................... 88
3.17.2 Driver options ............................................................................................................................... 89
3.17.2.1
Device parameters ................................................................................................................. 89
3.18 CVM-BC............................................................................................................................................... 92
3.18.1 Driver options ............................................................................................................................... 92
3.18.1.1
Device parameters ................................................................................................................. 92
3.19 CVM-K ................................................................................................................................................. 95
3.19.1 Connection with Modbus TCP ...................................................................................................... 95
3.19.2 Driver options ............................................................................................................................... 96
3.19.2.1
Device parameters ................................................................................................................. 96
3.20 CVM-K2 ............................................................................................................................................... 99
3.20.1 Driver options ............................................................................................................................... 99
3.20.1.1
Device parameters ................................................................................................................. 99
3.20.1.2
Expansion Cards.................................................................................................................. 105
3.20.1.2.1 Digital input / output ...................................................................................................... 105
3.20.1.2.2 Analogue inputs/ outputs................................................................................................ 108
3.20.1.2.3 4 digital outputs / 4 analogue outputs............................................................................. 110
3.20.1.2.4 SD Memory .................................................................................................................... 111
3.21 CVM-K HAR ...................................................................................................................................... 112
3.21.1 Connection with Modbus TCP .................................................................................................... 112
3.21.2 Driver options ............................................................................................................................. 112
3.21.2.1
Device parameters ............................................................................................................... 113
3.22 MINI CVM AND CVM NRG-96.......................................................................................................... 115
3.22.1 Driver options ............................................................................................................................. 115
3.22.1.1
Device parameters ............................................................................................................... 115
3.23 CVM-R8 ............................................................................................................................................. 118
3.23.1 Driver options ............................................................................................................................. 118
3.23.1.1
Device parameters ............................................................................................................... 118
3.23.1.2
Analogue inputs and outputs............................................................................................... 119
3.23.1.3
Variable limits ..................................................................................................................... 119
3.24 CVM-SP.............................................................................................................................................. 120
3
PowerStudio / PowerStudio Scada
3.24.1 Driver options ............................................................................................................................. 120
3.24.1.1
Device parameters ............................................................................................................... 120
3.25 DH-96 ................................................................................................................................................. 123
3.25.1 Driver options ............................................................................................................................. 123
3.25.1.1
Device parameters ............................................................................................................... 123
3.25.1.2
Inputs................................................................................................................................... 125
3.26 EDMK ................................................................................................................................................. 126
3.26.1 Driver options ............................................................................................................................. 126
3.26.1.1
Device parameters ............................................................................................................... 126
3.27 GENERIC MODBUS ............................................................................................................................... 128
3.27.1 Driver options ............................................................................................................................. 128
3.27.1.1
Device parameters ............................................................................................................... 129
3.27.1.1.1 Numeric variables........................................................................................................... 130
3.27.1.1.2 Digital variables ............................................................................................................. 132
3.28 LM-24 M............................................................................................................................................. 133
3.28.1 Driver options ............................................................................................................................. 133
3.28.1.1
Device parameters ............................................................................................................... 133
3.28.1.2
Device inputs....................................................................................................................... 134
3.28.1.3
Variable limits ..................................................................................................................... 136
3.29 LM4I-4O-M ........................................................................................................................................ 137
3.29.1 Driver options ............................................................................................................................. 137
3.29.1.1
Device parameters ............................................................................................................... 137
3.29.1.2
Device inputs....................................................................................................................... 138
3.29.1.3
Variable limits ..................................................................................................................... 140
3.30 LM50-TCP .......................................................................................................................................... 141
3.30.1 Driver options ............................................................................................................................. 141
3.30.1.1
Device parameters ............................................................................................................... 141
3.30.1.2
Inputs................................................................................................................................... 143
3.30.1.3
Variable limits ..................................................................................................................... 145
3.31 MKD ................................................................................................................................................... 146
3.31.1 Driver options ............................................................................................................................. 146
3.31.1.1
Device parameters ............................................................................................................... 146
3.32 MK-LCD............................................................................................................................................. 149
3.32.1 Driver options ............................................................................................................................. 149
3.32.1.1
Device parameters ............................................................................................................... 149
3.33 POWERNET....................................................................................................................................... 151
3.33.1 Driver options ............................................................................................................................. 151
3.33.1.1
Device parameters ............................................................................................................... 151
3.34 QNA 412/413 ...................................................................................................................................... 153
3.34.1 Driver options ............................................................................................................................. 153
3.34.1.1
Device parameters ............................................................................................................... 153
3.35 RGU-10 / RGU-10 RA ........................................................................................................................ 156
3.35.1 Driver options ............................................................................................................................. 156
3.35.1.1
Device parameters ............................................................................................................... 156
3.35.1.1.1 RGU-10 .......................................................................................................................... 156
3.35.1.1.2 RGU-10 RA ................................................................................................................... 158
3.35.2 Displaying values ........................................................................................................................ 160
3.35.2.1.1 RGU-10 .......................................................................................................................... 160
3.35.2.1.2 RGU-10 RA ................................................................................................................... 161
3.36 RRM-C................................................................................................................................................ 162
3.36.1 Driver options ............................................................................................................................. 162
3.36.2 Displaying values ........................................................................................................................ 162
3.37 TCP50 – ALARM ............................................................................................................................... 163
3.37.1 Driver options ............................................................................................................................. 163
3.37.1.1
Device parameters ............................................................................................................... 163
3.37.1.2
Device inputs....................................................................................................................... 164
3.37.2 Displaying values ........................................................................................................................ 164
4
VARIABLE SELECTION ....................................................................................................................... 165
4
PowerStudio / PowerStudio Scada
DISCRIMINATORS................................................................................................................................. 168
5
5.1
DISCRIMINATOR CONFIGURATION ........................................................................................................ 168
5.1.1
Types of hours ............................................................................................................................. 170
5.1.2
Types of day ................................................................................................................................ 171
5.1.3
Calendar...................................................................................................................................... 174
6
CALCULATED VARIABLES ................................................................................................................ 176
7
REPORTS.................................................................................................................................................. 179
7.1
ADD, MODIFY AND DELETE REPORTS.................................................................................................... 179
7.2
REPORT DESIGN WINDOW ..................................................................................................................... 180
7.2.1
Action tools ................................................................................................................................. 182
7.2.1.1
Select controls .................................................................................................................... 182
7.2.1.2
Text control ....................................................................................................................... 182
7.2.1.3
Image control...................................................................................................................... 183
7.2.1.4
Date Control ....................................................................................................................... 184
7.2.1.5
Formula control .................................................................................................................. 186
7.2.1.6
Conditioned control............................................................................................................ 187
7.2.1.7
Embedded Graphic Control .............................................................................................. 188
7.2.1.8 Common options for the action tools ...................................................................................... 189
7.2.2
- Position tools .......................................................................................................................... 190
7.2.3
- Pages tools............................................................................................................................... 191
7.2.4
- Zoom tools .............................................................................................................................. 191
7.2.5
– Miscellaneous tools.................................................................................................................. 192
7.2.6
- Editing tools............................................................................................................................ 193
8
SCADA....................................................................................................................................................... 194
8.1
ADD / REMOVE SCREEN........................................................................................................................ 194
8.2
EDITING SCADA SCREENS .................................................................................................................. 195
8.2.1
Action tools ................................................................................................................................. 197
8.2.1.1
Screen control................................................................................................................... 197
8.2.1.2
Report control .................................................................................................................... 198
8.2.1.3
Device Control................................................................................................................... 198
8.2.1.4
Graph / Table Control ...................................................................................................... 198
8.2.1.5
Active Event Control ......................................................................................................... 199
8.2.1.6
Event Viewer Control....................................................................................................... 199
8.2.1.7
Run Control ........................................................................................................................ 199
8.2.1.8
Force Variable Control....................................................................................................... 199
8.2.1.9
Filling Control .................................................................................................................... 200
8.2.1.10
IP camera control ......................................................................................................... 201
8.2.1.11
Common options for the action tools .................................................................................. 202
8.2.2
Positioning tools ......................................................................................................................... 203
8.2.3
Editing Tools ............................................................................................................................... 203
9
ERRORS DETECTION ........................................................................................................................... 204
10
EVENTS................................................................................................................................................. 205
10.1 EVENTS TIMETABLES ........................................................................................................................... 206
10.1.1 Daily............................................................................................................................................ 207
10.1.2 Weekly ......................................................................................................................................... 208
10.1.3 Annual ......................................................................................................................................... 209
10.2 EVENT GROUPS .................................................................................................................................... 210
10.3 EVENT CONFIGURATION ....................................................................................................................... 212
10.3.1 Annotation................................................................................................................................... 216
10.3.1.1
Arguments ........................................................................................................................... 217
10.3.2 Actions......................................................................................................................................... 218
10.3.2.1
Forcing a variable................................................................................................................ 219
10.3.2.2
Running an external program.............................................................................................. 219
5
PowerStudio / PowerStudio Scada
10.3.2.3
Sending Mail ....................................................................................................................... 220
10.3.2.4
Show a device ..................................................................................................................... 220
10.3.2.5
Show a SCADA screen ....................................................................................................... 220
10.3.2.6
Show a report ...................................................................................................................... 220
10.3.2.7
Sound Alarm ....................................................................................................................... 220
10.4 EVENT VARIABLES .............................................................................................................................. 221
11
DDE – DYNAMIC DATA EXCHANGE ............................................................................................ 222
12
ACCESS THROUGH THE POWERSTUDIO CLIENT .................................................................. 223
12.1 WEB SERVER ....................................................................................................................................... 223
12.2 CLIENT ................................................................................................................................................. 226
12.2.1 Status Bar.................................................................................................................................... 227
12.2.2 Menu Bar..................................................................................................................................... 228
12.2.3 Toolbar........................................................................................................................................ 230
12.2.4 General options of the client application.................................................................................... 231
12.2.4.1.1.1.1 Displaying SCADA screens ............................................................................ 234
12.2.5 Displaying Reports...................................................................................................................... 235
12.2.6 Displaying the status of devices .................................................................................................. 238
12.2.7 Displaying a device ..................................................................................................................... 241
12.2.8 Making graphs ............................................................................................................................ 249
12.2.8.1
Zoom mode ......................................................................................................................... 254
12.2.8.2
Pan mode............................................................................................................................. 257
12.2.8.3
Tooltip mode ....................................................................................................................... 259
12.2.8.4
Magnifying glass mode ....................................................................................................... 260
12.2.8.5
Toolbar ................................................................................................................................ 261
12.2.8.6
Graph properties.................................................................................................................. 263
12.2.8.7
Printing a graph ................................................................................................................... 275
12.2.8.8
Export graph........................................................................................................................ 275
12.2.8.9
Types of graph .................................................................................................................... 275
12.2.9 Making tables.............................................................................................................................. 280
12.2.10
Displaying logged events ........................................................................................................ 285
12.2.11
Active and notified events........................................................................................................ 287
12.2.12
Authentication ......................................................................................................................... 289
13
SYSTEM REQUIREMENTS .............................................................................................................. 291
14
APPENDICES ....................................................................................................................................... 292
14.1 VARIABLES .......................................................................................................................................... 292
14.1.1 Voltage ........................................................................................................................................ 293
14.1.2 Current ........................................................................................................................................ 294
14.1.3 Frequency.................................................................................................................................... 295
14.1.4 Power .......................................................................................................................................... 296
14.1.5 Energies ...................................................................................................................................... 298
14.1.6 Maximum demand ....................................................................................................................... 300
14.1.7 Harmonics................................................................................................................................... 301
14.1.8 Pst / Plt........................................................................................................................................ 301
14.1.9 Inputs and outputs....................................................................................................................... 302
14.1.10
Counters .................................................................................................................................. 302
14.1.11
Special device variables .......................................................................................................... 303
14.1.11.1 C-14d................................................................................................................................... 303
14.1.11.2 CBS-4.................................................................................................................................. 303
14.1.11.3 CBS-8, CDR-8 .................................................................................................................... 304
14.1.11.4 CIRWATT .......................................................................................................................... 304
14.1.11.5 CVM-K2 ............................................................................................................................. 305
14.1.11.6 DH-96.................................................................................................................................. 305
14.1.11.7 MK D .................................................................................................................................. 305
14.1.11.8 QNA .................................................................................................................................... 306
14.1.11.9 RGU-10 / RGU-10 RA........................................................................................................ 307
6
PowerStudio / PowerStudio Scada
14.1.11.10 RRM-C.............................................................................................................................. 307
14.1.12
Graph variables and special tables......................................................................................... 308
14.1.13
Status of devices ...................................................................................................................... 308
14.1.14
Event Variables ....................................................................................................................... 309
14.2 EXPRESSIONS AND CONDITIONS ........................................................................................................... 310
14.2.1 Wizard for the Creation of Expressions and Conditions............................................................. 312
14.3 XML SERVICES ................................................................................................................................... 315
14.3.1 / services / user / devices.xml ...................................................................................................... 315
14.3.2 /services/user/deviceInfo.xml?id=device?... ............................................................................... 315
14.3.3 / services / user / varInfo.xml? var = device.variable ?...? id = device? ................................... 316
14.3.4 / services / user / values.xml? var = device.variable ?...? id = device? ... ................................. 317
14.3.5 / services / user / forceVariables.xml? id = device ..................................................................... 318
14.3.6 / services / user / records.xml? begin =…? end =…? var =…? period = 900 ........................... 318
14.4 F.A.Q................................................................................................................................................... 321
14.4.1 None of the equipment communicates. What is happening? ....................................................... 321
14.4.2 A TCP2RS converter does not communicate. What is happening?............................................ 321
14.4.3 I can not see the applet. What is happening?.............................................................................. 321
14.4.4 The Applet does not display the texts properly. What is happening?.......................................... 321
14.4.5 The values display is not what I expected. What is happening? ............................................... 321
14.4.6 An event is not behaving as I expected. What is happening?...................................................... 322
14.4.7 I can’t paint the graph correctly. What is happening? ............................................................... 322
14.4.8 The Paint Pot is not working correctly. What is happening? ..................................................... 322
14.4.9 Can I launch external applications from applet?........................................................................ 323
14.4.10
How can I see the applet from a machine which is not running Windows?............................ 323
14.4.11
How can I draw a line in a report or a SCADA screen ? ....................................................... 323
14.4.12
I am making my first screen or report and I cannot add a background image or a still picture.
What is happening?..................................................................................................................................... 324
14.4.13
What can be "counted"?.......................................................................................................... 324
14.4.14
I would like to export the report data in order to process it later. How can I do it? .............. 324
14.4.15
I tried to make a table with the client application and I get the Message "Table too Big." What
can I do to see it? ........................................................................................................................................ 326
14.4.16
How can I simulate a control switch?..................................................................................... 327
14.4.17
How do I add animation on the SCADA? ............................................................................. 327
14.4.18
How can I simulate a level control?........................................................................................ 328
14.4.19
How can I change the properties of control in accordance with a condition? ....................... 328
14.4.20
How can I know the status of a device? .................................................................................. 329
14.4.21
How can I display documents from a SCADA screen? .......................................................... 329
14.4.22
How can I obtain an event according to the status of a device?............................................ 329
14.4.23
How can I produce sounds in response to an event? .............................................................. 329
14.4.24
How do I show documents in response to an event?............................................................... 330
14.4.25
How can I communicate with a TCP2RS converter by way of a router?............................... 330
7
PowerStudio / PowerStudio Scada
1
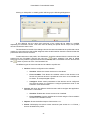
Running the Programme for the First Time
When running for the first time the program will ask if you want to add devices.
Selecting ‘Yes’, will allow us to add devices as will be explained later in section 2.2.2.1 Adding
a First level Device.
When the device is added, you will be asked if you want to add any more devices.
If ‘Yes’ is chosen then a new device will be added, otherwise, normal running of the
programme will start.
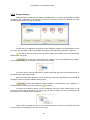
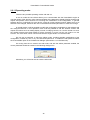
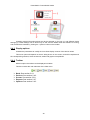
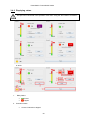
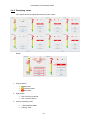
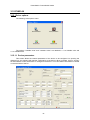
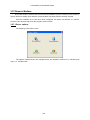
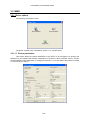
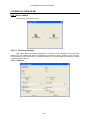
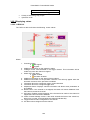
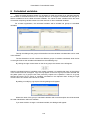
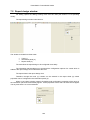
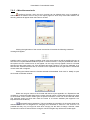
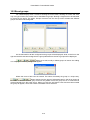
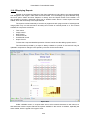
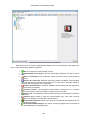
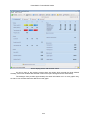
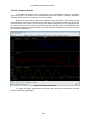
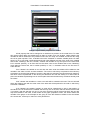
It can be seen that the program consists of four distinct areas:
The main menu: Situated at the top and gives access to all the functions of the programme.
Button bar: Placed just below the main menu and gives fast access to the most frequently
used functions.
Status bar: Situated at the bottom it offers general information on the status of the
application.
Main view: Occupies the rest of the available space and contains the current active view.
8
PowerStudio / PowerStudio Scada
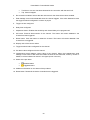
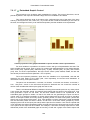
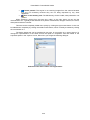
N.b: While this is the general view of the software, once it has been configured and the
installation is running, it can and should be minimised using the button to the left of the four buttons on
the top right-hand corner of the window. The programme will then only be shown as an icon in the
shape of a small orange arrow on the right hand side of the toolbar (where the time and other
programmes such as the anti-virus etc. can normally be found which run in the background on the
machine).
Thus avoiding the bother of having it permanently visible on screen, while at the same time
avoiding that it is accidently closed or that other machine users are tempted to use it.
To return to Power Studio again, normally it is enough just to double click on the icon and
select “Restore” from the contextual menu which appears when clicking on the right-hand mouse
button.
As you can see, when the right-hand mouse button is clicked, as well as the "Restore” option
the “Exit” option is also available. Use this option to leave the programme outright.
9
PowerStudio / PowerStudio Scada
2 Menu Bar
2.1 File Menu
‘Save’: This option can only be used when editing a SCADA screen or a report, otherwise it
remains disabled. It enables changes to be made to the SCADA screen or a report while it is being
edited.
‘Save as’: Offers the same characteristics and the same function as the Save option, except
that this allows changes to be saved on another SCADA screen or a different report to that being
edited.
‘Exit’: This brings the running of the programme to a finish.
2.2 Set up menu
The main software parameters can be configured using this menu.
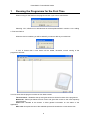
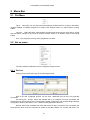
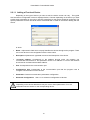
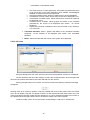
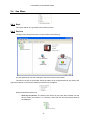
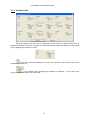
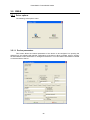
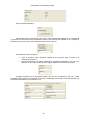
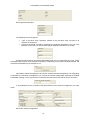
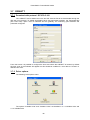
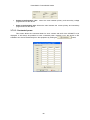
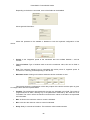
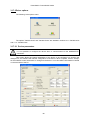
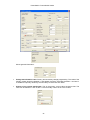
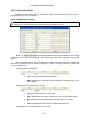
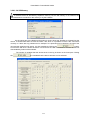
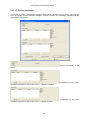
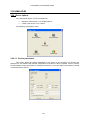
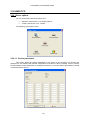
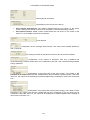
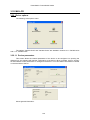
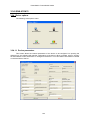
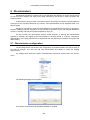
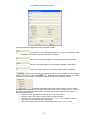
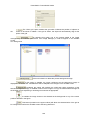
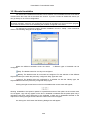
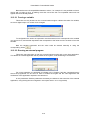
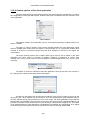
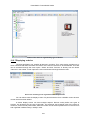
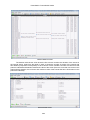
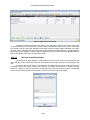
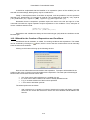
2.2.1 Devices
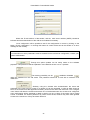
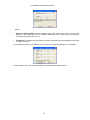
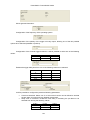
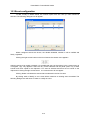
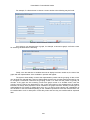
Clicking on this option will bring up the following dialogue:
Here a list with configured devices can be seen, distributed just as they are physically
connected.
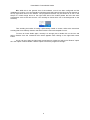
On clicking the ‘Accept’ button the software will try to configure, on those converters and
devices that can be configured, the communication speeds configured in the corresponding advanced
configuration window, see section 2.2.1.3 Advanced Configuration of Devices.
Devices have been classified into those which have a direct connection and converters and
those devices which must be connected to others so that the software can connect with them. The
10
PowerStudio / PowerStudio Scada
former appear on the list at the left of the dialogue, and will be called first-level devices from now on,
the second type can be found on the right, and from now on will be termed second-level devices.
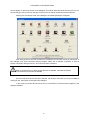
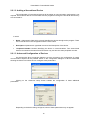
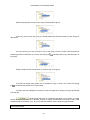
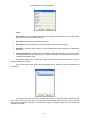
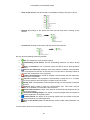
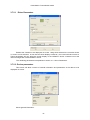
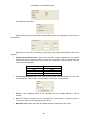
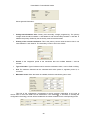
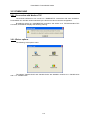
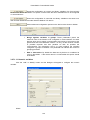
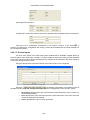
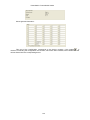
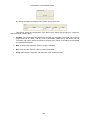
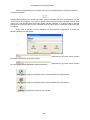
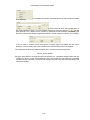
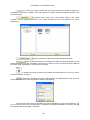
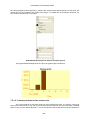
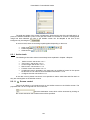
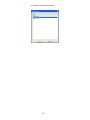
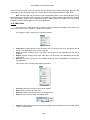
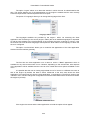
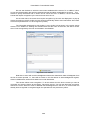
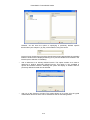
Clicking the ‘Add’ button to left of the dialogue; the following dialogue will appear:
From here the device we wish to add can be selected. As has been previously mentioned, in
this dialogue only direct connection devices appear, either with a network connection or with an
RS232 connection directly to the PC, and communication converters.
Bear in mind that if any of the first-level devices are deleted, second-level devices
connected to them will also be deleted.
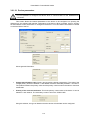
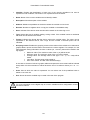
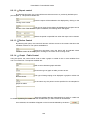
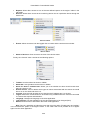
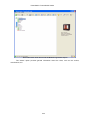
Once the first-level device has been selected, the devices connected to it may be added by
clicking on the ‘Add’ button to the right of the dialogue.
In this case only those devices which can be connected to a first-level device appear in the
dialogue selection.
11
PowerStudio / PowerStudio Scada
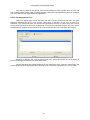
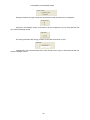
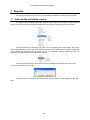
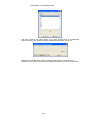
The option ‘Check if the device works when added’ indicates to the software that when
added, the connection should be verified and will give the error message if the device is not working
correctly or is absent. If when adding a device this check is not required, either because it has not
been installed yet or for any other reason, this option should be deselected.
It is possible that while devices are being added or altered, communication with such
devices may not be possible if the configured speed is different to the connection speed, but
communication will be possible once the software finalises the speed configuration process.
12
3
Generis
3
ModubsTCP
X
X
X
X
1
X
X
X
2
X
X
2
X
X
2
X
X
Generic TCP
X
X
X
1
X
X
X
2
X
X
2
X
X
2
X
X
3
X
X
X
X
X
X
X
X
X
X
X
X
Generic UDP
TCP50-Alarm
X
X
X
X
1
X
X
X
2
X
X
2
X
X
2
X
X
LM50-TCP
Modbus TCP
X
X
X
X
X
X
X
X
X
X
X
X
X
LM50-TCP
TCP2RS
Modbus TCP
X
X
X
X
X
X
X
X
X
X
X
X
X
TCP2RS
QNA RS485
TCP2RS
C-14d
CBS-4
CBS-8
CDR-8
CIRWATT
CVM-144
CVM-96
CVM-B/BD
CVM-BC
CVM-K
CVM-K2
CVM-K HAR
CVM-MINI
RS232/485
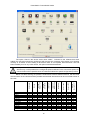
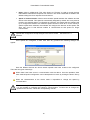
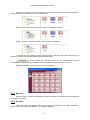
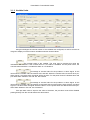
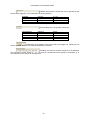
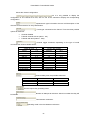
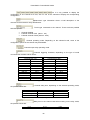
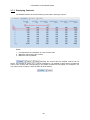
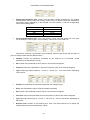
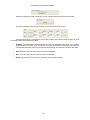
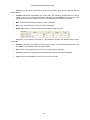
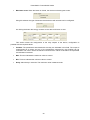
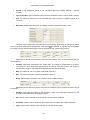
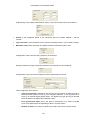
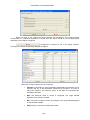
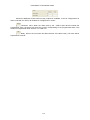
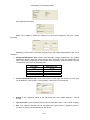
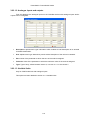
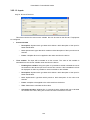
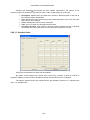
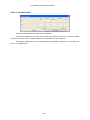
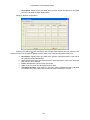
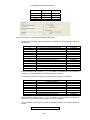
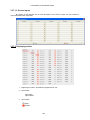
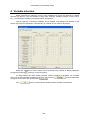
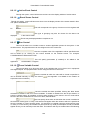
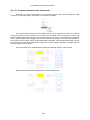
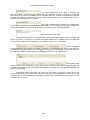
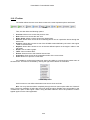
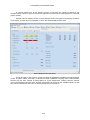
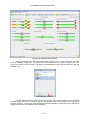
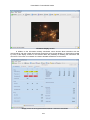
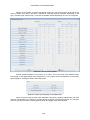
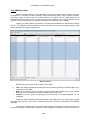
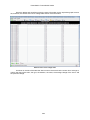
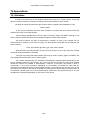
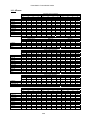
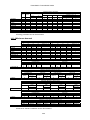
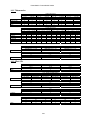
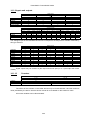
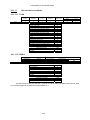
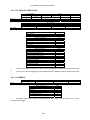
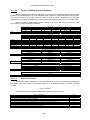
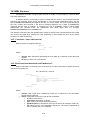
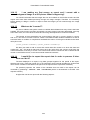
Below is a table showing the possible combinations between different devices, with first-level
devices shown in the columns and the possible second-level devices that can be connected to them in
the rows.
X
X
X
X
X
X
X
X
X
X
X
X
X
X
X
X
X
X
X
X
X
X
X
X
X
X
X
X
X
X
1
X
X
X
2
X
X
2
X
X
2
X
X
X
X
X
X
X
X
X
X
X
X
X
X
X
X
X
X
X
X
X
X
X
X
X
X
X
X
X
X
X
X
X
X
X
X
X
X
X
X
X
X
X
X
X
X
X
X
X
X
X
X
X
X
X
X
X
X
X
X
X
X
X
Generis
3
ModubsTCP
X
X
X
X
3
X
X
X
X
X
X
X
X
X
Generic TCP
X
3
X
Generic UDP
X
TCP2RS
QNA RS485
X
TCP2RS
Modbus TCP
TCP50-Alarm
X
X
X
X
X
X
X
X
X
X
X
LM50-TCP
Modbus TCP
X
X
X
X
X
X
X
X
X
X
X
X
X
X
X
LM50-TCP
CVM-NRG96
CVM-R8
CVM-SP
DH-96
EDMk
Generic MODBUS
LM-24
LM-4
MK-LCD
Mk D
POWERNET
QNA-412
QNA-413
RGU-10
RRM-C
TCP2RS
RS232/485
PowerStudio / PowerStudio Scada
X
X
X
X
X
X
X
X
X
X
X
X
1
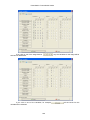
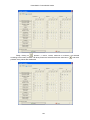
Downloading data using IEC 870-5-102 is not recommended when the communication protocol is Modbus TCP.
Restricted to reading values. Configuration is not possible.
Depending on the generic converter used, communication errors may be produced with other devices. To learn how to configure the generic
converters see the corresponding manual.
2
3
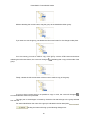
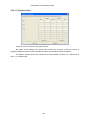
It is possible to move the second-level devices to a first-level device different to that previously
added by following these steps:
Select devices to be moved by clicking the left mouse button.
Without releasing the left mouse button, drag the cursor to the first level device to where we
want to move the selected devices
Finally, release the left mouse button for the change to take place
If it is not possible to move the device to the desired first-level device, either because
communication is not permitted or second-level devices can not be connected or there is an
inconsistency between devices, the cursor will change to
permitted
13
, to signal that the operation is not
PowerStudio / PowerStudio Scada
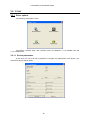
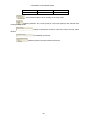
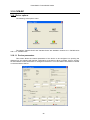
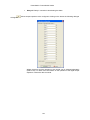
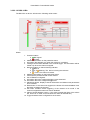
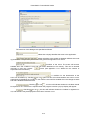
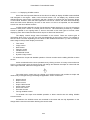
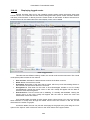
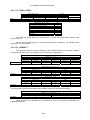
2.2.1.1 Adding a First-level Device
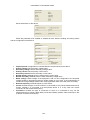
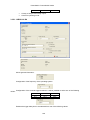
Depending on the type of device you want to add, the device screen can vary. The typical
first-level device configuration screen is displayed below, however depending on the device you want
to add some parameters do not exist or specific parameters for the device should be configured. The
special parameters for each first-level device will be dealt with in detail in the section dealing with the
device.
In which:
•
Name: Alphanumeric field which uniquely identifies the device throughout the program. There
are no two devices in the configuration with the same name.
•
Description: Alphanumeric type data to enter a brief description of the device.
•
Converter address: Corresponds to the address through which the program can
communicate with the device. This parameter can be an IP address or a name. This address
should not be confused with the MAC address.
•
Port: Corresponds to the communication port.
•
Configuration port: Corresponds to the communication port that the program uses to
configure communications on the devices.
•
Parameters: General communication parameters configuration.
•
Advanced Configuration: See 2.2.1.3 Advanced configuration of devices.
Depending on the device added there may be more or fewer parameters. For more
information see the section on the corresponding device.
14
PowerStudio / PowerStudio Scada
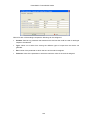
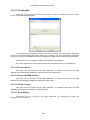
2.2.1.2 Adding a Second-level Device
The configuration of second-level devices will be easier as communication configuration is not
required. Second-level devices communicate with the programme through the first-level devices they
are connected to.
In which
•
Name: Alphanumeric field which uniquely identifies the device throughout the program. There
are no two devices in the configuration with the same name.
•
Description: Alphanumeric type data to enter a brief description of the device.
•
Peripheral Number: Number identifying the device in communications. Two second-level
devices connected to the same first-level device may not have the same peripheral number.
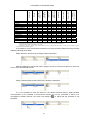
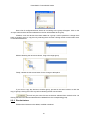
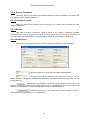
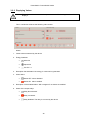
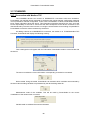
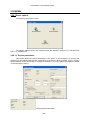
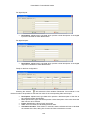
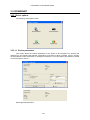
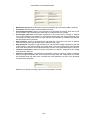
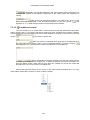
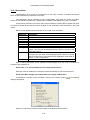
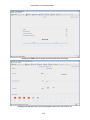
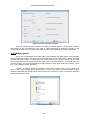
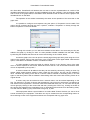
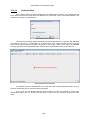
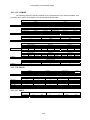
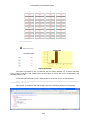
2.2.1.3 Advanced Configuration of Devices
On devices with direct connection features, such as converters, the configuration of certain
communication aspects will be possible. Below is the configuration dialogue of device RS232/485
showing the button from where we can configure these parameters.
Clicking on the ‘Advanced setup” button enables the configuration of these additional
parameters.
Depending on the device being configured, some of these parameters may not appear.
15
PowerStudio / PowerStudio Scada
•
Delay: Value in milliseconds. This value known as “Timeout” is used to control the time
that software will await the response from a device. The value entered will be added to the
default waiting time for a response from the device.
•
Speed of Communication: Allows communication speed between the software and the
device to be selected. This speed is automatically assigned by default, but it may also be
forced to the desired speed. If configured as automatic, this means that the software will
try to configure the devices at a maximum speed common to them all. If on the contrary a
specific speed were selected, the software will configure the devices at this speed, and
what may occur is that devices unable to communicate at that speed no longer
communicate.
Speeds are configured to accept changes in the device screen. See section 2.2.1
Devices.
Once speeds are configured, if there have been any problems the following dialogue will
appear.
Here the different devices are shown whose speeds have been unable to be configured.
There are two types of warnings
When there have been errors in communication with the device. Once the problems have
been resolved speed configuration can be attempted once more by clicking the button ‘Re-try
’.
When the characteristics of the device make it impossible to change the speed by
communication.
The user is responsible for manually configuring the suitable speed on those devices where
it is not possible to configure the speed by communication. To learn how to change the
speeds on the devices, consult the corresponding manual.
16
PowerStudio / PowerStudio Scada
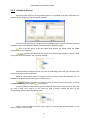
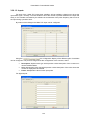
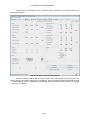
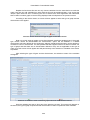
2.2.2
Groups of Devices
Using this option, devices can be grouped together. It is possible to have the same device in
different groups; similarly groups can also be grouped.
The left part of the dialogue corresponds to the defined groups. The tree structure (with son
and father nodes) will facilitate the display of the dependency between groups.
This is the root group of the tree. When new devices are added, these are added
automatically to this root group.
Clicking will add the group as son of the selected group (father). Only the name
of the group must be entered in the new group created.
If we then want to change the name of a group at a later stage, select the group and then click
on the name with the left mouse button.
Within the same father group the names of the son groups cannot be repeated, but it is
possible to repeat the names of the groups in father groups.
Clicking will delete the selected group, as well as all the son groups. It will be
possible to delete any group except ' ; (root group).
It is also possible to add or delete groups clicking the right button of the mouse on the node
you want to add a son node or on the node you want to delete. Clicking will bring up the
corresponding menu to select the desired action.
Lastly, it will be possible to move or copy a group. For this click the left mouse button on the
group you want to move or copy.
17
PowerStudio / PowerStudio Scada
Without releasing the mouse button, drag the group to the destination father group.
If you want to move the group, just release the left mouse button for the change to take place.
If on the contrary you want to make a copy of the group, click the CTRL button and without
releasing the left mouse button, the cursor will change to
group.
, indicating that a copy will be made of the
Finally, release the left mouse button of the mouse to make a copy of the group.
If you try to drag a group which is not possible to copy or move, the cursor will change to
to indicate that the action is not permitted.
,
The right part of the dialogue is formed by the device list that belongs to the group selected
from the tree.
For easier identification the name of the group is indicated in the list description:
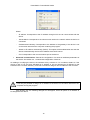
Clicking the button will bring up the following dialogue box:
18
.
PowerStudio / PowerStudio Scada
Here a list of configured devices which do not belong to the group will appear. Click on the
“Accept” button and the devices selected from the list will be added to the group.
Likewise, once the devices have been added to a group it will be possible to change them
easily to another group or copy them by selecting them and then clicking the left mouse button when
on the selected devices.
Without releasing the left mouse button, drag to the target group.
Finally, release the left mouse button for the change to take place.
If you want to copy the devices to another group, proceed in the same manner as with the
copy of groups, clicking the CTRL key before releasing the left mouse button.
This will only be active if there are devices selected from the device list. On
clicking the button the devices selected will be deleted from the corresponding group.
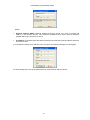
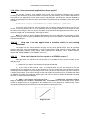
2.2.3 Discriminators
Enables discriminators to be added, modified or deleted.
19
PowerStudio / PowerStudio Scada
The configuration of discriminators will be explained at length in chapter 5 of this manual,
Discriminators.
2.2.4 Calculated variables
Enables variables, to be calculated, changed or deleted.
The configuration of calculated variables will be explained at length in chapter 6 Calculated
Variables.
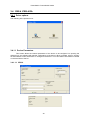
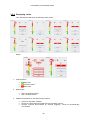
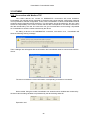
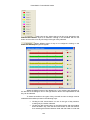
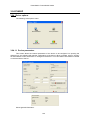
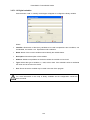
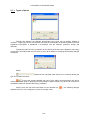
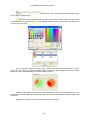
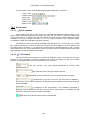
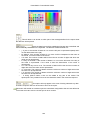
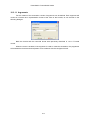
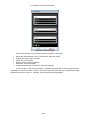
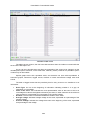
2.2.5 Styles
This option can be used to add, modify or delete font styles used to show the values on the
different SCADA screens and reports. Each one of the styles will be made up of a colour and a font
format.
Clicking the right button on the mouse over the list of styles the following contextual message
will appear.
This will enable styles to be pasted and copied. It may be possible that some of the options from the
context menu do not appear, copy will only appear if there is a style selected and the paste option only
if the styles have been copied onto the clipboard. If no style is selected or there are no styles on the
clipboard, when the right button is pushed the context menu will not appear.
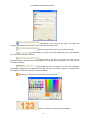
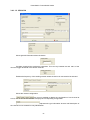
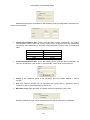
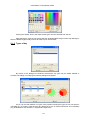
Push the ‘New’ or ‘Modify’ button and it will be possible to add or modify a style.
20
PowerStudio / PowerStudio Scada
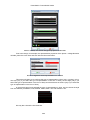
Corresponds to the name of the style. This name will
uniquely identify the style; there are no two styles with the same name.
Will correspond to the type of font used for the style.
Corresponds to the style of the font. Depending on the font selected,
you can choose bold and / or italics.
Corresponds to the size of the font. The size can be
between 1 and 90. The size can be either keyed in or selected from the dropdown menu which shows
the options available.
Corresponds to the orientation of the text. The orientation
(expressed in degrees) can be between 0 and 350. The size can be either keyed in or selected from
the dropdown menu which shows the options available.
Clicking on the button the style colour can be selected.
Shows an example of how the style will appear.
21
PowerStudio / PowerStudio Scada
The ‘Delete’ button will only be active if there are styles selected from the style list. Clicking
the button will delete the styles selected.
22
PowerStudio / PowerStudio Scada
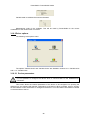
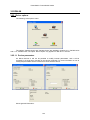
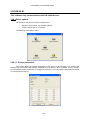
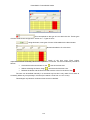
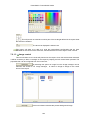
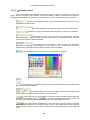
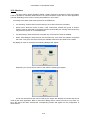
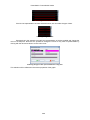
2.2.6 Image manager
Using this option images used to create a SCADA screen or a report can be added, modified
or deleted. The organization of the images is in the form of a tree so it can be classified into three
different categories to be chosen by the user.
The left side of the dialogue corresponds to the categories defined. The representation in tree
form (with son and father nodes ) will facilitate the display of the dependency between categories.
This will be the root group of the tree. When adding new images, they are automatically
added to this root group.
On clicking this, the group will be added as son to the selected group (father).
Then the name of the group is entered into the new node created.
If you then want to change the name of a group, select the group and once selected click on
the name with the left mouse button.
Within the same father group the names of the sons cannot be repeated, but it is possible to
repeat the names of groups in different father groups.
Clicking this deletes the group selected, as well as all the sons’ categories. It
will be possible to delete any group except the
(root group).
It will also be possible to add or remove categories clicking the right mouse button on the
group you want to add a son group or on the group you want to delete. The menu corresponding to
the selection of the desired action will appear.
Lastly, it will be possible to move or copy a particular group. For this you must click on the left
mouse button over the group you want to move or copy.
23
PowerStudio / PowerStudio Scada
Without releasing the mouse button, drag to the destination group.
If you only want to move the group you should release the left mouse button for the change to
take place.
If on the contrary you want to make a copy of the group, Click the CTRL button and without
releasing the left mouse button, the cursor will change to '
the group.
; indicating that a copy will take place of
Finally, release the left mouse button to make a copy of the group.
If you want to drag a group where it is not possible to copy or move it, the cursor will change
to ‘
; to indicate that the action is not permitted.
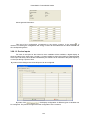
The right side of the dialogue is formed by a list of images which belong to the group selected
from the tree.
Clicking here will bring up a dialogue that allows you to select an image
stored on the PC for later use in SCADA screens or reports. PowerStudio will create a copy of the
image and will work with the copy, at no time will PowerStudio use the original image selected.
The images that can be added should have a maximum size of 2 Mbytes and a maximum resolution
of 2048x2048 pixels.
24
PowerStudio / PowerStudio Scada
Likewise, once images have been added to a group they can be easily copied or changed, by
clicking the left mouse button on one of those selected.
Without releasing the left mouse button, drag to the destination group.
Finally, release the left mouse button for the change to take place.
If you want to copy images in another group proceed in the same manner as with the copy of
groups by Clicking CTRL before releasing the left mouse button.
When clicked the selected image will be automatically removed.
PowerStudio will delete the copy created and will not delete the original stored on the PC.
Display the image by clicking twice on one of the images:
2.2.7 Reports
Using this option, reports can be added, modified or deleted. This section will be explained in
more detail in Chapter 7.
2.2.8 Screens
Using this option the different screens that make up SCADA can be added, modified or
deleted. This section will be explained in more detail in Chapter 8.
25
PowerStudio / PowerStudio Scada
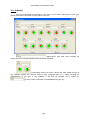
2.2.9 Events Timetables
This option allows us to configure the different disabling of events timetables. This section will
be explained in more detail in Chapter 10.
2.2.10 Groups of events
Using this option event grouping can be configured. This section will be explained in more
detail in Chapter 10.
2.2.11 Events
This option is used to configure a series of events in the software, configuring a disable
timetable for the event or carrying out a series of actions when the event comes about, while it is
active and when the event finishes. This section will be explained in more detail in Chapter 10.
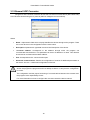
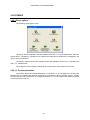
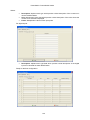
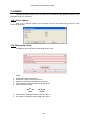
2.2.12 Preferences
This option can be used to configure a series of general parameters for the application.
Using this selector, the application language can be selected.
The option of using the application as a Web server, we can use the
internet browser to display the measurement parameters for the devices connected to the local PC
(see Chapter 12).
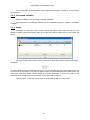
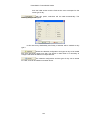
Will indicate to the software if an events log should be saved or not. If it is
decided to keep the system events, a table, with the various activities taking place in the system can
be seen, such as when a user accesses a SCADA screen or is denied access.
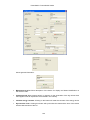
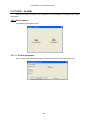
Allows the mail server to be configured to make it possible to send emails during events (see section 10.3.2.3 Send mail).
26
PowerStudio / PowerStudio Scada
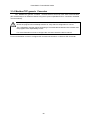
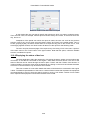
Where the ‘E-mail address’ of the sender,' and the Mail server address (SMTP) 'should be
indicated and the authentication of the mail server enabled if necessary.
Once configured it will be possible to test if the configuration is correct by clicking on the
button “Check configuration.” on clicking this button an e-mail will be sent to the sender or an error
message on the contrary.
For information on which parameters must be entered into the mail server configuration, contact your
system administrator.
Through this option updates can be easily made on the software
properties. This preference will be explained in more detail in section 2.2.12.1 Updates.
The blocking possibility can be
; enabled or disabled
;
using this password on the edit mode. This password should be a word with a maximum of 8
characters.
Similarly, using the ‘Activate User Authentication’ the name and
password of the user trying to access on a remote PC can be requested, in order to allow access to
some of the resources of the application and deny access to the rest of the resources. The ‘Configure
users’ button will allow the resources that each one of authorised users can access to be configured.
User configuration will be explained in detail in section 2.2.12.2.2 Users. If the option ‘Save system
events’ is enabled, the actions performed by users will be saved, whether they have been granted
access to the resource or if they have been denied it.
27
PowerStudio / PowerStudio Scada
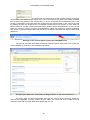
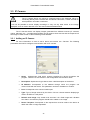
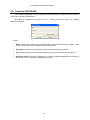
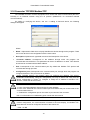
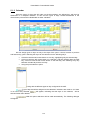
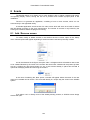
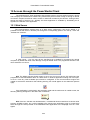
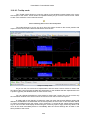
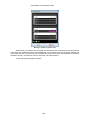
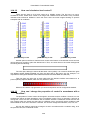
The engine can be configured as a RSS content producer so that we
can generate news related to the events which can be consulted by any RSS news reader (available
free for almost any platform and environment). To do so we activate the corresponding box in the
window ‘Configuration of the RSS feed’ and configure the two required fields. In the ‘URL server’ field
the address to which the HTML server is configured is added and in the 'Number of news feeds’ we
add the maximum number of news stories we want to publish (stories are published in a circle, so that
when the maximum number of stories are published the oldest are removed to continue publishing
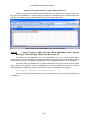
new stories). Typically browsers detect that the server contains an RSS feed and allow access thereto
(subscribe).
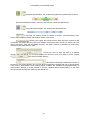
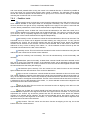
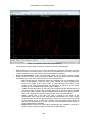
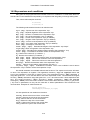
Message on the Internet Explorer about the RSS FEED found
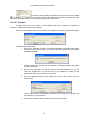
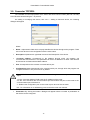
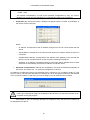
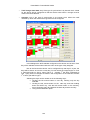
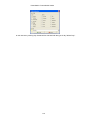
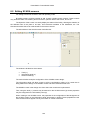
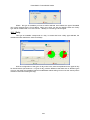
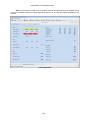
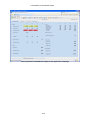
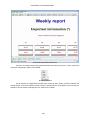
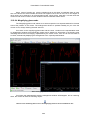
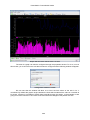
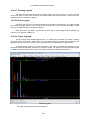
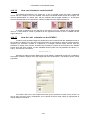
For example, the RSS newsreader provided by Internet Explorer would allow us to consult the
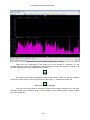
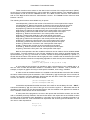
news published by the engine, and is displayed as follows:
Displaying the RSS news released by the Engine/ Editor on the Internet Explorer
Of course, there are other RSS readers who view the news in various forms for almost any
environment imaginable, including mobile devices, PDAs, etc. Note that each incident must be
configured if we want to publish RSS news related with it or not.
28
PowerStudio / PowerStudio Scada
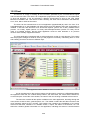
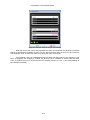
Permits the menu display and toolbar on the Java Client to be enabled
' ; or disabled ‘ . It also lets us set up the initial screen when the application is displayed through
the Java Client. See chapter 12 Access through the PowerStudio Client.
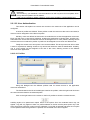
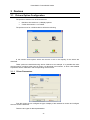
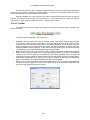
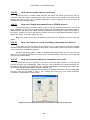
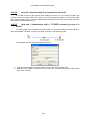
2.2.12.1 Updates
In cases where you have a version of the software and want to upgrade or expand this
limitation, updates should be from the USB key.
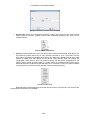
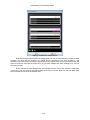
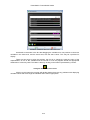
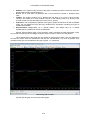
Clicking on the ‘Updates’ button in the 'Preferences' dialogue the following window will appear.
To update follow these steps
1. Click on the ‘Generate file’ button. This button generates a file with the information
necessary to ensure the update. Once the file has been generated the following
message will appear:
Informing where the file with the c2v extension containing software information
has been generated.
2. Send the file produced in the previous step to its usual distributor, so you can
create the updated file. You should wait for your distributor to send you the
updated file, with the v2c extension, to continue.
3. Once your distributor has sent the updated file, click on the ‘Search’ button to
select the file.
In this case the file is‘ HaspUpdate_1740475424.v2c ’which can be found in the
root directory on your hard drive.
4. Click on the ‘Update’ button and wait until the end of the update.
29
PowerStudio / PowerStudio Scada
Whenever necessary an update should be made carrying out the steps described
previously.
The file sent by your distributor, with the extension v2c will only serve for one update, which
is why after the update it can be deleted.
It will only be possible to update USB keys. It will not be possible to update parallel keys.
2.2.12.2 User Authentication.
This section will explain how remote user access to the resources of the application can be
configured.
A series of profiles are defined. These profiles contain the resources that can be accessed; a
resource can be assigned to more than one profile.
Similarly, users are defined as those who are authorised to access the application resources.
Each user will have a name and a password, enabling the application to identify them, avoiding nonauthorised user access. Each authorised user will be assigned one or more profiles, allowing access
to all the resources contained in profiles. A profile can be assigned to more than one different user.
Finally the access to an anonymous user can be enabled. This anonymous user will not have
a name or a password, allowing access to any remote user without a need for identification. Similarly,
one or more profiles will be assigned to the rest of the users, allowing access to the different
resources of the application.
2.2.12.2.1 Profiles
Using this dialogue box the different profiles used for remote access to the application
resources are defined.
The list situated to the left of the dialogue contains the profiles, while the right-hand list shows
the resources associated to the selected profile.
Click on the right button on the mouse on the list of profiles to show the contextual menu,
enabling styles to be pasted and copied. Some of the options from the contextual menu may not
appear, copy will only appear if there is a profile selected on the list and the paste option only if the
styles have been previously copied onto the clipboard. If no profile is selected and there are no styles
on the clipboard when the right button is pushed, the contextual menu will not appear.
30
PowerStudio / PowerStudio Scada
Clicking on ‘Add profile’ or ‘Modify profile’ will bring up the following dialogue box:
In this dialogue box the name and resources of the profile will be added or modified
depending on the button chosen. This name used to identify the profile will be unique; two profiles
cannot exist with the same name.
The list situated to the left of the dialogue shows the resources added to the profile that can be
used by the users who have that profile assigned, while the left-hand list shows the resources that the
profile user does not have access to.
To add resources to the profile, "Not Permitted" should be selected from the resource list and
passed onto the "Permitted" resource list using the '
; button, whereas if we want to delete
resources from the profile the opposite should be carried out, select "Permitted" from the list and click
; button to pass over to the "Not Permitted" list.
the '
The different types of resources that can be added to a profile are:
¾
¾
Devices: Devices configured on the software.
Visualise. Allows the chosen devices to be visualized.
Force variables: This allows the variables values of the devices to be
forced. Only devices where it is possible to force one or more variable can
be shown, for example digital outputs.
Configure. Allows certain parameters of the devices can be configured.
Only devices where it is possible to configure parameters while on the
execution mode will be shown.
Screens: Will show the different SCADA screens which configure the application.
See section 2.2.8 Screens.
Visualise: Enables the chosen screen to be visualised.
Force Variables: Permits variables to be forced using the "force variable"
controls on the SCADA screens.
¾
Reports: Shows the defined reports. See section 2.2.7.
¾
Events: Will display the various events resources (see section 2.2.1.1 Events )
that can be added to a profile:
31
PowerStudio / PowerStudio Scada
Run event actions on client application. Will enable programmed actions
to be carried out on the client application when enabled, acknowledged,
disabled or while events are being produced.
Recognise notified events. Allows a notified event to be acknowledged.
Visualisation of active events. Allows active events to be displayed or not.
Visualisation of notified events. Allows events which need to be notified to
be displayed or not.
Visualises event variables: Allows graphs and tables of the variables
generated by the events to be displayed (see section 10.4 Event
variables)
Display event browser. Enables the list of events stored on file, notified or
not, to be seen.
¾
Calculated Variables: Allows graphs and tables of the calculated variables
configured on the software to be displayed (see section 2.2.4 Calculated
variables)
¾
Others: Allows the table with the events of the system to be displayed.
2.2.12.2.2 Users
Using this dialogue box the users, who have access to the application resources, are defined.
The list situated to the left of the dialogue contains the configured users, while the right-hand
list shows the profiles associated to the users selected from the user list.
Clicking the right-button on the mouse over the list of users the following contextual message
will appear:
allowing users to be copied or pasted. It may be possible that some of the options from the context
menu do not appear, copy will only appear if there is a user selected and the paste option only if the
users have been previously copied onto the clipboard. If no user is selected and there are no users on
the clipboard when the right mouse button is clicked the context menu will not appear.
To add or modify a user, click on the button corresponding to ‘Add user’ or ‘Modify user’.
32
PowerStudio / PowerStudio Scada
Where:
•
User name: Will be an alphanumeric field which uniquely identifies the user. This field will be
used to identify the user when necessary.
•
Full name: Corresponds to the user's Full name.
•
Description: Field which permits a brief description of the user to be entered.
•
Password: Password which serves to avoid unauthorised users accessing the application
resources.
•
Confirm password: Field which serves to validate the password entered in the previous field.
The values entered in the ‘Password’ and ‘Confirm Password’ must be the same in order to
consider the password valid.
If we want to delete one or more users, select those users we wish to delete from the user list
and click "Delete User" button.
Click on the "Add Profiles" button and new profiles can be assigned to the user selected from
the user list.
The dialogue will only show those profiles which have not been previously assigned to the
user. In this case for the user "jbrook" only the "User" profile will be shown as it is the only one which
has not been assigned to the user. On choosing "Accept" the profiles selected from the list will be
assigned to the user.
33
PowerStudio / PowerStudio Scada
If we want to delete a user profile, select those profiles we wish to delete from the user and
click "Delete profiles" button. Bear in mind that these profiles are only deleted from the user profile list
and in no case are they deleted from the application.
2.2.12.2.3 Anonymous User
There is a special type of user that from now will be known as anonymous user. The main
difference between this type of user and the other users is that they do not have a name or a
password. The anonymous user can access the application resource to which they have access
without having to enter a name and a password. To avoid non-authorised access, this user can be
disabled to have greater control over those who can access the resources and those who cannot.
Enabling or disabling the "Activate anonymous user" option will activate or not the option to
permit the anonymous user by way of the Java Client.
The list will show the profiles assigned to the anonymous user, with the "Add profile" and
"Delete profile" buttons working the same as those of any other user (see section 2.2.12.2.2 Users)
34
PowerStudio / PowerStudio Scada
2.2.13 Operating mode:
There are two possible operating modes: edit and run.
In the run mode the Java Client allows you to communicate with the PowerStudio engine to
view the values of the devices, make charts and tables of the data saved, display SCADA screens and
reports and perform other functions not involving the modification of the configuration, in general
software terms or individually for each device, except for some equipment which allows some of its
features to be changed, whenever the user connected has sufficient permission to make this change.
In the edit mode, it will be possible to modify the configuration parameters for the software and
the configured devices. In this operation mode it will be possible to edit the SCADA screens and
reports and actions such as adding display controls, modifying controls, etc. can be carried out. Once
the SCADA screens have been edited it will be necessary to move onto the run mode to run the
screens. The Java Client cannot communicate with the engine while it is in the edit mode.
We can use a password, to block the edition mode, avoiding possible modifications of the
configuration, whether by error or by non-authorised personnel. To enable the edit password select
the most suitable option in the Preferences dialogue (see section 2.2.12 Preferences).
On moving from the run mode to the edit mode, and with the edition password enabled, the
correct password should be entered in the following dialogue box:
Otherwise, you will not be able to enter the edit mode.
35
PowerStudio / PowerStudio Scada
2.3 Edit Menu
The options from this menu are only enabled when editing SCADA screens or reports.
2.3.1 Cut
Using this option the controls selected are copied onto the clipboard and are deleted from the
editor.
This option is only enabled if there is at least one control selected on the editor.
2.3.2 Copy
Using this option the controls selected are copied onto the clipboard. Unlike the "Cut" option
the controls are not deleted from the editor.
This option is only enabled if there is at least one control selected on the editor.
2.3.3 Paste
Using this option the controls previously copied from the clipboard can be pasted onto the
clipboard.
This option is only enabled if the clipboard contains valid controls for PowerStudio.
2.3.4 Delete
Using this option the selected controls are deleted.
This option is only enabled if there is at least one control selected on the editor.
2.3.5 Select All
Using this option all the SCADA control screens or a report can be selected.
36
PowerStudio / PowerStudio Scada
2.4 See Menu
2.4.1 Back
This option allows us to go easily to the previous screen.
2.4.2 Devices
Clicking on the devices will open a screen similar to the following:
It is also possible to view this clicking the "Devices" button on the toolbar.
The tree on the left of the window shows the status of all configured devices. By clicking the
right mouse button on the tree the following context menu will appear:
Where the different options are:
o
Show by Connection: The devices are shown as they have been entered onto the
device screen (see section 2.2.1 Devices), where the first and second-level devices
are displayed.
37
PowerStudio / PowerStudio Scada
o
Show as per device: The devices will be classified according to the type of device.
o
Expand all: Clicking on this option the entire tree will drop down, showing all the
devices.
o
Contract all: Clicking on this option will hide second-level devices.
We may find the following states are possible:
•
•
•
•
•
•
•
•
•
•
•
•
OK: The equipment communicates properly.
Downloading of the device: We are downloading data from the device at this
time.
Error in connection: The connection where the device can be found presents
problems.
Device not started up: Attempts were being made to establish communication
with the equipment at this time for the first time. This process is necessary initially to
ascertain the configuration of the equipment.
Failed communications: Unable to establish communication with the equipment,
response time is exceeded.
Incorrect version: The equipment communicates correctly but it is a version
which the programme does not support. Perhaps it is an old version.
Phase error: The equipment communicates correctly but some phase connection
is incorrect.
Channel error: Unable to open the communication port. This action must be
carried out to establish communication with the device.
Failed communications: Some of the devices connected to this equipment do not
communicate properly.
Camera transmitting images: The engine is receiving images from the camera as
a customer application is requesting them.
Camera paused: The engine is not receiving images from the camera as they are
not being required by any client application.
Error on the memory card. The SD Memory Card is invalid, write-protected or not
present.
The information found on the right side of the window:
38
PowerStudio / PowerStudio Scada
Contains general information about the device selected on the tree (1) and different device
settings (2). These settings can be found only on edit, and are hidden when the software is running,
and will also be accessible by clicking the ‘Options’ button on the toolbar.
2.4.3 Display options
Contains the parameters to modify the Java client display screens of the device values.
This menu option will depend on what is being shown on the screen, and will be explained in
the corresponding sections, when the devices, tables and graphs are explained.
2.4.4 Toolbar
With this option the toolbar can be displayed or hidden.
This bar contains the main elements of the View menu.
¾
¾
¾
¾
¾
Back: See section 2.4.1
Devices: See section 2.4.2
Screen: See section 2.2.8
Reports: See section 2.2.7
Options: See section 2.4.3
39
PowerStudio / PowerStudio Scada
2.4.5 Status Bar
With this option the status bar can be displayed or hidden.
To the right of the bar is a series of icons showing, where necessary, information on the status
of the program. Double-clicking on the corresponding icon will show additional information on the
meaning of each one of them.
The icons shown are:
Initialisation of devices. Shown while starting communication with the devices.
Communication error. Shown when communication is not possible with at least one of the
devices.
Edit mode. Shown to indicate that the programme is editing.
2.4.6 About
Shows information on the software.
40
PowerStudio / PowerStudio Scada
3 Devices
3.1 Drivers Option Configuration
The options of a device can be accessed from
•
•
See Menu See section 2.4.3 Display Options.
Toolbar See section 2.4.4 Toolbar
The options menu for a CVM-96 device will be the following
In this section those options which are common to all or the majority of the drivers are
described.
These options are described using device CVM-96 as an example. It is possible that other
devices need to configure other types of option, not described in this section, in which case detailed
explanation will be contained in the corresponding device section.
3.1.1
Driver Parameters
From this screen we can configure the type of display of the variables on screen and configure
where to save the data files.
There are two types of data representation.
41
PowerStudio / PowerStudio Scada
Analogue representation, the variables are graphically represented by bars as
Here the instantaneous value, maximum and minimum values are represented.
Text mode representation, the variables are represented as
In this field the capture period is entered in minutes. This indicates the time
interval which elapses between the registers stored of the device.
Checking this option will indicate that the data read from the devices will
be stored in the default directory where the software saves all the data. Should you wish to store the
data in a directory other than this default directory, this option must be unchecked and the directory
entered into the ‘Data directory” field.
Should you wish to store the data in a different
directory than the default one, this area displays the directory where such data is stored. Clicking
on
; will change the data directory.
This selector will assign a default discriminator to
the device. This option appears only in those devices possessing variables that can be discriminated.
If we select a discriminator, when making graphs or tables, the variables are displayed initially as
discriminated, although it is also possible to see the variables without discrimination, or see them
through another discriminator other than the default one.
42
PowerStudio / PowerStudio Scada
3.1.2 Variable Units
Using this dialogue the units can be configured and the number of decimals with which to
display the variables on screen. This type of configuration does not affect the equipment, being used
only for displaying the values on screen.
The units in which the variables are shown are selected. In this case all the current
variables will appear in A.
The precision when displaying the variables is selected.
current variables are shown with 3 decimals.
43
In this case all the
PowerStudio / PowerStudio Scada
3.1.3 Variable limits
Using this dialogue the nominal values of the variables are configured, as well as a series of
margins to display on screen when a variable measures unusual values.
The nominal value of the variable. The units used to express this value are
indicated in the brackets. If the nominal value is 0, the alarm is disabled. For the power factor, the
nominal value should be 1 to enable the alarm or 0 to disable it.
Percentage of nominal value for the pre-alarm or alarm signal. In this
case when the variable value is between 25% and 50% below the nominal value, there will be a prealarm signal, if it is below 50% the signal will be an alarm. For the power factor the desired alarm and
pre–alarm alarm between +0.0 and -0.0. are entered.
Percentage of nominal value for the pre-alarm or alarm signal. In this
case when the variable value is between 25 and 50% above nominal value, there will be a pre-alarm
signal, if it is above 50% the signal will be the alarm. For the power factor the desired alarm and pre–
alarm alarm between +0.0 and -0.0 are entered
If the pre-alarm value is equal to the value of the alarm, the pre-alarm zone will be disabled
passing directly from the normal state to the alarm status.
44
PowerStudio / PowerStudio Scada
3.2 C-14d
3.2.1 Driver options
The following is the options menu:
The options "Variable Units" and "Variable Limits" are detailed in 3.1.2 Variable units and
3.1.2 Variable limits.
3.2.1.1 Device parameters
In the case of C-14d it will not be possible to configure any parameters of the device, only
information about it will be shown.
45
PowerStudio / PowerStudio Scada
3.2.2 Displaying Values
This part can be observed in the operation mode "Run" using the Java Client to
display it.
This C-14d device will show the following value screen:
Where:
1. Instant values measured by the device
2. Energy Quadrant
•
Inductive
•
Capacitive
•
Cos Phi = 1
3. Description that indicates if the energy is consumed or generated.
4. Alarm status:
•
Status OFF. Alarm disabled
•
Status ON. Alarm enabled.
5. Description of the enabled alarm. Will not appear if no alarms are enabled.
6. Status of the output relays:
•
Relay disconnected.
•
Relay connected.
•
Relay disabled. The relay is not used by the device.
46
PowerStudio / PowerStudio Scada
3.3 IP Camera
The IP Camera device only allows a captured image to be displayed, either by
connecting directly with a camera with an Ethernet connection, a video recorder to
which petitions can made or webcams.
It will not be possible to record, display recordings or carry out any other action on the image
displayed, such as motion detection, from the sources described beforehand.
The IP Camera device can display images generated from different sources (IP cameras,
videos, webcams, etc…) provided web requests can be made to these sources and the response is a
still image in JPEG format or video streaming format MJPEG.
3.3.1 Adding an IP Camera
For more information on how to add a device see section 2.2.1 Devices. The following
parameters are used to configure communication with an IP camera.
•
Name: Alphanumeric field which uniquely identifies the device throughout the
program. There are no two devices in the configuration with the same name.
•
Description: Alphanumeric type data to enter a brief description of the device.
•
IP Address: Corresponds to the address through which the program can
communicate with the device. This parameter can be an IP address or a name.
•
Port: Corresponds to the communications port.
•
Type: Type of image returned by the device. We can choose between displaying a
video in MJPEG or a still picture
•
Refresh each image: Only needs to be set when it is a fixed image and it dictates
how often in seconds the program should ask to obtain a new image.
•
Route / Request: Corresponds to the request that must be made to the device to
obtain the video or image requested.
47
PowerStudio / PowerStudio Scada
•
Search: By clicking on this button, the program will try to find the device at the
address and port configured, using the most frequent routes / requests.
For more information on which route or request should be used, consult the device
manual or contact your distributor.
48
PowerStudio / PowerStudio Scada
3.4 CBS-4 /CBS-4 RA
3.4.1 Driver options
The following is the options menu:
3.4.1.1 Device Parameters
This screen allows the internal parameters of the device to be configured. On opening the
dialogue box, the software will read the configuration of the device. When complete, click on "Accept"
for the software to send information on changes to the device. In no case will the information be stored
on the hard drive of the PC.
3.4.1.1.1 CBS-4
49
PowerStudio / PowerStudio Scada
Shows general information about the device.
Pre-alarm threshold the equipment possesses. This can vary between 50 and 100% of the
minimum trip threshold of the device channels.
Enables the frequency of the working network where the device is connected to be selected.
Shows the channel configuration.
As it is only possible to display the configuration of one channel at
a time, click one of the channels and the selected configuration can be displayed.
Alphanumeric type information where a brief description of
the channel can be entered for easy identification.
Indicates the maximum current that can be reached by the
device before triggering. The values that can be acquired are:
Disabled
0.3 (A)
3 (A)
30 (A)
0.03 (A)
0.5 (A)
5 (A)
0.1 (A)
1 (A)
10 (A)
Channel delay time, the possible values are:
Instantaneous:
100 ms
400 ms
1s
10s
Selective
200 ms
500 ms
3s
20 ms
300 ms
750 ms
5s
Configuration of the polarity of the output relay of the trigger coil, allowing one of
the two options possible to be selected (standard or positive).
If this option is selected, when triggering takes place, the device will try to
reconnect the channel.
50
PowerStudio / PowerStudio Scada
3.4.1.1.2 CBS-4 RA
Shows general information about the device.
Pre-alarm threshold the equipment possesses. This can vary between 50 and 100% of the
minimum trigger threshold of the device channels.
Enables the frequency of the working network where the device is connected to be selected.
Shows the channel configuration.
As it is only possible to display the configuration of one channel at
a time, click on one of the channels to display the corresponding configuration.
Alphanumeric type information where a brief description of
the channel can be entered for easy identification.
51
PowerStudio / PowerStudio Scada
Indicates the maximum current that can be reached by the
device before triggering. The values that can be acquired are:
Disabled
0.3 (A)
3 (A)
30 (A)
0.03 (A)
0.5 (A)
5 (A)
0.1 (A)
1 (A)
10 (A)
Channel delay time, the possible values are:
Instantaneous:
100 ms
400 ms
1s
10s
Selective
200 ms
500 ms
3s
20 ms
300 ms
750 ms
5s
Configuration of the polarity of the output relay of the trigger coil, allowing one of
the two possible options to be selected (standard or positive).
Enabling the channel reclosure sequence to be selected.
The information shown will be xx – yy – zz where xx corresponds to the number of reclosures, yy to
the sequence of time and zz to the reset time.
52
PowerStudio / PowerStudio Scada
3.4.2 Displaying values
This part can be observed in the operation mode "Run" using the Java Client to visualise it.
In which:
1.
Relay Status
•
•
Correct
Tripped.
2. Protection status:
•
Correct. Channel not tripped
53
PowerStudio / PowerStudio Scada
•
•
Toroid error. An error has been detected in the connection with the toroid coil.
Trip. Channel tripped
3. Re-connection enabled. Informs that the reclosures for the channel have been enabled.
4. Earth leakage current value detected when the channel triggers. If the value detected is twice
the trigger threshold configured it is shown in purple.
5. Trigger current configured
6. Delay time configured
7. Adjustment button. Enables the sensitivity and channel delay to be programmed.
8. Off button. External disconnection of the channel. The button will remain disabled if the
channel has been triggered.
9. Reset button. Push the button to restart the channel. The button will remain disabled if the
channel has not triggered.
10. Display units of the current values.
11. Trigger threshold value configured for the channel
12. Pre-alarm value configured for the channel
13. Instantaneous earth leakage current value of the channel. When the instantaneous earth
leakage current value of the channel exceeds the limits of the values bar, either by excess or
default, it will be indicated as shown in the figure (arrow in the bar).
14. Status of the pre-alarm:
•
•
Disabled status
Triggered status
15. Additional information on the status of the pre-alarm.
16. Reset button. Resets all the device channels that are triggered.
54
PowerStudio / PowerStudio Scada
3.5 CBS-8
3.5.1 Driver options
The following is the options menu:
3.5.1.1 Device parameters
This screen allows the internal parameters of the device to be configured. On opening the
dialogue box, the software will read the configuration of the device. When complete, click on "Accept"
for the software to send information on changes to the device. In no case will the information be stored
on the hard drive of the PC.
55
PowerStudio / PowerStudio Scada
Shows general information.
This selector allows the equipment to have the channel reclosures enabled or not. Depending
on whether the reclosures of the configuration fields of the channels are enabled or not. Clicking on
the button ‘Synchronize clock’ the present time will be sent to the PC.
The following can be configured:
•
•
Type of pre-alarm relay. Operation method of the pre-alarm relay common to all
channels of the device.
Pre-alarm threshold. Pre-alarm threshold the equipment possesses. This can vary
between 50 and 100% of the minimum trigger threshold of the device channels.
A trigger threshold and a personalized delay time can be configured by the user. These
parameters are common to all channels of the device. Depending on the type of channel selected, the
customised threshold may be selected or not.
56
PowerStudio / PowerStudio Scada
Shows the channel configuration.
As it is only possible to display the
configuration of one channel at a time, click on one of the channels to display the corresponding
configuration.
Alphanumeric type information where a brief description of the
channel can be entered to for easy identification.
Toroid type connected to the channel. There are three possible
options for selection:
•
•
•
Channel disabled
Fullscale channel with 6A (30mA .. 6A)
Fullscale with 60A (300mA .. 60A)
Channel trigger threshold, depending on the type of toroid
connected the values available will be:
Toroid 30 mA 6… A
30 mA
1A
50 mA
1.5 A
100 mA
2A
200 mA
2.5 A
300 mA
3A
400 mA
3.5 A
500 mA
4A
600 mA
4.5
700 mA
5A
800 mA
5.5 A
900 mA
6A
Customised 1
1
Toroid 300 mA 60A ...
300 mA
10 A
500 mA
15 A
1A
20 A
2A
25 A
3A
30 A
4A
35 A
5A
40 A
6A
45 A
7A
50 A
8A
55 A
9A
60 A
Customised
Only if the value of the customised trigger threshold does not exceed 6A
Channel delay time, the possible values are:
Instantaneous:
0.4 s
3s
Customised
Selective
0.8 s
5s
0.1 s
1s
10 s
Channel output relay operating mode.
Number of attempts at reclosure. After this number the relay will
be latched.
Time between reclosures.
Operating mode in the time between reclosures.
57
PowerStudio / PowerStudio Scada
3.5.2 Displaying values
The CBS-8 device will show the following value screen:
Where:
1. Channel status:
•
•
•
Status ON.
Pre-alarm status.
Status OFF.
2. Relay status:
•
•
ON. Non-latched channel
OFF. Latched channel
3. Additional information on the status of the channel:
•
•
•
Pre-alarm: Pre-alarm enabled
Reclosure: Channel disconnected with time reclosure process.
Remote: Channel disconnected by external triggering, cannot be automatically
reconnected.
58
PowerStudio / PowerStudio Scada
4. Reclosure enabled. Informs that the reclosures for the channel have been enabled.
5. Reset button. If the channel is not triggered, the button will remain disabled. Click on the
button to reset the channel.
6. Off button. External disconnection of the channel. The button will remain disabled if the
channel has not been triggered.
7. Adjustment button. Enables the sensitivity programming and channel delay.
information is also shown.
Channel
8. Trip threshold value configured for the channel.
9. Pre-alarm value configured for the channel.
10. Instantaneous earth leakage current value of the channel.
11. When the Instantaneous earth leakage current value of the channel exceeds the limits of the
value bar, either in excess or default, this will be indicated as shown in the figure (arrow below
the value)
12. Earth leakage current value detected when the channel trigger occurs.
59
PowerStudio / PowerStudio Scada
3.6 CDR-8
3.6.1 Driver options
The following is the options menu:
3.6.1.1 Device parameters
This screen allows the internal parameters of the device to be configured. On opening the
dialogue box, the software will read the configuration of the device. When complete, click on "Accept"
for the software to send information on changes to the device. In no case will the information be stored
on the hard drive of the PC.
60
PowerStudio / PowerStudio Scada
Shows general information.
The following can be configured:
•
•
Type of pre-alarm relay. Operation method of the pre-alarm relay common to all
channels of the device.
Pre-alarm threshold. Pre-alarm threshold the equipment possesses. This can vary
between 50 and 100% of the minimum trigger threshold of the device channels.
A trigger threshold and a user-personalised delay time can be configured by the user. These
parameters are common to all channels of the device. Depending on the type of channel selected, the
customised threshold may be selected or not.
This selector allows the equipment to have the channel reclosures enabled or not. Depending
on whether the reclosures are enabled or not, some of the channel configuration fields will be enabled
or disabled. Clicking on the ‘Synchronize clock’ button the present PC time will be sent to the device.
% Of hysteresis for the connection and disconnection of the channel configured in the relay
mode.
Shows the channel configuration.
61
PowerStudio / PowerStudio Scada
As it is only possible to display the
configuration of one channel at a time, click on one of the channels to display the corresponding
configuration.
Alphanumeric type information where a brief description of the
channel can be entered for easy identification.
Toroid type connected to the channel. There are three possible
selection options:
•
•
•
Channel disabled
Fullscale channel of 6A (30mA .. 6A)
Fullscale channel of 60A (300mA .. 60A)
Channel operating mode. Depending on the selected mode, some of the
configuration options of the channel may be disabled.
Channel output relay operating mode.
Channel triggering threshold, depending on the type of toroid
connected the available values will be:
Toroid 30 mA...6A
30 mA
1A
50 mA
1.5 A
100 mA
2A
200 mA
2.5 A
300 mA
3A
400 mA
3.5 A
500 mA
4A
600 mA
4.5 A
700 mA
5A
800 mA
5.5 A
900 mA
6A
Customised 1
1
Toroid 300 mA 60A ...
300 mA
10 A
500 mA
15 A
1A
20 A
2A
25 A
3A
30 A
4A
35 A
5A
40 A
6A
45 A
7A
50 A
8A
55 A
9A
60 A
Customised
Only if the value of the customised trigger threshold does not exceed 6A
Channel delay time, depending on the selected operating mode,
the possible values are:
Instantaneous:
Selective
0.4 s
0.8 s
3s
5s
60 s 1
Customised
1
Only if the channel works on the relay mode
0.1 s
1s
10 s
Delay time in the channel reset when working on the relay mode,
the possible values are:
0.1 s
0.4 s
62
0.8 s
PowerStudio / PowerStudio Scada
1s
10 s
3s
60 s
5s
Customised
Channel latch selection when working on the relay mode.
Triggering selection; low current (LOW) or overcurrent (HIGH) of the channel when
working in relay mode.
Number of attempts at reclosure. After this number the relay will be
latched.
Time between reclosures.
Operating mode in the time between reclosures.
63
PowerStudio / PowerStudio Scada
3.6.2 Displaying values
The CDR-8 device will display the following screen values:
Where:
1. Channel status:
•
•
•
Status ON.
Pre-alarm status.
Status OFF.
2. Relay status:
•
•
ON. Channel not latched
OFF. Channel latched
3. Channel operating mode:
•
•
Earth leakage Mode
Relay mode
64
PowerStudio / PowerStudio Scada
4. Additional information on the status of the channel:
•
•
•
Pre-alarm: Pre-alarm enabled
Reclosure: Channel disconnected timing in the process of reclosure.
Remote: Channel disconnected by external triggering, cannot be automatically
reconnected.
5. Additional channel information:
•
Reclosure enabled: Informs that the reclosures for the channel have been enabled.
Only if the channel operates in earth leakage mode
• Channel can be latched. Reports that the channel will remain latched when triggering
is produced, with manual or remote reset of said channel being necessary. Only if the
channel works in the relay mode.
6. Reset button. If the channel is not triggered, the button will remain disabled. Push the button
to restart the channel.
7. Off button. External disconnection of the channel. The button will remain disabled if the
channel has not been triggered.
8. Adjustment button. Enables the sensitivity programming and channel delay. Also shows
channel information.
9.
Instantaneous earth leakage current value of the channel. When the instantaneous earth
leakage current value exceeds the limits of the value bar, both above and below, this will be
indicated as shown in the figure (arrow below the value).
10. Trigger threshold value configured for the channel.
11. Pre-alarm value configured for the channel.
12. Earth leakage current value detected when the channel is triggered.
65
PowerStudio / PowerStudio Scada
3.7 CIRWATT
3.7.1 Download with protocol IEC 870-5-102
The CIRWATT device allows load curve and bill closures files to be downloaded through the
IEC 870-5-102 protocol. To enable downloading when new equipment is added the "Download files
(IEC 870-5-102)" option must be selected and the gateway, the measuring point address and
password configured.
From this screen it is possible to configure the time zone where the CIRWATT is located, by default
the time zone of the software will appear but this should be modified if a new device is found in a
different time zone.
3.7.2 Driver options
The following is the options menu:
The options "Variable Units" and "Variable Limits" are detailed in 3.1.2 Variable Units and
3.1.3 Variable limits.
66
PowerStudio / PowerStudio Scada
3.7.2.1 Driver Parameters
Enables the contracts to be displayed on screen. Using these selectors the contracts shown
on screen can be selected. In this case the driver displays contracts 1 and 3 and will hide contract 2.
These parameters will only affect the screen display of the CIRWATT device contracts but not the
internal configuration of the CIRWATT device.
The remaining parameters are explained in section 3.1.1 Driver Parameters.
3.7.2.2 Device parameters
This screen will allow a series of internal information and parameters of the device to be
displayed on screen.
Shows general information.
67
PowerStudio / PowerStudio Scada
•
Voltage transformation ratio:
programmed into the device.
•
Power transformation ratio: Shows the ratio between the current primary and secondary
programmed into the device.
shows the ratio between primary and secondary voltage
3.7.2.3 Contracted power
This screen allows the contracted loads for each contract and tariff of the CIRWATT to be
displayed. It will always be possible to enter contracted power manually, but if the device is IEC
enabled it can also be read directly from the equipment by clicking the
68
button;
PowerStudio / PowerStudio Scada
3.7.3 Displaying Contracts
The CIRWATT device shows the following screen when viewing a contract:
Where:
1. Corresponds to the information of a new contract rate.
2. Marks the active rate of the contract.
3. Marks the active quadrant.
Selecting the various tabs the desired contract can be
shown. As indicated in section 3.7.2.1 Driver Parameters, it is possible to select which contracts we
want to view, and the tab corresponding to the hidden contracts will not appear. For example if you
only want to view contracts 1 and 3 the tabs will be as follows:
69
PowerStudio / PowerStudio Scada
3.8 Converter RS232/485
The converter RS232/485 connects equipment which works with an RS-485 serial connection
to the port of the PC with an RS-232.
By adding or modifying this device, see 2.2.1.1, Adding a first-level device, the following
dialogue will appear
Where
•
Name: Alphanumeric field which uniquely identifies the device throughout the program. There
are no two devices in the configuration with the same name.
•
Description: Alphanumeric type data to enter a brief description of the device.
•
Port: Number of the serial port that the program uses for communication with the device.
•
Advanced setup: Permits the configuration of a series of additional parameters of the device.
See section 2.2.1.3 Advanced configuration of devices.
70
PowerStudio / PowerStudio Scada
3.9 Converter TCP2RS:
The TCP2RS connects equipments which works with serial communication (RS-232 / RS-485)
to an Ethernet network using the IP protocol
On adding or modifying this device, see 2.2.1.1. Adding a first-level device, the following
dialogue will appear
Where
•
Name: Alphanumeric field which uniquely identifies the device throughout the program. There
are no two devices in the configuration with the same name.
•
Description: Alphanumeric type data to enter a brief description of the device.
•
Converter address: Corresponds to the address through which the program can
communicate with the device. This parameter can be an IP address or a name. This direction
should not be confused with the MAC address.
•
Port: Corresponds to the converter communications port:
•
Configuration port: Corresponds to the communication port, through which the program can
configure the device. This port is 30718 by default.
For a TCP2RS device to be able to communicate through a router carry out the following
steps:
1-In the “Converter Address” field enter the IP address of the router.
2-In the “Port” field enter the communications port and redirect this port on the router to the
communications port of the device.
3 - Redirect the configuration port on the router to port 30718 of the converter.
N.b.: For information on re-addressing ports consult the router user manual.
•
Parameters: By clicking the button a dialogue will appear where a number of parameters of
the device can be configured.
71
PowerStudio / PowerStudio Scada
Where:
•
-
IP address: Corresponds to the IP address through which we can communicate with the
device.
-
Subnet Mask: Corresponds to the subnet mask used on the network where the device is
connected
-
Predetermined Gateway: Corresponds to the address of the gateway if the device is not
on the same network as the computer containing the program.
-
Obtain an IP address automatically (DHCP): This option will be enabled when we want the
device to automatically receive the IP address via a DHCP server.
-
Port: Corresponds to the communications port of the device.
Advanced communication: Permits the configuration of a series of additional parameters of
the device. See section 2.2.1.3 Advanced configuration of devices.
On adding or modifying the device, the software will try to detect it. If it is unable to detect it, if the
device is new or has not been allocated an IP address or has an allocated an IP different to that
entered in the ‘Converter Address"), it will ask if we want to assign a new IP address to the converter.
It will only be possible to assign an IP address to the device on the same network as the
computer running the program.
If the answer ‘yes’, the following dialogue box will appear, which will permit an IP address to
be assigned to the device.
72
PowerStudio / PowerStudio Scada
Where:
•
Physical address (MAC): Ethernet address that each device has, which is unique and
distinct on all network devices. The hardware addresses which each network interfaces
possess will be type 00-20-4A-61-05-19.
•
IP address: IP Address to be allocated to the device that has the physical address entered in
the previous field.
If it is possible to assign an IP address to the converter, the following dialogue box will appear:
To finish setting up the rest of the parameters for communication with the device.
73
PowerStudio / PowerStudio Scada
3.10 Converter TCP2RS ModbusTCP
The TCP2RS converter connects equipment which works with serial communication (RS-232 /
RS-485) to an Ethernet network using the IP protocol (ModbusTCP for connection–oriented
communications).
On adding or modifying this device, see 2.2.1.1 Adding a first-level device, the following
dialogue will appear
Where
•
Name: Alphanumeric field which uniquely identifies the device throughout the program. There
are no two devices in the configuration with the same name.
•
Description: Alphanumeric type data to enter a brief description of the device.
•
Converter address: Corresponds to the address through which the program can
communicate with the device. This parameter can be an IP address or a name. This direction
should not be confused with the MAC address.
•
Port: Corresponds to the communications port: By default the Modbus TCP protocol will
communicate through port 502.
•
Configuration port: Corresponds to the communication port, through which the program can
configure the device. This port is 30718 by default.
Unlike TCP2RS devices, the program does not configure any Modbus TCP device
parameters automatically, using the configuration port only to detect and verify that the
device configuration is correct. To configure or assign an IP address to Modbus TCP
devices, consult the device manual.
To communicate a TCP2RS device through a router carry out the following steps:
1–In the “Converter Address” field, enter the IP router address.
2–In the “Port” field enter the communications port and redirect this port on the router to the
communications device.
3 – Redirect the configuration port on the router to port 30718 of the converter.
N.B.: For information on re-addressing ports consult the user manual.
There are some second-tier devices that when connecting to a Modbus TCP device require
manual configuration, the communication is limited to the mere display, for Modbus TCP
these devices cannot be configured. Devices of this nature are:
- CVM – B / BD
74
PowerStudio / PowerStudio Scada
- CVMK
- CVMK – HAR
The special characteristics, as well as the pertinent configuration to carry out correct
Modbus TCP connection are specified in the corresponding sections of each device.
•
Parameters: By clicking the button a dialogue will appear where a number of parameters of
the device can be configured.
Where:
•
-
IP address: Corresponds to the IP address through which we can communicate with the
device.
-
Subnet Mask: Corresponds to the subnet mask used on the network where the device is
connected
-
Predetermined Gateway: Corresponds to the address of the gateway in the case that the
device is not on the same network as the computer containing the program.
-
Obtaining an IP address automatically (DHCP): This option will be enabled when we want
the device to automatically receive the IP address via a DHCP server.
Advanced communication: Permits the configuration of a series of additional parameters of
the device. See section 2.2.1.3 Advanced configuration of devices.
On adding or modifying the device, the software will try to detect it. If it is unable to detect it, if the
device is new or has not been allocated an IP address or has an allocated IP different to that entered
in the ‘Converter Address’, it will ask if you want to assign a new IP address to the converter.
It will only be possible to assign an IP address to the device if is on the same network as the
computer running the program.
If the answer is ‘yes’, the following dialogue box will appear, which will permit an IP address to
be assigned to the device.
75
PowerStudio / PowerStudio Scada
Where:
•
Physical address (MAC): Ethernet address that each device has, which is unique and
distinct on all network devices. The hardware addresses which network interfaces possess,
this will be type 00-20-4A-61-05-19.
•
IP address: IP Address to be allocated to the device that has the physical address introduced
in the previous field.
If it is possible to assign an IP address to the converter, the following dialogue box will appear:
to finish setting up the rest of the parameters for communication with the device.
76
PowerStudio / PowerStudio Scada
3.11 Converter TCP2RS QNA RS485
The converter TCP2RS QNA RS485 connects
QNA devices which work with serial
communications RS-485 on an Ethernet network using IP protocol.
Due to the peculiarities of the communication with QNA devices, only QNA-412 and QNA-413
second-level devices will be able to be connected to TCP2RS QNA RS485 first-level devices.
For more information on how to add and configure this device see section 3.9 TCP2RS
converter.
77
PowerStudio / PowerStudio Scada
3.12 General UDP Converter
The generic UDP converter connects devices that use serial communications (RS-232/RS-485)
to an Ethernet network using the IP protocol (UDP for datagram communications).
Where
•
Name: Alphanumeric field which uniquely identifies the device throughout the program. There
are no two devices in the configuration with the same name.
•
Description: Alphanumeric type data to enter a brief description of the device.
•
Converter address: Corresponds to the address through which the program can
communicate with the device. This parameter can be an IP address or a name. This direction
should not be confused with the MAC address.
•
Port: Corresponds to the communications port:
•
Advanced communication: Permits the configuration of a series of additional parameters on
the device. See 2.2.1.3 Advanced configuration of devices.
Due to the large number of converters that can be found on the market. On adding this
device the program the programme will not attempt to detect or verify that the configuration
is correct.
The configuration and the proper functioning of communications between the converter and
the program is the responsibility of user.
For more information on how to configure the converter consult the device manual.
78
PowerStudio / PowerStudio Scada
3.13 Generic TCP converter
The generic TCP converter connects devices that work with serial communication (RS-232/RS485) to an Ethernet network using the IP protocol (TCP for connection-oriented communications).
Due to the large number of converters that can be found on the market. On adding this
device the program will not attempt to detect or verify that the configuration is correct.
The configuration and the proper functioning of communications between the converter and
the program is the responsibility of the user.
For more information on how to configure the converter consult the device manual .
For more information on how to configure this converter see section 3.12 UDP Generic Converter.
79
PowerStudio / PowerStudio Scada
3.14 ModbusTCP generic Converter
The ModbusTCP generic converter connects devices that work with serial communication
(RS-232/RS-485) to an Ethernet network using the IP protocol (ModbusTCP for connection orientated
communications).
Due to the large number of converters that can be found on the market. On adding this
device the program will not attempt to detect or verify that the configuration is correct.
The configuration and the proper functioning of communications between the converter and
the program is the responsibility of user.
For more information on how to configure the converter consult the device manual.
For more information on how to configure this converter see section 3.12 Generic UDP Converter.
80
PowerStudio / PowerStudio Scada
3.15 CVM-144
3.15.1 Driver options
The following is the options menu:
The options "Variable Units" and "Variable Limits" are detailed in 3.1.2 Variable units and
3.1.3 Variable limits.
3.15.1.1 Device parameters
This screen allows the internal parameters of the device to be configured. On opening the
dialogue box, the software will read the configuration of the device. When complete, click on "Accept"
for the software to send information on changes to the device. In no case will the information be stored
on the hard drive of the PC.
81
PowerStudio / PowerStudio Scada
Depending on the device connected, some of the fields can be disabled.
Shows general information.
Allows the password to be enabled or disabled to lock the keyboard configuration of the
device.
•
Period: Is the integration period of the maximeter that can oscillate between 1 and 60
minutes.
•
Type of window: Type of window used to save the maximeter value, this can be fixed or
sliding.
•
Unit: The maximum demand can be calculated with active power III, apparent power III
current III or current by phase depending on the device.
•
Maximeter reset: Clicking on this button sends the device maximeter to zero.
This section shows the configuration of the relay outputs of the device and the option is given
to configure them with the required values.
•
Variable: The parameters associated with the relay are indicated in this field. The output is
programmed as an alarm, allowing any of the parameters measured by the CVM-144 to be
controlled. The units in which the maximum and minimum values of the alarm are expressed
are in brackets.
•
Max: In this box the maximum value to control is indicated.
•
Min: In this box the minimum value to control is indicated.
•
Delay: Delay in seconds of the alarm. The maximum value is 9999 seconds.
82
PowerStudio / PowerStudio Scada
•
Voltage transformation ratio: Primary and secondary voltage programming. The product
value between primary value and primary current has to be equal or less than 20,000,000.
The primary value, depending on the fullscale, must be between 1 and the corresponding
value of the following table:
Fullscale background:
110v
275v
300v
500V
•
Maximum value.
99.999
70.000
70.000
40.000
Current transformation ratio: This is the primary current value the device has. The value
can be between 1 and 10,000 A. The secondary current is 5A in the CVM-144.
This section shows the configuration of the analogue outputs of the device and the option is
given to configure them with the desired values.
•
Variable: Permits any parameter measured by the CVM-144 to be selected, except
parameters corresponding to energy.
•
Zero: Value of the parameter to which the zero of the scale is assigned.
•
Fullscale: Value of the parameter to which the maximum value of the scale is assigned.
•
Type: Output type, allows outputs 0 – 20 mA, 4 – 20 mA or 0 – 10 V to be chosen, depending
on the device.
•
Variable: This indicates the name associated with the analogue input.
•
Units: This indicates the type of units the variable represents.
•
Zero: Value of the parameter to which the zero of the scale is assigned.
•
Full scale: Value of the parameter to which the maximum value of the scale is assigned.
•
Type Input type, allows input 0 – 20 mA, 4 – 20 mA or 0 – 10V V to be chosen, depending on
the device.
•
Decimal point: Position of the decimal point. Only if the device allows us to display the
analogue inputs with real measurement values.
83
PowerStudio / PowerStudio Scada
Using this selector the type of distortion that the device will calculate can be configured.
Using this, the leakage current of the device can be configured. Only for those devices that
can measure leakage current.
On clicking the button the energy counters on the device will return to zero.
Configuration of the transformation ratio of the neutral current. Only for those devices that can
measure leakage current.
84
PowerStudio / PowerStudio Scada
3.16 CVM-96
3.16.1 Driver options
The following is the options menu:
The options "Variable Units" and "Variable Limits" are detailed in 3.1.2 Variable units and
3.1.3 Variable limits.
3.16.1.1 Device parameters
This screen allows the internal parameters of the device to be configured. On opening the
dialogue box, the software will read the configuration of the device. When complete, click on "Accept"
for the software to send information on changes to the device. In no case will the information be stored
on the hard drive of the PC.
85
PowerStudio / PowerStudio Scada
Shows general information.
Enables the password to be enabled or deactivated to block the configuration of the device by
the keyboard.
Depending on the version connected, programming of the voltage transformation ratio can be
disabled.
•
Voltage transformation ratio: Primary and secondary voltage programming. The product
between the primary value and primary current has to be equal or less than 20,000,000. The
value of the primary, depending on the full scale of the equipment, must be between 1 and the
value of the following table:
Fullscale background:
110v
275v
300v
500V
Maximum value.
99.999
70.000
70.000
40.000
•
Current transformation ratio: This is the primary current value the device has. The value
can be between 1 and 10,000 A. The secondary current is 5A on the CVM-96.
•
Period: Is the integration period of the maximeter that can oscillate between 1 and 60
minutes.
•
Unit: The maximum demand can be calculated with active power III, apparent power III,
current III or phase current depending on the device.
•
Maximeter reset: When the button is enabled, the device maximeter goes to zero.
86
PowerStudio / PowerStudio Scada
Using this selector the type of distortion can be configured that the device will calculate.
On clicking the button the energy counters on the device will return to zero.
This section shows the configuration of the relay outputs of the device and the option is given
to configure them with the desired values.
•
Variable: The parameters associated with the relay are indicated in this field. The output is
programmed as an alarm, and can control any of the parameters measured by the CVM-96.
The brackets show the units used to express the maximum and minimum values of the alarm.
•
Max: In this box the maximum value to control is indicated.
•
Min: In this box the minimum value to control is indicated.
•
Delay: Alarm delay in seconds. The maximum value is 9999 seconds.
87
PowerStudio / PowerStudio Scada
3.17 CVM-B/BD
3.17.1 Connection with Modbus TCP
The CVM-B/BD devices can connect on MODBUSTCP connections with some limitations.
PowerStudio can read the values measured by the device but cannot read the configuration. Although
it is not possible to read the configuration, for the correct visualisation of values, PowerStudio needs to
know certain information about the device. This information should be entered by the user, and it will
be the responsibility of the user to ensure that the data corresponds to the device connected. If this
data introduced by the user were incorrect it could give communication errors making it impossible for
PowerStudio to show the values measured by the device.
On adding a device on an MODBUSTCP connection, see section 3.10 TCP2RS Modbus TCP
Converter, PowerStudio will display the following warning:
Then a dialogue box will appear with the information PowerStudio needs to communicate with
the device.
The user must select the correct information corresponding to the device connected.
Device model. Using the model, PowerStudio can ascertain which variables are measured by
the device thus avoiding variables not possessed by the device being asked for.
Measurement scale of the variables. This will be used by PowerStudio for the correct
visualisation of the values shown on screen
Variable used to calculate the maximum demand.
88
PowerStudio / PowerStudio Scada
3.17.2 Driver options
The following is the options menu:
The options "Variable Units" and "Variable Limits" are detailed in sections 3.1.2 Variable units
and 3.1.3 Variable limits.
3.17.2.1 Device parameters
It is not possible to configure the device when it communicated via the MODBUSTCP
connection.
This screen allows the internal parameters of the device to be configured. On opening the
dialogue box, the software will read the configuration of the device. When complete, click on "Accept"
for the software to send information on changes to the device. In no case will the information be stored
on the hard drive of the PC.
89
PowerStudio / PowerStudio Scada
Shows general information.
•
Voltage transformation ratio: Primary and secondary voltage programming. The primary
voltage value should be between 1 and 500000 V and the secondary between 1 and 999. In
addition the primary divided by the secondary must be less than 9090.
•
Primary of the current transformer: This is the primary current value the device has. It can
value between 1 and 10000 A. The secondary current is 5A in the CVM-K.
•
Period: Is the integration period of the maximeter that can oscillate between 1 and 60
minutes.
•
Type of window: Type of window used to save the maximeter value, it can be fixed or sliding.
•
Unit The maximum demand can be calculated with active power III, apparent power III, or
current III.
•
Maximeter reset: When the button is enabled, the device maximeter goes to zero.
This part of the configuration corresponds to device energies. Depending on the type of
device some or all of the fields can be deactivated. If the selector , is checked, on sending the
configuration the energy counter will be loaded with the values entered into the corresponding boxes.
90
PowerStudio / PowerStudio Scada
Depending on the device connected, if this has relay outputs, they can be configured with the
values desired.
•
Variable: Parameter associated to the output relay. The output is programmed as an alarm,
allowing control on any of the parameters measured by the CVM-B/BD. The units in which the
maximum and minimum values of the alarm are expressed are indicated in brackets.
•
Max: In this box the maximum value to control is indicated.
•
Min: In this box the minimum value to control is indicated.
•
Delay: Alarm delay in seconds. The maximum value is 9999 seconds.
Depending on the device connected, if it has analogue outputs, the desired values can be
configured.
•
Variable: Parameter associated to the analogue output. Any parameter measured by the
CVM-B/BD can be selected as an analogue output.
•
Zero: Value of the parameter to which the zero of the scale is assigned.
•
Fullscale: Value of the parameter to which maximum value of the scale is assigned.
•
Type of input, permits either 0-20 mA or 4-20 mA to be chosen.
91
PowerStudio / PowerStudio Scada
3.18 CVM-BC
3.18.1 Driver options
The following is the options menu:
The options "Variable Units" and "Variable Limits" are detailed in sections 3.1.2 Variable units
and 3.1.3 Variable limits.
3.18.1.1 Device parameters
This screen allows the internal parameters of the device to be configured. On opening the
dialogue box, the software will read the configuration of the device. When complete, click on "Accept"
for the software to send information on changes to the device. In no case will the information be stored
on the hard drive of the PC.
92
PowerStudio / PowerStudio Scada
Shows general information.
Enables the password to be enabled or deactivated to block the configuration of the device by
means of the keyboard.
Depending on the version connected, programming of the voltage transformation ratio can be
disabled.
•
Voltage transformation ratio: Primary and secondary voltage programming. The product
value between primary value and primary current has to be equal or less than 20,000,000.
The primary value, depending on fullscale, must be between 1 and the value of the following
table:
Full-scale :
110v
275v
300v
500V
Maximum value.
99.999
70.000
70.000
40.000
•
Current transformation ratio: This is the primary current value the device possesses. The
value can be between 1 and 10,000 A. The secondary current is 5A in the CVM-BC.
•
Period: Is the integration period of the maximeter that can oscillate between 1 and 60
minutes.
•
Type of window: Type of window used to store the maximeter value, it can be fixed or
sliding.
•
Unit The maximum demand can be calculated with active power III, apparent power III,
current III or phase current depending on the device.
93
PowerStudio / PowerStudio Scada
•
Maximeter reset: When the button is clicked, the device maximeter goes to zero.
Using this selector the type of distortion that the device will calculate can be configured.
On clicking the button the energy counters on the device will return to zero.
This section shows the configuration of the relay outputs of the device, configuration is
possible with the required values.
•
Variable: The parameters associated with the relay are indicated in this field. The output is
programmed as an alarm and any of the parameters measured by the CVM-BC can be
controlled. The units in which the maximum and minimum values of the alarm are expressed
are indicated in brackets.
•
Max: This box indicates the maximum value to control.
•
Min: This box indicates the minimum value to control.
•
Delay: Alarm delay in seconds. The maximum value is 9999 seconds.
94
PowerStudio / PowerStudio Scada
3.19 CVM-K
3.19.1 Connection with Modbus TCP
The CVM-K devices can connect on MODBUSTCP connections with some limitations.
PowerStudio can read the values measured by the device but cannot read the configuration. Although
it is not possible to read the configuration, for the correct visualisation of values, PowerStudio needs to
ascertain certain information about the device. This information should be entered by the user, and it
will be the responsibility of the user to ensure that the data corresponds to the device connected. If
this data introduced by the user is incorrect this can give communication errors making it impossible
for PowerStudio to show the values measured by the device.
On adding a device to the MODBUSTCP connection, see section 3.10 , PowerStudio will
show the following warning message.
Then a dialogue box will appear with the information the PowerStudio needs to communicate with the
device.
The user must select the correct information corresponding to the device connected.
Device model. Using the model, PowerStudio can ascertain which variables are measured by
the device thus avoiding variables not possessed by the device being asked for.
Expansion card.
95
PowerStudio / PowerStudio Scada
Variable used to calculate the maximum demand.
Measurement scale of the variables. This will be used by PowerStudio for the correct
visualisation of the values shown on screen
3.19.2 Driver options
The following is the options menu:
The options "Variable Units" and "Variable Limits" are detailed in sections 3.1.2 Variable units
and 3.1.3 Variable limits.
3.19.2.1 Device parameters
It is not possible to configure the device when it communicates via the MODBUSTCP
connection.
This screen allows the internal parameters of the device to be configured. On opening the
dialogue box, the software will read the configuration of the device. When complete, click on "Accept"
for the software to send information on changes to the device. In no case will the information be stored
on the hard drive of the PC.
96
PowerStudio / PowerStudio Scada
Shows general information.
•
Voltage transformation ratio: Primary and secondary voltage programming. The value of the
primary voltage should be between 1 and 500000 V and the secondary between 1 and 999 V.
In addition the primary divided by the secondary must be less than 9090.
•
Primary of the current transformer: This is the primary current value the device has. The
value can be between 1 and 10,000 A. The secondary current is 5A in the CVM-K.
97
PowerStudio / PowerStudio Scada
•
Period: Is the integration period of the maximeter that can oscillate between 1 and 60
minutes.
•
Type of window: Type of window used to save the maximeter value, it can be fixed or sliding.
•
Unit The maximum demand can be calculated with active power III, apparent power III or
current III.
•
Maximeter reset: When the button is enabled, the device maximeter goes to zero.
This part of the configuration corresponds to device energy. Depending on the type of device
some or all of the fields can be deactivated. If the selector , is checked, on sending the configuration
the energy counter will be loaded with the values entered into the corresponding boxes.
Depending on the device connected, if this has relay outputs, they can be configured with the
values desired.
•
Variable: Parameter associated to the output relay. The output is programmed as an alarm,
controlling any of the parameters measured by the CVM-K. The units in which the maximum
and minimum values of the alarm are expressed are indicated in brackets.
•
Max: The maximum value to control is indicated in this box.
•
Min: The minimum value to control is indicated in this box.
•
Delay: Alarm delay in seconds. The maximum value is 9999 seconds.
Depending on the device connected, if this has an analogue output, the desired values can be
configured.
•
Variable: Parameter associated to the analogue output. Any parameter measured by the
CVM-K can be selected as an analogue output.
•
Zero: Value of the parameter to which the zero of the scale is assigned.
•
Full Scale: Value of the parameter to which the maximum value of the scale is assigned.
•
Type: Type of input, permits either 0-20 mA or 4-20 mA to be chosen.
98
PowerStudio / PowerStudio Scada
3.20 CVM-K2
3.20.1 Driver options
The following is the options menu:
The option “Driver Parameter” has been detailed in section 3.1.1 Driver Parameters. When the
device has an ‘SD Memory’ expansion card inserted, the data capture period will be configured in the
option “Device parameters”.
The options "Variable Units" and "Variable Limits" are detailed in sections 3.1.2 Variable units
and 3.1.3 Variable limits.
The “Expansion Card” options will depend on the expansion card inserted in the device.
3.20.1.1 Device parameters
This screen allows the internal parameters of the device to be configured. On opening the
dialogue box, the software will read the configuration of the device. When complete, click on "Accept"
for the software to send information on changes to the device. In no case will the information be stored
on the hard drive of the PC.
99
PowerStudio / PowerStudio Scada
Shows general information.
•
Measurement point: Short description of the device for display and better identification on
the device screen.
•
Capture period: Data capture period, in minutes, for the generation of the log values when
the equipment has an expansion card inserted in the memory.
•
Initialize energy counters: Clicking on this button will reset the counters of the energy device
•
Synchronize clock: Clicking this button will synchronise the date and the time of the device
with the date and time of the PC.
100
PowerStudio / PowerStudio Scada
Programming of the voltage transformation ratios, current and neutral current of the device.
•
Period: Is the integration period of the maximeter that can oscillate between 1 and 60
minutes.
•
Type of window: Type of window used to save the maximeter value, it can be fixed or sliding.
•
Maximeter reset: When the button is enabled, the device maximeter goes to zero.
Configuration of the nominal working frequency of the device.
Using this selector the type of distortion the device will calculate can be configured.
Configuration of the units of the temperature value measured by the device.
Tariff configuration of the device.
o
Type of synchronism: Indicates to the device if the synchronism of tariffs is made by
the device itself (internal clock), by the configured calendar, or the synchronism is
given by an external signal (Digital Input). The digital input type will only be allowed
when the device has digital input expansion cards.
o
First synchronism input: Only if the kind of synchronism is by means of digital
inputs. The digital inputs corresponding to tariff 1 must be chosen.
o
Number of tariffs: The number of tariffs to be used in the device must be chosen.
101
PowerStudio / PowerStudio Scada
o
Tariff change alarm date: Only if the type of synchronism is by internal clock. A date
for the device will be configured so that the device warns when a change must be
made in the tariff calendar.
o
Calendar: Only if the type of synchronism is by internal clock. Allows the tariff
calendar by which the device will be governed to be configured.
In this dialogue the tariff calendar configured on the device can be seen. Each
day of the calendar will be marked with the colour of the type of day assigned.
Due to the fact that the device can be configured only 365 days in a year, the
days will be shown as from the current day, for this reason the image begins on June
3, 2008 and ends on June 2, 2009. That is, if October 1st has been configured as
type 1 (red), while no changes are made in the configuration of the calendar, October
1st of each year will be type 1.
Selecting the days can be carried out in the following ways:
• Clicking the left mouse button on one day, marking only the day
selected.
• Clicking the left mouse button on the start day, and then holding
down the SHIFT key, click the left mouse button on the end day,
hence choosing every day between the start day and the end day.
• Using the fast selection option.
102
PowerStudio / PowerStudio Scada
Tariff types of day. Allows the type of day to be assigned to the
different tariff calendar days to be selected. Clicking on the timetable with the left
button of the mouse on a day will assign it the type of day selected.
Allows different types of day to be configured. Clicking on the
button the following dialogue will appear.
Where the different types of day divided into 1 hour sections are displayed on
the left side of the dialogue, and on the right side the tariff to be implemented on that
day can be selected.
To select the tariffs on the types of day, the tariff we want to assign must be
selected and thereafter proceed in the following ways:
•
•
Clicking the left mouse button on one of the type of day sections,
marking only the section selected.
Clicking the left mouse button on the initial section and then holding
down the SHIFT key, Click the left mouse button on the final section,
thus selecting all sections between initial and final. Bear in mind that
103
PowerStudio / PowerStudio Scada
both the initial section and the final section must correspond to the
same type of day.
with this option, selections will be made automatically. The
following dialogue will appear.
In this case every Wednesday and Friday of October will be marked as day
type 3.
Allows the calendar configuration and types of day to be loaded
from a file previously saved on a disk. This option is useful when it is necessary to
configure the same timetable on multiple devices.
The calendar configuration and the types of day can be stored
on a disk, and can be loaded on another device.
104
PowerStudio / PowerStudio Scada
3.20.1.2 Expansion Cards
Depending on the number and type of expansion cards entered into the device the options to
configure them may or may not appear.
3.20.1.2.1 Digital input / output
Depending on the card model, the number of inputs and outputs may vary.
By way of
; the configuration between the input configuration and the output
configuration of the card may be changed. The previous image shows the configuration of the digital
inputs.
Each of the digital inputs may be configured as a digital input and therefore the status of the
input can be monitored (open or closed) or used as a counter, counting the number of pulses that
occur in the digital input.
Configuring the input as digital:
Type: The type should be selected as digital.
Name: Alphanumeric data type for the identification of the digital entry on the
device display.
Otherwise it will be configured as a counter
Type: Must be selected as a counter type.
Name: Alphanumeric type data to identity the counter on the device display.
Unit: Alphanumeric type data to identify that this counter is a counter.
Factor: Multiplicative value of each pulse detected at the input.
The configuration of the digital outputs is as follows:
105
PowerStudio / PowerStudio Scada
Where for each of the outputs the output equation will be defined. This output equation
corresponds to a conditional expression to decide when the device should act on the digital output
depending on the alarms configured.
Configuration of alarms for use in the output equation.
Clicking on the button the following dialogue will appear.
Where the 16 device alarms can be configured:
Variable: In this field any of the parameters associated with the alarm can be
selected, and any of the parameters measured by the device. The units in
which the maximum and minimum values of the alarm are expressed are
indicated in brackets.
Max: The maximum value to control is configured. The range allowed
depends on the selected variable.
Min: The minimum value to control is configured. The range allowed depends
on the selected variable.
Delay: Delay in seconds in activating the alarm.
106
PowerStudio / PowerStudio Scada
Delay off: Delay in seconds in deactivating the alarm.
Allows output equations to be configured. Clicking on the button the following dialogue
will appear.
Where the alarm and the operation to be carried can be selected alternately
(AND or OR). To obtain more information on the operation of the digital output
equations consult the device manual.
107
PowerStudio / PowerStudio Scada
3.20.1.2.2 Analogue inputs/ outputs
Depending on the card model, the number of inputs and outputs may vary.
Using
; the configuration between the input configuration and the output
configuration of the card may be changed. The previous image shows the configuration of the
analogue inputs.
For each of the analogue inputs the following can be configured:
•
Type: Type of input, enables the different types of input signal accepted by the device to be
selected.
•
Name: A brief description of the analogue input for its identification on the screen of the
device.
•
Unit: A brief description of the measuring units of the analogue input so it can be viewed on
the screen of the device.
•
Zero: Parameter value that zero on the scale is assigned to.
•
Fullscale: Value of the parameter to which the maximum value of the scale is assigned.
•
Decimals: Number of decimals of the value measured by the analogue input.
The configuration of the analogue outputs can be seen in the following picture:
108
PowerStudio / PowerStudio Scada
Where for each of the analogue outputs the following can be configured:
•
Variable: Permits any parameter that measures the devices that could be used for analogue
outputs to be selected
•
Type: Allows us to select from among the different types of output that the device can
generate.
•
Zero: Value of the parameter to which the zero of the scale is assigned.
•
Fullscale: Value of the parameter to which the maximum value of the scale is assigned.
109
PowerStudio / PowerStudio Scada
3.20.1.2.3 4 digital outputs / 4 analogue outputs
; changes can be made between the digital outputs and the
Using
configuration of the analogue outputs of the card. In the previous image the configuration of the digital
outputs can be seen
For more information on configuring the digital outputs consult the section 3.20.1.2.1 Digital
Inputs /Outputs.
The configuration of the analogue outputs can be seen in the following picture:
Where for each of the analogue outputs the following can be configured:
•
Variable: Permits any parameter that measures the devices that could be used for analogue
outputs to be selected.
•
Value -5 mA: Value of the parameter which is assigned to the -5 mA output.
•
Value +5 mA: Value of the parameter which is assigned to the 5 mA output.
110
PowerStudio / PowerStudio Scada
3.20.1.2.4 SD Memory
If the device has an SD Memory expansion memory, but the SD memory is not inserted, the
data measured is not stored on the memory or by the software.
On the upper part of the dialogue information is shown about the SD Memory inserted into the
device. It shows information such as the status, with which it is possible to know if the card works
correctly or if there are any problems as for example if it is protected from overwriting, the size of the
card and the remaining free space. It is also possible by Clicking the
button;
to format the SD card. It should be borne in mind that if the card is formatted it will lose all data not
downloaded by means of the software.
The number of variables that the device saves in the log is shown on the lower part. Clicking
the
;the variables that the device will save can be selected.
111
PowerStudio / PowerStudio Scada
3.21 CVM-K HAR
3.21.1 Connection with Modbus TCP
The CVM-K HAR devices can connect on MODBUSTCP connections with some limitations.
PowerStudio can read the values measured by the device but cannot read the configuration.
By adding a device on a MODBUSTCP connection, see section 3.10 TCP2RS Modbus TCP
Converter, PowerStudio displays the following warning:
3.21.2 Driver options
The following is the options menu:
The options "Variable Units" and "Variable Limits" are detailed in sections 3.1.2 Variable units
and 3.1.3 Variable limits.
112
PowerStudio / PowerStudio Scada
3.21.2.1 Device parameters
It is not possible to configure the device when it communicates via the MODBUSTCP
connection.
This screen allows the internal parameters of the device to be configured. On opening the
dialogue box, the software will read the configuration of the device. When complete, click on "Accept"
for the software to send information on changes to the device. In no case will the information be stored
on the hard drive of the PC.
Shows general information.
•
Voltage transformation ratio: Primary and secondary voltage programming. The value of the
voltage primary should be between 1 and 999999 V and the secondary between 1 and 999 V.
The product between the primary value and the primary current must be the same or less than
20.000.000.
•
Primary of the current transformer: This is the primary current value of the device. It can be
between 1 and 10000 A. The secondary current is 5A on the CVM-K HAR.
Using this selector, the type of distortion that the device will calculate can be configured.
113
PowerStudio / PowerStudio Scada
Should an additional module with two relay outputs be available, it can be configured as an
alarm mode with the THD or D variables on voltage and on current.
Maximum value. When the value read by the CVM-K HAR device exceeds the
programmed value, the device will close the contact corresponding to the programmed alarm. This
maximum programmed value will be a % of THD or D.
Delay, both on the connection and disconnection of the alarm relay. This value will be
expressed in seconds
114
PowerStudio / PowerStudio Scada
3.22 MINI CVM and CVM NRG-96
3.22.1 Driver options
The following is the options menu:
The options "Variable Units" and "Variable Limits" are detailed in sections 3.1.2 Variable units
and 3.1.3 Variable limits.
3.22.1.1 Device parameters
This screen allows the internal parameters of the device to be configured. On opening the
dialogue box, the software will read the configuration of the device. When complete, click on "Accept"
for the software to send information on changes to the device. In no case will the information be stored
on the hard drive of the PC.
115
PowerStudio / PowerStudio Scada
Shows general information.
Allows us to enable or disable the password to block the configuration using the device
keyboard.
Depending on the version connected, programming of the voltage transformation ratio can be
disabled.
•
Voltage transformation ratio: Primary and secondary voltage programming. The product
between the primary value and primary current has to be equal or less than 20,000,000. The
value of the primary, depending on the fullscale of the equipment, must be between 1 and the
corresponding value from the following table:
Full-scale :
110V
250V
275V
300V
500V
Maximum value.
99,999
70,000
70,000
70,000
40,000
•
Current transformation ratio: This is the primary current value the device has. The value
can be between 1 and 10,000 A. The secondary current is 5A on the CVM-96.
•
Period: Is the integration period of the maximeter that can oscillate between 1 and 60
minutes.
•
Type of window: Type of window used to save the maximeter value, it can be fixed or sliding.
•
Unit: The maximum demand can be calculated with active power III, apparent power III,
current III or phase current depending on the device.
116
PowerStudio / PowerStudio Scada
•
Maximeter reset: When the button is enabled, the device maximeter goes to zero.
Selecting the type of voltage calculated.
Configuration of the "backlight" disconnection. The value should be between 0 and 99
seconds.
Using this selector, the type of distortion that the device will calculate can be configured.
On clicking the button the energy counters on the device will return to zero.
This section shows the configuration of the device relay output and the option to configure it
with the values desired is given. For CVM-MINI devices the two relay outputs of these devices can be
configured.
•
Variable: The parameters associated with the relay are indicated in this field. The output is
programmed as an alarm or energy pulse with any of the parameters measured by the device
being able to be controlled. The units in which the maximum and minimum values of the alarm
are expressed are indicated in brackets.
•
Max: In this box the maximum value to control is indicated. If an energy variable is selected,
the value of each pulse will be indicated. This will be displayed as follows:
•
Min: In this box the minimum value to control is indicated. If you select an energy variable,
this field will remain disabled.
•
Delay: Alarm delay in seconds. The maximum value is 9999 seconds. This field will remain
deactivated if an energy variable is chosen
117
PowerStudio / PowerStudio Scada
3.23 CVM-R8
Communication will not be possible with the CVM-R8 through a MODBUSTCP connection.
3.23.1 Driver options
The following is the options menu:
3.23.1.1 Device parameters
In the case of CVM-R8 it will not be possible to configure any parameters of the device; it will
only be possible to show information about it.
118
PowerStudio / PowerStudio Scada
3.23.1.2 Analogue inputs and outputs
From this dialogue the analogue inputs on the CVM-R8 devices with analogue inputs and/or
outputs can be configured.
•
Description: Alphanumeric type information which enables a brief description to be entered
for better identification.
•
Unit: Alphanumeric type data which permits a brief description of the units to be entered.
•
Zero: Value of the parameter to which the zero of the scale is assigned.
•
Fullscale: Value of the parameter to which the maximum value of the scale is assigned.
•
Type: Type of entry, allows between 0-20 mA, 4-20 mA or 0 -? to be chosen V
3.23.1.3 Variable limits
Only for CVM-R8 devices with analogue inputs.
This option has been detailed in section 3.1.3 Variable limits.
119
PowerStudio / PowerStudio Scada
3.24 CVM-SP
3.24.1 Driver options
The following is the options menu:
3.24.1.1 Device parameters
This screen allows the internal parameters of the device to be configured. On opening the
dialogue box, the software will read the configuration of the device. When complete, click on "Accept"
for the software to send information on changes to the device. In no case will the information be stored
on the hard drive of the PC.
Shows general information.
120
PowerStudio / PowerStudio Scada
Enables the password to be enabled or deactivated to block the configuration of the device by
means of the keyboard.
•
Voltage transformation ratio: Primary and secondary voltage programming. The product
value between primary value and primary current has to be equal or less than 20,000,000.
The primary value, depending on full scale, must be between 1 and the value of the following
table:
Full-scale :
110v
275v
300v
500V
Maximum value.
99.999
70.000
70.000
40.000
•
Current transformation ratio: This is the primary current value the device possesses. The
value can be between 1 and 10,000 A. The secondary current is 5A on the CVM-144.
•
Period: Is the integration period of the maximeter that can oscillate between 1 and 60
minutes.
•
Unit: The maximum demand can be calculated with active power III, apparent power III,
current III or phase current depending on the device.
•
Maximeter reset: When the button is enabled, the device maximeter goes to zero.
Using this selector the type of distortion that the device will calculate can be configured.
121
PowerStudio / PowerStudio Scada
On clicking the button the energy counters on the device will return to zero.
122
PowerStudio / PowerStudio Scada
3.25 DH-96
3.25.1 Driver options
The following is the options menu:
The options "Variable Units" and "Variable Limits" are detailed in sections 3.1.2 Variable units
and 3.1.3 Variable limits. The option ‘Device inputs’ only appears on DH-96 CT devices.
3.25.1.1 Device parameters
On DH-96 devices it will not be possible to modify internal parameters, and it will be
necessary to change them manually on the device keyboard. For more information on how to
modify the parameters see the manual that comes with the device.
Shows general information.
123
PowerStudio / PowerStudio Scada
Alphanumeric type data which permits a brief description of the DH-96
units of measurement to be entered. These units will be displayed in the data display, in no case will
they be sent to the device. This parameter will not appear on DH-96 CT units, on the DH-96 CT
equipment a brief description of the units can be entered on the input screen, 3.25.1.2 Inputs.
Only for DH-96 AC, DH-96 CT, DH DC-96, DH-96 WG units. The
number of decimal places used when displaying the variable measured on the equipment can be
configured. This parameter will be used solely as information on your computer, and at no time will it
be sent or read by the equipment.
Only for DH-96 CPM units. The number of decimals with which the
voltage on the equipment is displayed can be configured. This parameter will be used solely as
information on your computer, and at no time will it be sent or read by the equipment.
Only for DH-96 CPM units. The number of decimals with which the
current on the equipment is displayed can be configured. This parameter will be used solely as
information on your computer, and at no time will it be sent or read by the equipment.
124
PowerStudio / PowerStudio Scada
3.25.1.2 Inputs
Only for DH-96 CT devices
This screen lets the flow and counter variable that can be used on the DH-96 CT equipment
be configured.
•
•
Counter Variable
o
Description: Alphanumeric type data which allows a brief description of the input for
better identification.
o
Unit: Alphanumeric type data which enables a brief description of the input units to be
entered.
o
Factor: Multiplier factor to be applied to the value read from the device.
Flow variable: The input will be treated as a flow counter. The value of this variable is
calculated from the counter variable value read from the device.
o
Enabling flow variable: Using this option it is possible to enable or disable the use of
the software of the device input as if it were a flow counter. If this is disabled it will not
be displayed nor will it be possible to use this variable on the software.
o
Description: Alphanumeric type data which allows a brief description of the input for
better identification.
o
Unit: Alphanumeric type data which permits a brief description of the units to be
entered.
o
Factor: multiplier to be applied to the value read from the device.
o
Time: Parameter to calculate the flow value.
o
Calculation window: Window time, in seconds, that the software will use to calculate
an estimate of the flow, taking into account the value of the device counter.
125
PowerStudio / PowerStudio Scada
3.26 EDMk
3.26.1 Driver options
The following is the options menu:
The options "Variable Units" and "Variable Limits" are detailed in sections 3.1.2 Variable units
and 3.1.3 Variable limits
3.26.1.1 Device parameters
This screen allows the internal parameters of the device to be configured. On opening the
dialogue box, the software will read the configuration of the device. When complete, click on "Accept"
for the software to send information on changes to the device. In no case will the information be stored
on the hard drive of the PC.
Shows general information.
126
PowerStudio / PowerStudio Scada
Configuration of the transformation ratio of the device.
•
Voltage transformation ratio: Primary and secondary voltage programming. The product
between the primary value and the primary current must be the same as or less than
20.000.000. The primary value must be between 1 and 999.999 V while the secondary can be
between 1 and 999 V.
•
Current transformation ratio: This is the primary and secondary current value the device
has. The primary can value between 1 and 9999 A and the secondary between 1 or 5 A.
Visualisation on the screen of the device
•
•
Omit reactive measurement: The reactive measurements are not shown on the device
screen, although they will continue to be visualised on the software display screens.
Omit partial counters: Partial counter measurements are not shown on the screen of the
device nor on the display screens of the software.
Configuration of the "backlight" disconnection. The value should oscillate between 0
and 10 seconds.
On clicking the button all the partial counters of the device will be started.
Configuration of the number of quadrants. With only 2 quadrants the
consumed energy counters will be taken into consideration and with 4 the consumed and generated
energy counters.
Configuration of the output relay of the active energy. The number of Wh
equivalent to an output impulse and the variable that will be measured to give this pulse. If the pulse
value is 0, the output will be treated like a standard digital output, enabling it value to be forced from 0
to 1.
Configuration of the output relay of the active energy. The number of VArh
equivalent to an output pulse and the variable that will be a measured to give the pulse can be
configured. If the pulse value is 0, the output will be treated like a standard digital output enabling it
value to be forced from 0 to 1.
127
PowerStudio / PowerStudio Scada
3.27 Generic Modbus
Due of the variety of devices that communicate with Modbus protocol currently on the market, a
generic device to enable quick and easy communication with these devices has been created.
Once the variables to be read have been configured, the device will behave in a manner
similar to other devices with which the program communicates.
3.27.1 Driver options
The following is the options menu:
The options "Variable Units" and "Variable Limits" are detailed in sections 3.1.2 Variable units
and 3.1.3 Variable limits.
128
PowerStudio / PowerStudio Scada
3.27.1.1 Device parameters
This screen is used to configure the variables that should be requested from the device. The variables
are in two groups, numeric variables (voltages, currents, counters, etc.) and binary variables (typically
digital inputs and outputs).
General information on the
device.
Configuration of the numeric
variables of the device. See section 3.27.1.1.1 Numeric variables
Configuration of the binary
variables of the device. See section 3.27.1.1.2 Digital variables.
129
PowerStudio / PowerStudio Scada
Allows the configuration of numeric and binary variables of a file previously
saved on the disk to be loaded. This option is useful when the same variables have to be configured
on several devices
Allows the configuration of numerical and binary variables to be saved on a
disk and then loaded onto another Generic Modbus TCP device.
Allows advanced configuration options on the device to be shown or hidden.
Brings together variables in groups: These parameters permit the
maximum size of the frames to be configured in communications for those
devices which do not permit communication with frames of a maximum size
greater than that of the Standard modbus. To carry out the minimum number
of possible requests and thus penalise as little as possible the
communication, the programme will try to group together the variables
configured in groups of variables. This parameter can indicate the maximum
grouping permitted
Data in little-endian: By default the data sent by devices is considered to
come in big-endian. If the device returns it in little-endian this option should
be enabled.
3.27.1.1.1 Numeric variables
Click the “Add" or “Modify” button and the dialogue will appear to configure the numeric
variable.
Where
130
PowerStudio / PowerStudio Scada
•
Identifier: Enables the identification of each one of the numeric variables to be used in
expressions and conditions, see section 14.2 Expressions and conditions.
•
Name: Name of the numeric variable used to identify it better.
•
Description: Short description of the variable.
•
Address: Modbus map address of the device where the variable can be found.
•
Records: Number of registers which occupy the variable on the Modbus map.
•
Save: Indicates if the device value read should be saved on the value log or not.
•
Type: Selects the type of variable; reading, writing or both. If the variable is write or read/write
the value can be forced on the device.
•
Format: Indicates the format that the device returns the variable value. The value can be
expressed in the IEE754 format, with a sign and the number of decimal points can be
indicated.
•
Grouping criteria: Enables the grouping criteria of the values of the variable to be selected in
graphs, tables, reports and the value to be saved in the values register. For example, if in the
period between saving information we have 3 values (10, 12 and 7) these will be saved in the
log register.
Maximum value. The maximum value of the 3 (12) will be saved
Minimum value: The minimum value of the 3 (7) will be saved.
Average value: The average value of the 3((10 + 12 + 7) / 3 = 9.66) will be
saved.
Last value: The last value will be saved(7).
Sum of the values: The last value will be saved(7).
In the case of clusters of values in graphs, tables and reports the same criteria will be followed
except when it is the summation of values where the sum of 3 values is shown (10 + 12 + 7 =
29).
•
Units: Units in which the value is expressed. You can select one of the predefined units or
define a new user unit.
•
Use: Shows where the variable may be used in the rest of the program.
For more information on the digital map of numeric variables and its configuration consult
the device manual.
131
PowerStudio / PowerStudio Scada
3.27.1.1.2 Digital variables
Push the button “Add" or “Modify” the dialogue will appear to configure the binary variable.
Where
•
Identifier: Allows each of the binary variables to be used in expressions and conditions, can
be identified, see section 14.2 Expressions and Conditions.
•
Name: Name of the numeric variable used to identify the variable better.
•
Description: Short description of the variable.
•
Address: Modbus map address of the device where the variable can be found.
•
Type: Selects the type of variable; i.e., read, write or both. If the variable is write or read/write
the value can be forced on the device
•
Use: Shows where the variable may be used in the rest of the program.
For more information on the map of binary variables and its configuration consult the
device manual.
132
PowerStudio / PowerStudio Scada
3.28 LM-24 M
This software only communicates with LM-24 M devices.
3.28.1 Driver options
The options of the LM-24 M can be accessed from
•
•
See Menu: See section 2.4.3 Display options.
Toolbar: See section 2.4.4 Toolbar
The following is the options menu:
3.28.1.1 Device parameters
This screen allows the internal parameters of the device to be configured. On opening the
dialogue box, the software will read the configuration of the device. When complete, click on "Accept"
for the software to send information on changes to the device. In no case will the information be stored
on the hard drive of the PC.
133
PowerStudio / PowerStudio Scada
Shows general information.
This part of the configuration corresponds to the device counters. If the selector , is
checked, on sending the configuration the energy counter will be loaded with the values entered into
the corresponding boxes.
3.28.1.2 Device inputs
For each of the inputs of the LM-24 M, three variables will be available, a digital display to
show the status of the input (open / closed), a counter variable to show the number of pulses detected
at the input and finally a flow variable calculated by the software as an estimate of the pulse frequency
on the input during a space of time.
By means of this dialogue the LM-24 M inputs can be configured.
By mean of the
the display configuration of different types of variables can
be configured. The previous image shows the configuration of the counters,
134
PowerStudio / PowerStudio Scada
Where:
•
•
•
Description: Alphanumeric type which permits a brief description of the counter so it
can be identified better.
Unit: Alphanumeric type data which permits a brief description of the units where the
counter to be entered is displayed.
Factor: Multiplicative value of each input pulse.
For digital inputs:
•
Description: Alphanumeric type data which permits a brief description of the digital
input to be entered for better identification.
Finally for the flow configuration:
135
PowerStudio / PowerStudio Scada
Checking the selector ; will activate the flow variable. Remember if the selector is not
checked it will not be possible to view the flow value of the corresponding GL-24 M input.
•
•
•
•
•
Description: Alphanumeric type data which permits a brief description of the flow to
be entered for better identification.
Unit: Alphanumeric type data which permits a brief description of the units where the
flow is shown to be entered.
Factor: Multiplicative value of each input pulse.
Time: Time in minutes for calculating the flow value.
Calculation window: Time window, in seconds, that the software will use to calculate
an estimate of the flow, taking into account the value of the device counter.
3.28.1.3 Variable limits
Only limits can be defined for flows that are enabled.
By means of this dialogue the nominal value of flow type counters, as well as a series of
margins to display on screen when a variable measures unusual values can be configured.
The options "Variable Units" and "Variable Limits" are detailed in sections 3.1.2 Variable units
and 3.1.3 Variable limits.
136
PowerStudio / PowerStudio Scada
3.29 LM4I-4O-M
3.29.1 Driver options
The LM4I-4O-M options can be accessed from:
•
•
See Menu: See section 2.4.3 Display options
Toolbar: See section 2.4.4 Toolbar
The following is the options menu:
3.29.1.1 Device parameters
This screen allows the internal parameters of the device to be configured. On opening the
dialogue box, the software will read the configuration of the device. When complete, click on "Accept"
for the software to send information on changes to the device. In no case will the information be stored
on the hard drive of the PC.
137
PowerStudio / PowerStudio Scada
Shows general information.
Configuration of the pulse duration that can be generated with the digital outputs of the device.
This part of the configuration corresponds to the device counters. If the selector , is
checked, on sending the configuration the energy counter will be loaded with the values entered into
the corresponding boxes.
3.29.1.2 Device inputs
For each of the inputs of the LM4I-4O-M, three variables will be available, a digital display to
show the status of the input (open / closed), a counter variable to show the number of pulses detected
at the input and finally a flow variable calculated by the software as an estimate of the pulse frequency
on the input during a period of time.
Using this dialogue the inputs and outputs of the LM4I-4O-M can be configured.
Using the '
; the display configuration of the different types of
variables can be configured. The previous image shows the configuration of the counters, where:
•
•
•
Description: Alphanumeric type which permits a brief description of the counter so it
can be identified better.
Unit: Alphanumeric type data which permits a brief description of the units where the
counter is displayed to be entered.
Factor: Multiplicative value of each input pulse.
138
PowerStudio / PowerStudio Scada
For digital inputs:
•
Description: Alphanumeric type data which permits a brief description of the digital
input to be entered for better identification.
For digital outputs:
•
Description: Alphanumeric type data which permits a brief description of the digital
output to be entered for better identification.
Finally for the flow configuration:
Checking the selector
; will activate the flow variable. Remember if this selector is not
checked it will not be possible to view the flow value of the corresponding LM4I-4O-M input.
•
•
•
•
•
Description: Alphanumeric type data which permits a brief description of the flow to
be entered for better identification.
Unit: Alphanumeric type data which permits a brief description of the units where the
flow is shown to be entered.
Factor: Multiplicative value of each input pulse.
Time: Time in minutes for calculating the flow value.
Calculation window: Time window, in seconds, that the software will use to calculate
an estimate of the flow, taking into account the value of the device counter.
139
PowerStudio / PowerStudio Scada
3.29.1.3 Variable limits
Only limits can be defined for flows that are enabled.
Through this dialogue the nominal value of flow type counters, as well as a series of margins
to display on screen when a variable measures unusual values can be configured.
The options "Variable Units" and "Variable Limits" are detailed in sections 3.1.2 Variable units
and 3.1.3 Variable limits.
140
PowerStudio / PowerStudio Scada
3.30 LM50-TCP
3.30.1 Driver options
You can access the LM50-TCP options from:
•
•
See Menu: See section 2.4.3. Display options
Toolbar: See section 2.4.3. Toolbar
The following is the options menu:
3.30.1.1 Device parameters
This screen allows the internal parameters of the device to be configured. On opening the
dialogue box, the software will read the configuration of the device. When complete, click on "Accept"
for the software to send information on changes to the device. In no case will the information be stored
on the hard drive of the PC.
141
PowerStudio / PowerStudio Scada
Shows general information:
This part of the configuration corresponds to the device counters. If the selector
is
checked, on sending the configuration the counters, which have been modified, will be loaded with the
values entered into the corresponding boxes.
142
PowerStudio / PowerStudio Scada
3.30.1.2 Inputs
For each of the LM50-TCP inputs three variables will be available, a digital one to show the
input status (open / closed), a counter variable to show the number of pulses detected in the input and
finally a flow variable calculated by the software as an estimate of the pulse frequency that occurs in
the input during a period of time.
By means of this dialogue the LM50-TCP input can be configured.
Using the '
; the configuration display of the different types of variables
can be configured. The previous image shows the configuration of the counters, where
•
•
•
Description: Alphanumeric type which permits a brief description of the counter so it
can be identified better.
Unit: Alphanumeric type data which permits a brief description of the units where the
counter is displayed to be entered.
Factor: Multiplicative value of each input pulse.
For digital inputs:
143
PowerStudio / PowerStudio Scada
•
Description: Alphanumeric type data which permits a brief description of the digital
input to be entered for better identification.
Finally for the flow configuration:
Checking the selector
will activate the flow variable. Remember that if this selector is not
checked it will not be possible to display the flow value of the corresponding LM50-TCP input.
•
•
•
•
•
Description: Alphanumeric type data which permits a brief description of the flow to
be entered for better identification.
Unit: Alphanumeric type data which permits a brief description of the units where the
flow is shown to be entered.
Factor: Multiplicative value of each input pulse.
Time: Time in minutes for calculating the flow value.
Calculation window: Time window, in seconds, that the software will use to calculate
an estimate of the flow, taking into account the value of the device counter.
144
PowerStudio / PowerStudio Scada
3.30.1.3 Variable limits
Limits can only be defined on flow type counters.
By means of this dialogue the nominal value of flow type counters, as well as a series of
margins to display on screen when a variable measures unusual values will be configured.
The options "Variable Units" and "Variable Limits" are detailed in sections 3.1.2 Variable units
and 3.1.3 Variable limits
145
PowerStudio / PowerStudio Scada
3.31 MKD
3.31.1 Driver options
The following is the options menu:
The option ‘Variable units’ is detailed in section 3.1.2 ‘Variable units”
3.31.1.1 Device parameters
This screen allows the internal parameters of the device to be configured. On opening the
dialogue box, the software will read the configuration of the device. When complete, click on "Accept"
for the software to send information on changes to the device. In no case will the information be stored
on the hard drive of the PC.
146
PowerStudio / PowerStudio Scada
Shows general information.
Visualisation on the screen of the device.
•
•
Omit reactive measurement: The reactive measurements are not shown on the device
screen, although they will be continue to be visualised on the software display screens.
Omit partial counters: Partial counter measurements are not shown on the screen of the
device nor on the display screens of the software.
Flow direction
Configuration of the "backlight" disconnection. The value should oscillate between 0
and 10 seconds.
On clicking the button all the partial counters of the device will be started.
Configuration of the number of quadrants. With only 2 quadrants the
consumed energy counters will be taken into consideration and with 4 the consumed and generated
energy quadrants.
Configuration of the output relay of the active energy. The number of Wh
equivalent to an output impulse and the variable that will be a measured to give this pulse. If the pulse
value is 0, the output will be treated like a standard digital output, enabling its value to be forced from
0 to 1.
Configuration of the output relay of the reactive energy. The number of VArh
equivalent to an output pulse and the variable that will be a measured to give the pulse can be
configured. If the pulse value is 0, the output will be treated like a standard digital output, enabling its
value to be forced from 0 to 1.
147
PowerStudio / PowerStudio Scada
Configuration of the digital inputs of
the device.
The inputs may be used as inputs for changing the tariff or as digital inputs.
Consult the device manual for more information on how changing the tariff works
Configuration of one of the inputs when the operating mode is digital
inputs. Inputs may be treated as pulse counters by selecting the ‘Pulse’ mode; the parameter
'number of pulses' will correspond to the multiplicative factor of pulses counted at the input.
When the selected mode is ‘Status’ it will show the input status, open or closed, and will
disable the corresponding counter.
Clicking this button will reset the device counter. As long as the working
mode is digital inputs and the input mode is configured in pulses.
148
PowerStudio / PowerStudio Scada
3.32 MK-LCD
3.32.1 Driver options
The following is the options menu:
The options "Variable Units" and "Variable Limits" are detailed in sections 3.1.2 Variable units
and 3.1.3 Variable limits.
3.32.1.1 Device parameters
This screen allows the internal parameters of the device to be configured. On opening the
dialogue box, the software will read the configuration of the device. When complete, click on "Accept"
for the software to send information on changes to the device. In no case will the information be stored
on the hard drive of the PC.
Shows general information.
149
PowerStudio / PowerStudio Scada
By clicking the button the partial power counter will be set to zero.
This section shows the configuration of the device relay output and the option to configure it
with the desired values is given.
•
Variable: The parameters associated with the relay are indicated in this field. The output is
programmed as an alarm, and any of the parameters measured by the device can be
controlled. The units in which the maximum and minimum values of the alarm are expressed
are indicated in brackets.
•
Max: In this box the maximum value to control is indicated.
•
Min: In this box the minimum value to control is indicated.
•
Delay: Alarm delay in seconds. The maximum value is 9999 seconds.
150
PowerStudio / PowerStudio Scada
3.33 POWERNET
3.33.1 Driver options
The following is the options menu:
3.33.1.1 Device parameters
This screen allows the internal parameters of the device to be configured. On opening the
dialogue box, the software will read the configuration of the device. When complete, click on "Accept"
for the software to send information on changes to the device. In no case will the information be stored
on the hard drive of the PC.
Shows general information.
151
PowerStudio / PowerStudio Scada
Using this selector the type of distortion that the device will calculate can be configured.
•
Period: Is the integration period of the maximeter that can oscillate between 1 and 60
minutes.
•
Type of window: Type of window used to save the maximeter value, it can be fixed or sliding.
•
Unit The maximum demand can be calculated with active power III, apparent power III,
current III or current by phase depending on the device.
•
Maximeter reset: When the button is enabled, the device maximeter goes to zero.
On clicking the button the energy counters on the device will return to zero.
152
PowerStudio / PowerStudio Scada
3.34 QNA 412/413
3.34.1 Driver options
The following is the options menu:
3.34.1.1 Device parameters
This screen allows the internal parameters of the device to be configured. On opening the
dialogue box, the software will read the configuration of the device. When complete, click on "Accept"
for the software to send information on changes to the device. In no case will the information be stored
on the hard drive of the PC.
153
PowerStudio / PowerStudio Scada
Shows information on the device.
Allows the password to be enabled or disabled to block both the reading and writing values
and the configuration of the device.
•
•
•
•
•
•
•
•
•
•
•
Capture period: Configuration in minutes between records stored on the device.
Primary voltage: Device primary voltage value.
Secondary voltage: Device secondary voltage value.
Primary current: Device primary current value.
Secondary current: Device secondary current value.
Neutral primary current: Device neutral primary current value.
Neutral secondary current: Device neutral secondary voltage value.
Rated voltage: Rated voltage of the equipment, with a 3-wire configuration the composite
voltage should be programmed and the single voltage on four wires. If the measurement is
carried out through voltage transformers, the programmed value must refer to the secondary.
Nominal frequency: Nominal frequency of the device.
Circuit: Enables the type of circuit to which it is connected to carry out the measurement to be
chosen, whether it is connected to a three-phase device or if it only uses two current
connectors for the measurement (Aron).
Connection: Enables the type of connection to which it is connected to carry out the
measurement to be chosen, albeit delta (connection between phases, without neutral) or star
(3-phase connection and neutral)
154
PowerStudio / PowerStudio Scada
•
•
•
•
•
•
•
•
Measurement point: Brief description of the measurement point where the QNA is situated
Comments: Brief description of the measurement point.
Overvoltage threshold: Serves to programme the overvoltage percentage. Each semi-cycle
with an efficient value exceeding this value will be understood as over voltage.
Overvoltage hysteresis: Overvoltage hysteresis is where the start-up voltage is different
from the end voltage of overvoltage. An overvoltage will start when the voltage threshold value
is exceeded and will finish when it is lower than the value defined by the difference between
the threshold and the hysteresis.
Gap threshold: Serves to programme the gap detection. Each semi-cycle with an efficient
value not reaching this defined value will be understood as a gap.
Gap Hysteresis: Will define a gap hysteresis so that the initial voltage is different to the end
of gap voltage. A gap will start when the voltage does not exceed the threshold value and will
finish when this is lower than the value defined by the sum of the threshold and the hysteresis.
Threshold interruption: defined as power off (absence of tension, interruption) the voltage
drop below the value set.
Hysteresis interruption: A hysteresis of interruption is when the start-up voltage is different
from the voltage interruption end. An interruption will begin when the voltage does not exceed
the threshold value and ends when it exceeds the value defined by the sum of the threshold
and hysteresis interruption.
Enables us to specify the energy capture time expressed in minutes.
155
PowerStudio / PowerStudio Scada
3.35 RGU-10 / RGU-10 RA
3.35.1 Driver options
The following is the options menu:
3.35.1.1 Device parameters
This screen allows the internal parameters of the device to be configured. On opening the
dialogue box, the software will read the configuration of the device. When complete, click on "Accept"
for the software to send information on changes to the device. In no case will the information be stored
on the hard drive of the PC.
3.35.1.1.1 RGU-10
156
PowerStudio / PowerStudio Scada
Shows general information.
Configuration of the frequency of the operating system.
Configuration of the polarity of the trigger coil relay output, allowing one of the two possible
options to be selected (standard or positive).
Configuration of the channel trigger threshold. It will be possible to select one of the following
values:
0.03 A
0.5 A
5A
0.1 A
1A
10 A
0.3 A
3A
30 A
Enables the trigger delay time from one of the following values to be selected:
Instantaneou
s
100 ms
400 ms
1s
10 s
Selective
20 ms
200 ms
500 ms
3s
300 ms
750 ms
5s
It will be possible to configure the pre-alarm following parameters:
•
•
Pre-alarm threshold. Where can % of the nominal current can be defined to activate
the pre-alarm, this value will vary between 50 and 90%.
Delay time on activation. Enable the time delay in activating the pre-alarm to be
selected from among the following values:
0.02 s
0.30 s
0.75 s
0.10 s
0.40 s
1.00 s
157
0.20 s
0.50 s
3.00 s
PowerStudio / PowerStudio Scada
5.00 s
•
•
10.00 s
Polarity of the pre-alarm relay output.
Pre-alarm operating mode.
3.35.1.1.2 RGU-10 RA
Shows general information.
Configuration of the frequency of the operating system.
Configuration of the channel trigger threshold. It will be possible to select one of the following
values:
0.03 A
0.5 A
5A
0.1 A
1A
10 A
0.3 A
3A
30 A
Enables the trigger delay time to be selected from one of the following values:
158
PowerStudio / PowerStudio Scada
Instantaneous
:
100 ms
400 ms
1s
10 s
Selective
20 ms
200 ms
500 ms
3s
300 ms
750 ms
5s
It will be possible to set the following reclosure parameters:
•
Residual current device reclosure Sequence. Enables one of the following values to
be selected
No. reclosure
6
30
8
6
6
6
10
10
6
10
10
10
6
Sequence times
8, 16, 30, 59, 115 and 224 seconds
20, 40 seconds and 5 minutes for the rest
30 seconds, 1, 2, 3, 4, 5, 6 and 7 minutes
10,20,30,60,130 and 600 seconds
2, 4 and 8 minutes for the rest
30 seconds, 1, 2, 3, 4, 8 and 16 minutes
1 minute between reclosures
90 seconds between reclosures
2, 4, 6, 6, 6 and 6 minutes
3 minutes between reclosures
1 minute between reclosures
90 seconds between reclosures
8 seconds between reclosures
Reset time
15 minutes
15 minutes
15 minutes
5 minutes
15 minutes
15 minutes
30 minutes
30 minutes
15 minutes
30 minutes
60 minutes
60 minutes
15 minutes
The information shown will be xx – yy – zz, where xx corresponds to the number of
reclosures, yy to the sequence of time and zz to the reset time.
•
Circuit breaker reclosure. Allows one of the following values to be selected.
No. reclosure
2
2
2
2
2
2
6
Sequence times
Reclosure disabled
1 minute between reclosures
1 minute between reclosures
90 seconds between reclosures
90 seconds between reclosures
3 minutes between reclosures
30 seconds between reclosures
30 seconds between reclosures
Reset time
30 minutes
60 minutes
30 minutes
60 minutes
30 minutes
30 minutes
30 minutes
The information shown will be xx – yy – zz where xx corresponds to the number of
reclosures, yy to the sequence of time and zz to the reset time.
•
Cut-off element. Lets the type of cut off element be selected from one of the following
values:
Switch
159
PowerStudio / PowerStudio Scada
Circuit breaker
Circuit breaker + trigger coil
•
•
Polarity of the locking relay output.
Operation mode.
3.35.2 Displaying values
3.35.2.1.1 RGU-10
The RGU-10 device will show the following screen values:
Where:
1. Protection status:
♦
Not tripped.
♦
Tripped.
2. Additional information on the protection status.
3. Leakage current value detected in the trigger channel. This information will be
visible only when the channel is tripped.
4. Status of the pre-alarm:
♦
Not enabled
♦
Pre-alarm enabled
5. Additional information on the status of the pre-alarm.
6. Additional information on the pre-alarm reclosure. This will only appear when the
automatic reclosure of the pre-alarm is enabled.
7. Information about the configured trigger current threshold
8. Information about the configured trigger time.
9. Adjustment button. Displays channel information and allows some parameters to
be modified.
10. Reset button. If the channel is not tripped, the button will remain disabled. Push
the button to restart the channel.
11. Off button. Enables remote triggering of the channel to be made. If the channel is
tripped the button will remain disabled.
12. Value of instant leakage current. If the value exceeds the limits of the values bar,
either over or under, an arrow below the value will indicate this).
13. Trigger threshold value configured for the channel
14. Pre-alarm value configured for the channel.
160
PowerStudio / PowerStudio Scada
3.35.2.1.2 RGU-10 RA
The RGU RA-10 device will show the following value screen:
Where:
1. Protection status:
♦
Not tripped
♦
Tripped.
2. Additional information on the protection status.
3. Information that appears only when the reclosure is enabled
4. Leakage current value detected in the channel trigger. This information will be
visible only when the channel is tripped.
5. Reclosure status or channel latching indicator
♦
Normal
♦
ÅÆ . Blinking. The device is timing the reclosure
♦
. Fixed. The channel is locked.
6. Additional information on the interlocking status.
7. Table with the partial and total counter values.
8. Cut-off Element configured.
9. Information about the configured trigger current threshold
10. Information about the configured trigger time.
11. Adjustment button. Displays channel information and allows some parameters
to be modified.
12. Reset button. If the channel is triggered, the button will remain disabled. Push
the button to restart the channel.
13. Off button. Enables remote triggering of the channel to be made. If the
channel is tripped the button will remain disabled.
14. Value of instant leakage current . If the value exceeds the limits of the values
bar, both over or under, an arrow below the value will indicate this).
15. Trigger threshold value configured for the channel
161
PowerStudio / PowerStudio Scada
3.36 RRM-C
This device does not keep a log, so it will not be possible to make graphs or tables of any
parameter shown by the device.
3.36.1 Driver options
Click on the "Options" buttons and information such as the model and the version of the
device will be shown.
3.36.2 Displaying values
The RRM-C device will show the following value screen:
Where:
1.
2.
3.
4.
5.
Displays the status of the device.
Shows the number of actual reclosures .
Number of reclosures configured on the device.
Time between reclosures configured on the device.
State of the device relay.
6. Reset button. Clicking the button resets the device.
7. OFF button. Clicking the button triggers the device.
162
PowerStudio / PowerStudio Scada
3.37 TCP50 – ALARM
This device does not keep a log; therefore it is not possible to configure any device
parameters.
3.37.1 Driver options
The following is the options menu:
3.37.1.1 Device parameters
Click on the "Device Parameters" button and information will be shown about the device.
163
PowerStudio / PowerStudio Scada
3.37.1.2 Device inputs
By means of this dialogue box a brief description of the device inputs can be entered for
improved identification purposes.
3.37.2 Displaying values
1
Digital input number. Specifies the digital input in use.
2
Input status
Input Open
Input Closed
3
Input status
Open
Closed
164
PowerStudio / PowerStudio Scada
4 Variable selection
Where necessary the selection of one or more variables of a device, the dialogue for variable
selection will appear. It will be possible to select both analogue variables (voltage, current, power,
etc...), as well digital variables on equipment which permits this.
First the selection of analogue variables will be detailed. This dialogue will depend on the
device connected, the explanation corresponding to CVM-96 can be used for this section.
Where the variables we wish to select can be checked. If any variable is already selected it
will appear marked as , and may not be unchecked.
If a discriminator has been already selected, either by default or otherwise, the variables
which can be discriminated will appear marked on the button as
and an explanation
will appear on the lower part of the screen
If the
button is clicked all the variables will be selected or deselected.
165
PowerStudio / PowerStudio Scada
; only the variables for this stage will be
If you click on one of the stage buttons
selected or deselected .
If you click on one of the variables, for example
variable will be selected.
166
; all the boxes for this
PowerStudio / PowerStudio Scada
Finally, clicking on
; phases 1, 2 and 3, instant, maximum or minimum, are selected
according to the button pressed. If all three phases are selected the button switches to
pressed the 3 phases are deselected.
167
, and when
PowerStudio / PowerStudio Scada
5 Discriminators
PowerStudio provides a complete set of tools that allow the definition of energy discriminators
as well as further analysis and study on the data collected by the devices in both a powerful and
intuitive manner.
A discriminator study provides a consistent result in an energy consumption representation for
each type of hour (counter) defined at any moment. This representation can be displayed either as a
table or graph.
Similarly it is possible to study this data displaying it at different time intervals or grouping it
together in different periods. Therefore, we can see them in periods of a year and grouped together by
months, in monthly intervals and grouped together by days, etc.
As can be seen the discriminator studies consist basically of defining the discriminators
(typically a calendar) and applying said discriminator to the data stored in a device. Therefore a
representation of the study realised can be obtained as the user desires (and visible both in graph and
table format.)
5.1 Discriminator configuration
The first stage that is carried out is the configuration of the discriminators we want to apply to
the data for analysis. The user can add new discriminators and delete or modify the existing
discriminators.
To manage these actions the option "Discriminators" should be selected from the "Set up"
menu.
The following dialogue box will appear:
From where discriminators can be added, deleted or modified.
168
PowerStudio / PowerStudio Scada
Clicking the right-button on the mouse over the list of discriminators the following contextual
message will appear.
enabling discriminators to be pasted and copied. It may be possible that some of the options from the
context menu do not appear, copy will only appear if there is a discriminator selected and the paste
option only if the discriminators have been copied onto the clipboard. If no discriminator is selected
and there are no discriminators on the clipboard when the right button is clicked the context menu will
not appear.
When “Add” or “Modify”, from the dialogue box "Discriminator Configuration" is clicked the
following dialogue box will appear:
Alphanumeric type data which enables
the unique identification of the discriminator.
Alphanumeric type data which enables
the user to enter a brief description of the discriminator.
Configures the different types of hours defined in the discriminator.
Configures the different types of days defined in the discriminator.
Configures the discriminator calendar.
169
PowerStudio / PowerStudio Scada
5.1.1 Types of hours
Through this dialogue the different discriminator hour types may be added, deleted or
modified. . These types of hour are the basic elements of the definition of the discriminators. Here the
registered consumption is distributed in accordance with the calendar (maximum energy and
demand).
Typically the types of hours correspond to the various prices that can be applied to the energy
consumed in accordance with the time zone or day). When adding or modifying the following dialogue
will appear:
Where:
Alphanumeric type data which allows us to uniquely identify the
type of hour within the tariff.
Colour that visually identifies the type of hour within the discriminator and will be
used for the result graph of applying this discriminator to data stored by any device (all counters for
the different maximum demand and energy variables).
Clicking once with the left mouse button on the coloured box
appears where you can configure the colour for the type of day.
170
1, the following dialogue
PowerStudio / PowerStudio Scada
Clicking the “Delete” button, will delete all the types of hours selected from the list.
After defining the types of hours these will then be distributed throughout each day defining for
them the different types of days which will make up our discriminator.
5.1.2 Types of day
By means of this dialogue the different discriminator day type may be added, deleted or
modified. On adding or modifying the following dialogue will appear:
As you can see the definition of a type of day implies indicating the types of hour into which it
is divided (e.g. a Sunday could have all day defined as a type of reduced tariff time and a weekday
may be divided into two sections i.e. daytime and night-time)
171
PowerStudio / PowerStudio Scada
Alphanumeric type data which uniquely identifies the type
of day within the discriminator.
Colour that visually identifies the type of day within the tariff. Click once with the left
mouse button on the coloured box
colour for the type of day.
; 1, the following dialogue appears, where we can configure the
Time zones that configure the type of day. These zones should occupy the entire 24 hour
period, but not overlap. In practice different sections within one day indicate that energy is billed
differently in each one depending on the time of day in question.
Graphs of time zones. This gives us visual guidance on how we are defining such a day
(enabling us to see at a glimpse, among other things, if any time zone throughout the day needs to be
confirmed)
By adding or modifying a zone the following dialogue will appear:
172
PowerStudio / PowerStudio Scada
This corresponds to the type of hour within the slot. These types
of hours will be those configured in section 5.1.1. Types of hours
Using this button, new types of hours will be added to the discriminator.
Numerical selection of a time zone.
Graph of the time zone. Each column
represents one hour of the day, each row is a period of 15 minutes. For the slot selection proceed as
follows:
•
Click with the left mouse button on the
•
Without releasing the button, drag it
•
Release the button and the time zone will have the colour for the time of day
; start of the time zone.
; until the end of the time zone.
The zone can be defined manually in a numerical way but this is only useful if one wants to
accurately define any slot precisely in minutes (for instance a zone from 10.10 to 15.40).
This dialogue only allows a continuous time zone to be defined.
173
PowerStudio / PowerStudio Scada
5.1.3 Calendar
Once the types of days that will make up the discriminator are defined they will then be
distributed in a complete calendar. To this end the types of days created beforehand in the
discriminator process will be distributed on these calendars.
We can assign types of days not only to the days of the year in course, but also to previous
and forthcoming years. Selecting the days can be carried out in the following ways:
•
•
•
Click twice with the left mouse button on one day, highlighting only the selected day.
Click once with the left mouse button on a start day, and then holding down the Shift
key, click once with the left mouse button on the final day, thus selecting every day
between the start day and the end day.
Using the quick selection option.
Listing with the different types of day configured in the tariff.
Type of day that will be assigned to the calendar if selections are made on it, if there
is no kind of day selected,
will appear, indicating that the days on the calendar, will be
selected rather than deleted.
With this option selections will be made automatically. The following dialogue
will appear.
174
PowerStudio / PowerStudio Scada
In this case every working day of 2005 will be checked with the type of day "Winter Day" .
175
PowerStudio / PowerStudio Scada
6 Calculated variables
There are certain situations where it is necessary to obtain the results of an operation between
the variables of the different devices, for example the sum of energies. PowerStudio has this type of
feature available for the so-called calculated variables. The values of these variables will be the result
of formulas comprising variable values from other devices or other calculated variables.
For a better organization, the calculated variables will be divided into groups of calculated
variables.
Through this dialogue the groups will be defined and the variables calculated that can be used
in the software.
The list situated on the left contains the different groups of variables calculated, while the list
on the right will show the variables calculated from the selected group.
By clicking the right mouse button on the list of groups the context menu will appear.
Allowing calculated groups of variables to be copied or pasted. It is possible that some of the options
in the context menu do not appear, copy will only appear on the list if a group has been selected and
the paste option only if groups have been previously copied to the clipboard. If there is no group
selected and there are no groups of variables calculated on the clipboard when clicking the right
mouse button the context menu will not be visible.
By adding or modifying a group the following dialogue will appear:
Where the name of the group of calculated variables and a brief description should be entered
for better identification within the software.
If you want to add or change a calculated variable, this dialogue will appear:
176
PowerStudio / PowerStudio Scada
That will permit the configuration of the calculated variable.
Allows each of the calculated variables to be used in expressions and
conditions, see section 14.2 Expressions and conditions.
Name of the calculated variable, used to better identify the variables.
Allows a textual description of the calculated variable to be entered.
Text of the units in which the calculated variable value is expressed.
Allows the possibility of changing the value of the variable from the SCADA
screen or an event to be enabled
,or
disabled. Only variables that do not contain
references to other variables, devices or calculations in the formula may be forced.
Enables the grouping criteria for the virtual values in graphs, tables
and reports to be selected. For example, if we have a value each 5 minutes (e.g. 10, 12 and 7)
and we group together the values every 15 minutes, this is group together the 3 values in 1,
the value obtained will be:
• Maximum value. The maximum value of the 3 (12) will be shown
• Minimum value: The minimum value of the 3 (7) will be shown.
• Average value: The average value of the 3 ((10 + 12 + 7) / 3 = 9.66) will be shown.
• Last value: The last value (7) will be changed
• Sum of the values: The sum of the values will be shown (10 + 12 + 7 = 29).
177
PowerStudio / PowerStudio Scada
This enables the number of decimal places for the calculated variable
to be selected.
Here the formula which will give the result of
button
the virtual variable is shown. It can be entered manually or using the “wizard”
(see appendix 14.2.1 Wizard for the creation of expressions and conditions). On entering the
formula it will be automatically analysed and where it can be used will be shown. For example:
It can be used on SCADA screen and reports, to make graphs and tables with the values
obtained, it can be used in the event conditions, but a discriminator cannot be applied.
The calculated variables are codified for their use in formulas and expressions like
R$CAL_group.variable
Using the prefix R$CAL the program will know that this is a calculated variable rather than the
variable of a device, group will correspond to the name of the group to which the calculated
variable belongs and finally, variable to the identifier entered in the field corresponding to the
calculated variable.
178
PowerStudio / PowerStudio Scada
7 Reports
The "Reports" option from the ‘set up ‘ menu enables templates for reports to be designed.
7.1 Add, modify and delete reports.
To create, modify or delete reports the "Reports" option from the ‘Configure ‘ menu should be
clicked. Then several options will appear depending if the reports have been previously created.
As can be observed in the figure, the option ‘New ’ will appear which will enable a new report
to be created followed by the name of the reports that have been created until the present (if there are
any). Clicking the right-hand mouse button on any of the already existing reports will offer the
possibility of modifying names and eliminating reports.
In the case of selecting the ‘New’ option a window will appear where the name of the new
report to be created can be chosen.
If we select ‘New’ or directly some of the already existing reports, a report design window will
open.
179
PowerStudio / PowerStudio Scada
7.2 Report design window
For editing reports the editing working mode must be used (see section 2.2.12 Operating
mode).
The report design window looks like this:
The window is divided into three areas:
•
•
•
Tools (1)
Information panel (2)
Report sheet (3)
The tools allow the report design to be configured more easily.
The information panel enables us to access all the configuration options of a control which is
added to the report design and is selected at this time.
The report sheet is the report design view.
Therefore, through the tools (1) controls can be entered in the report sheet (3) whose
properties can be configured in the information panel (2).
When a new report is being created, the background configuration properties of the report in
the information panel will automatically appear. These properties are the same as those which appear
if at any time there is no control selected.
180
PowerStudio / PowerStudio Scada
The "Show grid" option enables the grid which indicates the position of objects on
the screen to be shown or hidden. If the grid is shown, the object will be automatically aligned to the
points of the grid.
By selecting this option one of the images added to the image
manager can be selected (see section 2.2.6 Image manager) so that it can appear in the report
background.
Click on this button to delete the present background image.
When enabled, this option will maintain the width and height proportions of the
selected background image. If disabled, it will force the image to occupy the entire length and width of
the report sheet, expanding or contracting it as required.
It enables the image chosen to be situated as the background in any of the seven
positions defined in the figure.
This button (situated in the upper toolbar) allows the characteristics of the grid to be
configured as well as the size of the report sheet we are detailing:
The size of the report sheet is selected from a list of standards for types of paper (DIN-A4, A3,
A2, etc.) and the size of the grid will specify in millimetres, the distance between one point of the grid
and another either horizontally or vertically.
181
PowerStudio / PowerStudio Scada
In terms of tools, there are several grouped together depending on their use:
- Action Tools
- Position Tools
- Page Tools
- Zoom Tools
- Various Tools
- Edition Tools
;
;;
;;
7.2.1 Action tools
7.2.1.1
Select controls
This tool allows the user to select one or more controls that have been placed already on the
report sheet to edit their properties or to apply any other tool. To select a control just click the left
mouse button over it. To select more than one control hold down the left mouse button and draw a
rectangle covering the controls we want to use. The controls outside of the rectangle remain
unchecked or cease to be selected if previously checked.
The behaviour of this tool can be amended if we hold down the "Control" key or the "Shift"
key. If when selecting the Controls we select the "Control" key what happens is that the selection we
are making will be reversed, i.e. we select the Controls that are not selected and we will no longer
select those which are. If we hold down the "Shift" key what we will do is add controls that have not
been selected to those which already have been.
7.2.1.2
Text control
This tool will allow the inclusion in the report of fixed text chains. Once this tool has been
selected, it will be necessary to draw a rectangle on the report by keeping the left mouse button
pressed. The properties than can be configured from this control are:
We may choose a text style created beforehand or create a new
personalised one.
Will correspond to the font type used for the text.
Depending on the font selected, you can choose bold and / or italics.
Corresponds to the size of the font. The size could be between 1
and 90. The size can be either keyed in or selected from the dropdown menu which shows the
options available.
Corresponds to the text direction. The orientation (expressed in
degrees) could be between 0 and 350. The size can be either keyed in or selected from the
dropdown menu which shows the options available.
Clicking on this allows the text colour to be selected.
182
PowerStudio / PowerStudio Scada
This will permit us to decide on which part of the rectangle defined in the report sheet
the text will be situated.
The text to be displayed is written here.
This button will allow us to add as a style the personalised configuration that we have
identified for the control of the active text, and thus be able to use the style in other controls.
7.2.1.3
Image control
This tool will allow us to include still pictures into the report. Once this tool has been selected,
it will be necessary to draw a rectangle on the report by keeping the left mouse button pressed. The
properties than can be configured from this control are:
By selecting this option an image from the image manager can be
selected, see section 2.2.6 Image manager, to select an image to assign to the control
shown in the report.
Click on this button to delete the present background image.
183
PowerStudio / PowerStudio Scada
If enabled, this option will maintain the width and height proportions of the
selected image. If disabled, it will force the image to occupy the entire length and width of the
rectangle defined in the report, expanding or contracting it measurements as required.
This will help decide on which side of the rectangle defined on the report sheet the
image will be placed.
7.2.1.4
Date Control
This tool allows a date to be entered in the report (real or not). Once this tool has been
selected, it will be necessary to draw a rectangle on the report by keeping the left mouse button
pressed. The properties that can be configured from this control are:
This option enables the type of date shown on the report to be
chosen. The following choices are available:
•
•
•
•
Any date: Any date defined by the user.
Present date: The date at the moment the report is made.
Start date: The starting date for the information used in the report.
Final date: The end date for the information used in the report.
We can also select the style of text created previously or create a new
personalised one for the date.
This corresponds to the type of font used for the text of the date.
Depending on the font selected, you can choose bold and / or italics.
Corresponds to the size of the font of the date text. The size could
be between 1 and 90. The size can be either keyed in or selected from the dropdown menu
which shows the options available.
Corresponds to the orientation of date text. The orientation
(expressed in degrees) could be between 0 and 350. The size can be either keyed in or
selected from the dropdown menu which shows the options available.
Clicking on the button the date text colour can be selected.
184
PowerStudio / PowerStudio Scada
This will allow us to decide on which part of the rectangle defined in the report sheet
the date text will be placed.
Here the date format will be established. Several are pre-defined and
can be manually entered from the keyboard. The different models defined are:
o
o
o
o
o
o
o
o
y Æ year. If the number of letters is 3 or more the full year is represented (2006) and if
not the abbreviated value (06).
M ÆMonth. If the number of letters is 3 or more it will be interpreted as the name of
the month, if not the number of the month.
d Æ date. The number of letters will be the minimum number of digits with which the
value can be represented.
E ÆDay of the week. If the number of letters is 4 or more the full name of the day of
the week is represented. If the value is less the abbreviation of the name is
represented.
H Æ Time of day from 0 to 23. The number of letters will be the minimum number of
digits with which the value can be represented.
m Æ minutes. The number of letters will be the minimum number of digits with which
the value can be represented.
s Æ seconds. The number of letters will be the minimum number of digits with which
the value can be represented.
‘ Æ Using speech marks a text can be added to any part of the model. The
apostrophe is only needed if some of the characters used in the model are required.
This option will only appear in the case of having selected ‘any date‘.
Therefore a specific date can be chosen to show in the report.
This button will enable us to add as style the customised configuration that we have defined to
control the active text and to use this style in other controls.
185
PowerStudio / PowerStudio Scada
7.2.1.5
Formula control
This tool will permit a formula to be included in the report (the final result will be seen in the
report). Once this tool has been selected, it will be necessary to draw a rectangle on the report by
keeping the left mouse button pressed. The properties than can be configured from this control are:
We can also select the style of text created previously or create a new one
personalised for the formula.
This will correspond to the font type used for the text of the formula.
Depending on the font selected either bold and/or cursive can be selected.
Corresponds to the size of the text font of the formula. The size
could be between 1 and 90. The size can be either keyed in or selected from the dropdown
menu which shows the options available.
Corresponds to the orientation of text formula. The orientation
(expressed in degrees) could be between 0 and 350. The size can be either keyed in or
selected from the dropdown menu which shows the options available.
Clicking on the button the colour formula of the text can be selected.
This will permit us to decide on which part of the rectangle defined in the report sheet
the text formula will be situated.
Using these selectors the number of whole and decimal numbers shown
by the result value of the formula calculation can be specified.
This option will only be available if a specific number of whole numbers has been
specified in the previous option.
If the value resulting from the formula does not
reach the specified whole number, the remaining spaces will be filled with zeros
This option will be available only in the event that a specific number of decimal
places has been selected in the previous option. Then, in the event that the values resulting
from the formula were not reached, the remaining number of decimal places with be filled with
zeros.
186
PowerStudio / PowerStudio Scada
Will display a thousands separator in the value resulting from the formula. This
separator will depend on the regional configuration of the system where the programme is
running.
Here the formula that will give place to the result to be shown on the
report sheet will be specified. It can be entered manually or using the “wizard”
; (see
appendix 14.2.1 ) Wizard for the creation of expressions and conditions.
7.2.1.6
Conditioned control
This tool will allow us to include both a control and the previously defined data (text label,
image, formula ,date ) in the report, that will be shown only when compliant with a specific condition.
The properties that can be configured for this tool will depend on the type of control which has been
chosen '
;. The common options are:
Here the condition is specified which gives rise to the appearance on
the report page of the chosen control. It can be entered manually or using the “wizard”
(see appendix 14.2.1) Wizard for the creation of expressions and conditions).
Once the condition has been specified, click the ‘New’ button and the
condition will be added to the condition list. To delete a condition from the list just select it or
push the ‘Delete’ button. When there is more than one condition on the list, the control will
activate when one of more of them is complied with.
Clicking the right-hand button of the mouse on the report sheet will enable us to cut, copy,
paste, delete, select all the controls or show or hide the toolbar.
187
PowerStudio / PowerStudio Scada
7.2.1.7
Embedded Graphic Control
This tool allows us to include a graph embedded in a report. This control, like others, can be
placed anywhere in the report and enables a large amount of variables to be viewed.
This control allows the style of the same to be configured (the style of the texts of the axes
and keys, namely the font, size, colour, etc.). If you want to see or hide the variable keys, the colour of
the axes, the background colour (it can also be transparent) and the variables to be represented.
Control properties of the graph embedded in reports and the control representation
For each variable it is possible to choose the colour and type of representation we want. The
types possible are bar graph, lines or points. For scatter type representations we can select between
dots, circles (5x5), squares (5x5), diamonds (5x5), X (5x5), Crosses (5x5), Xs (3x3) and Crosses
(3x3). Also, for the line representation, the style can be chosen (solid, dashed, dotted, line-dot and
line-dot-dot) as well as thickness (between 1 and 10 points).
The most important parameter, apart from the variables to be represented, and that will
determine the final aspect of the graph (and, most importantly, the amount and distribution of
information to show), is the period of time.
The period can be automatic, 5 minutes, 10 minutes, 15 minutes, 20 minutes, 30 minutes, 1
hour, 1 day and 1 month. In the event that the period is automatic we can choose the number of
values of the variables that make up the graph we want to see.
There is a fundamental difference between choosing the automatic period or any other period.
If we choose the automatic period, the data will be grouped with the period of the report and, if we
have generated a report for one week, we will have variable values to be represented in the
embedded graph grouped in weeks, so that for the week we are generating the report we have a
unique value. It is therefore necessary to choose those values with the group we want to visualize,
that is, for example indicate how many weeks, generally periods, we want to see (these periods are
always prior to the period of the report). Thus, if we generate a monthly report with a graph embedded
with an automatic period and with 6 values, we will see a chart with values grouped by month,
displaying the month of the report (last value) and the previous five months. If we choose a period that
is not automatic the values represented will be grouped with the given period and only those included
in the period of the report will be included. For example, if we make a weekly report and we have
defined the period of the embedded graph as one day, we will see a graph of the week's report with
188
PowerStudio / PowerStudio Scada
the values grouped by days (typically 7 values). With a period other than automatic we will never see
values that are not included in the period of the report, in contrast with an automatic period we can
see values of periods prior to the report.
Embedded Graph properties with an automatic period
Once generated and displayed in the client, the graph might look like this:
7.2.1.8 Common options for the action tools
Any control entered in the report sheet can be re-sized and moved. To re-size a control just
place the mouse pointer on one side of the rectangle which surrounds the control and keep it pushed
while moving it in the desired direction. To move a control the left-mouse button must be clicked on it
189
PowerStudio / PowerStudio Scada
and must remain pressed while moving the mouse in the desired direction. It will also be possible to
move more than one control while grouping them inside a rectangle. The left-hand mouse button
should also remained pressed at the same time to group two or more controls, drawing a rectangle
including the controls we wish to move inside it.
7.2.2 - Position tools
Horizontally centre: At least one control should be selected for use. With this control one or
more controls situated on the report sheet can be aligned horizontally. The control or controls will
move to the left or the right to end up completely aligned on the page. If this option is used with the
“Control” button pressed each of the controls selected will be aligned independently.
Vertically centre: At least one control should be selected for use. With this control one or
more controls situated on the report sheet can be aligned vertically. The control or controls will move
up or down to end up completely aligned on the page. If this option is used with the “Control” button
pressed each of the controls selected will be aligned independently.
Horizontally re-size: At least two controls should be selected so this tool can be used. The
horizontal size of a control can be aligned to another existing one using this tool. To carry out this
adjustment the ‘Control’ key should be pushed and with the left-hand mouse button the different
controls will be selected to be re-sized. The last control selected will be that which is taken as a
reference to carry out the re-sizing of the others, i.e., all the selected controls will end up with the
horizontal size the same as the last control selected.
Vertically re-size: This tool carries out the same function as the horizontal re-sizing but with
reference to the vertical size of the last control selected.
Re-size vertically and horizontally. This tool will simultaneously re-size horizontally and
vertically.
Redistribute space horizontally: At least three controls should have been selected so this
tool can be used. The horizontal position of the selected control can be adjusted so that the same
distance exists between them. I.e., that the controls to which this tool has been applied will each have
the same distance at the sides (left and right).
Re-distribute space vertically: This tool carries out the same function as the horizontal
space redistribution but with reference to the vertical re-distribution.
Align to the left: At least two controls should have been selected so this tool can be used.
The control enables the position to be aligned to the level of the part furthest to the left of the other. To
carry out this adjustment the ‘Control’ key should be pushed and with the left-hand mouse button the
different controls to be aligned will be selected. The last control selected will be that which is taken as
a reference to carry out the alignment of the others, i.e., all the selected controls will be aligned to the
left at the level of the last control selected.
Align to the right: This tool carries out the same function as aligning to the left but to the
right of the last selected control.
Align top: At least two controls should have been selected so this tool can be used. The
control enables the position to be aligned at the level of the upper section of another. To carry out this
adjustment the ‘Control’ key should be pushed and with the left-hand mouse button the different
controls to be aligned will be selected. The last control selected will be that which is taken as a
reference to carry out the alignment of the others, i.e., all the selected controls will be aligned at the
top at the level of the last control selected.
Align bottom: This tool carries out the same function as aligning at the top, but at the
bottom of the last control selected.
190
PowerStudio / PowerStudio Scada
7.2.3 - Pages tools
Add page: This tool will make it possible to add a new page to the report. The reports can
have multiple pages with different contents. Each of these pages is linked to a single report and the
only common element between different pages of a report is formulae.
Remove page: This tool will remove the page that is active when you click the button.
Forward / Back: These tools will allow us to move around the different pages on which
the report is composed (if any).
Using this control will directly show a page of the report without having to progress
page by page with the tools described above. Clicking the control will open up a list of pages available
for the report which is active at the moment.
7.2.4 - Zoom tools
Zoom in/Zoom out: Using these tools you can zoom in or out from the image that is
currently defined for the display of the report sheet.
This control will serve to indicate a specific zoom to implement on the report sheet.
The values range from 50% to 1000%. You can also configure on the ‘Adjusted’ mode, which would
adapt the zoom to the report sheet being displayed, to appear as large as possible given the screen
resolution where the program is running.
191
PowerStudio / PowerStudio Scada
7.2.5 – Miscellaneous tools
Configure formulas: Using this tool, formulas can be defined which may be applied or
reference can be made to them or any of the report pages for which they have been defined. The
following window will appear when the button is clicked:
Clicking the right-button of the mouse over the list of formulas the following contextual
message will appear.
enabling cutting, copying, or pasting variables, both in the same report as well as enabling the copy of
formulae to be copied between different reports or SCADA screens. It may be possible that some of
the options from the context menu do not appear, cut and copy will only appear if there is a formula
selected and the paste option only if the formulae have been copied or cut onto the clipboard. If no
formulae are selected and there are no formulae on the clipboard when the right button is clicked the
context menu will not appear.
Clicking the ‘Delete’ button the formula selected will be deleted. Push ‘Add’ or ‘Modify’ to open
the formula modification window:
Where we can give names to the formula and itemize it (see appendix 14.2 Expressions and
conditions). It should be noted that there are certain formula names not permitted, therefore the name
of the formula cannot contain certain types of special characters nor be one of the reserved words.
The reserved words are those that match the name of a function available (see appendix 14.2
Expressions and conditions).
Horizontal/Vertical Orientation: This tool enables the orientation of the report sheet to be
defined. Controls do not reorganise on changing from horizontal to vertical or vice versa so it is
possible that they may no longer be seen when carrying out this kind of change. However, these
controls will continue to exist and if the change is carried out again they will become visible again.
192
PowerStudio / PowerStudio Scada
7.2.6 - Editing tools.
These tools carry out the same operations as the options from the menus ‘File’ and ‘Edit’, see
sections 2.1 File Menu and 2.3 Edit Menu.
Save. This tool allows changes made in the report to be saved.
Save as: This tool allows a copy of the report to be saved with a different name.
Cut: This tool will copy the controls selected to the clipboard and delete them from the report.
The same result will be obtained clicking the combination of “Control” + “X”
Copy: This tool will copy the selected controls to the clip board. The same result will be
obtained clicking the combination of “Control” + “C”
Paste: This tool will paste the clipboard controls in the report. The same result will be
obtained clicking the combination of “Control” + “X”
Undo: This tool allows recent changes to be reversed to edit a previous state. The same
result will be obtained clicking the combination of “Control” + “Z”
Delete: This tool will delete the controls in the report.
Select everything: This tool will select all the report controls. The same result will be
obtained clicking the combination of “Control” + “E”
193
PowerStudio / PowerStudio Scada
8 Scada
The SCADA allows us to display one or more windows, with or without a background image,
incorporating display control, turning the PC into a powerful and versatile synoptic panel of the
installation.
The aim is to generate an application, consisting of one or more screens, which can run
autonomously in the appointed facility.
A standard application would consist of a main screen which will serve as a basis for others
that will appear according to the given requirements. The number of screens is only limited by the
existing PC conditions where the program is running.
8.1 Add / Remove screen
To create, modify or delete screens in the SCADA Click the ‘screen’ option in the 'Setup'
menu. Several options will appear depending if SCADA screens have been previously created.
As can be observed in the figure, the option ‘New’ will appear which will enable a new screen
to be created followed by the name of the screens that have been created until the present (if there
are any). Clicking the right mouse button on any of the screens already in place this will lead to
options for modifying names and removing the screens.
In the case of selecting the ‘New’ option a window will appear where the name of the new
report to be created can be chosen. This name will identify in a unique way the screen in the SCADA
system.
If we select ‘new’ or directly some of the already existing screens, a SCADA screen design
window will open.
194
PowerStudio / PowerStudio Scada
8.2 Editing SCADA screens
For editing screens we must be in the edit operating mode
By editing screens it will be possible to add, change or delete screen controls. These controls
may show the value of a variable, perform an action, paint an area of the screen, and so on.
The objective of the screen is to easily display the status of the facility, allowing the situation of
the different lines of the plant to be seen, show electrical variables of the installation, etc. The
elements that allow this to be achieved will be the screen controls.
The edit window of the SCADA screen looks like this:
The window is divided into three areas:
•
•
•
Tools (1)
Information panel (2)
SCADA screen(3)
The tools will allow a simpler configuration of the SCADA screen design.
The information panel will allow access to all the configuration options of a control that is
being added to the design of the SCADA screen and that is selected at that time.
The SCADA screen is the design view from where the controls are implemented.
Thus, using the tools (1) controls may be entered on the SCADA screen (3) whose properties
may be configured in the information panel (2).
When creating a new SCADA screen, the properties of the configuration of the background of
the SCADA screen on the information panel will appear by default. These properties are the
same as those which appear if at any time there no control is selected.
195
PowerStudio / PowerStudio Scada
the
The “Show grid “option enables the grid which indicates the position of objects on
screen to be shown or hidden. If the grid is shown, the object will automatically align at the
points of the grid.
By selecting this option one of the images added to the image
manager may be selected (see section 2.2.6 Image Manager) in order to appear on the SCADA
screen
as a background.
Click on this button to delete the present background image.
If this option is enabled, the image configured as the background image is
displayed in its actual size. If disabled this will be adapted to the margins of the SCADA screen.
If enabled, this option will maintain the width and height proportions of the
selected background image. If disabled it will force the image to occupy the entire width and height of
the SCADA screen expanding or shrinking its measures as appropriate.
It enables the image chosen to be situated as the background to any of the seven
positions defined in the figure.
This button (located on the upper toolbar) will allow the characteristics of the grid to
be configured as well as the SCADA screen size being described:
196
PowerStudio / PowerStudio Scada
The width and height of the screen is measured in pixels and the size of the grid will specify, in
pixels, the distance between a point on the grid and another in horizontal or vertical. If a background
image has been selected, the size of the SCADA screen can be adapted to the size of this
background by checking box
In terms of tools, there are several grouped together depending on their use:
•
•
•
Action tools
Positioning tools
General tools
;
8.2.1 Action tools
The following action tools actions have already been explained in Chapter 7 Reports.
•
•
•
•
•
•
•
Select controls: see section 7.2.1.1
Text control : see section 7.2.1.2
Control image: see section 7.2.1.3
Date Control : see section 7.2.1.4
Formula control: see section 7.2.1.5
Conditioned control: Operates in the same way as conditioned control in the reports
but also lets the IP camera control be added. see section 7.2.1.6
Configure formulae: see section 7.2.5
In the date control, please note that it is not possible to select ‘Initial date and End date' as
they are meaningless on the SCADA screens.
8.2.1.1
Screen control
This tool will allows us to include access on the SCADA screen on the SCADA screen. The
properties than can be configured from this control are:
Here the destination screen which will be accessed by clicking on
the control entered on the SCADA screen will be specified.
197
PowerStudio / PowerStudio Scada
8.2.1.2
Report control
By selecting this option, the control will become direct access to a previously defined report
(see Chapter 7). The options available are:
Here the report will be selected to be displayed by clicking on the
running mode control.
The type of group for the data to be displayed in the report can be
chosen. If the "User Defined" option is selected, the following fields will appear
Where the period is specified from when the report can be viewed.
8.2.1.3
Device Control
By selecting this option, the control will become a direct access to the screens that show the
variables of a device. The options available are:
Using this drop-down menu the device will be selected whose
variables screen will be displayed on clicking on the control in the running mode.
8.2.1.4
Graph / Table Control
Using this option, the control will be used to make a graph or a table of one or more variables from
one or more devices. The options available are:
With a choice between graph and table.
Choose the type of graph or table you want to see.
The type of data grouping to be displayed in graphs or tables can
also be chosen.
In the same way the period can be specified for the samples for
graphs or tables.
Here the variables that are represented by a graph or a table can
be added. By clicking the button ‘add’ the variables that you want to add can be selected.
Once selected, the variables will appear on the list and be deleted by the button
198
PowerStudio / PowerStudio Scada
8.2.1.5
Active Event Control
Through this option, control will become a short cut to the display window of active events.
8.2.1.6
Event Viewer Control
Through this option, control will become a short cut to the display window of the events stored in files.
The options available are:
This will correspond to the group of events on which registers will
be
filtered.
displayed
The type of grouping may also be chosen for the data to be
in the events viewer.
The list may be displayed either complete or not.
8.2.1.7
Run Control
This tool will allow us to include access to another application present in the system in the
SCADA screen. The properties than can be configured from this control are:
Here the complete route of the application will be specified which
will be called up on clicking on the control entered on the SCADA screen. For example:
C:\WINDOWS\SYSTEM32\CALC.EXE.
application
8.2.1.8
This will specify parameters (if needed) to be added to the
call indicated in ‘Program’.
Force Variable Control
This tool will allow us to force the value of the variables that can be forced, as in equipment
with digital outputs. The properties than can be configured from this control are:
Here the variable at which the value will be forced is specified. It
can be entered manually or using the “wizard”
; (see appendix 14.2 Wizard for the creation of
expressions and conditions).
Once the variable has been specified, Clicking the ‘New’ button
will add this variable to the list of forced variables. To delete a variable from the list just select it or
push the ‘Delete’ button. All variables on the list when clicking on the control in the run mode will be
forced to the status established in each one of them, defined below.
Here we specify what action to take when the control is enabled in
the execution mode (open or close). This selector will appear when the values to which it is possible to
force the variable, is a list of specific values (for example, for a digital output the options will be open
or close). If on the contrary, the variable may be forced to any value (for example a counter) a field will
appear where you can manually enter that value. This selector will only be enabled when the following
199
PowerStudio / PowerStudio Scada
box is checked
; if this box is not checked the value that will appear in the control
will be that defined by the user from the screen in the Java Client
8.2.1.9
Filling Control
Filling control allows colour changing in homogeneous zones of the background, or
background image, (with all the same colour pixels) regular or irregular. The aspect in the edit mode is
marking the point of the pixel from where filling the area will begin. In the running mode it will not
be displayed, changing the colour of the area starting with the pixel marked by the point in the edit
mode. The properties than can be configured from this control are:
Here the condition that has to be met is specified so that the
application paints the area with the chosen colour in the run mode. It can be entered manually or
using the “wizard”
; (see appendix 14.2 Wizard for the creation of expressions and conditions).
Once the condition has been specified, click the ‘New’ button and the
condition will be added to the condition list. To delete a condition from the list just select it or push the
‘Delete’ button. When there is more than one condition on the list, the control will activate when one of
more of them is complied with.
Will allow the floodfill colour to be applied.
If this box is enabled, in the edit mode, a simulation of the final outcome of the floodfill
control will be shown, painting the area to be painted as it would be in the run mode if the selected
condition is fulfilled.
You can also select the tolerance this control will have, with a
maximum of 1000.
200
PowerStudio / PowerStudio Scada
8.2.1.10
IP camera control
The IP camera control will allow us to add the image of one of the cameras added to the
system in any area of any SCADA screen. This is an image that is refreshed in real time. The
properties of this control are as follows:
IP camera control property area
Offers the possibility of indicating from which camera we want to obtain the sequence of
images, as well as the properties which will be applied to those images relative to the control size
(these properties are equivalent to those available for controlling still pictures).
IP control camera representation in the SCADA screens editor
We also have at our disposal the button "refresh image" that will allow us to obtain and display
the last available table of the camera, so that we can see if the image arrives properly and that the
adjustment properties of the image are properly configured.
IP control camera representation with the image refreshed.
201
PowerStudio / PowerStudio Scada
8.2.1.11 Common options for the action tools
By clicking the right mouse button on the SCADA screen it will also be possible to add
controls to it. In the same way, the toolbars can be shown or hidden:
Any control SCADA inserted on the SCADA screen can be resized and moved. To re-size a
control just place the mouse pointer on one side of the rectangle which surrounds the control and
keep it pressed down while moving it in the desired direction. To move a control the left-mouse button
must remain pressed while dragging the mouse in the desired direction. It will also be possible to
move more than one control if they are grouped inside a rectangle. The left-hand mouse button should
also remained pressed at the same time to group two or more controls, drawing a rectangle with the
control we wish to move inside it.
Controls entered into a SCADA screen present the following aspect in normal mode:
When controls are selected a dashed line is shown around them:
202
PowerStudio / PowerStudio Scada
8.2.2 Positioning tools
The working of the positioning tools is the same as that which has been explained in Chapter
7.2.2 but applied to SCADA screen controls.
8.2.3 Editing Tools
The working of the general tools is the same as that which has been explained in Chapter
7.2.6 but applied to SCADA screen controls.
203
PowerStudio / PowerStudio Scada
9 Errors detection
On passing to the run mode, PowerStudio will check whether the configuration is correct,
checking possible mistakes on SCADA screens, reports, etc. Once the entire checking has been
carried out, if there are any mistakes, PowerStudio will give the opportunity of viewing these mistakes
and correcting them.
If the answer is "No", and that we do not want to see the errors, we move onto the run mode, but
it is possible that the behaviour is not as desired on those controls that contain errors. That is why the
configuration should not contain any errors.
An example of a screen with errors would be:
The list below shows the different errors found. The error information consists of the type of
resource, name of the resource and a brief explanation of the error found. The different types of
resources are
SCADA Screens
Reports
Events
When you double click the left mouse button on an error line, the program will automatically
display the SCADA screen, report or event where the mistake was found and if it is a SCADA screen
control it will select the control where that error has been detected.
204
PowerStudio / PowerStudio Scada
10 Events
The program will only show events when it is in the run mode, the edit mode is when you can
add, change or delete the different events that will be useful to warn of potential hazardous or
exceptional states in the facility.
The events may be notified. In this case the events will be shown by means of a pop-up
screen when enabled, and remain on screen until they have been recognised and disabled.
In addition for each event an invalidation timetable of the event can be defined. That is, the
periods in which the event is not valid can be defined and therefore will not be taken into account in
the software.
It will also be possible to associate a note each time that the event in enabled, for example to
save the value of a variable which has caused the event.
Finally, for each of the possible states of the events, a series of actions can be defined that
the software will execute while the event is found in each one of these states. Possible States are:
•
Activation: Will be produced when the event condition is complied with. For example, a value
has exceeded a certain limit.
•
While enabled: This will be produced
event has been enabled.
•
Recognition: Occurs when the operator carries out an event recognition action. This state is
only possible if the incident is reported.
•
Disable or restore: Occurs when the event condition is no longer fulfilled. For example: if an
event is defined such as the variable exceeds a certain value, the disabling will take place
when it ceases to exceed that value.
while the event condition is complied with, once the
The system event set up consists of event disablement calendars, groups of events and the
events themselves. If you have no need to define groups of events or event disablement calendars go
directly to section 10.3 Event Configuration.
Both timetables and groups can be defined before or after the definition of the events
themselves, however if you need to define calendars we recommend this should be done first and so
that they can be then assigned to the events when creating them for the first time. In the same way, if
you sure which groups of events are to be configured they should be defined before creating the
events so that they can be assigned directly on creating each event.
205
PowerStudio / PowerStudio Scada
10.1 Events timetables
For each event a disablement timetable can be defined. In this timetable the time zones will be
marked where the event will not be taken into account. If you do not want to disable the events you
can go directly to 10.3 Event configuration.
The zones in which the event will not be taken into account will be shown in the timetables. Unless
otherwise indicated, zones are not configured, the event will be taken into account and the program
will monitor the status of the event assessing the condition configured in the event.
To configure the events the option ‘Events timetables’ from the ' Setup ' menu should be
clicked. The following dialogue box will appear:
Where the different timetable zones are shown.
configured
3 different types of timetable can be
Daily: The disable zones for one day are configured.
Weekly: The disable zones for one week are configured. For the selection of the different
days that make up the week the previously configured “Daily” types are used.
Annual: The disable zones are configured by a calendar. As with the ‘Weekly’ type, the
days are selected from the previously configured “Daily” types.
Clicking the right mouse button on the list of timetables the context menu will appear,
allowing timetables to be copied or pasted. It is possible that some of the options in the context menu
do not appear, copy will only appear on the list if a timetable is selected and the paste option only if
calendars have been copied previously to the clipboard. If there are no timetables selected on the
clipboard on clicking the right mouse button the context menu will not appear.
On clicking the “Add” button the following dialogue box will appear:
206
PowerStudio / PowerStudio Scada
Where the type of timetable you want to add is selected. Once added, the type of timetable
can not be changed, that is if one adds a “Daily" type, when you click the 'Modify' button the “Daily”
type will be modified and in no case can the ' Weekly 'or' Annual' type be changed.
10.1.1 Daily
This type of timetable corresponds to a day. In events that have a daily type selected, the
disablement slots shall be the same for all days.
How the configuration of the types of day works is the same as explained for the types of day
for discriminators (see section 5.1.2 Types of day), with the difference that there are no different types
of hours, but rather the timetable interval is established without taking into account the events (zones
marked in red when showing the day).
207
PowerStudio / PowerStudio Scada
10.1.2 Weekly
This type of timetable corresponds to one week. In the events selecting this week type,
disable zones will be the same for every week of the year.
Alphanumeric type data which enables the
weekly type to be uniquely identified within the events timetable.
Configuration of each one of the 7 days of the week, where the ‘type of
day’ selector contains the different types of days configured (see 10.1.1 Daily), showing the
representation of the type of day selected. It will also be possible not to select any
, in which case the event will not be disabled during this day.
208
PowerStudio / PowerStudio Scada
10.1.3 Annual
This type of timetable corresponds to a calendar, where different types of days can be
configured for several years.
As with the weekly type, the different types of day that may be selected correspond to different
configured daily types.
Alphanumeric type data which permits the type of year within the
events timetable to be uniquely.
Calendar configuration is the same as that explained for the discriminator calendar (see 5.1.3
Calendar).
209
PowerStudio / PowerStudio Scada
10.2 Event groups
For a better display when it comes to showing the event viewer, allowing us to filter and show
only one type of event, the events can be classified into groups, allowing a single event to be allocated
to more than one group. The option ‘Groups of events’ from the ‘Set up menu will allow the different
groups of events to be configured.
On the left-hand list all the configured event groups will be displayed, while on the list on the
right events that have been assigned to the group selected from the list of groups will be displayed.
Allows us to add, modify or delete groups of events. On adding
or modifying the following dialogue will appear:
Where the name of the event is entered. This name will identify the group in a unique way.
Allows events from the group of selected events in the list of groups to
be added or deleted. Delete a group event will only delete it from the group and in no case will it be
removed entirely from the event set up. When you click the ‘add’ button a list with the events outside
the group will appear, where the events to be added can be selected.
210
PowerStudio / PowerStudio Scada
211
PowerStudio / PowerStudio Scada
10.3 Event configuration
To add, modify or delete events, the ‘Events’ option from the “Set up" menu should be
selected. The following dialogue box will appear:
Where configured events are shown, the disable timetable, whether it will be notified and
finally registered.
Clicking the right mouse button on the list of events the context menu appears.
Allowing events to be copied or pasted. It is possible that some of the options in the context menu do
not appear, copy only appears if there are any events selected and the paste option only if these
events have been copied to the clipboard. If no event is selected and there are no events on the
clipboard on clicking the right mouse button the context menu will not appear.
Clicking ‘Delete’ will delete the events that are selected in the list of events.
By clicking ‘Add’ or 'Modify', a new event will be created or an existing event amended. The
following dialogue box will serve to create or modify an event.
212
PowerStudio / PowerStudio Scada
The functions of this dialogue are specified as follows:
Name that uniquely identifies the event in the application.
Allows switching to be carried out between different event set
up parameters. The previous picture shows the general configuration of an event.
Condition of the event. The event will become
enabled when the condition is true and will remain disabled on the contrary. This can be entered
button (see appendix 14.2.1 Wizard for the creation of
manually or using the “wizard”
expressions and conditions).
A condition for the deactivation of the
event can be added, by checking
or not
this box this will indicate whether we want to use a
prerequisite for disabling the incident. In this case the event will be enabled when the voltage exceeds
240 and is disabled at less than 220.
Checking
or not
, this box will indicate whether the incident should
be reported or not. If the event is reported when the program is active a pop-up display will appear.
Checking
or not
this box will indicate whether the incident is registered or
not, and therefore may be displayed in the events´ browser or not.
213
PowerStudio / PowerStudio Scada
It shows the list of
groups to which the event belongs (see 10.2 Event groups ). Clicking on the ‘Add’ button brings up a
dialogue with the list of groups that the event does not belong to, allowing the groups to be selected to
which we want to add the event.
Using this dialogue groups are selected to which the event can be added, but are not currently
added.
In the Advanced tab the following parameters appear
Allowing the disable timetable of the event to be
selected. If no timetable is selected, the event will always be supervised by the application. If an event
has selected a disable timetable, if the event is active and for calendar reasons it becomes disabled
the event will be disabled.
214
PowerStudio / PowerStudio Scada
This value corresponds to the delay in activating the
event in seconds. The event will be enabled when the activation condition is fulfilled for at least the
time shown in this field. For example: if the activation delay is 5 seconds, to activate the event the
activation condition must be met for at least 5 consecutive seconds, if the conditions are met for 4
seconds, the event would not be enabled.
This value corresponds to the delay in the deactivation
of the event in seconds. The event will be deactivated, if when enabled, the activation condition no
longer fulfils at least the time shown in this field, in a similar way to the delayed activation.
Brief description of the event.
Allows an annotation to be configured which will be calculated when the event is enabled and
which may serve, for example, to ascertain the value detected of a variable that has enabled the
event. The annotations will be explained in more detail in section 10.3.1 Annotation.
Can be configured
if Rss notifications are generated on enabling, disabling or acknowledging the event. In this case only
the enabling and disabling of the event will appear. This option will only appear if the Rss of events on
the software preference screen has been enabled (see section 2.2.12 Preferences)
The arguments will
allow formulas to be configured for their use in event annotation and actions. These formulas are
calculated at the time of their use, being useful to display the value which has provoked the event as
shown in the example.
The engine actions tabs allow the actions for each state of the event carried out by the
communication engine to be configured, while for actions in the client application those actions to be
carried out by the client application are configured. The actions are explained in more detail in section
in section 10.3.2. Actions
215
PowerStudio / PowerStudio Scada
10.3.1 Annotation
The annotation of an event will correspond to a text, with a number of variable parameters
which is associated with the activation of an event.
The parameters will be replaced by their corresponding value when the event is enabled,
hence, for two different activations of a single event two different annotations may also correspond.
As previously discussed, one of the uses of the annotations is being able to register the value
of a specific variable at the time the event is enabled, so we can display extra information in the event
viewer.
Below are the different parameters that may be used in the annotation.
Parameter
%n
%c
%s
%b
%e
%d
%t
%gx
%ax
%%
Description
Name of event
Condition of the event.
Condition for the deactivation of the event
Delay in enabling
Delay in disabling
Name of disable timetable
Text associated with the event
Group Name x, where x is the order of the group within the list of
groups. The order will be displayed with a number to the left of the
name of the group.
Argument x, where x will be the order of the argument within the list
of arguments. The order will be displayed with a number on the left
side of the argument. The arguments are explained in more detail in
section 10.3.1.1 Arguments.
Character%
Each of these parameters will be replaced correspondingly when the event is enabled, for
example if the annotation is:
Event name ‘% n’ was enabled when the voltage marked %a1 V.
When the event is enabled the annotation created specifically for this activation will be:
Event name Main voltage was enabled when the voltage marked 256 V.
To facilitate the creation of the annotation, clicking on the button ‘wizard’
dialogue will appear:
Where you can choose what kind of parameter to be added to the annotation.
216
; the following
PowerStudio / PowerStudio Scada
10.3.1.1 Arguments
For the creation of the annotation a series of arguments can be defined. Each argument will
consist of a formula and representation format of the value of the formula, as can be seen in the
following dialogue:
Both the formula and the numerical format were previously described in 7.2.1.5. Formula
control.
When the event is enabled, if the argument is used to create the annotation, the programme
will evaluate the formula and will represent it in accordance with the configured format.
217
PowerStudio / PowerStudio Scada
10.3.2 Actions
For each event it will be possible to define a series of actions to be taken in each event status.
It will be possible to formulate actions both in the communications engine and for client application,
however depending on the action it will only be possible on one of them.
According to the state of the event the actions are divided into:
•
On activating: These actions are executed only once when the event is enabled.
•
While active: While the event is active, it will continuously execute this group of actions.
Caution must be exercised in configuring actions, because they are running continuously they
may block the system or connected devices.
•
On deactivating: These actions are executed only once when the event is disabled.
•
When acknowledged: These actions are executed only once when the operator recognizes
the event. This group of actions will only be available when the event needs to be notified.
By adding an action in the engine the following dialogue will appear:
Whereas if you want to add an action to the client the following will appear:
As can be seen actions that can be made by the engine are different from those that can be
made by the client application. Bear in mind when adding actions, where we want to carry them out.
Once the action has been selected the corresponding window will appear for the configuration of
these actions.
218
PowerStudio / PowerStudio Scada
Because there are incompatibilities between actions, for example it is not possible to show a
device and a screen at once, by adding more than one action the non-compatible actions will not
appear with those already added.
10.3.2.1 Forcing a variable
This action can only be done on the communications engine. It allows the value of a variable,
such as a digital output or a counter to be changed.
To configuration the action an expression must be entered, which corresponds to the variable
you want to force, and another expression that corresponds to the value at which we wish to force the
variable.
Both the variable expression and the value could be entered manually or using the
corresponding ‘wizard’
10.3.2.2 Running an external program
This action may take place in both the communications engine and on the client application.
This allows an external application that is present in the system, such as listening to an audio file.
For correct operation it is advisable to indicate in the “Program” field the complete directory
where the programme can be found in order to enable the engine and the client application the
localisation of the application required to be carried out.
In the ‘parameters’ field the parameters necessary are written for the execution of the external
application, using the arguments configured in event (see section 10.3.1 Arguments)
219
PowerStudio / PowerStudio Scada
10.3.2.3 Sending Mail
This action can only be done on the communications engine. It enables an electronic mail to
be sent to the selected addressees.
In this dialogue the message to be sent in the mail is entered. The format of this message is
similar to the event annotation (see section Event set up) allowing any of the arguments configured in
the event to be used. To facilitate entering the message the wizard can be used by clicking the button.
At the bottom a list of recipients to whom the mails will be sent appears.
For more information on how to configure the mail server see section 2.2.12 Preferences.
10.3.2.4 Show a device
This action can only be done on the client application. In conducting the action, the client
application will automatically display the selected screen monitoring device.
10.3.2.5 Show a SCADA screen
This action can only be done on the client application. In conducting the action, the client
application will automatically display the selected SCADA screen.
10.3.2.6 Show a report
This action can only be done on the client application. In conducting the action, the client
application will automatically display the selected report.
10.3.2.7 Sound Alarm
This action can only be done on the client application. On conducting the action, the
application will emit a bleep.
220
PowerStudio / PowerStudio Scada
10.4 Event Variables
Each of the events has an associated number of variables that can be used in SCADA screens,
reports, graphs and tables.
Using these variables it will be possible for example to know the status of the event on a
SCADA screen or the number of activations of the event in a report.
The number of variables associated with each event may vary depending on whether the event
is reported or is stored in the event log.
The event variables will be coded for use in formulas and expressions such as:
R$EVE_variable. name
Using the R$EVE prefix the program will ascertain that this is an event variable rather than a
device variable.
This codification can be used in formulas, graphs and tables, although in the case of reports,
graphs and tables only the variables of those events that are recorded on file can be displayed.
To obtain more information about the event variables see section 14.1.14 Event variables
221
PowerStudio / PowerStudio Scada
11 DDE – Dynamic Data Exchange
Any Windows based application which has DDE functions can establish Dynamic Data
Exchange links with PowerStudio.
The DDE (Dynamic Data Exchange) is a Windows protocol between applications. The client
mode can be used (Request data from other applications) and / or server mode (supply data to other
applications). The PowerStudio program operates in the server mode, that is, once communication is
established with another Windows application (Excel, Paradox, Word, programs in C, Visual Basic,
etc.). PowerStudio supplies this with the values read on the drivers. For example, voltage, current,
etc. can be seen in real time in Excel.
Those applications that allow a value to be forced through the DDE may modify a parameter
of the driver, such as digital outputs, internal records, etc.
The DDE communication established has the following characteristics:
)The link established is the "hotlink" type. i.e, PowerStudio warns the client applications when
the data has changed and the latter will request it if necessary:
)The program can send data via DDE to several applications, the only limitation is the memory
capacity of the PC.
)For each client a link is established for each of the variables requested.
)The DDE protocol consists basically of three elements: The Conversation, the topic, and
the item.
Conversation
Conversation is a text that distinguishes whether the applications must
be unique per application. This allows no cross questions and answers
from various applications. In our case: "PWSTDValues." For example
“=PWSTDValues|Device1!VI1”.
Topic
The Topic, as with the Item, does not have a specific meaning, it
depends on the use of each application. For the PowerStudio
programme, the Topic identifies the device from which information is
sought. For example "= PWSTDValues | Device1! VI1." When the device
name contains spaces (Device 1), it must be indicated between single
commas( ‘) "= PWSTDValues |’ Device 1 '! VI1
Item
The Item is the element that the applications request, phase voltage 1,
frequency,
status
of
the
relay,
etc.
For
example
“=PWSTDValues|Device1!VI1”.
In appendix 14.1, Variables, the expression is detailed which should be used to access the
device variables.
222
PowerStudio / PowerStudio Scada
12 Access through the PowerStudio Client
The software has a client application that will allow users to access SCADA screens, reports
and to display the instantaneous values being measured by devices either locally or through a remote
connection. Graphs can also be made, access to value lists recorded by the devices, viewing events,
seeing the status of devices, etc. Similarly this client application is available by embedding as an
Applet on the website of the application.
12.1 Web Server
The communications engines acts as a Web server configured in port 80 by default. It is
possible to host that server in another port through the corresponding option in the ‘set up’, menu and
'Preferences' submenu.
In ‘Web server - Port’ the port will be specified that is enabled for accessing the remote
computer. By default the value is 80, although it may be altered at will. The programme will warn if the
value entered is not correct.
N.B: The default port 80 should remain as such and it must not be the PC itself where the
programme is executed whether there is a Web server or another application making use of this port.
In such a case any other available port should be configured. If the communications engine was
unable to execute the web server the following warning icon would appear on the status bar (bottom
right):
If the application is minimized in the execution mode and the web server is unable to start, the
following warning will appear in the status bar of Windows:
N.B: If the box ‘Activate user authentication’, is enabled all access restrictions to device value
screens, SCADA screens, etc. It will be applied to the remote user application trying to access them
either through the client provided or the embedded client application in the webpage such as a Java
applet.
223
PowerStudio / PowerStudio Scada
N.B: It is necessary to switch over to the ‘Run’ mode for the Web server to be enabled and so
it can be accessed through the client application provided or through the applet embedded in the
website.
Client application
224
PowerStudio / PowerStudio Scada
Client application embedded as applet in the application web page
225
PowerStudio / PowerStudio Scada
12.2 Client
The client is in charge of viewing all the information generated by the communications engine
and the resource editor. The client is an independent programme of the platform as it is implemented
in Java and therefore, it can be executed in different environments as long as the Java Virtual
Machine is installed in the 1.6.0 version or later. Similarly, the client can be executed in the Windows,
Linux, Unix, Mac or OS/X environment.
The client can be executed both as a local application (AppletScada.jar) and in the form of an
embedded applet on a downloadable web page directly from the address where the engine/editor is
installed. In this last case browsers such as Internet Explorer (version 6.0 or later), Mozilla Firefox
(version 1.5 or later), Opera (version 9 or later) and Netscape Browser (version 8 or later) can be
used. It is possible however, that the client application works on other browsers or on previous
versions of the officially supported browsers.
The client application is designed with a similar philosophy to that of a web browser. This means
that the program manages a series of views (or web pages on a browser), maintaining them on a list
and enabling access to the same in different ways.
Client application with a SCADA screen as an active view
As can be observed on the previous image, the client mainly consists of 4 differentiated areas,
the uppermost menu bar, the toolbar directly below it, the active view, the centre and the status bar,
on the lower part. On the title of the window, the name of the view is being visualised at that moment.
The menu bar contains all the options available on the client application, browsing through the
views, direct access to them, general options, etc. The toolbar contains fast and direct access to the
most important options at any moment. The present view contains the visualisation of the active
resource at that time, whether it is a SCADA screen, a report, the status of the devices, etc. The
status bar contains general information on the application, indicating the status of communications
226
PowerStudio / PowerStudio Scada
with the server (engine / editor), the status of communications with the equipment, the active events,
etc...
12.2.1 Status Bar
The status bar of the client contains general relevant information about the application, such
as the status of communications with the server (engine / editor).
Status bar communicating correctly with the server
If the client application has established a connection with the engine / editor, on the left side of
the bar you'll see a green indicator and a text stating that the server is active and communicating
correctly through the address and port given. If the customer cannot establish the connection with the
server (engine / editor) this will also be indicated.
Status bar not communicating with the server
The fact that the client is unable to establish such a connection may be due to the following
causes:
•
•
•
•
The IP address or port is incorrect: The IP address or port the client is addressing for the
server is not correct, check what the IP address is and the port where the engine / editor is
configured.
The engine /editor is not running: Make sure the server program, namely the engine / editor, is
running on the machine the client application is trying to connect to.
The engine /editor is not in running mode: Make sure the engine / editor is in the running
mode as in the edit mode communication will not be permitted.
The engine / editor is not enabled as a web server: Make sure that the engine / editor has
managed to boot the web server on the specified port.
Apart from these indications, the status bar will inform about the status of communications with
devices defined in the program, indicating whether there is any impact on communications with any
device using the corresponding icon on the right side of the status bar, specifically in the left square.
Status bar communicating with the server but with errors in communication with the devices and active
events
The incidences in communications are transmitted by two icons:
•
Error in communications: There has been some kind of error in communications, either
because of a device or a connection. This icon encompasses several individual incidences, as
detailed in "Status of the devices."
•
Devices not started up: There are devices with which it has not been possible to
establish communication yet and which are unknown.
Similarly the icon corresponding to the square on the right informs us if there are active events
in the application. In this case, moving the cursor over this icon a message will appear indicating how
many events are active at that time.
Message indicating that there are 6 events active
Both for indicating communication problems with devices and active events, double-click on
the icon in question to inspect the view associated with more detail. In the first case we will go to the
227
PowerStudio / PowerStudio Scada
view of the device status and in the second case the window where events will appear. Both the view
of the status of the devices and the active events window will be discussed later in fuller detail.
N.B: The status bar can be hidden by the corresponding option in the client application menu,
specifically on the "General” option. Similarly it is possible to avoid it appearing with the option "Enable
menu and toolbar" option in the "Preferences" Engine / editor option. In the latter case it will not be
possible to make it appear again from the client application.
12.2.2 Menu Bar
The menu bar, located at the top, provides access to all features available on the client. This
bar has three main menus, "Options", "Views" and "General".
The "Options” menu consists of the following sections:
Options menu
•
•
•
•
Properties: Provides access to the properties of the currently active view. This option can be
active or not depending on the view in progress.
Print: Print view currently active. This option can be active or not depending on the view in
progress.
Export: Exports currently active view. This option can be active or not depending on the view
in progress.
Exit: Exit the client. This option is not available when the client is embedded on the website of
the application.
The "Views" menu consists of the following sections:
Views Menu
•
•
•
•
Previous: Allows the previous view to be accessed.
Next: Allows access to the next view.
Data log: Allows immediate access to any logged view.
Studio: Gives access to graph and tables views.
Study Menu
•
Screens: Allows direct access to one of the SCADA screens defined by the user in the engine
/ editor in the edit mode.
228
PowerStudio / PowerStudio Scada
•
•
Reports: Allows direct access to one of the user-defined reports on the engine / editor in the
edit mode.
Devices: Allows direct access to the monitoring device view of a particular device through the
device tree.
"Devices” Menu
•
Events: Allows access to both the logged view of events and the active events window.
"Events” Menu
•
Status of devices: Gives access to the view of the device status.
Finally, the “General" menu consists of the following options:
"General Menu”
•
•
•
•
•
•
•
•
•
Toolbar: Lets the toolbar be shown or hidden.
Status bar: Lets the status bar be shown or hidden.
Alarm if it doesn’t communicate: Allows you to set whether an alarm should sound when
there is a server or not.
Events actions: Lets us decide which types of actions associated with the events we would
like to run on the client and which not.
Connect: Connects with another server changing the IP address and / or the port.
Logout: Allows the current session to be closed. Only available when the user has connected
to a server that requires authentication.
Language: Changes the language of the client application.
Look and feel: Lets the appearance of the client application to be changed (Skin).
About: Allows access to information about the client application.
N.B: There is a possibility of hiding the menu bar using the option "Enable menu and toolbar"
in the "Preferences" option of the engine / editor. In this case it will not be possible for it to appear
again from the client application.
229
PowerStudio / PowerStudio Scada
12.2.3 Toolbar
The toolbar allows the user more direct access to the most important options at all times.
Toolbar
Thus, this bar offers the following options:
•
•
•
•
•
•
•
•
•
•
•
Previous: Allows us to access the previous view.
Next: Allows us to access the next view.
Down Arrow: Allows us direct access any logged view.
Devices: Allows direct access to the monitoring device view of a particular device through the
device tree.
Screens: Allows direct access to one of the SCADA screens defined by the user in the engine
/ editor in the edit mode.
Reports: Allows direct access to one of the user-defined reports on the engine / editor in the
edit mode.
Graph: Lets us make a graph.
Table: Lets us make a table.
Events: Gives access to the historical events view.
Properties: Gives access to the properties window of the current view.
Print: Allows us to print the current view.
It is possible to configure the buttons we want to be visible or not through the context menu of
the button bar. This menu is accessed by clicking the right mouse button on the toolbar.
Toolbar setup menu
On this menu we can define what buttons we want to show and hide.
N.B.: You may hide the toolbar completely through the main menu option within the "General"
menu. There is a possibility of hiding the menu bar using the option "Enable menu and toolbar" in the
"Preferences" option of the engine / editor. Using this latter method it will not be possible to make it
appear again from the client application.
230
PowerStudio / PowerStudio Scada
12.2.4 General options of the client application
The client application has some general options that allow enhanced customization, as well as
the configuration of some general aspects. These functions are accessed through the "General" menu
of the application.
"General Menu”
The options "toolbar" and "Status Bar" permit, as discussed previously, respective bars to be
shown or hidden.
The option of "Alarm if doesn’t communicate" indicates whether the client application should
make an audible alarm sound when the engine is communicating or not. Typically the audible alarm
consists of a series of consecutive beeps that last while attempts to connect to the engine are
unsuccessful.
The option "Events actions” lets us define what type of actions can be made on the client
application and which cannot in response to enabling, disabling or notification of events. View
changes may or may not be made or sound messages or external applications may or may not be
executed.
Menu event actions
The option of "Connect” indicates to the client application which server they must connect to.
By clicking on this option the following window will appear:
Connection window to a server
As shown in this window we can show the IP address of the server we want to connect to and
the port as well. The IP address can be numerical, as in the example above (XXX.XXX.XXX.XXX) or
the web address directly (www.midireccion.com). If we accept, the client application verifies that the
data entered is syntactically correct and tries to connect to the server using the specified address. The
previous connection will be lost because the client is always connected to a single server. This option
is not available when the client application is embedded in the website of the application as an Applet
since this only permits connections with the machine from where it has been downloaded.
231
PowerStudio / PowerStudio Scada
The option “Logout” allows us to leave the session in which the user is authenticated at the
time. This option appears only if the authentication on the engine is enabled and the user correctly
enters the required user name and password at some point.
The option of "Language" allows you to change the language of the client.
”Language” Menu
The languages available are provided by the engine / editor. On executing the client
application and connecting to the server (engine / editor) the list of available languages is requested
as well as texts relating to the local language of the machine where the customer is running. If the
server does not have the client language it will request the texts relative to the language in which the
server is configured.
The option “Look and feel" allows you to customize the appearance of the client application
windows and the interface generally.
“Look and feel” Menu
The first time the client application runs it does so under a "Metal" appearance which is
available for any environment where it runs. However, depending on the environment, other aspects
of the application will be available and the user can even install others from options available on this
menu.
It is possible that the user is viewing engine data from a PC that is in a different time zone to
that of the engine. By default, the data is shown referenced to the time zone where the client
application is running (local), but from the client application, in particular the "Time Zone" option of the
"General" menu, we can change this configuration to show the data referenced to the time zone where
the engine is (remote).
Selection of the time zone
If the engine time zones and the client application coincide the option will not appear.
232
PowerStudio / PowerStudio Scada
View of the status of the device with the Windows application aspect
The "About" option provides general information about the client, such as the version,
manufacturer, etc.
233
PowerStudio / PowerStudio Scada
12.2.4.1.1.1.1 Displaying SCADA screens
One of the most important features of the client is its ability to display SCADA screens defined
and designed in the engine / editor, both local and remote. You can display any SCADA screen
defined using the menu option "Overviews" and then "Screens" or directly from the "Screens" button
on the toolbar. However, when the client application connects to a server, the client will automatically
show the initial screen defined by the user on the server or if this is not specified, the first SCADA
screen from the list of defined screens.
SCADA screens basically consist of a background image (which may or may not exist and is
therefore white) and a series of controls placed on them. The information provided by a SCADA
screen is updated on an ongoing basis. It acts on the basis of two main types of controls, those
displaying some kind of data and those which require or allow user intervention.
The display controls simply show information on the screen. There are various types of
information which may or may not vary over time depending on the type of control. For example, a
formula varies over time depending on the values of the variables that make it up, and conversely a
static image is always fixed. Display controls are:
•
•
•
•
•
•
•
Text control
Image control
Date Control
Formula control
Floodfill Control
Conditioned control
Dynamic image control
To ascertain the scope and detailed operation of these controls see the editing SCADA screens
section.
Action controls allow the user to operate them by clicking on them. It is easy to know when we
are on a control action since the mouse cursor will change and assume the shape of a hand with the
index finger extended, rather than the typical arrow.
The typical action control lets you change your SCADA screen and provides a simple and
intuitive way to navigate through the designed application. Action controls are:
•
•
•
•
•
•
•
•
Screen control
Report control
Device control
Graph / table Control
Active events control
Event view control
Execution Control
Forcing variables control
To ascertain the scope and detailed operation of these controls see the editing SCADA
screens section.
All features of a SCADA screen are contained in the same and are fully dependent on the
design that the user has used when defining the controls used.
234
PowerStudio / PowerStudio Scada
12.2.5 Displaying Reports
Another of the prominent features of the client application is being able to see reports defined
and designed in the engine / editor both local and remote. You can display any report defined using
the menu option "Views" and then "Reports" or directly from the "Report" button on the toolbar. It is
also possible to access a particular report from a SCADA screen where a control report has been
added, which will aim directly to the report defined.
The reports consist essentially of a series of pages and each page consists of a background
image (which may not exist and hence be white) and a series of controls placed on it. The controls
available in a report are as follows:
•
•
•
•
•
•
Text control
Image control
Date Control
Control formula
Conditioned control
Graph Control
To know the scope and detailed operation of these controls see the editing reports section.
The information provided by a report is always related to a period of time and will only be
updated in response to changes in this period by the user via the lower toolbar.
Report View
Unlike a SCADA screen, in a report there are no active controls that react to user actions, so
that interaction with the report reduces the options available in the menus or toolbars, especially the
lower toolbar, which is typical of this type of view.
235
PowerStudio / PowerStudio Scada
Toolbar for reports
From the toolbar we can access the page of the report we want, using the “Pages" buttons.
This option does not appear if the report consists of a single page.
Pages Menu
Each page of the report can be expanded or reduced by the "Zoom" button on the bottom
toolbar.
"Zoom” Menu
The option "Adjust" makes the current page fit completely into the active view maintaining the
ratio aspect. If we choose an option that causes the page not to fit into the view, scrollbars will appear
to enable us to move around the actual page.
236
PowerStudio / PowerStudio Scada
View of the report with a 150% zoom
The user can change the grouping period referred to the report at any time. This is carried out
using the "Grouped by" option on the toolbar.
Grouped by Option
As can be seen, the application provides quick access to daily, weekly, monthly, quarterly and
annual reports. If the user wishes to make a report of a period that is not included in any of those predefined, it can be done by selecting the "Go" option on the toolbar.
237
PowerStudio / PowerStudio Scada
Selection window of the interval for the report
In this window the user can exactly specify the period over which you want to make the report.
Thus, the user could, for example, make a report of the first 5 days of a month, or the first 6 hours of a
day, and so on.
Irrespective of the period over which the report is made, the user can scroll to the previous
period or next (if any), this is done using the buttons "Back" and "Next" in the toolbar below. Thus, if
we are grouping by day, the button "Back" takes us to report the day prior to the current one or, if we
are bringing together a week, the "Next" button will take us to the report for the following week.
The user can print the actual page of the report at any time using “Print” in the menu “Options”
of the main menu or the "Print" button of the upper toolbar. Note that this option, unlike the SCADA
screens, is enabled for reports.
12.2.6 Displaying the status of devices
The client application offers the opportunity of checking the status, where communications are
concerned, of the devices connected to the engine / editor both local and remote. The view of the
status of devices can be viewed through the menu option "Views" and then "Status of the devices." It
is also possible to access this view using the status bar by clicking on the icon that indicates that there
are errors in communications only when there are incidents.
This view consists of a tree which details the status of all the devices connected to the engine
/ editor. The default representation of this tree is a series of father nodes that represent the equipment
connected directly to the PC where the search engine is running, from where a series of sons nodes
which represent the equipment connected to the device are rooted.
238
PowerStudio / PowerStudio Scada
View of the status of the device per connection
Each node has an icon which represents the status of the communications of the equipment.
Thus, we find the following states are possible:
•
•
•
•
•
•
•
•
•
•
OK: The equipment communicates properly.
Downloading of the device: We are downloading data from the device at this
time.
Error in connection: The connection where the device can be found presents
problems.
Device not started up: Attempts were being made to establish communication
with the equipment at this time for the first time. This process is necessary initially to
ascertain the configuration of the equipment.
Failed communications: Unable to establish communication with the equipment,
response time is exceeded.
Incorrect version: The equipment communicates correctly but it is a version
which the programme does not support. Perhaps it is an old version.
Phase error: The equipment communicates correctly but some phase connection
is incorrect.
Channel error: Unable to open the communication port. This action must be
carried out to establish communication with the device.
Failed communications: Some of the devices connected to this equipment do not
communicate properly.
Camera transmitting images: The engine is receiving images from the camera as
the client application is requesting them.
239
PowerStudio / PowerStudio Scada
•
Camera paused: The engine is not receiving images from the camera because
they are not necessary because they are not being requested by any client
application.
Error on the memory card. The SD Memory Card is invalid, write-protected or not
•
present.
When selecting a device from this tree (any node), on the right panel, we can see the
characteristics of it. Typically these features are a picture of themselves, the type of device, the name,
description and device number.
This tree can be completely folded down quickly by clicking the right mouse button. It also can
be folded down completely by clicking the middle mouse button, which is usually accessed by clicking
the scroll wheel on it.
The device status tree can be organised in two ways, by connection or by type of device. To
change the representation of the same, access the option of "Properties" from the toolbar or the
equivalent option in the “Options" menu, after which you will get the following dialogue:
Selection of the device status tree organisation
240
PowerStudio / PowerStudio Scada
Status of the devices organized by type of device
12.2.7 Displaying a device
The client application can visualize all devices in real time. Thus, each device provides one or
more overviews that allow the status and values of the same in real time to be ascertained. This view
can be accessed through the menu option "Views" and then "Devices" or directly from the button
"Devices" in the toolbar. In both options the user should search through the device tree.
Device tree according to the organization defined by the user
You can also access the display screen of a particular device from a SCADA screen where a
control device has been added.
A device display screen can have multiple aspects. Devices mainly define two types of
screens, one analogue and one text (numerical). The analogue view presents most of the values in
maximum, minimum and present bars, while the current view of the text presents them in the text form
and organized in different ways, usually in tabs.
241
PowerStudio / PowerStudio Scada
A common element on all the display screens is that there are numerical values for the
variables which refresh in real time and can be selected to be used when making graphs or historical
graphs (trends).
Another common element is that on most displays there is an upper bar specifying the status
of the device, and the name and the date on which the values displayed were read.
Device display screen (text view)
As can be seen on the previous screen the values of the different variables are organized both
in tabs, in graphs, tables, rows and / or columns for easier localisation. Similarly some of the variables
selected can be seen, marked by white letters on a blue background. Another common element
among the different overviews of the devices is that limits can be set on the variables values, so that
they can be marked with one colour or another depending on the interval.
242
PowerStudio / PowerStudio Scada
Screen display device with off-limits values
As can be seen in the previous screen there are values which exceed the limits defined.
Similarly, how some variables are selected is also shown (blue background with white letters).
The analogue view provides approximately the same information but in a more graphic way,
so that we can visualize the limits defined as a bar graph.
243
PowerStudio / PowerStudio Scada
Device view. Analogue Representation
Devices providing more than one representation (typically two) can be exchanged with each
other by selecting "Properties". This option can be accessed from the “Options" menu or from the
button "Properties" from the toolbar. This option will be disabled for those devices that only have one
possible view.
View selection of a device
The information about the devices does not only show the numerical values or bars organized
into tabs, boxes, rows and / or columns, but can also appear in other forms, depending on the type of
device in question. A typical way to represent the information would be graphically through descriptive
images of the status of a variable or set of variables.
244
PowerStudio / PowerStudio Scada
Displaying an RRM-C with an image representing the status of the relay
Displaying a C-14D with images representing digital output status, alarm status, etc.
245
PowerStudio / PowerStudio Scada
Similarly other mores specific ways to represent the information can be found, such as the
QNA phasor diagram.
QNA Screen display with the phasor diagram
Another noteworthy device display screen is that which corresponds to the IP camera. This
screen displays the camera image which is updating in real time (speed of updating depends as much
on camera settings as the configuration for refreshing when adding this device, as well as the speed
of the TCP / IP network)
246
PowerStudio / PowerStudio Scada
IP camera display screen
In addition to the information already mentioned, some devices allow interaction with the
device itself or with the outside environment through the same screen display. An interaction provided
by many of the display screens on the devices offers the possibility of resetting the maximums and
minimums. This action is accessed via a button situated somewhere on the screen.
Display screen of the equipment with maximum / minimum reset button
247
PowerStudio / PowerStudio Scada
Clicking on this button a window will appear where we can select exactly which values we
want to restart. Each device provides a window for selecting different variables, depending on the
type, the same type of device may even offer a separate window depending on how it is configured.
“Maximum / minimum reset window
Another typical interaction is by clicking on a button. This can include many different kinds,
from acting on any digital output of the equipment or on any aspect of the configuration, to launching a
special graph or viewing the table of historical events.
Buttons to launch special graphs on the QNA screen
There are devices that provide more elaborate interactions, enabling adjustments and more
complex configurations by clicking on a button through a specific configuration window. For example,
RGU-10 type devices allow current triggering values and trigger delay to be adjusted.
248
PowerStudio / PowerStudio Scada
RGU-10 parameter adjustment window
From the monitoring view of a device it is faster to make a graph or a table, either through a
direct button in the view itself (as in the case of QNA equipment) or directly by clicking on the
corresponding buttons on the toolbar. This second option will be explained in the following section.
12.2.8 Making graphs
One of the most powerful tools of the client is the possibility of making graphs of the variables
of the equipment (trends). This view can be accessed through the menu option "Views" and then
"Studio" and finally “Graph” or directly from the “Graph” button on the toolbar. Graphs can be made
from a predefined SCADA screen where the graph control has been added or as commented in the
previous chapter, from the buttons defined for this purpose in some types of device monitoring views
(e.g. on the monitoring view of a QNA).
Typically, to make a graph the variables of the device which will be part of it need to be
chosen. Thus, when accessing the “Graph option” from the main menu or from the toolbar, firstly a
dialogue will appear that will allow us to select the device from which we want to choose the variables
that will be part of the graph.
Device selection screen
249
PowerStudio / PowerStudio Scada
Despite the fact that at first we can only choose variables from the same device to make the
graph, later we can add variables from other devices (this will be explained later). If we access the
“Graph” option while we are in monitoring the view of a device the client application will understand
that we want to make a graph of what is being displayed and will skip back to the previous screen.
According to the device chosen, a screen will then appear to select the type of graph and the
discriminator to be applied.
Selection Screen choice for the type of graph and the discriminator
Note only certain types of graphs can be discriminated, usually the standard type, if the graph
type chosen cannot be discriminated the “Discriminator” option will be disabled. If a default
discriminator has been defined for the equipment, although a different discriminator can be applied or
modified or even no discriminator. It is also possible that the equipment does not allow more than one
type of graph and that there are no discriminators defined or they are not applicable to this type of
graph, thus this screen will not appear and will pass directly to the selection of variables of the device
in question.
After selecting the type of figure and the discriminator, the selection screen of the variables
will appear.
Selection of variables to make a standard graph without the CVM-144 discriminator
Here the variables we want to form part of the graph are chosen. This screen will depend on
the device, the type of graph required and the discriminator we want to implement these variables.
250
PowerStudio / PowerStudio Scada
For example, if a discriminator is chosen a screen similar to the following may be found:
Selection of discriminated standard variables
If we select a non-standard type of graph, for example, a harmonics graph, we find a screen
for selecting variables like the following:
Harmonic variables selection screen
Finally, once the selection of variables we want to display has been carried out, the view of the
graph with the representation of the variables in question will appear.
The system automatically chooses the representation period and the grouping of data, which
can obviously be changed later. Later we shall explain what the two concepts mean and how they can
be changed. It should be noted that the grouping chosen is a week and the period is typically 30
minutes. If the graph we are accessing comes from graph control on a SCADA screen, both the
grouping and the period are determined in the control and need not be predetermined by default.
However, as always, both properties can be modified in the graph view later. Similarly certain types of
representations are chosen by default (line, bars, etc.), as well as a few colours and a distribution of
the variables in axes and areas depending on the variables represented. All these characteristics can
be modified later at will. A description of what they mean and how they are modified will be explained
later.
251
PowerStudio / PowerStudio Scada
Graph of a standard variable without discrimination.
As can be seen a typical graph consists of a series of common characteristics:
•
•
Title: Situated on the upper area, this is a text describing the graph we are viewing. Typically
we find the name of the devices which form part of the variables we are viewing. They may
contain several lines of text, so that they can be represented as subtitles.
Areas of representation: These are areas where data can be viewed. Typically a graph
usually consists of an area, as in the previous example, but there may be several, each under
the following area. Each area contains some common characteristics:
o Key: Provides general information about the variables that are represented in the
area. This information is often the colour of the variable, the type of representation,
the title of the graph, and in some cases, a value indicating some feature of the
variable for the current representation (for example it is typical to see on energy
variables the accumulated value of all the visible values).
o Y-Axis: Provides information on the units of the variables that are represented in this
axis and the range of values that are being displayed. At first the range is calculated
so that they fit all the values of all the variables included in this axis. Typically an area
has a y-axis, although this may be modified by the user as we shall see later.
o X-axis: Typically this is the time axis and is located at the bottom of the
representation area. Here the time interval being represented can be seen. Usually
predefined time intervals are represented (day, month, etc.). But the user can choose
the most suitable as can be seen later. Similarly, there are types of graph where this
axis does not represent time, in this case the units represented and the range of
values contained will be indicated.
o Drawing area: Contains the actual figure representing the variables of the area in
question. There is a drawing area for each area of representation.
252
PowerStudio / PowerStudio Scada
•
Toolbar: Contains a series of actions that can be performed on the graph. Depending on the
type of graph it will contain more or fewer options. The typical actions are going to the
previous interval, going to the next, going to a user-defined interval, grouping according to a
predefined interval or changing the grouping period.
Any graph can always be found in the so-called "operating mode", which determines the
behaviour of the drawing area and the use of the mouse on it. There are four possible modes of
operation:
•
•
•
•
Zoom mode: Lets enlargements be made on one portion of the graph. This mode is
accessed through the F1 key or the corresponding option of the context menu of the graph.
Pan Mode: Lets the present window be moved using the mouse, dragging and dropping. This
mode is only available if a Zoom has been carried out before and it is accessed by the F1 key
or the corresponding option of the graph context menu.
Tooltip Mode: Lets us see the values of the variables in the position of the mouse cursor.
This mode is accessed through the F3 key or the option corresponding to the context menu.
Magnifying glass Mode: Enables the area under the mouse cursor in a separate window to
be amplified. This mode is accessed through the F4 key or the option corresponding to the
context menu.
Context menu of a graph
253
PowerStudio / PowerStudio Scada
12.2.8.1 Zoom mode
The zoom mode allows us to make extensions on a portion of the drawing area with the
mouse. When we are in this mode the mouse cursor looks like a magnifying glass.
Appearance of the cursor in the zoom mode (when it is possible to start zooming and when not)
As can be seen the cursor will tell us whether we are on an area where it is possible to start a
graph expansion or not (typically because we are outside of the drawing). To start an enlargement
click on the left mouse button on the drawing point we want to be one of the corners of the new
viewing window and, without releasing the button, move the mouse to the point of drawing we want
to be the opposite corner of that window.
It is interesting to see that while moving the mouse discontinuous lines indicating what will be
the new viewing window will appear if we release the button. Equally the cursor informs us whether
the window we are selecting is not valid as a new viewing window by changing the appearance of the
mouse cursor.
The new viewing window is invalid or is not permitted
This may be because it is too small, narrow or wide, both in window units (pixels) and variable
units, both in the X axis and the Y. For example, if we have a variable with a period of one hour we will
not be allowed to make an extension of an area of the drawing of less than an hour on the X axis.
Making an extension of an area of the drawing in the Zoom mode
254
PowerStudio / PowerStudio Scada
By releasing the left mouse button we accept the discontinuous window as a new display
window. The action will be automatically executed and we will be able to see the enlarged area that
we have chosen.
Graph with the enlargement of a specific area
The process can be repeated as many times as desired, provided that the system permits it.
Enlarging enables the "Pan mode"; that we shall see later, as well as the options of "Remove the last
zoom" and "Without zoom" in the context menu.
The option "Remove the last zoom" allows us to return to the previous enlargement, namely
the display from where the present enlargement took place while the option of "Without zoom" allows
all enlargements to be done away with in one go.
Enlarging a chart with several display areas is worth commenting on. If we make an
enlargement on a graph of this type it can be seen that areas marked off with dashed lines in the
display area can be observed, but they also appear in other areas too, selecting the same interval X
(usually time).
255
PowerStudio / PowerStudio Scada
Zooming in with a graph with several areas of representation selected in the first zone
This behaviour is defined by default, giving priority to conserving the same X-axis in all areas
(it is usually useful to compare values with the same dates or intervals, and therefore does not apply if
the X- axes are different and is only included in the enlargement of those areas with similar X-axes ,
although they are not consecutive). Note that when the enlargement is carried out in more than one
area all the new selections are horizontal.
The behaviour of "Zoom mode" can be changed by varying the idea previously discussed
using the "Control" or "Shift" keys while selecting the new display window.
The "Control" key forces the selection to include only the area where the enlargement is being
made; therefore if the graph consists of a single area this modifier has no effect. If the enlargement is
being made between two different areas (one corner of the new window is in one area and the other in
a different area). This forces only the areas between the two to be included.
For example, if we start the enlargement in the first area and finish in the second only these
two areas and not the third will be enlarged. A curious effect caused by this mode is that areas with
different X-axes can appear. In addition, this behaviour does not take into account whether the X-axes
are equal or not, always forcing the enlargement regardless of this information, thus allowing the
expansion of two zones with different X-axes something that would be impossible with the default
behaviour.
256
PowerStudio / PowerStudio Scada
Graph with areas with different X axes (the first zone has an X-axis different from the other two)
The “Shift" key forces the enlargement to only affect the X-axis, even in the area where the
expansion is taking place, but keeps the enlargement of all the areas maintaining the X-axis as in the
default behaviour. Note that if a graph consists of a single area this change in behaviour causes the
non-selection of the new viewing window not to affect the Y-axis
The combination of behaviours, Clicking the "Control" key and the "Shift" key at the same time
will enable us to enlarge graphs with more than one representation area, a single area depending on
their X-axis. The user can freely combine the various behaviours in successive enlargements.
12.2.8.2 Pan mode
The "Pan mode" is available when there is an enlargement carried out and it enables us to
move the viewing window using the drag and drop technique. When we are in this mode the cursor
looks like a hand.
Appearance of the cursor in the pan mode (when it is possible to start the pan and when not)
As you can see the cursor will tell us whether we are on an area where it is possible to initiate
the movement of the viewing window or not (typically as we are out of the drawing zone). To start a
movement click on the left mouse button on the point of the drawing you want to use as an anchor
and, without releasing the button, drag the mouse until we have moved the window to the desired
location. Note that the window moves in real time with the mouse movement.
257
PowerStudio / PowerStudio Scada
It is interesting to see that once the anchor is positioned the mouse cursor will change to tell
us that we are able to move the viewing window.
Cursor indicating that we are able to move the viewing window
The movement is limited by margins of the viewing window before making the first
enlargement, therefore, if we are viewing a week of data we cannot move to the previous or following
week using the pan option or on top of the upper margin of the Y-axis or below the lower of the axis
itself.
When we have a graph with more than one display area the pan mode establishes, by default,
behaviour through which all areas with the same X-axis as the area where the anchor is established
must move. This behaviour can be changed by using the "Control", key if we keep the key held down
while we move the window we indicate to the programme that only the window on which the anchor is
established must move. This will cause the X-axes to be no longer matched.
Graph with all the display areas with different X-axis
258
PowerStudio / PowerStudio Scada
12.2.8.3 Tooltip mode
The "Tooltip mode" allows us to see the values of the variables located closest to the cursor
with respect to the X-axis. These values are updated instantly as you move the mouse cursor. When
we are in this mode the cursor looks like a hand.
Cursor indicating that we are in the Tooltip mode
The mode behaves in such a way as to show the values closest to the mouse position with
respect to the X-axis of all the areas that share the same X-axis.
Graph in Tooltip mode
As you can see, for each area of representation with the same X-axis a window is shown with
the value of the X-axis (typically the date) and information on the variables that are represented in this
X position (typically the variable name, its value and its units).
You can change the behaviour of this mode by clicking the "Control" key, so as to show only
the information window of the area on which the mouse cursor can be found at any time.
In graphs with a high density of values the case may arise that several different values with
different X coordinates of a variable fall into the same position of the mouse. In this case there will be
no values accessible through the mouse cursor movement. To access all the values without omitting
any we can move the value display window using the cursor keys (left or right), these keys allow us to
move to the value immediately before or immediately after the current although this is drawn in the
same position of the screen.
259
PowerStudio / PowerStudio Scada
Some types of graphs can give the situation that on the same X-coordinate there is more
than one value of the same variable, this does not happen if the X-axis is time, but it can happen in
other cases, as for example in an event duration graph, which will be seen later. In these cases the
maximum and minimum value of each variable in that X-coordinate will be shown.
12.2.8.4 Magnifying glass mode
The "Magnifying glass mode" allows us to see an expansion in a separate window for the area
around the position of the mouse. The enlargement window is updated instantly as you move the
mouse cursor, always showing the area around it.
If we enter on the magnifying glass mode and the cursor remains on the representation area
an enlargement window will automatically appear and a dotted box will appear in the drawing area
indicating that the area is enlarging, represented by the mouse cursor, and we can move around as
we wish, automatically displaying the enlargement in the superimposed window.
Zoom mode graph with an extended zone
If we leave the representation area the enlargement window will disappear, and on returning
there, the mouse will have the following aspect:
Mouse cursor indicating that we are in the Magnifying mode in the area enabled for this
260
PowerStudio / PowerStudio Scada
This will tell us that we are in magnifying glass area and that we can enable the enlargement
area when we so desire (clicking the left mouse button). Logically, the extension window can be resized and positioned as we wish like any other window.
Another possibility is to vary the size of the square area around the mouse cursor we want to
expand. This can be done through the mouse wheel or, if the mouse does not have this feature,
through the “+” keys "(greater square area) and" - "(smaller square area).
12.2.8.5 Toolbar
The graphs always have a toolbar at the bottom that allows a series of actions related to the
data to be shown.
Toolbar of a typical graph
The typical options available in the toolbar are:
•
•
•
Previous: Allows access to the previous interval of data. Typically the range of previous data
is the function of the grouping of data and, if we group data by days on going to the previous
interval we will see the data of the previous day being displayed. There are types of graph
where grouping does not make sense since they are viewing values of a specific date (for
example in QNA harmonics graphs), in this case by clicking on this option we will see the data
corresponding to the date immediately after that containing data.
Next: Allows access to the next interval of data. Typically the interval of data following this is
based on the grouping of data and, if we grouped data by weeks on going to the following
interval we will see the data from the following week being displayed. There are types of
graph where grouping does not make sense since they are viewing values of a specific date (
for example in QNA harmonics graphs), in this case by clicking on this option we will see the
data corresponding to the date immediately after that containing data.
Go to: Lets us look at data within a time interval defined by the user. There are graphs where
it makes no sense to specify an interval and what it permits is to indicate the exact date that
we want to see (graphic harmonics in QNA).
Interval selection of the data to be visualized
261
PowerStudio / PowerStudio Scada
Dialogue selection of the date to be visualised
•
Grouped by: Allows us to change the grouping of data. The grouping is just the interval of
data we want to visualize. Typically there are five predefined groupings: day, week, month,
quarter and year.
Selection Menu "Grouped by”
•
Period: Enables the period in which we want to see the data to be specified. Each device can
be configured to store data every so long, typically in periods of 10 or 15 minutes. Through
this option it is possible to indicate that we want to see data with a different period, which must
always be higher than that defined by the device. Note that this does not change the
configuration of the device, which will continue saving with the period configured from the
engine / editor, but will group the data, to a certain extent, to simulate the fact that the device
was programmed for that period. Note that there is an "Automatic" option; this option indicates
to the program to choose the period that best suits the selected grouping.
Period selection menu
Note that there are special graphs where the last two options (“Grouped by" and "Period") are
meaningless and therefore not available.
262
PowerStudio / PowerStudio Scada
12.2.8.6 Graph properties
It is possible to configure many more aspects of the representation using the “properties”
option of the graph. This option can be accessed through the menu “Options”, submenu "Properties"
or directly through the button "Properties" on the main toolbar.
Suppose we have made a graph of the variables of the three phases of the voltage and the
voltage distortion in phase one and the phase one and two current of the QNA measuring equipment.
The client will provide us with a view of the graph with default configuration, namely a graph grouped
as a week, set at the current week, with 30-minute periods, with three areas of representation (one
where all three voltages are placed, another where the distortion is placed and a final one where the
two currents are placed) etc.
Graph with variables from a QNA
To change the graph properties we access the option previously indicated and a window
similar to the following will appear:
263
PowerStudio / PowerStudio Scada
Properties window of a graph
This window will allow us to make the following changes on the graph:
•
•
•
•
•
•
Modify the representation of each variable (lines, bars and points)
Change the colour of each variable.
Modify the y-axis margins.
Remove areas, axes and variables.
Add areas, axes and variable.
Change the distribution of the areas, axes and variables.
As can be seen in the previous window a schematic representation of the variables and their
organization in areas and axes is shown. When the mouse is moved over this representation those
elements that we can modify, i.e. variables, axes and areas will be highlighted.
264
PowerStudio / PowerStudio Scada
Select a variable, and click to change the properties of the same
If we want change, for example, the representation properties of the phase 1 voltage distortion
variable, place the cursor here and click with the left mouse button.
Screen configuration of the representation of a variable
This screen will allow us to configure the type of representation (Lines, bars, or points), colour,
line style (only if you select the type of representation in the form of lines), the dot style (only if you
select the type of representation in the form of dots) and the thickness of the line (only if you select the
type of representation in the form of lines).
In the event that we have selected the type of representation in lines, we can choose the style
from five different possibilities, solid, dashed, dotted, dash –dot and dash-dot –dot .
Selecting the line style
We may also choose the line thickness.
265
PowerStudio / PowerStudio Scada
Selecting the line thickness
If the kind of representation we have selected is dots, we can select the type of dots.
Selecting the type of dots
Suppose that in the example we modify the representation of the bar variable and change the
colour to a deep lilac. Note that it is possible to change the colour for any kind of representation by
clicking with the left mouse button on the colour chart.
Selecting the type of bar representation bar using lilac
This selection will be reflected in the screen properties of the graph.
266
PowerStudio / PowerStudio Scada
Change in representation properties of a variable
A final property that can be changed on a variable is its position on the overall chart. To make
this change simply drag the variable that we want to modify to its new location. While dragging the
variable we will be informed of the positions where we can "drop” the variable and where not, using
the red or green squares. Thus, a variable cannot be "released" on another variable (does not make
sense) or on an axis (with a white background) with units different to those of the units of the variable
that we are "releasing". We can, however, "release" the variable on any area (even on the same area
but in another position), on an axis that has the same units as the variable that we are "releasing"
(even within the same axis, but in another position) or "out", i.e. between areas on the first zone or
under the last.
If we "release" the variable on an axis with the same units the variable will be added to that
variable in the order in which we have entered it. The order in which they are placed is the order they
are painted, so that the last variable of an axis is that which is painted in the last place and, therefore,
that which will be represented on the others (and therefore can hide the others). It is often useful to
place the variables representing bars in the first place because otherwise they will almost entirely hide
the others.
If we "release" the variable on a zone a new axis will be created in this area. This new axis will
share the drawing area with the other axes of the area and will be painted in the order in which they
have been "released".
If we "release" the variable "outside” an area will be created with an axis in that position. It
should be borne in mind that if the variable was the only one on the axis, that axis will be removed and
if, moreover, that axis was the only one in your area, that area will be removed as well. We can also
drop that variable in the trash, at the bottom of the graph properties screen; this action deletes the
variable of the graph. In the example we are going to move the distortion variable in the area where
the currents are, at the top in order for it to be painted first.
267
PowerStudio / PowerStudio Scada
Moving a variable in another area
With this we can create a new axis within the area where the currents are found. Note that the
area where the variable was found has disappeared and, therefore, and now the graph contains two
areas. Note also that in the second zone, the distortion axis is painted first, and therefore the distortion
variable of phase 1 and after the current, first phase 1 and then phase 2.
In this case we get a graph as follows:
268
PowerStudio / PowerStudio Scada
Graph with two zones and two axes in an area
The axes of a graph can also be configured through the properties window. To do so, once in
this window, you must click on the axis that we want to configure and the following window will appear:
Configuration window of a shaft
We can see that this window will allow us to force the limit values of the axis in its Ycoordinate. By default the graphic engine defines the limits which enable all the value of a variable to
be shown, however it is possible to modify them manually through this option. In the example we are
going to force the minimum Y limit value of the axis where the voltages of the phases are zero.
269
PowerStudio / PowerStudio Scada
Properties with the minimum limit of a forced axis
Note that on the axis units of the properties the units, the equipment the variables in brackets
belong to (provided the variables are from only one device) and the limits of the Y-axis (the minimum
and maximum value, in bold if this value is forced by the user) can be seen.
Like variables, axes can redistributed using the drag and drop method. The operation is the
same as dragging and dropping a variable. So, an axis can be released on another with the same
units, on another area (or on the same area but in another position), or "out" in the trash (deleting all
the variables contained).
270
PowerStudio / PowerStudio Scada
Graph where we have forced the interior limit of a Y-axis
Finally, the only configuration of the areas that we may change is its position. So, like
variables and axes, a zone can be dragged to another position, but only within another, "outside" or to
the trash (deleting all axes and variables that it contains).
Trash
One of the most interesting possibilities offered by the property screen is to add new variables
to the chart. This is done by clicking on the button with the sign “+” "located on the lower left.
Add new variables to the graph
Then we have the windows for selecting equipment and variables, allowing us to add other
variables, including from a different device. In the example we have added a phase 1 voltage variable
from other equipment.
271
PowerStudio / PowerStudio Scada
Adding a variable from another device
Note that the device information has disappeared from the axes and appears on each variable
because now there are no variables of a single device represented. The new variable (or new
variables, if we had chosen several) are organized into new areas at the end and the limits of the new
lines are unknown because the limits have not yet been loaded with data, although they may be
forced by the user.
In the example we have dragged the new variable onto the axis of the first zone, particularly
on the top of the axis, leaving the new variable as the first on the list. Note how the axis limits have
been inherited where we have released them.
272
PowerStudio / PowerStudio Scada
Variables of different devices in the same axis
One detail to remember is the fact that dragging the variable to its new position we have two
variables in the same axis, and the same area, with the same colour. This may be a problem for
display.
There are two ways to solve the problem, the first is to change by hand the colour of the
representation of one of the variables and the second is to let the program decide the appropriate
distribution of colours by itself. This latter is done by clicking on the button represented by a brush.
Intelligent distribution colour brush
Clicking on this button the program will decide whether there are any problems with displaying
variable colours and will change the variables that it deems appropriate.
273
PowerStudio / PowerStudio Scada
Intelligent automatic change of colours
The resulting figure would be as follows:
Graph with variables from multiple devices
274
PowerStudio / PowerStudio Scada
12.2.8.7 Printing a graph
The user can print the actual page of the graph at any time using “print” in the menu “Options”
of the main menu or the "Print" button of the upper toolbar. Note that this option, unlike that in the
SCADA screens, is enabled for graphs.
12.2.8.8 Export graph
The user may at any time export the graph being viewed in a PNG format. This option should
be accessed through “Export" in the “Options" menu of the main menu. Note that this option, unlike
that in the SCADA screens, is enabled for graphs.
Note that when you export a graph this is done with a white background to facilitate the
inclusion of it in reports, studies, etc.
12.2.8.9 Types of graph
So far we have seen standard graph types, i.e. a graph which consists of a number of areas,
and where each zone has an X-axis which is a time interval while the Y-axis are the values of the
variables. However, there are certain types of graphs that have certain distinct characteristics.
A special graph would be a harmonics graph. This chart is provided by equipment which
calculates harmonics variables, whether it is voltage or power. For example, we find this kind of graph
on QNA equipment, among others, and can provide the outage of voltage in each phase.
Harmonics graph
This type of graph has some special features:
275
PowerStudio / PowerStudio Scada
•
•
•
•
•
Subtitle: In the caption under the title of the graph, indicating the date to which the harmonic
decomposition being viewed belongs to.
X-axis: The X- axis does not represent time, but the harmonic number. It therefore lacks
units.
Toolbar: The toolbar contains only 3 buttons that will allow us to move to other records,
namely it will enable us to move to earlier records, to the following ones or go directly to the
records closest to a date specified by the user ("Go to" option).
Properties: The configurable properties of this type of graph are the same as with a standard
graph, the only difference being that only variables from equipment containing this type of
variable are available.
Representation using bars: As a special feature, this adopts bars as a default
representation, but these can be set up afterwards.
Another special feature graph is the waveform graph, generated by QNA equipment, which
can provide a screenshot of the voltage waveform and the current in each one of the phases.
The characteristics of this graph are very similar to the harmonics graph. The only differences
are that the X-axis units are milliseconds and that the representation is in lines by default. Only
variables of this type may be added to this type of graph, i.e., waveforms.
Waveform graph of a QNA
Another special graph is the event duration graph
276
PowerStudio / PowerStudio Scada
QNA event duration graph
This type of graph represents the voltage events registered during a period of time, organized
according to their duration. This graph has some special features:
•
•
•
•
•
•
•
X-axis: The X-axis represents the duration in milliseconds.
Representation Interval: The events of a time interval configurable by the user are
represented.
Toolbar: The toolbar allows us to move through the time intervals, as well as defining a new
time interval, either pre-defined or fully configurable by the user.
Representation: The representation chosen by default is in dots, although it can be changed
at will.
Tooltip: It is typical to see in such a figure a special tooltip indicating the number of values of
the variable that there are just at this point and between which values it can be found as it is
normal that many values are repeated with certain duration.
Subtitle: Unlike the harmonics and waveform graph, the subtitle here will tell us the time
interval we are viewing.
Adding new variables: Only variables of the type we are viewing can be added, i.e., duration
of events.
Another unusual graph is that of logged events.
277
PowerStudio / PowerStudio Scada
Graph of logged events
This figure is essentially equivalent to a standard graph, with all the characteristics of one. The
only difference is that each event is depicted as a dot plus a horizontal line whose length equals the
duration of the event represented.
Usually the values of events this graph shows are accompanied by nominal voltage. In both
cases the units are expressed as a percentage of the nominal value. Any other standard variable may
also be added.
The last special type of graph is the semi-circular effective voltage graph.
278
PowerStudio / PowerStudio Scada
Semi-circular effective voltage graph
This type of graph represents the evolution of the voltage in a short space of time in semicircular intervals. These screenshots are made in response to the capture of an event at that time.
Very similar to the waveform graph, with the only difference being that the x-axis consists of
dates as in a standard graph, as the semi-circle value capture takes place just at that moment.
279
PowerStudio / PowerStudio Scada
12.2.9 Making tables
Another important client tool is the possibility of making value tables of the variable on a piece
of equipment. To access this view we can do it through the menu option "Views" and then "Studio"
and finally “Table” or directly from the “Table” button in the toolbar. You can make tables from a
predefined SCADA screen where a control table has been added or from buttons defined for this
purpose in the monitoring view of a device (for example, the monitoring view of a QNA).
Typically, to make a table it is necessary to choose what variables from which devices will be
part of it. The selection of these variables is done in the same manner as for generating a graph. After
making the selection we get a table like this:
Table of values
Note that the typical value table consists of three parts:
•
•
•
Title: This usually indicates what data period we are viewing, although in special tables it may
contain other information.
Body: This contains a series of columns with the values each variable has in each register.
Each column is a variable and contains a header with the same title.
Toolbar: As in the graph, the grouping and the period of the data displayed can be
configured.
There is a direct equivalence between the tables and graphs, that is, the same type of graph
and table show the same values but in different formats and, obviously, with different configuration
capacities.
This feature is used by the PowerStudio client to deduce what graph or table we want to carry
out when on a graph or table display. That is, if we are displaying a chart and we click on the button of
280
PowerStudio / PowerStudio Scada
the client table, PowerStudio will deduce that we want to see the representation as a table of the
variables represented in the graph, and will immediately show this. Similarly, if we are viewing a table
and we click on the graph button, PowerStudio client will deduce that we want to see the graph of the
variables shown on the table.
The operation of the toolbar is absolutely the same as the operation of the same bar on the
graph view.
It is possible to configure some aspects using the option of "Properties" from the table. This
option can be accessed through the menu “Options”, submenu "Properties" or directly through the
button "Properties" on the main toolbar.
Properties Window of the Table
Through this window you can add new variables to the table in the same way as they are
added to the graph, by clicking on "Add". It is also possible to delete variables from the table, simply
by selecting the variables that we want to remove and clicking on the “Delete” button.
As with the graphs, the user can print the actual page of the graph at any time using the “Print”
option in the “Options” menu of the main menu or the "Print" button of the upper toolbar. Note that this
option, unlike that in the SCADA screens, is enabled for tables.
It is also possible to export this table by clicking "Export" in the "Options" menu of the main
menu. It will be exported in text format, where each line of text is a row of the table and where each
column is separated by the symbol ";".
A common feature in all tables is that they can be sorted by columns by clicking on them. By
default, tables usually appear sorted by date, usually the first column, but they can be ordered by
other variables. By clicking on the title of a column it will be ordered in ascending order, if we click
again on the same place it will be ordered in descending order and a third click will bring it back to its
original format.
A column may also be ordered so that a second column can be ordered depending on the
first. For example, if we have a column that represents a type of group to which each row belongs to
and another which represents a numerical value associated with each row, we can order first by the
column group by clicking on the column title and then, pressing the “CTRL" key, clicking on the title of
the column that represents the magnitude (once for ascending order and twice for descending order).
This will order the table by group, and within each group, by size.
QNA equipment allows a special table to be made called "Events" that lets you view a list of
events recorded by the equipment. This table can only be viewed from the corresponding button on
the monitoring screen of the equipment and does not correspond with any graph view.
281
PowerStudio / PowerStudio Scada
Timetable of QNA events
The table has two columns; the first is the date and time when the incident occurred while the
second is the description of it.
As you can see, this table does not allow the properties of the screen to be changed, nor the
variable period (which would not, on the other hand, make any sense). However it is possible to print it
in same way as other tables.
Special graphs have their equivalent table, and therefore we have table equivalents to
harmonics graphs, waveforms, logged events, duration of events and efficient voltage semi-circle
events.
The table of logged events has the peculiarity that for every event we can visualize a lot of
information:
•
•
•
•
•
Event Type: An icon at the beginning of information indicating whether it is a gap, an
interruption or overvoltage.
Value of the event: This indicates the most representative value of the event. If this is an
overvoltage this value is the highest achieved by the event, in other cases this is the minimum
value reached. It is expressed as a percentage of the nominal voltage.
Duration: The first value in brackets indicates the duration of the event.
Average voltage: Indicates average voltage of the event, expressed as a percentage of the
nominal voltage.
Previous Voltage: Indicates the voltage there was at the beginning of the event, expressed
as a percentage of the voltage.
282
PowerStudio / PowerStudio Scada
Table of historic events
The duration table shows a list where the first column contains the duration of the events in
the interval shown. Apart from the length in itself, it shows the number of events of the interval with
this duration (irrespective of the phase). In each column of each variable a number of events from that
phase is indicated and between brackets the value of the event (if there is more than one event in this
phase with this duration, the minimum and maximum value of the events that have this duration in this
phase are indicated).
Event duration event
283
PowerStudio / PowerStudio Scada
Harmonic tables and waveforms show the same information as the equivalent graph but as a
list, however, the efficient semi-circle voltage table shows more information.
Efficient semi-circle voltage table
As shown in the title of the table the data concerns the event that the screen shot belongs to,
namely the date of the event, the type, the duration, the value, the average voltage of the event and
the previous voltage.
284
PowerStudio / PowerStudio Scada
12.2.10
Displaying logged events
Another important client tool is the possibility creating tables where information about past
events is shown. To access this view we can do it through the menu option "Views" and then "Events"
and finally “Event browser” or directly from the “Events” button on the toolbar. A table of events from a
SCADA screen can be created where the event display control can be added
Table of logged events
This table has two different viewing modes, the normal mode and the total mode. The normal
mode (above) table consists of five columns.
•
•
•
•
•
Date and time: Indicates the date and time at which the incident occurred.
Name: Name of event that occurred.
Annotation: Description of the event that occurred, which may have data relating thereto or
the execution environment at the time it occurred.
Recognized in: Time taken for the event to be acknowledged, whether or not it is finally
acknowledged. Leaving the mouse cursor on the cell a tooltip will appear with the date on
which the event was recognized.
Deactivated on: Time the event took in disabling, if it actually was disabled. Leaving the
mouse cursor on the cell a tooltip will appear with the date on which the event was
deactivated, if the event existed.
As a standard table, the table of active events shows a time interval. You may move through
these intervals or modify them through the toolbar and the first four buttons on the left, as was
discussed in the section on graphs.
As with the tables, the user can print the actual page of the graph at any time using the “Print”
option in the “Options” menu of the main menu or the "Print" button of the upper toolbar.
285
PowerStudio / PowerStudio Scada
It is also possible to export this table by clicking "Export" in the "Options" menu of the main
menu. It will be exported in text format, where each line of text is a row of the table and where each
column is separated by the symbol ";". We can also sort the table by the various columns as desired,
for example, we can sort events by duration, or even by type of event and by the duration of each type
as explained above in the general table properties.
Note that, however, this type of table does not have an available menu of properties that can
be used to configure it. However, the toolbar provides some extra options that will allow us a certain
degree of configuration for this type of table.
Toolbar of the table of logged events
There are a couple of options that allow us to filter the events that we want to see depending
on the group they belong to or according to a specific event.
Filtering events by group
Filtering events by individual event
The latter option will allow us to change the display mode. Thus, we can enable or disable the
total mode.
Change the display mode by enabling or disabling the total view
If you activate the total view we will have a list as follows:
286
PowerStudio / PowerStudio Scada
Table of logged events, total mode
In this way the table consists of five columns, one less than in the previous and as many rows
as events defined in the environment. The first column indicates the name of the event, the second
the number of times it has been enabled in the period to which the data relates (indicated in the title),
the third column indicates how many times this event has been acknowledged (or <not applicable> if
the incident is not notified), the fourth column indicates how many times it has been disabled and the
fifth the total length which the event has been active.
12.2.11
Active and notified events
The powerStudio client enables events that are occurring at the moment to be viewed in real
time, both the simple events that are active as well as those that also need to be recognized by the
user.
The events that do not require user recognition are displayed in a pop-up window that may be
accessed via the menu option "Views", then "Events" and finally "Active events" or directly from the
status bar, clicking on the icon that informs us that there are active events in the system. This window
can be viewed from a SCADA screen where an active event control has been added.
Active event window
287
PowerStudio / PowerStudio Scada
We can see the date on which the event was enabled and the name of it. In addition, below,
we can see the description that we have selected and the annotation scheduled for the same. This
window is purely informative and no action can be carried out here. In addition, it shows both those
events that require recognition by the user as those which do not.
On the other hand, the events that require recognition by the user are displayed in a pop-up
window that always remains visible and are shown automatically without user intervention when there
are events reported active or to be recognised (or both).
The information displayed by this window is very similar to that shown in the active events
window, but in addition to showing the activation date and the name of the event; the date is shown
when it was recognised by the user and the date it was disabled.
Reported events window
Note that an event with an acknowledgement date and a deactivation date will disappear from
the list of events reported, i.e., there will be events on this list without an acknowledgement register,
without a disable date, without both dates but not with both dates.
This window allows event recognition. To do this select from the list the events you want to
recognize and click the button at the bottom "Recognize events." You will see listed the recognition
date for the event. When an event is disabled this will disappear from the list. If an event which has
already been recognized is recognised again the operation will not produce any effect.
288
PowerStudio / PowerStudio Scada
12.2.12
Authentication
If the engine / editor has been enabled for the authentication of users, it is possible that the
client asks us to enter the user name and password to access the various resources available. This
will be done through a screen like this:
User authentication window
The user must correctly identify themselves to access the resource. If the user and password
are unknown we can try a connection as an anonymous user, which provides access to certain
resources provided it has been properly configured on the engine / editor. If the user is not identified
correctly (you will have three attempts) the customer will not be allowed access to the resource.
Access denied to the resource
It is possible that once authenticated, the client will require new identification when trying to
enter an area where they do not have viewing privileges.
In any case, you can always close the current session to force the customer to require user
identification again. This can be done via the option "Logout" from the “General" menu in the main
menu.
289
PowerStudio / PowerStudio Scada
"General Menu”
290
PowerStudio / PowerStudio Scada
13 System Requirements
• Microsoft Windows versions 2000 (Service Pack 3), 2003 Server, XP
Home, XP Professional (Service Pack 1) and Vista for the engine /
editor, all in the 32-bit versions.
• Java Virtual Machine JRE 1.6.0 or later for the client application (local
and Applet)
• PC Pentium III or greater.
• 256 MB RAM Minimum (512 MB Recommended).
• 200 MB free hard drive (depending on the number and type of
equipment connected space should be increased at a rate of
approximately 20 MB per device and year of data we want to save).
• CD-ROM.
• SVGA monitor 1024x768 or bigger.
• Windows compatible mouse and keyboard.
In multi-user systems (Windows NT, 2000 and XP), the software will only work properly if installed as
administrator or user with administrator privileges.
In 64-bit systems software does not support some features, such as the discriminators or events
timetable.
291
PowerStudio / PowerStudio Scada
14 Appendices
14.1 Variables
In order to use references to the variables measured by devices, in Scada, reports, charts and
tables, it will be necessary to know the encoding used by the software for each of them.
The basic encoding comprises the device name and the variable code separated by a dot.
name.variable
In this way the software will know which variable is involved and which device should be
asked for the value of the said variable.
This encoding (variable-name) can be used in formulae, graphs and tables, although in the
case of reports, graphs and tables we can display variables saved in value log files.
On those occasions we wish to discriminate a variable, as long as the variable can be
discriminated, for instance in the case of energy, the discriminator information will be added to the
basic encoding.
name_discriminator @ name_type_time: name.variable
Here the name of the discriminator and the name of the type of hour upon which the variable
values will be discriminated are indicated.
This type of encoding with discriminators may only be used in reports, graphs and tables, and
with variables that have been saved in value log files.
For a better understanding, the variables are displayed in separate tables depending on the
type of variable measured by the devices. The columns on the left correspond to the type of variable
measured: whether the variable is instantaneous, maximum or minimum, the phase to which it
corresponds, or any other information depending on the variable, and finally the code used (for
example the instantaneous phase-neutral voltage of phase 1 will correspond to the code VI1). On the
other hand, the columns to the right of each table will correspond to devices that can measure each of
the variables, indicating with an ‘X’ if the variable will be measured by the device and with an ‘O’ if the
variable will be measured depending on the version of the device.
292
PowerStudio / PowerStudio Scada
14.1.1 Voltage
Instantaneous
L2
L3
L1
CIRWATT
CVM 144
CVM 96
CVM B/BD
CVM BC
CVM K
CVM K2
CVMK HAR
CVM MINI
CVM NRG 96
CVM SP
MK LCD
POWERNET
QNA
VI1
X
X
X
X
X
X
X
X
X
X
X
X
X
O
VI3
X
X
X
X
X
X
X
X
X
X
X
O
X
O
VI
VI12
VI23
VI31
X
X
X
X
X
X
X
X
X
X
X
X
O
X
X
X
X
X
X
X
X
X
X
X
X
X
X
X
X
X
X
X
X
X
O
X
O
VMX1
VMX2
VMX3
X
X
X
X
X
VMX
L1
Minimums
L2
L3
VMN1
VMN2
VMN3
X
X
X
X
X
X
X
X
X
X
X
X
X
X
X
X
X
X
X
X
X
X
X
X
X
X
X
X
X
X
X
X
X
X
X
X
X
X
X
X
L1
Minimum
L2
L3
X
X
III
VI123
X
Phase- phase - voltage
Maximum
L1
L2
L3
III
VMX12
VMX23
VMX31
X
X
X
X
X
VMN23
VMN31
X
X
X
X
X
X
X
X
X
X
X
X
X
X
X
X
X
X
X
X
X
X
X
X
X
X
X
X
X
X
X
X
X
X
X
X
X
X
III
VMN123
X
X
X
X
L1
VPNOMI1
L3
VPNOMI3
X
X
X
Instantaneous
Neutral voltage
Maximum
Minimum
VNMX
VNMN
VNI
X
O
CVM K2
QNA
X
VMN12
VMX123
Nominal voltage
Instantaneous
L2
VPNOMI2
QNA
III
VMN
X
Instantaneous
L2
L3
L1
CIRWATT
CVM 144
CVM 96
CVM B/BD
CVM BC
CVM K
CVM K2
CVMK HAR
CVM MINI
CVM NRG 96
MK LCD
POWERNET
QNA
VI2
X
X
X
X
X
X
X
X
X
X
III
Phase – neutral voltage
Maximum
L1
L2
L3
III
X
Absolute minimum- voltage
QNA
L1
All registers
L2
L3
L1
Valid registers
L2
L3
V1MINT
O
V2MINT
O
V3MINT
O
V1MINV
O
V2MINV
O
V3MINV
O
L1
All registers
L2
L3
L1
Valid registers
L2
L3
V1INFT
O
V2INFT
O
V3INFT
O
V1INFV
O
V2INFV
O
V3INFV
O
L1
All registers
L2
L3
L1
Valid registers
L2
L3
V1HIGPT
O
V2HIGPT
O
V3HIGPT
O
V1HIGV
O
V2HIGV
O
V3HIGV
O
Lower percentile [5%] – voltage
QNA
Higher percentile [95%] –voltage
QNA
293
PowerStudio / PowerStudio Scada
Absolute maximum– Voltage
QNA
L1
All registers
L2
L3
L1
Valid registers
L2
L3
V1MAXT
O
V2MAXT
O
V3MAXT
O
V1MAXV
O
V2MAXV
O
V3MAXV
O
L1
Instantaneous
L2
L3
DVI2
X
X
O
X
O
X
X
X
X
DVI3
X
X
O
X
O
X
X
X
X
X
X
X
X
DVI1
X
X
O
X
O
X
X
X
X
X
X
X
CVM 144
CVM 96
CVM B/BD
CVM BC
CVM K
CVM K2
CVMK HAR
CVM MINI
CVM NRG 96
CVM SP
POWERNET
QNA
Voltage distortion
Maximum
L1
L2
Instantaneous
Minimum
L2
L3
DVMX2
X
X
DVMX3
X
X
DVMN1
X
X
DVMN2
X
X
DVMN3
X
X
X
X
X
X
X
X
X
X
X
X
X
X
X
X
X
X
X
X
X
X
X
X
X
X
X
X
Voltage distortion on neutral
Maximum
Minimum
DVNMX
DVNMN
Voltage distortion – Higher percentile [95%]
All registers
Valid registers
L2
L3
III
L1
L2
L3
DV2SUPT DV3SUPT
DVSUPT
DV1SUPV DV2SUPV DV3SUPV
L1
DV1SUPT
QNA
L1
DVMX1
X
X
DVNI
X
CVM K2
L3
O
O
O
O
O
O
III
DVSUPV
O
O
14.1.2 Current
L1
CIRWATT
CVM 144
CVM 96
CVM B/BD
CVM BC
CVM K
CVM K2
CVMK HAR
CVM MINI
CVM NRG 96
CVM SP
MK LCD
POWERNET
QNA
AI1
X
X
X
X
X
X
X
X
X
X
X
X
X
O
Instantaneous
L2
L3
III
L1
AMX1
AMX2
AMX3
X
X
X
X
Minimum
L2
L3
III
L1
AMX
AMN1
AMN2
AMN3
X
X
X
X
X
X
X
X
X
X
X
X
X
X
X
X
X
X
X
X
X
X
X
X
AI2
X
X
X
X
X
X
X
X
X
X
AI3
X
X
X
X
X
X
X
X
X
X
AI
X
X
X
X
X
X
X
X
X
X
X
X
X
O
X
O
X
X
X
X
X
X
X
X
III
AMN
X
Instantaneous
CVM 144
CVM 96
CVM B/BD
CVM BC
CVM K
CVM K2
CVM MINI
CVM NRG 96
QNA
Current
Maximum
L2
L3
ANI
O
O
O
O
O
X
X
X
O
294
X
X
Neutral current
Maximum
Minimum
ANMX
O
O
ANMN
O
O
O
O
X
X
X
X
X
X
PowerStudio / PowerStudio Scada
CVM 144
L1
CVM 144
CVM 96
CVM B/BD
CVM BC
CVM K
CVM K2
CVMK HAR
CVM MINI
CVM NRG 96
CVM SP
POWERNET
QNA
DVI1
X
X
O
X
O
X
X
X
X
X
X
O
Instantaneous
Leakage current
Maximum
Minimum
AELI
O
AELMX
O
AELMN
O
Instantaneous
L2
L3
L1
Current distortion
Maximum
L2
L3
L1
Minimum
L2
L3
DVI2
X
X
O
X
O
X
X
X
X
DVI3
X
X
O
X
O
X
X
X
X
DVMX1
X
X
DVMX2
X
X
DVMX3
X
X
DVMN1
X
X
DVMN2
X
X
DVMN3
X
X
X
X
X
X
X
X
X
X
X
X
X
X
X
O
X
X
X
X
X
X
X
X
X
O
X
X
X
X
X
X
Instantaneous
CVM K2
Current distortion on neutral
Maximum
Minimum
DANMX
DANMN
Frequency
Maximum
Minimum
HZMX
HZMN
X
X
X
X
X
X
X
X
X
X
X
X
X
X
X
X
DANI
X
14.1.3 Frequency
Instantaneous
CIRWATT
CVM 144
CVM 96
CVM B/BD
CVM BC
CVM K
CVM K2
CVM K HAR
CVM MINI
CVM NRG 96
CVM SP
MK LCD
POWERNET
QNA
HZI
X
X
X
X
X
X
X
X
X
X
X
X
X
X
X
Absolute minimum –Frequency
QNA
All registers
Valid registers
HZMINT
O
HZMINV
O
lower percentile [5%]– Frequency
QNA
All registers
Valid registers
HZINFT
O
HZINFV
O
Upper percentile [95%] – Frequency
QNA
All registers
Valid registers
HZSUPT
O
HZSUPV
O
Absolute maximum – Frequency
QNA
All registers
Valid registers
HZMAXT
O
HZMAXV
O
295
PowerStudio / PowerStudio Scada
14.1.4 Power
L1
CIRWATT
CVM 144
CVM 96
CVM B/BD
CVM BC
CVM K
CVM K2
CVM MINI
CVM NRG 96
CVM SP
POWERNET
QNA
VAI1
X
X
X
X
X
X
X
X
X
X
Instantaneous
L2
L3
III
III
VAMX1
VAMX2
VAMX3
VAMX
VAMN1
VAMN2
VAMN3
VAMN
X
X
X
X
X
X
X
X
X
X
X
X
X
X
X
X
X
X
X
X
X
X
X
X
X
X
X
X
X
X
X
X
X
X
X
X
X
X
X
X
X
X
X
X
X
X
X
X
X
X
X
Apparent power generated
Maximum
L1
L2
L3
III
X
L1
Minimum
L2
L3
III
NVAI3
NVAI
NVAMX1
NVAMX2
NVAMX3
NVAMX
NVAMN1
NVAMN2
NVAMN3
NVAMN
X
X
X
X
X
X
X
X
X
X
X
X
O
X
X
X
X
X
X
X
X
X
X
X
X
X
X
X
X
X
X
X
X
X
X
X
X
L1
Minimum
L2
L3
API1
X
X
X
X
X
X
X
X
X
X
X
X
O
Instantaneous
L2
L3
III
API2
X
X
X
X
X
X
X
X
X
API3
X
X
X
X
X
X
X
X
X
API
X
X
X
X
X
X
X
X
X
X
O
X
O
Instantaneous
L2
L3
Active power Consumed
Maximum
L1
L2
L3
III
III
APMX1
APMX2
APMX3
APMX
APMN1
APMN2
APMN3
APMN
X
X
X
X
X
X
X
X
X
X
X
X
X
X
X
X
X
X
X
X
X
X
X
X
X
X
X
X
X
X
X
X
X
X
X
X
X
X
X
X
X
X
X
X
X
X
X
X
X
X
X
X
X
X
X
X
X
X
X
X
III
Active power generated
Maximum
L1
L2
L3
III
L1
Minimum
L2
L3
III
NAPI1
NAPI2
NAPI3
NAPI
NAPMX1
NAPMX2
NAPMX3
NAPMX
NAPMN1
NAPMN2
NAPMN3
NAPM
N
X
X
X
O
X
X
X
O
X
X
X
O
X
X
X
X
X
X
X
X
X
X
X
X
X
X
X
X
X
X
X
X
X
X
X
X
X
X
X
III
Capacitive power consumed
Maximum
L1
L2
L3
III
L1
Minimum
L2
L3
L1
CIRWATT
CVM 144
CVM 96
CVM B/BD
CVM BC
CVM K
CVM K2
CVM MINI
CVM NRG 96
CVM SP
POWERNET
VAI
X
X
X
X
X
X
X
X
X
Minimum
L2
L3
NVAI2
L1
CVM K2
CVM MINI
CVM NRG 96
QNA
VAI3
X
X
X
X
X
X
X
X
X
L1
NVAI1
L1
CIRWATT
CVM 144
CVM 96
CVM B/BD
CVM BC
CVM K
CVM K2
CVM MINI
CVM NRG 96
CVM SP
MK LCD
POWERNET
QNA
VAI2
X
X
X
X
X
X
X
X
X
III
Apparent power consumed
Maximum
L1
L2
L3
III
X
O
L1
CVM K2
CVM MINI
CVM NRG 96
QNA
Instantaneous
L2
L3
CPI1
X
X
X
X
X
X
X
X
X
X
X
Instantaneous
L2
L3
CPI2
X
X
X
X
X
X
X
X
X
CPI3
X
X
X
X
X
X
X
X
X
CPI
X
X
X
X
X
X
X
X
X
X
X
X
III
CPMX1
CPMX2
CPMX3
CPMX
CPMN1
CPMN2
CPMN3
CPMN
X
X
X
X
X
X
X
X
X
X
X
X
X
X
X
X
X
X
X
X
X
X
X
X
X
X
X
X
X
X
X
X
X
X
X
X
X
X
X
X
X
X
X
X
X
X
X
X
X
X
X
X
X
X
X
X
X
X
296
PowerStudio / PowerStudio Scada
QNA
O
L1
CVM K2
CVM MINI
CVM NRG 96
QNA
Minimum
L2
L3
III
NCPMX1
NCPMX2
NCPMX3
NCPMX
NCPMN1
NCPMN2
NCPMN3
NCPMN
X
X
X
O
X
X
X
O
X
X
X
O
X
X
X
X
X
X
X
X
X
X
X
X
X
X
X
X
X
X
X
X
X
X
X
X
X
X
X
III
Inductive Power consumed
Maximum
L1
L2
L3
III
L1
IPI1
X
X
X
X
X
X
X
X
X
X
X
O
Instantaneous
L2
L3
IPI2
X
X
X
X
X
X
X
X
X
IPI3
X
X
X
X
X
X
X
X
X
IPI
X
X
X
X
X
X
X
X
X
X
O
X
O
X
Instantaneous
L2
L3
III
Minimum
L2
L3
III
IPMX1
IPMX2
IPMX3
IPMX
IPMN1
IPMN2
IPMN3
IPMN
X
X
X
X
X
X
X
X
X
X
X
X
X
X
X
X
X
X
X
X
X
X
X
X
X
X
X
X
X
X
X
X
X
X
X
X
X
X
X
X
X
X
X
X
X
X
X
X
X
X
X
X
X
X
X
X
X
X
Inductive power generated
Maximum
L1
L2
L3
III
L1
Minimum
L2
L3
III
NIPI1
NIPI2
NIPI3
NIPI
NIPMX1
NIPMX2
NIPMX3
NIPMX
NIPMN1
NIPMN2
NIPMN3
NIPMN
X
X
X
O
X
X
X
O
X
X
X
O
X
X
X
X
X
X
X
X
X
X
X
X
X
X
X
X
X
X
X
X
X
X
X
X
X
X
X
III
Power factor consumed
Maximum
L1
L2
L3
III
L1
Minimum
L2
L3
PFI1
X
X
X
X
X
X
X
X
X
X
X
O
Instantaneous
L2
L3
III
PFI2
X
X
X
X
X
X
X
X
X
PFI3
X
X
X
X
X
X
X
X
X
PFI
PFMX1
PFMX2
PFMX3
PFMX
PFMN1
PFMN2
PFMN3
PFMN
X
X
X
X
X
X
X
X
X
X
X
X
X
X
X
X
X
X
X
X
X
X
X
X
X
X
X
X
X
X
X
X
X
X
X
X
X
X
X
X
X
X
X
X
X
X
X
X
O
X
X
X
X
X
X
X
X
X
X
X
X
X
O
X
X
X
X
X
X
X
X
III
Power factor generated
Maximum
L1
L2
L3
III
Instantaneous
L2
L3
L1
Minimum
L2
L3
III
NPFI1
NPFI2
NPFI3
NPFI
NPFMX1
NPFMX2
NPFMX3
NPFMX
NPFMN1
NPFMN2
NPFMN3
NPFMN
X
X
X
O
X
X
X
O
X
X
X
O
X
X
X
X
X
X
X
X
X
X
X
X
X
X
X
X
X
X
X
X
X
X
X
X
X
X
X
III
L1
Minimum
L2
L3
COSM
X
COSMN1
COSMN2
COSMN3
COSMN
X
X
X
X
X
X
L1
CVM K2
CVM MINI
CVM NRG 96
L1
NCPI
L1
CVM K2
CVM MINI
CVM NRG 96
QNA
III
Capacitive power generated
Maximum
L1
L2
L3
III
NCPI3
L1
CIRWATT
CVM 144
CVM 96
CVM B/BD
CVM BC
CVM K
CVM K2
CVM MINI
CVM NRG 96
CVM SP
POWERNET
QNA
Instantaneous
L2
L3
NCPI2
L1
CVM K2
CVM MINI
CVM NRG 96
QNA
O
NCPI1
L1
CIRWATT
CVM 144
CVM 96
CVM B/BD
CVM BC
CVM K
CVM K2
CVM MINI
CVM NRG 96
CVM SP
POWERNET
QNA
O
Instantaneous
L2
L3
III
L1
Cos φ consumed
Maximum
L2
L3
COSI1
COSI2
COSI3
COSI
COSMX1
COSMX2
COSMX3
X
X
X
X
X
X
X
X
X
297
X
X
X
III
PowerStudio / PowerStudio Scada
L1
Instantaneous
L2
L3
III
L1
Cos φ generated
Maximum
L2
L3
III
L1
Minimum
L2
L3
III
NCOSI1
NCOSI2
NCOSI3
NCOSI
NCOSMX1
NCOSMX2
NCOSMX3
NCOSMX
NCOSMN1
NCOSMN2
NCOSMN3
NCOSMN
X
X
X
X
X
X
X
X
X
X
X
X
X
X
X
X
X
X
CVM K2
CVM MINI
CVM NRG 96
14.1.5 Energies
Apparent energy
Consumed
III
VAE
X
X
X
CVM K2
CVM MINI
CVM NRG 96
CIRWATT
CVM 144
CVM 96
CVM B/BD
CVM BC
CVM K
CVM K2
CVM MINI
CVM NRG 96
CVM SP
EDMK
MK D
MK LCD
POWERNET
QNA
CIRWATT
CVM B/BD
CVM K
CVM K2
CVM MINI
CVM NRG 96
EDMK
MK D
QNA
Generated
Tariff y (y:1..9)
VAETy
O
L1
L2
L3
III
AE1
X
AE2
X
AE3
X
AE
X
X
X
X
X
O
X
X
X
X
X
X
X
X
O
L1
L2
L3
III
NAE1
X
NAE2
X
NAE3
X
NAE
X
O
O
X
X
X
O
O
O
III
NVAE
X
X
X
Active energy Consumed
Tariff y
Partial
y:1..3
y:4..9
PAE
AETy
AETy
Tariff y (y:1..9)
NVAETy
O
Contract x (x:1..3)
Tariff y (y:1..9)
Total
AECxTy
X
AECxTOT
X
O
O
O
O
O
X
O
O
Active energy generated
Tariff
Partial
y:1..3
y:4..9
NPAE
NAETy
NAETy
O
O
O
O
O
O
298
O
Contract x (x:1..3)
Tariff y (y:1..9)
Total
NAECxTy
X
NAECxTOT
X
PowerStudio / PowerStudio Scada
III
CE
CIRWATT
CVM 144
CVM 96
CVM B/BD
CVM BC
CVM K
CVM K2
CVM MINI
CVM NRG 96
CVM SP
EDMK
MK D
POWERNET
QNA
X
X
X
X
O
X
X
X
X
X
X
X
O
III
NCE
CIRWATT
CVM B/BD
CVM BC
CVM K
CVM K2
CVM MINI
CVM NRG 96
EDMK
MK D
QNA
X
X
O
X
X
X
O
O
O
III
IE
CIRWATT
CVM 144
CVM 96
CVM B/BD
CVM BC
CVM K
CVM K2
CVM MINI
CVM NRG 96
CVM SP
EDMK
MK D
POWERNET
QNA
X
X
X
X
O
X
X
X
X
X
X
X
O
Tariff
Partial
PCE
Capacitive energy consumed
2nd quadrant (2Q)
y:1..3
y:4..9
CETy
CETy
L1
L2
L3
III
CE2Q1
CE2Q2
CE2Q3
CE2Q
X
X
X
X
Contract x (x:1..3)
Tariff y (y:1..9)
CE2QCxTy
X
Total
CE2QCxTOT
X
O
O
O
O
O
O
O
Tariff
Partial
PNCE
Capacitive energy generated
2nd quadrant (4Q)
y:1..3
y:4..9
NCETy
NCETy
L1
L2
L3
III
CE4Q1
CE4Q2
CE4Q3
CE4Q
X
X
X
X
Contract x (x:1..3)
Tariff y (y:1..9)
CE4QCxTy
X
Total
CE4QCxTOT
X
O
O
O
O
O
O
Inductive energy consumed
st
1 quadrant (1Q)
Tariff
Partial
PIE
O
y:1..3
y:4..9
IETy
IETy
L1
L2
L3
III
IE1Q1
IE1Q2
IE1Q3
IE1Q
X
X
X
X
O
O
O
O
O
O
O
299
Contract x (x:1..3)
Tariff y (y:1..9)
IE1QCxTy
X
Total
IE1QCxTOT
X
PowerStudio / PowerStudio Scada
III
CIRWATT
CVM B/BD
CVM BC
CVM K
CVM K2
CVM MINI
CVM NRG 96
EDMK
MK D
QNA
Tariff
Partial
PNIE
NIE
X
X
O
X
X
X
O
O
O
Inductive energy generated
rd
3 quadrant (3Q)
y:1..3
y:4..9
NIETy
NIETy
L1
L2
L3
III
IE3Q1
IE3Q2
IE3Q3
IE3Q
X
X
X
X
Contract x (x:1..3)
Tariff y (y:1..9)
IE3QCxTy
X
Total
IE3QCxTOT
X
O
O
O
O
O
O
O
All energy variables can be discriminated.
14.1.6 Maximum demand
Maximum demand consumed
Instantaneous
CVM 144
CVM 96
CVM B/BD
CVM BC
CVM K
CVM MINI
CVM NRG 96
CVM SP
POWERNET
L1
MDI1
O
O
L2
MDI2
O
O
L3
MDI3
O
O
III
MDI
O
O
O
O
O
O
O
O
O
O
O
O
O
O
O
O
O
O
O
Maximum
Tariff y (y:1..3)
MDITy
L1
L2
L3
MDMX1
MDMX2
MDMX3
O
O
O
O
O
O
III
MDMX
O
O
O
O
O
O
O
O
O
O
O
O
O
O
O
O
O
O
O
Tariff y (y:1..3)
MDMXTy
O
O
O
O
Maximum demand generated
Instantaneous
CVM NRG 96
L1
NMDI
1
O
L2
NMDI
2
O
L3
NMDI
3
O
Maximum
III
Tariff y (y:1..3)
L1
L2
L3
NMDI
NMDITy
NMDMX1
NMDMX2
NMDMX3
O
O
O
O
III
Tariff y (y:1..3)
NMDMX
NMDMXTy
O
Maximum demand of apparent power
Consumed
Generated
Instantaneous
CVM K2
Maximum
MDVAI
Tariff y
(y:1..9)
MDVAITy
MDVAMX
X
O
X
Instantaneous
Tariff y
(y:1..9)
Maximum
NMDVAI
Tariff y
(y:1..9)
NMDVAITy
NMDVAMX
X
O
X
MDVAMXTy
O
Tariff y
(y:1..9)
NMDVAMXTy
O
Maximum demand of active power
Consumed
Generated
Instantaneous
CVM K2
Maximum
MDAPI
Tariff y
(y:1..9)
MDAPITy
MDAPMX
X
O
X
Instantaneous
Tariff y
(y:1..9)
Maximum
NMDAPI
Tariff y
(y:1..9)
NMDAPITy
NMDAPMX
X
O
X
O
L3
MDAMX3
X
III
MDAMX
X
MDAPMXTy
O
Tariff y
(y:1..9)
NMDAPMXTy
Maximum current demand
Instantaneous
CVM K2
L1
MDAI1
X
L2
MDAI2
X
Maximum
L3
MDAI3
X
III
MDAI
X
L1
MDAMX1
X
L2
MDAMX2
X
Maximum current demand Tariff y (y:1..9)
Instantaneous
CVM K2
L1
MDAI1Ty
O
L2
MDAI2Ty
O
L3
MDAI3Ty
O
Maximum
III
MDAITy
O
L1
MDAMX1Ty
O
All maximum demand variables can be discriminated.
300
L2
MDAMX2Ty
O
L3
MDAMX3Ty
O
III
MDAMXTy
O
PowerStudio / PowerStudio Scada
14.1.7 Harmonics
Voltage harmonics
L1
L2
x:1..15
x:16..50
ARMxV1
x:1..15
x:16..50
ARMxV2
CVM K2
CVM K HAR
CVM MINI
CVM NRG 96
QNA
X
X
X
X
O
X
X
X
X
X
X
X
X
O
O
L3
x:1..15
x:16..50
ARMxV3
X
X
X
X
O
O
Neutral
x:1..15
x:16..50
ARMxVN
X
X
X
X
O
Current harmonics
L1
x:1..15
L2
x:16..31
x:32..50
x:1..15
ARMxA1
CVM 144
CVM 96
CVM K2
CVM K HAR
CVM MINI
CVM NRG 96
QNA
O
O
X
X
X
X
O
L3
x:16..31
x:32..50
x:1..15
ARMxA2
O
X
X
X
X
O
O
O
O
X
X
X
X
O
x:16..31
Neutral
x:32..50
x:1..15
ARMxA3
O
X
X
X
X
O
O
O
O
X
X
X
X
O
x:16..31
x:32..50
ARMxAN
O
X
X
X
X
O
O
X
X
X
L1
ARMyMXCV1 (y:1..50)
Maximum voltage harmonics (3 sec.)
L2
ARMyMXCV2 (y:1..50)
L3
ARMyMXCV3 (y:1..50)
O
O
O
L1
ARMyMXPV1 (y:1..50)
Maximum voltage harmonics (10 mins.)
L2
ARMyMXPV2 (y:1..50)
L3
ARMyMXPV3 (y:1..50)
O
O
O
L1
PST1
Pst
L2
PST2
L3
PST3
O
O
O
O
O
O
QNA
QNA
14.1.8 Pst / Plt
CVM K2
QNA
Pst – Upper percentile [95%]
QNA
L1
PST1SUPT
All registers
L2
PST2SUPT
L3
PST3SUPT
L1
PST1SUPV
Valid registers
L2
PST2SUPV
L3
PST3SUPV
O
O
O
O
O
O
L1
PST1DIx
Pst – Input x (x:1..20)
L2
PST2DIx
L3
PST3DIx
O
O
O
L1
PLT1
Plt
L2
PLT2
L3
PLT3
O
O
O
O
O
O
QNA
CVM K2
QNA
Plt – Upper percentile [95%]
QNA
L1
PLT1SUPT
All registers
L2
PLT2SUPT
L3
PLT3SUPT
L1
PLT1SUPV
Valid registers
L2
PLT2SUPV
L3
PLT3SUPV
O
O
O
O
O
O
301
PowerStudio / PowerStudio Scada
14.1.9 Inputs and outputs
Digital inputs
x:4..18
x:1..4
x:19..24
x:25..50
DIx
CVM 144
CVM K2
CVM R8
LM 24
LM50
TCP50 ALARM
O
O
O
X
X
X
x:1..1
CVM 144
CVM K2
CVM R8
CVM MINI
O
O
O
X
O
O
X
X
X
Instantaneous
x:2..3
x:4..8
AIIx
O
O
O
O
O
x:9..24
x:1..1
O
O
X
X
X
Analogue inputs
Maximum
x:2..3
x:4..8
AIMXx
O
X
X
x:9..24
Minimum
x:2..3
x:4..8
AIMNx
O
x:1..1
O
x:9..24
O
O
X
O
O
O
X
O
O
The analogue input of the CVM-MINI devices will correspond to the temperature variable measured by
this type of device.
CIRWATT
CVM 144
CVM 96
CVM BC
CVM K2
CVM R8
CVM MINI
CVM NRG96
CVM SP
EDMK
MK LCD
QNA
1
DO1
X
O
O
O
O
O
X
X
O
O
X
O
2
DO2
X
O
O
O
O
O
X
3
DO3
X
Digital outputs:
4
DO4
X
O
O
O
x:5..18
x:19..20
DOx
x:21..24
O
O
O
O
O
O
O
O
O
O
O
O
Digital outputs may be forced to 0 (the output will remain open) or to 1 (the output will remain
closed).
14.1.10
Counters
Counter
x:1..24
x:25..50
Cx
CVM K2
LM 24
LM50
O
X
X
X
The values of the counters on the LM50 devices may be forced between 0 and the maximum
value permitted by the device. See the device manual for more details on this maximum value.
All counter variables can be discriminated.
302
PowerStudio / PowerStudio Scada
14.1.11
Special device variables
14.1.11.1 C-14d
Current
Current
distortion
Cos φ
Active
Quadrant
Alarm active
AI
X
DAI
X
COSI
X
QUADRANT
X
ALARM
X
C-14d
Active Quadrant
Energy consumed
Energy consumed. Capacitive system
Energy consumed .Inductive system
Energy generated
Energy generated .Capacitive system
Energy generated .Inductive system
Value
0
1
2
4
5
6
Alarm active
None
Compensation alarm (-CE)
Overcurrent alarm (-AE)
Distortion alarm (-dE)
Setup error alarm
Expansion card communication alarm
Referenced voltage error alarm
Value
0
1
2
3
4
5
6
Alarm digital output
Not enabled
Enabled
Digital output
Alarm
x:1..14
DO0
DOx
X
X
Value
0
1
14.1.11.2 CBS-4
CBS-4
Earth leakage current
Instantaneous
Detected
of the channel
Channel x (x:1..4)
AELIx
AELDx
STx
X
X
X
Channel status:
Not Triggered.
Earth leakage current exceeded
Toroid error
Protection status:
Status
Of the protection
DOx
X
Alarm relay
DO0
X
Value
0
1
2
Not enabled
Enabled
Value
0
1
Pre-alarm relay status
Not enabled
Enabled
Value
0
1
On CBS-4 devices we can reset the x channel forcing the status variable of the RSTx to value
0 or remotely trigger the channel forcing the variable to 1.
303
PowerStudio / PowerStudio Scada
14.1.11.3 CBS-8, CDR-8
CBS-8
CDR-8
Earth leakage current
Instantaneous
Detected
Of the output
Channel x (x:1..8)
AELIx
AELDx
STx
X
X
X
X
X
X
Status
Pre-alarm relay
DOx
X
X
Status of the channel output
Not Triggered.
Earth leakage current exceeded
Output triggered
Output latched
Value
0
1
2
3
Pre-alarm relay status
Not enabled
Enabled
Value
0
1
Pre-alarm relay
DO0
X
X
On CBS-8 and CDR-8 devices we can reset the x channel forcing the status variable of the
(STx) to value 16
We can also remotely trigger the x channel forcing the RFCx variable to 1 to activate remote
triggering or 0 to deactivate it.
14.1.11.4 CIRWATT
The following shows the specific variables of the CIRWATT devices, the shared variables,
such as voltage and current, are included in the corresponding variable table.
Billing closures- absolute energy
Contract x (x:1. ) 1..3)
CIRWATT
Active
AEABSCxTy
X
Tariff y (y:1..9)
Inductive
IEABSCxTy
X
Capacitive
CEABSCxTy
X
Active
AEABSCxTOT
X
Total
Inductive
IEABSCxTOT
X
Capacitive
CEABSCxTOT
X
Total
Inductive
IEINCCxTOT
X
Capacitive
CEINCCxTOT
X
Billing closures– Incremental energy
Contract x (x:1. ) 1..3)
CIRWATT
Active
AEINCCxTy
X
Tariff y (y:1..9)
Inductive
IEINCCxTy
X
Capacitive
CEINCCxTy
X
Active
AEINCCxTOT
X
Billing closures - Power
Contract x (x:1. ) 1..3)
Tariff y (y:1..9)
CIRWATT
Maximum
demand
MDCxTy
X
Total
Power excesses
Power factor
EXCCxTy
X
PFCxTy
X
Maximum
demand
MDCxTOT
X
Power excesses
Power factor
EXCCxTOT
X
FPCxTOT
X
The power factor variable is calculated by the software using active and inductive energy.
Power
Contract x (x:1. ) 1..3) Tariff and (y: 1..9)
CIRWATT
Contracted
CPWCxTy
X
Excesses by register
REXCCxTy
X
Power Excesses are calculated by the software for each curve register downloaded onto
CIRWATT equipment
304
PowerStudio / PowerStudio Scada
14.1.11.5 CVM-K2
The following shows the specific variables of the CVM-K2 devices, the shared variables, such
as voltage and current, are included in the corresponding variable table.
Coefficient Kd
CVM K2
Voltage:
Maximum
KDVMX
Instantaneous:
KDVI
X
Minimum
KDVMN
Instantaneous:
KDAI
X
Current
Maximum
KDAMX
Minimum
KDAMN
Current
Maximum
KAAMX
Minimum
KAAMN
Coefficient Ka
CVM K2
Voltage:
Maximum
KAVMX
Instantaneous:
KAVI
X
Minimum
KAVMN
Instantaneous:
KAAI
X
Instantaneous
TI
Temperature
Maximum
TMX
Minimum
TMN
X
X
X
L1
Instantaneous
L2
L3
L1
Factor K
Maximum
L2
L3
L1
Minimum
L2
L3
KFAI1
KFAI2
KFAI3
KFAMX1
KFAMX2
KFAMX3
KFAMN1
KFAMN2
KFAMN3
X
X
X
X
X
X
X
X
X
L1
Instantaneous
L2
L3
L1
Crest factor
Maximum
L2
L3
L1
Minimum
L2
L3
CFVI1
CFVI2
CFVI3
CFVMX1
CFVMX2
CFVMX3
CFVMN1
CFVMN2
CFVMN3
X
X
X
X
X
X
X
X
X
CVM K2
CVM K2
CVM K2
L1
FWA1
Weighted Flicker
L2
FWA2
L3
FWA3
X
X
X
CVM K2
14.1.11.6 DH-96
DH-96 CPM
Voltage:
Max.
VMX
X
Inst.
VI
X
DH-96 AC
DH-96 CT
DH-96 DC
DH-96 FT
DH-96 SG
DH-96 TMP
DH-96 WG
MIN
VMN
X
Inst.
AI
X
Current
Max.
AMX
X
MIN
AMN
X
Measured
ME
X
Peak
PK
X
Off-peak
VL
X
X
X
X
X
X
X
X
X
X
X
X
X
X
X
X
Inst.
API
X
Active power
Max.
APMX
X
Active
energy
AE
X
MIN
APMN
X
Counter
C1
Flow
F1
X
O
14.1.11.7 MK D
Active tariff
MK D
ACTTARIFF
O
Digital input
DI1
O
Counters
DI2
O
305
C1
O
Digital output
C2
O
DO1
O
DO2
O
PowerStudio / PowerStudio Scada
14.1.11.8 QNA
The following shows the specific variables of the QNA devices, the shared variables, such as
voltage and current, have been included in the corresponding variable table.
QNA
L1
ALEVEI1
X
Power cut
L2
ALEVEI2
X
L3
ALEVEI3
X
Event alarms
Gap
L2
L3
ALEVES2
ALEVES3
X
X
L1
ALEVES1
X
Overvoltage
L2
ALEVEO2
X
L1
ALEVEO1
X
L3
ALEVEO3
X
Alarm event variables will activate (value 1) when an event is produced in the QNA and will remain
active for 5 seconds. When these 5 seconds have elapsed without any new event taking place, the
alarm will deactivate (value 0).
Voltage phasor
L1-L2
FDV12
O
QNA
L1-L3
FDV13
O
Voltage-current phasor
L2
FDVI2
O
L1
FDVI1
O
L3
FDVI3
O
Counter of number of 10 cycle blocks
With EVQ
L2
STCBE2
X
QNA
L1
STCBE1
X
L3
STCBE3
X
L1
STCVB1
X
QNA
Counter of 150 cycle integrations
Of all STD parameters except voltage
L1
L2
L3
L1
STCIS1
STCIS2
STCIS3
STCIV1
X
X
X
X
With voltage off limits
L2
STCVB2
X
L3
STCVB3
X
Voltage
L2
STCIV2
X
L3
STCIV3
X
Coefficient Kd
Coefficient Ka
Voltage:
KDV
O
QNA
Current
KDA
O
Voltage:
KAV
O
Current
KAA
O
Imbalance-percentile higher than 95%
All registers
UBSUPT
O
QNA
QNA
QNA
Total no. of
registers
Registers
without
events
NREGTOT
O
Valid registers
UBSUPV
O
Value counters
Frequency
Frequency
without
events
Plt
NREGEVQ
CVHZ
CVHZEVQ
O
O
O
Plt without events
L1
L2
L3
CVPLT
CVPLT1EVQ
CVPLT2EVQ
CVPLT3EVQ
O
O
O
O
Event log
L2
HEVQ2
X
L1
HEVQ1
X
306
L3
HEVQ3
X
PowerStudio / PowerStudio Scada
14.1.11.9 RGU-10 / RGU-10 RA
RGU-10
RGU-10 RA
Efficient value
Leakage current
Leakage current
trigger
AELI
AELD
X
X
X
X
Status
Pre-alarm trigger
Coil triggering
Latching
DO0
Device
DO1
X
X
ST
X
X
No. of reclosures
Earth leakage
Partial
RCPD
X
RGU-10 RA
Circuit breaker
Total
RCTD
X
Pre-alarm trigger output status
Not enabled
Enabled
Partial
RCPM
X
Value
0
1
Latching output status
Value
0
1
Coil trigger output status
Not Tripped.
Tripped
Value
0
1
Status of the device .
Start
Rest
Earth leakage trigger latching
Earth leakage trigger waiting
Circuit breaking trigger latching
Circuit breaking trigger waiting
Toroid disconnected
External input enabled
Remote trigger
Test trigger
Manufacturing mode
Calibration mode
Value
0
1
2
3
4
5
6
7
8
9
10
11
Not latched
Latched
Total
RCTM
X
To carry out a channel reset on the RGU-10 devices the RST variable must be forced to value
0.
To carry out a remote triggering of the channel the RST variable should be forced to the value
1.
14.1.11.10RRM-C
RRM-C
Reclosure counter
RC
X
No. of selected reclosures
RN
X
Status of the device .
Unknown
Connected
Latched
External trigger
Residual current device trigger
Communication trigger
External and communication trigger
Time between reclosures.
RT
X
Status of the device .
ST
X
Value
65535
0
1
2
4
8
10
On RRM-C devices the status of the devices can be forced to 16 to reset it or 17 for the
external device trigger.
307
PowerStudio / PowerStudio Scada
14.1.12
Graph variables and special tables
Special variables for graphs and tables serve to indicate to PowerStudio that we want to make
a graph or non-standard table. On a non-standard graph or table the values that appear in the X and Y
axis, rows and columns on a table, may switch from one type to another, depending on the variables
represented. For a better understanding of these graphs and tables see the section on the java client.
When you want to make special graphs or tables, such as the waveform or harmonics, it will
be necessary to use the following variables.
Waveform
Voltage:
L2
FOV2
O
L1
FOV1
O
QNA
L3
FOV3
O
Current
L2
FOA2
O
L1
FOA1
O
L3
FOA3
O
Harmonics
Voltage:
CVM 144
CVM 96
CVM K2
CVM K HAR
CVM MINI
CVM NRG 96
QNA
Current
L1
ARMV1
L2
ARMV2
L3
ARMV3
Neutral
ARMVN
X
X
X
X
O
X
X
X
X
O
X
X
X
X
O
X
L1
ARMA1
O
O
X
X
X
X
O
L2
ARMA2
O
O
X
X
X
X
O
L3
ARMA3
O
O
X
X
X
X
O
Neutral
ARMVN
X
L1
ARMMXCV1
Maximum voltage harmonics (3 sec.)
L2
ARMMXCV2
L3
ARMMXCV3
O
O
O
L1
ARMMXPV1
Maximum voltage harmonics (10 mins.)
L2
ARMMXPV2
L3
ARMMXPV3
O
O
O
QNA
QNA
Events
L1
DEVQ1
X
QNA
Duration
L2
DEVQ2
X
L3
DEVQ3
X
L1
VEVQ1
X
effective semi-circle voltage
L2
VEVQ2
X
L3
VEVQ3
X
Billing closures
TCLW
CIRWATT
14.1.13
X
Status of devices
Sometimes it will be necessary to know the status of a device, for example when you want to
activate an event when a device stops communicating. To ascertain the status we use the STATUS
variable.
name. STATUS
The following are the possible values that this status variable may have.
Status of the device.
The device is working properly.
Device not initialised, initial communication with the device has not been established.
The communication port is incorrect or nonexistent.
Communication errors with the device are produced.
The type of device you are trying to communicate with is different to the specified device.
The device communicates correctly, but it detects that some of the phases are badly connected.
The version of the device is incompatible with the software.
The SD Memory Card is invalid, write-protected or not present.
308
Value
1
4
18
34
66
130
258
514
PowerStudio / PowerStudio Scada
14.1.14
Event Variables
The event variables will be coded for use in formulas and expressions such as
R$EVE_variable. name
Using the R$EVE prefix the program will ascertain that this is an event variable rather than a
device variable.
The following is a table with the different variables associated with each event
Identifier
ST
TACT
1
CACT
1
CDIS
1 2
CACK
1
CTIM
1
2
Description
State of the event (0 off, 1: Enabled)
Time the event has been active, the value is 0 when the event is disabled
Counter of the number of activations
Counter of the number of deactivation
Counter of the number of acknowledgments
% Of consultation period time that the incident is enabled
Only if the event is saved on file
Only if the incident is reported
309
PowerStudio / PowerStudio Scada
14.2 Expressions and conditions
Many parts of the program allow the inclusion of terms or conditions. To enter these there is a
standard text control available accompanied by a help button that will guide you through editing them.
Thus, some valid examples would be:
2*(4.56^2)
1-(2.12-4)/2
The following mathematical functions can also be used:
sqrt (exp): Square root of the expression "exp
log (exp): Neperian logarithm of the expression "exp
Exp (exp): Number "e" elevated to the expression "exp
sin (exp): Sine of the expression "exp" (in radiants)
Cos (exp): Cosine of the expression "exp" (in radiants)
tan (exp): Tangent of the expression "exp" (in radiants)
asin (exp): Arcsine of the expression "exp" (in radiants)
Acos (exp): Arccosine of the expression "exp" (in radiants)
atan (exp): Arctangent of the term "exp
atan2 (exp1, exp2): Extended arctangent of the expression “exp1/exp2”
log10(exp): Base 10 logarithm of the expression "exp
round (exp): Rounding off to whole number nearest to the expression "exp
trunc (exp): Truncation to the whole number of the expression "exp
pi() : Returns the number IP (3.1415927…).
e() : Returns the number E (2.7182818…).
mod (exp1, exp2): Return the module "exp2" of the expression "exp1
max (exp1, exp2): Returns the maximum of the two expressions
min (exp1, exp2): Return the minimum of the two expressions
abs(exp): Returns the absolute value of the expression "exp
rand(): Returns a real random value between 0.0 and 1.0
if(cond, exp1, exp2): Evaluates the condition “cond”. If the condition is true it returns
the expression "exp1" if false it returns the expression "exp2
We should remember some details about these functions. The square root function will return
an error if the expression is negative. The logarithmic functions ( "log" and "log10")will return and
error if the expression is less than or equal to zero. The Arctangent function ( “atan”) assesses a
range that goes from -π/2 to π/2 and returns zero if the expression is zero. The extended Arctangent
function ( "atan2") assesses a range that goes from –π to π and returns zero if both expressions are
zero. The Arcsine functions ( "asin"), Arccosine ( "acos"), Arctangent ( "atan") and extended
Arctangent ( "atan2") return the result in radiants. The functions that return the number pi ( "pi") and e
( "e") have no parameters, so they can be used with or without parentheses. The functions are not
case sensitive. Examples of valid formulas are:
2*pi()-sqrt(10)
round(exp(2)+atan2(1,2)-e*pi)
It is also possible to use certain time functions:
second() : Returns the second of the current date.
minute() : Returns the minute of the current date.
hour() : Returns the hour of the current date.
day() : Returns the day of the current date.
month (): Returns the month of the current date.
Year (): Return the year of the current date.
310
PowerStudio / PowerStudio Scada
These functions return values on the date in the local time of the engine and server (editor).
As they do not contain parameters they can be used with or without brackets. The "second" returns a
value between 0 and 59, like the "minute" function. The "hour" function returns a value between 0
and 23. The "day" functions returns a value between 1 and 31. The "month" function returns a value
between 1 and 12.
The following time functions are available only in reports.
secondsinperiod (): Returns the number of seconds in the current period of the report
minutesinperiod (): Returns the number of minutes in the current period of the report
hoursinperiod (): Returns the number of hours in the current period of the report
daysinperiod (): Returns the number of days in the current period of the report
beginsecond (): Returns the initial second in the actual period of the current report
beginminute (): Returns the initial minute in the current period of the report
beginhour (): Returns the initial hour in the current period of the report
beginday (): Returns the initial day in the actual period of the report
beginmonth (): Returns the initial month in the current period of the report
beginyear (): Returns the initial year in the current period of the report
endsecond (): Returns the final second in the current period of the report
endminute (): Returns the final minute in the current period of the report
endhour (): Returns the final hour in the current period of the report
endday (): Returns the final day in the current period of the report
endmonth (): Returns the final month in the current period of the report
endyear (): Returns the final year in the current period of the report
Both for the expressions and the conditions reference can be made to device variables added
to the system. To make reference to one of these variables its name must be entered between the
square brackets ( "[" and "]"). The name of a device consists of two parts separated by a period (".")
the left side is the name of the device and the right part is the variable code of the device (to consult
variable codes allowed consult the corresponding appendix for each device). Some examples are:
2*[CVM144.VI1]
[CVM K 1.AE]+[CVM K 2.AE]+[CVM K 3.AE]
In some parts of the program it is possible to apply a discriminator to the variable that is, to
see the value of said discriminated variable in accordance with a calendar. This is possible, for
example, in reports or graphs and only in some specific variables, such energy variables.
In order to refer to the discrimination of a variable we should indicate to the left of the variable,
the name of discriminator plus the extension. XDCT "followed by" @ "and the type of hour we want to
access. For example, if we have defined a discriminator with the name "Tariff" that contains two types
of hours "H1 and H2," we can refer to both as follows:
[Tarifa.XDCT@H1:CVMK.AE]
[Tarifa.XDCT@H2:CVMK.AE]
It should be emphasized that after the name of the tariff we should always find the ". XDCT,"
extensions followed by "@", the name of the type of hour and the symbol ":". Remember that not all
variables of the devices can be discriminated against; see the variables code appendix for details on
which variables of each device can be discriminated.
In some parts of the programme, such as in the reports and the SCADA screens, we can also
refer to variables previously defined in the formula list. Both in the reports and in the SCADA screens
we have a list of expressions each identified by a text that, can be used in controlling formulas or in
the conditional control. So, if we have defined an expression and we have given the identifier "F1", we
can use it in other expressions:
F1*2.0-1.3
1-sqrt (F1)
311
PowerStudio / PowerStudio Scada
It should be emphasized that the identifier of an expression (name of the variable) can not
start with a numerical digit, although they may be contained in it.
Finally, in those places where a condition is required, it will be possible to use the operators
less than ("<"), greater than (">"), less than or equal to ("<="), greater than or equal to ( ">="), equal to
("=="), different to ("!="), logical "Y" ("&&"), logical "O" ("||") and logical "NO" ( "!").
Remember that the comparison operators require the terms to the left and right be of the
numerical kind while the logical operators require expressions to be conditions. Thus, examples of
correct conditions would include:
[CVMK.VI1]>(240-F1)
(F1!=10 && [CVMK.VI3]<=20)
Expressions and variables are always of the numerical type (real) while the conditions are the
Boolean type.
14.2.1 Wizard for the Creation of Expressions and Conditions
PowerStudio has an assistant, or wizard, for creating conditions and expressions. This wizard
can be accessed by Clicking the
button, which is next to the text controls where we can manually
enter the terms and conditions.
Clicking on this button will bring up the following window:
Here we can select what we wish to add to the expression. The option will be added in the
position of the cursor in the text control associated to the expression. The lower part of the dialogue
shows where we will enter what we want to add:
•
•
•
•
[Vx]. If we want to add a reference to a variable of a unit
Fx. If we want to add a reference to another already defined formula
F (x). If we want to add one of the functions provided
x. If we want to add other symbols.
The wizard options are as follows:
o
Add a reference to a variable of a device: Selecting this option will display a window
where we can choose the device from which one of its variables will be added to the
formula.
312
PowerStudio / PowerStudio Scada
Likewise, we will have the option of specifying a previously defined specific
discriminator (see chapter 7) by way of the selection using the control:
Once we have chosen the unit and the discriminator (where appropriate) the variables
selection window will be displayed allowing us to pick the variable to be entered in the
formula (see 4 Selection of variables).
o
Add a reference to an already defined formula: This option enables us to enter a
reference to another previously defined formula. This option is only available in
reports and SCADA screens. Selecting this option will display a window where a
previously defined formula can be selected:
o
Add one of the functions provided: This option allows us to access a list of typical
mathematical functions which can be entered into the formula being edited:
313
PowerStudio / PowerStudio Scada
o
Add other symbols: this option allows us to enter symbols such as comparators,
logical functions, basic symbols, specific mathematical numbers, and so on.
Depending on whether what we are creating corresponds to an expression or a
condition, some of these symbols will be disabled and therefore may not be selected.
314
PowerStudio / PowerStudio Scada
14.3 XML Services
PowerStudio provides a range of XML services to enable, in some respects, communication
with other applications.
In petitions where it is necessary to express a date and time, both in service petitions and the
data from the response, these will be represented in UTC (Universal Coordinated Time) with the
format DDMMAAAAHHMMSS (two digits for the day, two for the month, four for the year and two for
the hour, minutes and seconds. It will also be possible represent only a date as DDMMAAAA
assuming that the time is 00:00:00, or represent an hour as HHMMSS. Finally in cases where
milliseconds are required these are represented with three digits after the seconds,
DDMMAAAAHHMMSSUUU or HHMMSSUUU.
The petitions must follow the URI standard (RFC 2396) so that the user of these petitions has to take
into account this detail when making such calls (especially in cases where the name of any device
contains non-ASCII characters).
14.3.1 / services / user / devices.xml
Returns the list of configured devices.
<devices>
<id> … </id>
…
</devices>
Where:
•
•
•
devices: Main field which will identify the main XML as a response to the device list
request.
id: Name of each one of the devices.
14.3.2 /services/user/deviceInfo.xml?id=device?...
Returns information on devices. Each of the devices on which information is required must be
included in the petition as:
?id = device2? id = device2
<devices>
<device>
<id> … </id>
<description>… </ description>
<type>… </ type>
<typeDescription>… </ typeDescription>
<var>… </ var>
…
</device>
…
</devices>
Where:
•
•
devices: Main Field which identified the XML as a response to the information
request from the devices.
device: Information from each of the devices requested:
id: Name of the device.
description: Description of device
type: Type of device (for example CVM144)
typeDescription: A description of the type of device (for example: CVM-144)
var: Name of each of the variables of the device. The name is expressed as
device.variable (see 14.1 Variables)
315
PowerStudio / PowerStudio Scada
14.3.3 / services / user / varInfo.xml? var = device.variable ?...? id = device? ...
Returns variable information when carrying out the XML request. Each of the variables that
the value is required from should be included in the petition as:
?var = device.variable
And if you want to get information from all the variables of a device this must be indicated as
?id=device
With it being possible to request information from one or more variables and one or more
devices in the same request.
<varInfo>
<var>
<id> … </id>
<title>… </ title>
<hasValue> T </ hasValue>
<hasLogger> T </ hasLogger>
<sampleMode>… </ sampleMode>
<measureUnits>… </ measureUnits>
<unitsFactor>… </ unitsFactor>
<decimals>… </ decimals>
</ var>
…
<varInfo>
Where:
•
•
varInfo: Main field which identifies the XML as a response to the request for
information about variables
var: Information from each of the variables requested:
id: Variable name in device.variable format (see 14.1 Variables)
title: Brief description of the variable.
hasValue: Indicates if it is possible to ask the instantaneous value of the
variable (T) or not (F).
hasLogger: Indicates whether it is possible to ask the log value of the
variable (T) or not (F).
sampleMode: Variable type, mode used to group together the values of a
variable:
♦ none: Without type
♦ average: Average value:
♦ max: Maximum value.
♦ min: Maximum value.
♦ pfAverage: Power factor, average value
♦ pfMax: Power factor, maximum value
♦ pfMin: Power factor, minimum value
♦ last: Last value:
♦ earth leakage: Earth leakage value between the current value and
the previous one.
♦ samples: samples. The value can not be grouped
♦ discrete: Discreet values. The value can not be grouped
measureUnits: Variable units:
♦ #NONE Æ without units
♦ #V Æ Voltage
♦ #A Æ Current
♦ #VA Æ Apparent power
♦ #W Æ Active power
♦ #VARL Æ Inductive power
♦ #VARC Æ Capacitive power
♦ #PF Æ Power factor
316
PowerStudio / PowerStudio Scada
♦ #HZ Æ Frequency
♦ #PERCENT Æ Percentage
♦ #WH Æ Active energy
♦ #VARLH Æ Inductive energy
♦ #VARCH Æ Capacitive energy
♦ #DATETIME Æ Date and time
♦ If not preceded by an # this is a unit defined by the user
unitsFactor: Power of 10 that indicates the value the variable is multiplied by
in the log file.
decimals: Decimals with this variable.
14.3.4 / services / user / values.xml? var = device.variable ?...? id = device? ...
Returns the instantaneous value of the variable when the XML request is carried out. Each of
the variables that the value is required from should be included in the petition as:
?var = device.variable
If you want to ascertain the value of all the variables of a device it should be indicated as:
?id=device
With it being possible in a single request to request the value of one or more variables and
values of one or more devices
<values>
<variable>
<id> … </id>
<value>… </ value>
</ variable>
…
</values>
Where:
•
•
Values: Main field which will identify the XML as a response to the request for
variable values
variable: List of variables:
id: Identifier of the variable in the format device.variable (see 14.1 Variables)
value: Value of variable at the time of the request.
317
PowerStudio / PowerStudio Scada
14.3.5 / services / user / forceVariables.xml? id = device
With this petition we may send the order to force variables to PowerStudio. The request must
include the name of the device we want to force so that, if necessary, authentication can be checked
(see 2.2.12.2 User identification). Only the variables belonging to the device indicated in the petition
will be forced.
<forceVariables>
<forceVar>
<forceName>… </ forceName>
<forceValue>… </ forceValue>
</ forceVar>
…
</forceVariables>
Where:
•
•
forceVariables: Main field that will identify the XML as a petition to force variables.
forceVar: Information on each of the variables to be forced:
forceName: Name of variable with format device.variable (14.1 Variables).
Only variables that can be forced , for example digital output variables.
forceValue: Value to which we wish to force the variable.
14.3.6 / services / user / records.xml? begin =…? end =…? var =…? period =
900
Returns information on one or more variables between the dates “begin” and “end”. Each of
the variables for which information is to be obtained must be included in the request as:
?var = device.variable
The format of ”begin” and ”end” will be DDMMAAAA when you wish only to indicate the date
(in this case the hour will 00:00:00) or DDMMAAAAHHMMSS when both the date and the hour are
specified. Both "begin" as "end" must be expressed in UTC (Universal Coordinated Time).
Finally, we may specify the period of data grouping using the “period” parameter. This value may be:
FILE Æ data not grouped, returning the register as they have saved in the log.
AUTO ÆGrouping will take place automatically depending on the specified dates ”begin” and
"end"
ALL ÆData is grouped into a single value
> 0 ÆValue in seconds in which the data is grouped.
If the “period” parameter does not appear on the petition it shall be considered as value 0 and the data
will not be grouped.
<recordGroup>
<period>… </ period>
<record>
<dateTime>… </ datetime>
<field>… </ field>
<fieldComplex>… </ fieldComplex>
<fieldARM>… </ fieldARM>
<fieldFO> … </fieldFO>
<fieldEVQ>… </ fieldEVQ>
…
</record>
…
</recordGroup>
318
PowerStudio / PowerStudio Scada
Where:
•
•
•
recordGroup: Main field which will identify the XML as a response to the variable
register request.
period: Register period. Will report on time elapsed between records.
record: Will Identify each of the records:
dateTime: Date and time of the sample.
field: Standard value register.
fieldComplex: Complex value register
fieldARM: Harmonic value register
fieldFO: Waveform value register
fieldEVQ: EVQ event register
Here are the different types of values that can be returned by this request:
•
Standard value registers (voltages, currents, power, energy, etc.).
<field>
<id> … </id>
<value>… </ value>
</ Field>
•
id: Variable identifier (device.variable)
value: Value
Complex value register (PLT, etc.).
<fieldComplex>
<id> … </id>
<value>… </ value>
<flags>… </ flags>
</ fieldComplex>
•
id: Variable identifier (device.variable)
value: Value
Flags: Additional information from the variable formed by the union of one or
more of the following values
♦ 0x0000 Æ The PLT is correct
♦ 0x0001 ÆThe PLT calculation has been done with fewer samples
than expected
♦ 0x0002 Æ The PLT calculation has been done with more samples
than expected
♦ 0x0004 ÆThe samples used in the PLT calculation do not have an
equidistant separation in the sampling window
♦ 0x0008 ÆSome PST used in the calculation of the PLT contain
events in phase 1
♦ 0x0010 ÆSome PST used in the calculation of the PLT contain
events in phase 2
♦ 0x0020 Æ Some PST used in the calculation of the PLT contain
events in phase 3
♦ 0x0040 Æ Some PST used in the calculation of the PLT are not
complete
Harmonic value record
<fieldARM>
<id> … </id>
<element>
<harmonic>… </ harmonic>
<value>… </ value>
</ element>
…
</fieldARM>
319
PowerStudio / PowerStudio Scada
•
id: Variable identifier (device.variable)
Element: Registers from each of the harmonics
♦ harmonic: Harmonics number
♦ value: Harmonic value.
Waveform value record
<fieldFO>
<id> … </id>
<element>
<msec>… </ msec>
<value>… </ value>
</ element>
…
</fieldFO>
•
id: Variable identifier (device.variable)
Element: Information from each of the points that make up the waveform
♦ msec: millisecond
♦ value: value
EVQ event Record.
<fieldEVQ>
<id> … </id>
<value>… </ value>
<phase>… </ phase>
<duration>… </ duration>
<averageValue>… </ averageValue>
<previousValue>… </ previousValue>
<eventType>… </ eventType>
<endForced>… </ endForced>
<semicycleVoltage>
<date>… </ date>
<value>… </ value>
</ semicycleVoltage>
…
</fieldEVQ>
id: Variable identifier (device.variable)
value: Value of the event:
Phase: Phase in which the event occurs
duration: Duration of the event in milliseconds
averageValue: Average value:
previousValue: Old value
eventType: Type of event
♦ 0 ÆInterruption
♦ 1 Ægap
♦ 3 ÆOvervoltage
endForced: Mark if the event has finished correctly (F) or has be forced to
finalise (T)
semicycleVoltage: Each of the points that make up the semi-circular
effective voltage associated with the event. This field is optional and may not
exist.
♦ date: Date and time (DDMMAAAAHHMMSSUUU)
♦ value: Value
320
PowerStudio / PowerStudio Scada
14.4 F.A.Q
14.4.1 None of the equipment communicates. What is happening?
Make sure your computer is switched on and in a mode which can communicate, ensuring
particularly that it is not in the set up or starting up mode. Make sure your computer is connected to a
PC or a compatible converter and that the wiring is correct. Make sure there is no possibility of any
interference in the cable run from the device to the PC or between the device and the converter. If you
are connected to a converter, check that the latter is properly connected to the PC. Verify that the grid
is not overloaded with an excessive amount of devices. If your computer is connected by way of a
232-485 converter make sure that the switches are in the correct position. Make sure that the
equipment bus does not have devices that communicate at different speeds or have the same device
number. Check that the PC port is working properly.
14.4.2 A TCP2RS converter does not communicate. What is happening?
Make sure your computer is switched on and connected to the communications network.
Make sure there is no possibility of any interference in the cable run from the converter to the PC.
Make sure your PC is correctly connected to the communications network and can communicate with
other equipment connected to the network (for example with another PC). If you are using a router,
make sure the communication port is redirected in the router, to the converter address.
14.4.3 I can not see the applet. What is happening?
Check that the local computer has the Microsoft Internet Explorer, Netscape (Mozilla) or
Firefox browser installed. Ensure that the Java Virtual Machine JRE 1.6 (6.0) or later is installed. If
they are not installed the browser will provide information and guide us through the installation
process.
If the applet appears but shows a message warning that it is "unable to communicate with the
server" or "unable to retrieve the required information" make sure the program is in running mode and
the Web server is enabled.
14.4.4 The Applet does not display the texts properly. What is happening?
It is possible that some fonts applied to the controls when designing a report or a SCADA
screen do not exist on the machine on which the applet is downloaded and, in consequence, the font
chosen may be markedly different to the original.
14.4.5 The values display is not what I expected. What is happening?
It is possible that a conditional control or a formula refers to a variable of a device which does
not communicate or that has not yet been interrogated for the first time. In a SCADA screen, if we are
dealing with a condition nothing will appear and if we are dealing with a formula a dash ("-") appears
until the value can start. In a report, if there is no data in this period and we cannot assess the
condition of a conditional control, nothing will be displayed and if we can not assess the definition the
same will occur.
It may occur that when assessing the formula we come across an invalid operation, such as
the square root of a negative number or a zero division, in this case a question mark ("?") appears on
the SCADA screen and the report will show the definition of the formula. If we are unable to assess
the condition of a conditional, nothing will be displayed.
It may not be possible to represent the assessment of the formula of an expression, either
because the control configuration that contains it, or because the assessment returned an out of range
value. In this case the following character will appear “#”
321
PowerStudio / PowerStudio Scada
14.4.6 An event is not behaving as I expected. What is happening?
When an event does not occur when you think it should, or vice versa, check that this
condition can be fulfilled and make sure the event is enabled at some time by the calendar and that
the condition can be fulfilled during that interval. Verify that the devices involved in assessing the
condition of the event communicate and make sure the program is in the run mode. Make sure you
have permission to see this type of event and you have checked the notify and / or register box.
If the incident appears not to have carried out actions that have been defined, check what has
actually occurred in the list of events. If the event has still not produced the programmed action or
actions, check that the equipment upon which it should have acted is on and communicating correctly.
Should the action involve the running of an external application, check that the said application is
properly installed and that the command and parameters are correct (you can put this action in a run
control in a SCADA screen test to see if it behaves as expected)
14.4.7 I can’t paint the graph correctly. What is happening?
If the graph appears to have dots missing, verify that this is not because the variables are
being represented with different periods.
If the bar charts has widths that are not correct, ensure that the values are separated by the
distance marked by the driver period. For example, if a device saves data every 5 minutes and we
change the period to 15 minutes, the bars will be superimposed when displaying the bar graphs for
the values prior to the change of period (every 5 minutes). If we change the period to a lower value,
the bars prior to the change will appear narrower than necessary. In any case, the bar graphs of
values separated by the distance shown in the Driver registration period will always appear correctly.
If you do not see any values when you think there should be, ensure that you have not
zoomed in an area without values or that the Y-axis is not forcing levels for values which do not exist.
14.4.8 The Paint Pot is not working correctly. What is happening?
If when placing the paint pot control on a SCADA screen, this does not behave in the manner
expected ensure that:
1 .- The condition or conditions defined are right for each colour.
2 .- The area in which the control is positioned has a uniform colour. It is possible that the area
where the paint pot is positioned has different coloured dots but with very similar tones, which at first
sight appear the same. The paint pot control only spreads through identical colours.
3. - The area to be filled with the colours defined in control is not part of another control. The
paint pot control only interacts with the screen background and does not take into account any of the
other controls. Do not attempt to use the paint pot to fill, for example, an image by way of the image
type control.
322
PowerStudio / PowerStudio Scada
14.4.9 Can I launch external applications from applet?
For security reasons, Java Applets have some fairly significant limitations with regards
accessing the resources of the local machine on which they are running. One of these restrictions is
being able to run applications on the local machine. Nevertheless, this restriction may be disabled by
adding the following line to the java.policy permissions file situated in the installation of the JRE virtual
machine:
permission java.io.FilePermission "<<ALL FILES>>", "execute";
It must be noted, however, that the Applet can not directly display files directly from the run
control, in the way SCADA can. So, if we wanted to show an image in applet it is not enough to enter
the name of the image in the run control, but rather we should enter the application we want to use to
show the image and, as a parameter, the image to show.
Note: The option to launch external applications very much depends on the system in which
applet is running, and it is highly probable that it will only work in the system for which the application
has been developed.
14.4.10
How can I see the applet from a machine which is not running
Windows?
The applet can be viewed without carrying out any other special action from all operating
systems that have Java Virtual Machine 1.5 (5.0) or later and an HTML browser. Among others, the
following operating systems would satisfy these requirements: Windows, Linux, Solaris SPARC,
Solaris x86, Solaris AMD64, Linux AMD64, and so on.
14.4.11
How can I draw a line in a report or a SCADA screen ?
Although there is a specific tool to draw lines, it is possible to carry out this function in two
different ways:
1 .- Draw lines you want in the background image beforehand.
2 .- If you want to draw vertical and / or horizontal lines and it is not practical to use the
method above, it is possible to carry out this function by way of a simple trick. The procedure involves
obtaining a solid rectangle or square image of the colour you like for the line (this may even consist of
a simple pixel image). Then add an image control and assign the previous box to it. Disable the fields
of "Maintain real size" and "Maintain aspect ratio" and use the control to obtain the desired horizontal
line and / or vertical thickness desired.
3 .- Add a text control and write the text "________" (underscore characters and as
long as needed) This creates a horizontal line. This method has the advantage that it allows
vertical or diagonal lines to be applied by text rotation (90 or 270 degrees for vertical lines), colour
change and it also allows the thickness to be changed by modifying the size.
Diagonal Line
323
PowerStudio / PowerStudio Scada
14.4.12
I am making my first screen or report and I cannot add a
background image or a still picture. What is happening?
You should remember that the images that can be included on the SCADA screens and the
reports must have been added previously through the image manager. Therefore it is necessary
before starting to design a screen or report to add the images you will need through the image
manager.
14.4.13
What can be "counted"?
Any event added to the system contains a variable that indicates how many times it has been
enabled, how many times it has been recognized, how many times it has been deactivated, how long
has it been active, if it active at the moment and how long has elapsed since it was last enabled.
The number of times something has occurred during the hour in course, the day in course,
and so on, can also be counted To do so create a calculable forcible variable initialized to 0 and an
event that when a condition is complied will undertake the action of forcing this variable to the same
value plus a unit.
[R$CAL_FORCED.COUNTER1]=[R$CAL_FORCED.COUNTER1]+1
We then just need to add an event that would reset this counter to 0 when the date was
outside XX / XX / XX 00:00:00 (00:00:00 hours each day) with which the counter would have the
number activations of the day in course. The counter reset could be carried out with a variable forced
control on the SCADA screen, in this case manual instead of automatic.
14.4.14
I would like to export the report data in order to process it later.
How can I do it?
The data displayed in a report is log data grouped together for the period of the report,
therefore we have a value per period (if it is an expression where several variables are involved the
value of each variable is recovered for the period of the report and the expression assessed).
For practical purposes, the values of the variables that are used in the reports can be
consulted by petitioning / services / user / records.xml (which is documented in the XML user
requests section).
Imagine then we have a report with the following aspects:
324
PowerStudio / PowerStudio Scada
Report generated
The report is grouped by day, in particular, we are viewing October 12th. It shows that there
are a number of values in red, inside boxes, the first value on the top left corner corresponds to the
variable CVM 2.VI1 K ".
To see that value through a HTTP / XML petition to the server we can do the following:
http://192.168.5.52/services/user/records.xml?begin=10062008220000?end=11062008220000?p
eriod=ALL?var=CVM K 2.VI1
This request, if carried out with the browser, will return something similar to the following:
325
PowerStudio / PowerStudio Scada
Result of the request from the Internet Explorer browser
Where, in the "value" field we have the desired value. This request can be done directly from,
say, the Excel spreadsheet, by simply writing this request in the dialogue "Open" (instead of the name
of a file). Excel will interpret the previous XML and generate a table with data:
"Open" petition with Excel 2003. In D1 we have the data.
14.4.15
I tried to make a table with the client application and I get the
Message "Table too Big." What can I do to see it?
The client is a Java application. As a Java application it runs on a virtual machine with a
limited memory for it to run assigned by default. Normally this amount of memory allocated by default
is sufficient for running the programme. But perhaps for very large tables this memory is insufficient.
For these cases it is possible to run the client application forcing the virtual machine to assign
more memory to the program. This is accomplished by running the program from the command line
with a parameter indicating the maximum and minimum memory available for the program.
java -Xm256m -Xmx1024m –jar AppletScada.jar
As you can see the parameters Xm-and-Xmx allocate a minimum and a maximum quantity to
the program.
326
PowerStudio / PowerStudio Scada
14.4.16
How can I simulate a control switch?
To simulate the behaviour of a switch (e.g. to act on a digital output) we need a conditional
control and two controls to force the variable. The control conditional would contain two images, one
with the representation of a switch open, with the condition that the digital variable is 1, and another
with the representation of a closed switch, with the condition that the digital variable is 0.
A control is positioned on the left part of the control to force a variable with a digital output
value at 1, whilst another control is positioned on the right-hand section to force a variable with the
output value at 0.
14.4.17
How do I add animation on the SCADA?
To add a small animated image the conditional control combined with the "second" function in
the condition is added. First, save the images that make up the animation using the image manager.
Suppose your animation consists of a sequence of 3 images. Assume further that we want our
animation to change every second. Therefore we will have to create a list of formulae on the SCADA
screen which will return module 3 of the "second" function (which will vary between the values, 0, 1
and 2). The function is as follows:
mod(second,3)
Suppose we call this function MOD. Now we can define a conditional control with 3 conditions,
where each condition displays one of the images that form the animation. The following shows control
properties:
The result is that one of the images that make up the animation is shown every second. As
can be seen, there are many combinations to be carried out and a large variety of opportunities to
exploit using this technique.
327
PowerStudio / PowerStudio Scada
14.4.18
How can I simulate a level control?
There are two ways to do a level control on a SCADA screen. The first one is to use a
conditional control, where each control is an image with a different level and where every condition
indicates what should be fulfilled to reach this level. Here are some images showing us specific
examples with its conditions:
[CVM K 1.VI1] == 215
[CVM K 1.VI1] == 221
[CVM K 1.VI1] == 224
Another option would be to draw the level control at the bottom of the SCADA screen and use
various paint pot controls to paint the desired zone. Thus, we could draw on the screen background
something like the following:
The inner part, although it seems all the same colour (white), it is not and is divided into grids
with different whites indistinguishable one from the other and by the human eye (for example, it is
impossible to distinguish between white RGB 255,255,255 and white RGB 254,255,255) .
Then we place the paint pot on each table with the desired condition and tolerance 0 to
prevent painting adjacent tables, which are very similar in colour.
With this, the result is a progress bar (or control level) which can be configured as desired.
14.4.19
How can I change the properties of control in accordance with a
condition?
The properties of control cannot be changed in accordance with a condition. However, we can
simulate the change of these properties, using a conditional control. Thus, for example, if we wish to
change the colour of a text in accordance with a condition we add a conditional control with two text
type controls which are exactly the same but of a different colour, and specify which conditions need
to be fulfilled for each one to be shown. Likewise, we can also change the orientation, font, size, etc.
We can also make a control be an image or a text in accordance with a condition using, as in
the previous case, the conditional control.
328
PowerStudio / PowerStudio Scada
14.4.20
How can I know the status of a device?
All devices have a variable called STATUS that shows the status of the device using a
numerical value (for example, [CVM144.STATUS]). The meaning of this variable is the same for all
devices and can be used in the conditional expressions (see the appendix to check the types of
variables and their possible values)
14.4.21
How can I display documents from a SCADA screen?
To show documents previously stored on the PC the run control can be used. If we wish to
show a PDF file, we can enter its name directly (including the complete path) in the program field, so
that the said file will open in the related, defined programme when running the screen and clicking on
the control. Likewise, we can do this with any file type which has an associated programme to open it.
(DOC, TXT, HTML, WAV, MP3, MPG, AVI, etc.)
Note: This option will not work on systems which do not run Windows, nor when using the
applet.
14.4.22
How can I obtain an event according to the status of a device?
To produce an event according to the status of one or more devices using the STATUS
variable of the said devices in the event activation status. The possible values of the STATUS variable
can be seen in the variable type appendix.
Since the events generate a number of variables associated to them, we can even see how
many times an event was enabled, how many times it was deactivated, how many it was recognized
and how long it was enabled.
14.4.23
How can I produce sounds in response to an event?
To produce a sound in response to an event, we should add an action to run an external
program and enter the corresponding (WAV, MP3, etc.) with its full path in the programme field. For
the action to take effect, you will need to have a program installed that can play back this type of file
(for example, Windows Media Player, Sonique, Winamp, etc.).
If what is needed is simply reproducing a bleep on the client application, an action associated
with this event can be added to carry it out. Likewise this action can occur during activation,
recognition, on deactivation or while active.
Support for the audible alarm action on the client in response to an event
329
PowerStudio / PowerStudio Scada
14.4.24
How do I show documents in response to an event?
In a similar manner to the previous point, adding an action to run an external program and
entering the file to be shown (PDF, TXT, DOC, etc.) and its corresponding path. For the action to take
effect, you will need to have a program installed that can read this type of file (for example, Microsoft
Word, Adobe Acrobat Reader, etc.).
14.4.25
How can I communicate with a TCP2RS converter by way of a
router?
To communicate with a TCP2RS converter located in a sub-network different to the network in
which the software is located, we can use a router as shown in the following image
The TCP2RS converter should be added as follows
1- Enter the router address (192.168.120.201)–In the “Converter Address” field.
2- Redirect the port‘10001 ’and‘30718’ in the router to the converter address (192.168.15.205)
(see router manual)
330